Abstract
Accurate segmentation of retinal blood vessels is a key step in the diagnosis of fundus diseases, among which cataracts, glaucoma, and diabetic retinopathy (DR) are the main diseases that cause blindness. Most segmentation methods based on deep convolutional neural networks can effectively extract features. However, convolution and pooling operations also filter out some useful information, and the final segmented retinal vessels have problems such as low classification accuracy. In this paper, we propose a multi-scale residual attention network called MRA-UNet. Multi-scale inputs enable the network to learn features at different scales, which increases the robustness of the network. In the encoding phase, we reduce the negative influence of the background and eliminate noise by using the residual attention module. We use the bottom reconstruction module to aggregate the feature information under different receptive fields, so that the model can extract the information of different thicknesses of blood vessels. Finally, the spatial activation module is used to process the up-sampled image to further increase the difference between blood vessels and background, which promotes the recovery of small blood vessels at the edges. Our method was verified on the DRIVE, CHASE, and STARE datasets. Respectively, the segmentation accuracy rates reached 96.98%, 97.58%, and 97.63%; the specificity reached 98.28%, 98.54%, and 98.73%; and the F-measure scores reached 82.93%, 81.27%, and 84.22%. We compared the experimental results with some state-of-art methods, such as U-Net, R2U-Net, and AG-UNet in terms of accuracy, sensitivity, specificity, F-measure, and AUC. Particularly, MRA-UNet outperformed U-Net by 1.51%, 3.44%, and 0.49% on DRIVE, CHASE, and STARE datasets, respectively.
1. Introduction
Recently, retinal image segmentation technology has been used in the diagnosis of cardiovascular and ophthalmic diseases [1], among which cataracts, glaucoma, and diabetic retinopathy (DR) are the main diseases that cause blindness [2]. Accurate segmentation of retinal images is an important prerequisite for doctors to perform professional diagnosis and prediction of related diseases. In recent years, many domestic and foreign researchers have used computers to automatically segment medical images. The existing methods of segmenting retinal vessels are mainly divided into two categories: unsupervised methods and supervised methods [1].
The unsupervised methods learn based on the inherent properties of blood vessels, so do not need to refer to manually annotated samples. In [3], a unique method combining blood vessel center-line detection technology and morphological plane slice technology was proposed to extract blood vessel trees from retinal images. In [4], B-COSFIRE filter was used to automatically segment blood vessels. In [5], a new multi-scale vessel enhancement method based on complex continuous wavelet transform (CCWT) was proposed, which uses histogram-based adaptive thresholding method and appropriate length filtering method to segment vessels. In [6], on the basis of changing the length of the basic line detector, linear detectors at different scales were realized, and the final segmentation was produced for each retinal image. The work in [7] proposed an entropy filtering algorithm based on curvature evaluation and texture mapping to segment color fundus blood vessel images. In [8], they used an improved multi-scale detector to combine all responses on different scales to perform blood vessel segmentation by setting different weights for each scale. In [9], a hybrid method for retinal vessel segmentation was proposed. This method uses normalized Gabor filtering to reduce background brightness changes and alleviate the false positive problem caused by light changes. In [10], they used mathematical morphology to smooth the retinal image, and then used the k-means clustering algorithm to segment the enhanced image. The work in [11] used the area growth method of automatic seed point selection to extract blood vessels from the image background. In [12], gray conversion based on principal component analysis (PCA) and contrast-limited adaptive histogram equalization (CLAHE) was used for retinal image enhancement, and a new matched filter was designed to segment the blood vessels.
Differently from unsupervised methods, supervised methods need to refer to manually annotated samples to build models. Supervised methods can be further divided into two categories, shallow learning methods and deep learning methods. (1). The methods based on shallow learning use handcrafted features for segmentation. In [13], they used a discriminatively trained, fully connected conditional random field model to segment retinal vessels. In [14], based on multi-scale enhancement filtering and Gabor filtering, blood vessels were extracted on multiple scales and in multiple directions. In [15], an AdaBoost classifier was constructed through iterative training for retinal vessel segmentation. The work in [16] proposed a new supervised retinal vessel segmentation method. A group of very robust features from different algorithms was merged into a mixed feature vector for pixel feature description, and then the mixed feature vector was used to train the random forest classifier. (2). Compared with methods based on shallow learning, methods based on deep learning train a large number of data samples to extract features for segmentation. In [17], a method of blood vessel segmentation based on a neural network was proposed. In [18], the samples were enhanced by global contrast normalization, zero phase whitening, geometric transformation, and gamma correction. A deep neural network was used to segment the blood vessels. In [19], a neural network based on the convolutional neural network structure was developed. In [20], the deep convolutional neural network was used to automatically segment the blood vessels in the OCT-A image, and each pixel was divided into blood vessel type or non-vessel type. In [21], they developed and trained a convolutional neural network that simultaneously segmented the optic disc, fovea, and blood vessels. The work in [22] proposed a transfer learning supervision method based on a pre-trained fully convolutional network. In [23], better preprocessing technology and multi-layer/multi-scale deep supervision layers were used to appropriately segment retinal blood vessels. In [24], a deep convolutional neural network (CNN) for segmentation of retinal blood vessels was proposed. This method improved the quality of the segmentation of tiny blood vessels. In [25], they improved the U-Net network, which contained densely connected convolutional networks and a new attention gate model for automatic segmentation of retinal blood vessels. In [26], an attention-guided network (AG-Net) was proposed to save structural information, eliminate noise, and segment blood vessels, optic discs, and optic cups. In [27], a residual connection was added to the convolutional neural network, and a deep learning architecture for fully automatic blood vessel segmentation was proposed. Deep learning has also been applied in other areas. In [28], the author constructed a deep genetic cascade integration method based on different support vector machine (SVM) classifiers for credit scoring. In [29], a deep genetic hierarchical network for credit scoring was proposed. In [30], two end-to-end deep neural network (DNN) models for ECG-based authentication were proposed. The two models were a convolutional neural network (CNN) and a residual convolutional neural network (ResNet) with an attention mechanism called ResNet-Attention. In [31], a novel ResNet-based signal recognition method was presented.
Among these methods, the traditional methods require prior knowledge and additional preprocessing to extract the manually annotated feature information, cannot obtain deeper feature information, and are susceptible to low-quality images and pathological areas. In the deep learning methods which have been proposed, the following problems usually exist: (1) Deep learning methods often require a large number of samples for learning, and there are few fundus images annotated by doctors. (2) The single input size of the model cannot obtain the features of the multi-scale image, leading to the low robustness of the model. (3) When using convolutional neural networks to learn fundus image features, convolution and pooling operations also filter out some useful information. This results in the loss of feature information of a large number of tiny blood vessels in the retinal image, which cannot be restored during the up-sampling process. (4) Up-sampling of the model makes it difficult to restore low-level detailed feature information, resulting in lower accuracy and more background noise.
To solve the above problems, this paper proposes a retinal vessel segmentation model based on convolutional neural network. Our work mainly includes:
- We propose a multi-scale residual attention network (MRA-UNet) model to automatically segment retinal vessels. We add multi-scale inputs to the network, and use the residual attention module in the down-sampling part of the network to improve the feature extraction ability of the network structure. This improves the robustness of the model and reduces the excessive loss of micro-vascular feature information.
- In MRA-UNet, we propose a bottom reconstruction module, which combines the output of the residual attention module in the down-sampling and aggregates the output information of the down-sampling to further enrich the contextual semantic information. It eases the problem of information loss in model’s down-sampling process.
- The spatial activation module is added to the output part of the up-sampling. This module can further activate the small blood vessels in the fundus image, while restoring the image. It also effectively highlights the end of the blood vessel and the boundary information of the small blood vessels.
The remainder of this paper is organized as follows. Section 2 describes the proposed method in detail, including the network backbone structure, residual attention module, bottom reconstruction module, and spatial activation module. Section 3 introduces the image datasets, experimental parameters, and evaluation indicators. In Section 4, we discuss and compared our experimental results. Finally, a conclusion is drawn in Section 5.
2. Methodology
In this paper, the traditional U-Net [32] is improved, and the residual attention module is added to the encoder part of U-Net. The advantages of the skip connection and attention mechanism are used to extract the features of the fundus image. The input to the traditional U-Net is a single-scale input. In order to allow the network to express the characteristics of images at different scales, the input of the network is changed to multi-scale inputs. The multi-scale inputs are divided into four branches. The number of channels for each branch is 3. The image sizes of the branches are 48 × 48, 24 × 24, 12 × 12, and 6 × 6 pixels. The network structure of this paper is shown in Figure 1.
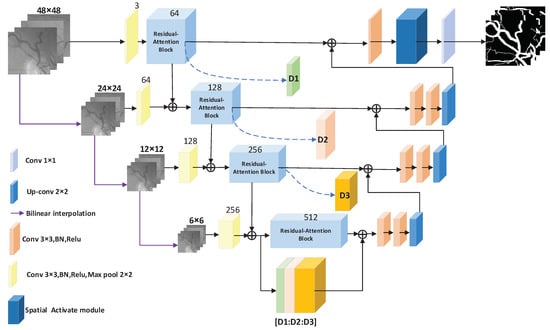
Figure 1.
The MRA-UNet architecture.
As shown in Figure 1, the basic backbone of this network structure is U-Net. The network structure is mainly composed of two parts. The first part is the encoder–feature extraction part (the left half of Figure 1), and the second part is the decoder–upper sampling part (the right half of Figure 1).
2.1. Residual Attention Module
The residual attention module was inspired by FFA-Net [33]. We embed the proposed residual attention module into the encoder. The residual attention module can highlight important areas in fundus images, filter noise from the background, and solve the problem of information loss caused by down-sampling. At the same time, it can alleviate the problems of gradient explosion and gradient disappearance. It can filter the background noise of low-resolution feature maps and highlight important areas in the fundus image. One module is a local residual learning one; there is also a channel attention module and a pixel attention module. Local residual learning allows the network to ignore less important information, such as background or low-frequency regions, and bypass noise regions, making the network pay attention to effective information. The residual attention module first extracts primary semantic information through two 3 × 3 convolutional layers and skip connections, and then sequentially generates attention maps through channel attention and pixel attention. Finally, the input feature maps and attention maps are multiplied to obtain the weighted attention feature map. Figure 2 illustrates the details of the residual attention module.
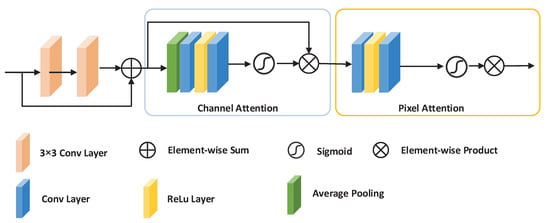
Figure 2.
The detailed structure of the residual attention module.
The input of this module is a feature map x processed by a 3 × 3 convolutional layer, a normalization layer, Relu, and a 2 × 2 pooling layer. x is then passed through two 3 × 3 convolutional layers to treated as the input of channel attention. The attention matrix and the feature map x are multiplied to obtain the weighted attention feature map. The calculation formula of is defined as follows:
where represents the output of the pixel attention module, represents the output of the channel attention module, ⊗ represents element-wise multiplication, and Conv represents x processed by a 3 × 3 convolutional layer, a normalization layer, Relu, and a 2 × 2 pooling layer.
2.1.1. Channel Attention Module
In order to allow the network to pay attention to the information of each channel, we improved a channel attention module. This module uses DCP [34] to calculate the weighting information of each channel. First, we use the global average pool to represent the channel’s global spatial information. The calculation formula for the channel’s global spatial information is defined as follows:
where represents the value x of the c-th channel at position , and is the global pooling function. The size of the feature map is changed from to . In order to obtain the weights of different channels, we obtain the channel attention matrix CA through two convolutional layers of the channel’s global spatial information we have obtained. The first convolutional layer is activated by the Relu function, and the activation function of the second convolutional layer is sigmoid. Finally, we multiply the input of the module and the channel attention matrix CA by corresponding elements.The calculation formula of CA is shown in Formula (3).
where is the sigmoid function, is the ReLu function, and f represents the convolution calculation.
2.1.2. Pixel Attention Module
Taking into account the uneven distribution of pixels in different fundus blood vessel images, we propose a pixel attention module to make the network pay more attention to information features. We directly use the output of the channel attention module as the input of the pixel attention module. The pixel attention module in turn contains two 3 × 3 convolutional layers with ReLu and sigmoid activation functions. The size of the feature map is changed from to . Finally, we use element multiplication to multiply the input x of the residual attention module and the output of the pixel attention module. is the output of the residual attention module, as illustrated in (4), where PA represents the pixel attention module.
2.2. Bottom Reconstruction Module
Figure 3 details the design of the bottom reconstruction module. Since the image will lose some semantic information during the down-sampling process, in order to obtain more semantic information, we use the bottom reconstruction module at the bottom of U-Net to aggregate three different scales’ feature maps. The module contains three inputs, D1, D2, and D3, which are the outputs of the three residual attention modules during the down-sampling process. D1 is 48 × 48; the number of channels is 64. D2 is 24 × 24; the number of channels 128. D3 is 12 × 12 in size, and the number of channels is 256.
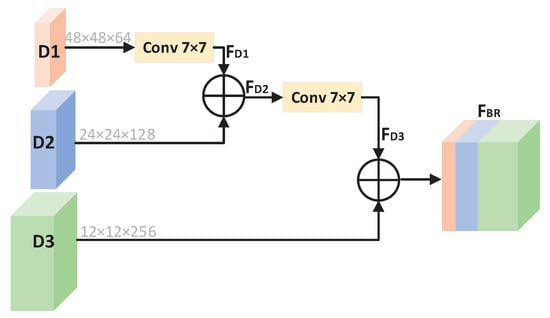
Figure 3.
The detailed structure of bottom reconstruction module.
First, D1 is processed by two 7 × 7 convolutional layers with stride of 2, and it becomes feature map F with size of 12 × 12 × 64. F and D2 are aggregated to obtain F. F is processed by a 7 × 7 convolutional layer with stride of 2 to become a feature map F with size of 12 × 12 × 192. The output of the bottom reconstruction module is F—the result of aggregation between F and D3. Finally, the result of channel addition is added element by element with the output of the residual attention module at the bottom of U-Net. F can be written as (5).
where + represents that feature maps are added by channel dimension.
2.3. Spatial Activation Module
In order to highlight the small blood vessels, we added a spatial activation module to the last convolutional layer of down-sampling, as illustrated in the Figure 4. The input of this module is 48 × 48 × 64. Then, through four 3 × 3 convolutional layers, a feature map of size 48 × 48 × 64 is obtained. The feature map of size 48 × 48 × 64 is used as the input of the spatial activation module to obtain a weighted attention map of 48 × 48 × 64. We first obtain the global information of each channel through global average pooling, and get a 1 × 1 × C tensor, which is actually the attention weight coefficient of each channel. The sum of C channel coefficients is 1. is obtained by inputting the result of global average pooling into sigmoid. The channel coefficient and the corresponding channel are multiplied to obtain the attention map after the channel weighting. Here, in order to speed up the network convergence and facilitate network training, we also use skip connections. The small blood vessels in the feature map after the spatial activation module are more obvious, and the difference between the foreground and the background is greater. The output result of our channel attention module is illustrated in (6):
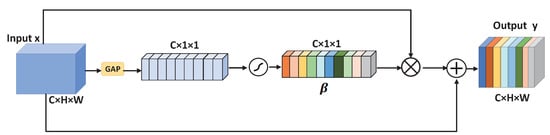
Figure 4.
The detailed structure of spatial activation module.
3. Datasets and Evaluation
3.1. Datasets
The proposed method was validated on three public retinal fundus blood vessel image datasets (DRIVE, CHASE, and STARE). The DRIVE database was obtained from the Dutch diabetic retinopathy screening project. From 400 diabetic subjects between 25 and 90 years old, a total of 40 people were selected. Among them, 33 cases showed no signs of diabetic retinopathy, and 7 cases showed signs. It consists of 40 retinal fundus vascular images, corresponding ground truth images, and corresponding mask images. Fundus images with serial numbers 21–40 are the training set, and images with serial numbers 1–20 are the test set. The size of each picture is 565 × 584. (http://www.isi.uu.nl/Research/Databases/DRIVE/).
CHASE consists of 28 retinal fundus blood vessel images, corresponding ground truth images, and corresponding masks images. Each image has a size of 1280 × 960 pixels, collected from the left and right eyes of 14 children. For CHASE, this study used the division method proposed by Zhuang et al. [35] to train on the first 20 images, and test and evaluate the remaining 8 images. (https://blogs.kingston.ac.uk/retinal/chasedb1/).
STARE database is composed of 20 retinal fundus blood vessel images, corresponding ground truth images, and corresponding masks images. The training set and test set were generated using the leave-one-out method. Each image was made a test set, and then the evaluation indicators were summed. The final evaluation result was obtained by averaging, and the size of each image is 700 × 605 pixels. The STARE database contains two groups of manual segmentation results by two experts. (http://www.ces.clemson.edu/ahoover/stare/).
3.2. Experimental Environment and Parameter Settings
Our framework was based on the deep learning open source package Pytorch, implemented on a server with Quadro RTX 6000, with Ubuntu64 as the operating system. During training, the random patch method of Jiang et al. [36] used in this study randomly extracted patches from the training set and input them into the network. The patch size was 48 × 48. The number of epochs of the model was 100, the batch size was 256, and the number of patches per image was 156. The initial learning rate was 0.001. The optimizer used by the model was Adam. The momentum is 10. The exponential attenuation rate was set to 0.9 by default in the parameters of the Adam optimizer. The learning rate was updated using the step decay method. The decay factor was 0.01. The weight decay coefficient was 0.0005. The loss function used a cross-entropy loss function. It is defined as follows:
where means the real label, and represents the predicted label.
3.3. Performance Evaluation Indicator
In order to evaluate the effect of this method on retinal fundus image segmentation, we generated a confusion matrix to analyze the performance of evaluation indicators such as sensitivity, specificity, accuracy, and F-measure. The formula for each evaluation indicator is as follows.
Here, TP is the number of blood vessel pixels that are correctly segmented, TN is the number of background pixels that are correctly segmented, FP is the number of background pixels that are incorrectly segmented as blood vessel pixels, and FN is the number of blood vessel pixels that are incorrectly segmented as background pixels.
4. Experiment Results and Analysis
4.1. Comparison of Results before and after Model Improvement
In order to validate the effectiveness of the residual attention module (RA), bottom reconstruction module (BR), and spatial activation module (SA) proposed in this paper, experiments were carried out on DRIVE and CHASE datasets. MUNet represents the U-Net with multi-scale inputs. MUNet+RA represents that the model adds the RA module to the multi-scale inputs of U-Net. MUNet+SA represents that the model adds the SA module to the multi-scale inputs of U-Net. MUNet+RA+BR represents that the RA and BR modules are added to the multi-scale inputs of the U-Net model. MUNet+RA+BR+SA represents that the three modules of RA, BR, and SA are added to the multi-scale inputs of the U-Net model.
The experimental results of the five models on the DRIVE dataset are shown in Table 1. The bolded number in the table is the highest value of the corresponding indicator in this paper. In order to validate the effectiveness of introducing residual attention module (RA) and spatial activation module (SA), we respectively compared the network performance with RA and SA modules and without RA and SA modules. It can be seen from the experimental results in Table 1 that the models with the residual attention module and the spatial activation module added respectively had higher accuracies and F-measures than the baseline model MUNet. The introduction of RA and SA modules can enable the network to learn features better. RA allows the network to focus on extracting features during down-sampling, alleviating the problem of information loss caused by convolution and pooling operations. The SA module can effectively promote the recovery of small blood vessels at the edge during up-sampling.

Table 1.
The experimental results of the five models in the DRIVE database.
Adding the residual attention module and the bottom reconstruction module to the MUNet model (MUNet+RA+BR) caused great improvements in accuracy and F-measure over the baseline model MUNet—in particular, the F-measure was 2.1% higher than MUNet’s. After adding the three modules to MUNet, the accuracy of the model had a slight decrease, but the sensitivity, F-measure, and AUC were increased by 4.46%, 0.43%, and 0.04% compared with MUNet+RA+BR, respectively.
Table 2 shows the experimental results of the five models on the CHASE dataset. Like the experiment on the DRIVE dataset, in order to validate the effectiveness of the RA and SA modules, we added the RA and SA modules to the MUNet respectively.
Table 2.
The experimental results of the five models on the CHASE database.
From the experimental results in Table 2, we can see all the indicators of the model after adding the RA and SA modules both improved, especially F-measure. In order to validate the effectiveness of the BR module, we added RA and BR to MUNet. Compared with the MUNet+RA model, the accuracy and F-measure were increased by 0.11% and 1.43%, respectively. Finally, we added all three modules to MUNet for experiments. The experimental results show that although MUNet+BR+RA+SA had less specificity than MUNet+RA, it had the highest accuracy, sensitivity, F-measure, and AUC among the five models.
To further prove the improved performance of the model, we propose a hypothesis: with the addition of RA, SA, and BR modules, the baseline model performs better. We conducted p value analysis on accuracy with the DRIVE database, and the results are shown in Table 3. MUNet:MUNet+RA represents the comparison between the MUNet model and the MUNet+RA model, and MUNet:MUNet+SA represents the comparison between the MUNet model and the MUNet+SA model. In the table, MUNet:MUNet+RA has a p value < 0.05 for accuracy, indicating that the MUNet+RA model and the MUNet model have statistical significance. That is, the MUNet+RA model performs better than the MUNet model. In the table, MUNet:MUNet+BR+RA+SA has a p value < 0.05 for accuracy, indicating that the MUNet+BR+RA+SA model performs better in retinal vessel segmentation than the MUNet model. The p value analysis on the CHASE dataset is shown in Table 4. MUNet:MUNet+BR+RA+SA has a p value < 0.05 for accuracy, indicating that the MUNet+BR+RA+SA model performs better in the CHASE database than the MUNet model.
Table 3.
Comparison of p value analysis results based on accuracy with the DRIVE database.
Table 4.
Comparison of p value analysis results based on accuracy with the CHASE database.
4.2. Model Parameter Quantity and Computation Time Analysis
The time complexity calculation formula of a convolutional neural network [37] is as follows:
Here l is the index of a convolutional layer, and d is the depth (number of convolutional layers). n is the number of filters in the l-th layer. n is also known as the number of input channels of the l-th layer. s is the spatial size (length) of the filter. m is the spatial size of the output feature map.
In order to evaluate the size of our model more accurately, the Python built-in function summary used in this study calculated the parameter quantity of the model. There are two reasons: First, there will be errors in the time complexity of manual calculation. Second, many researchers use model parameter quantities to evaluate model size.
The total number of parameters of the model proposed in this paper is 223.54 MB.
Our model takes 0.8633 s to segment a complete image on DIRVE dataset, 0.9649 s to segment a complete image on CHASE dataset, and 1.18 s to segment a complete image on STARE dataset. The comparisons between the calculation time of the proposed model and those of other models is shown in Table 5, Table 6, and Table 7. Our model is the fastest in segmenting fundus images from DRIVE and CHASE except for the SATRE dataset. This makes our model suitable for real-world clinical applications.
Table 5.
Comparison of proposed methods with other methods in the DRIVE database.
Table 6.
Comparison of proposed methods with other methods in the CHASE database.
Table 7.
Comparison of proposed methods with other methods in the STARE database.
4.3. Evaluation of ROC and Precision Recall (PR) Curves before and after Model Improvement
In Figure 5 and Figure 6, we compare the ROC and PR curves of different models on the DRIVE and CHASE datasets. It can be seen from Figure 5 that, after the RA module was added to the baseline model, the ROC and PR of the model (MUNet+RA) increased by 0.0136 and 0.0118, respectively. This was due to the attention mechanism and jump join in the RA module, which further extracted the semantic information in the down-sampling. With the addition of SA and BR modules, the model ROC and PR increased, which also proves the effectiveness of the three modules RA, SA, and BR.
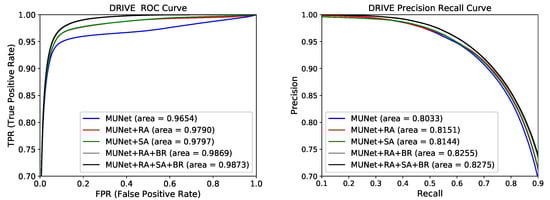
Figure 5.
Receiver operating characteristic (ROC) curve and precision recall (PR) curve for the five models on DRIVE dataset.
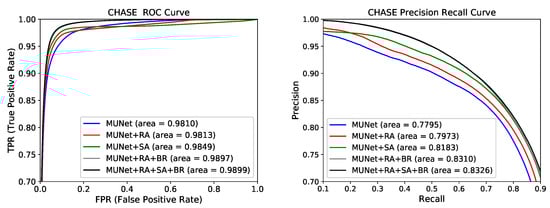
Figure 6.
Receiver operating characteristic (ROC) curve and precision recall (PR) curve for the five models on CHASE dataset.
On the CHASE database, the areas under the AUC and PR curves of the best model MUNet+RA+SA+BR were 0.9899 and 0.8326. Compared with the baseline model MUNet, the areas under the AUC and PR curves of the best model increased by 0.0089 and 0.0531. With the addition of the three modules of RA, SA, and BR, the effect of the baseline model becomes better. Finally, the model containing these three modules has the best results on the CHASE database.
4.4. Visualization Results with Different Methods
We compared the method proposed in this paper with the method proposed by Aslani [16]. Figure 7 and Figure 8 are the visualization results of the DRIVE and CHASE datasets, respectively. In Figure 7, column (a) represents the original image; (b) column represents the ground truth corresponding to the original image; (c) column represents the segmentation result of Aslani [16] and column (d) represents the segmentation result of the method proposed in this paper. In Figure 8, column (a) and (b) are the same as Figure 7, column (c) represents the segmentation result of R2U-Net, and column (d) represents the segmentation result of the method proposed in this paper. The retinal blood vessels segmented by the method of Aslani [16] contain a lot of noise and the wrong blood vessel branches, and there are problems such as unclear segmentation of small blood vessels at the edge and blurred boundaries. Although the retinal blood vessels segmented by the R2U-Net method contain less noise, there are still problems such as blurred boundaries and unclear small blood vessels.
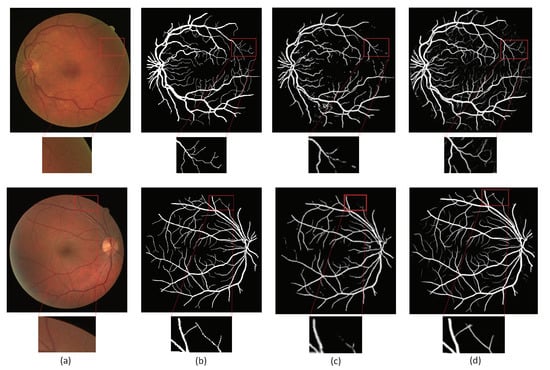
Figure 7.
Comparisons of segmentation results on DRIVE database. (a) Image; (b) ground truth; (c) Aslani [16]; (d) ours.
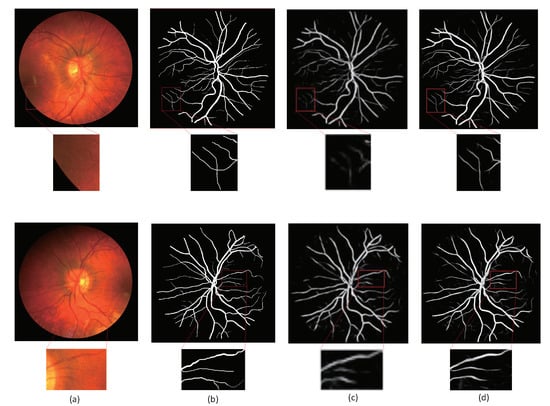
Figure 8.
Comparisons of segmentation results on CHASE database (a) Image; (b) ground truth; (c) R2U-Net; (d) ours.
The method proposed in this paper used the residual attention module for down-sampling, which reduces the loss of feature information caused by pooling and convolution, so as to better extract the feature information of small blood vessels on the edge. The existence of the attention mechanism enables the network to distinguish the foreground and background regions well, so that the segmentation result contains less noise and is more accurate, especially for the segmentation of small blood vessels in the red box in the figure.
4.5. Comparison of Segmentation Results with Different Methods
In order to prove the effectiveness of our method for blood vessel segmentation, we used the previously proposed unsupervised and supervised methods to evaluate our method on three datasets, mainly using sensitivity, specificity, accuracy, F-measure, and AUC evaluation indicators. Table 5 and Table 6 are the results of retinal blood vessel segmentation on the two standard datasets of DRIVE, CHASE. Table 7 shows the segmentation results of 20 retinal vessels on the STARE database.Table 8 shows the results on the STARE database trained and tested using the leave-one-out method. From the table, we can see that the segmentation results of supervised methods are generally better than those of unsupervised methods, and the AUC of supervised methods is higher.
Table 8.
Results of the leave-one-out on STARE.
For the DRIVE dataset, this method had good results on evaluation indicators, except the specificity was not as high as that of Zhang [26]. The blood vessels segmented by Aslani [16] and others contain more noise, and the segmentation of small blood vessel branches at the edge is blurry. The neglect of the small branch blood vessels at the margins leads to low sensitivity and high specificity results. Our method used skip connections to reduce the information loss in the down-sampling process. Local residual learning allows the network to ignore less important information, such as background or low-frequency regions, and bypass noise regions. This can make the network pay attention to effective information. We also use the attention mechanism to increase the contrast between the background and the blood vessels, so that the network notices the small blood vessel branches in the fundus. Our method can also have a better recognition effect for the small edge blood vessel. Our method is 1.4%, 0.77%, and 1.91% higher in accuracy, F-measure, and AUC than the latest method proposed by AG-UNet [39].
For the CHASE database, because of the uneven background illumination of the sample images in the CHASE dataset, it is difficult to distinguish blood vessels from wider arterioles, which requires the model to have strong feature extraction capabilities. Compared with R2U-Net [38], our method is 1.24%, 1.99%, and 0.84% higher in accuracy, F-measure, and AUC, respectively. We reduced the loss of feature information by adding a residual attention module during the down-sampling process, and we used the bottom reconstruction module to further aggregate the down-sampling feature information. On this dataset, Jiang [22] had the highest sensitivity, but that method was not as high as our method in terms of accuracy and AUC.
On STARE data, Table 7 shows the experimental results of the STARE dataset. The segmentation result F1 of our method was 84.22%, which is 0.34% higher than residual U-Net. In terms of sensitivity, the segmentation result of Samuel [23] was higher than our method, and the specificity of the segmentation result of Atli [27] is higher than that of the method proposed in this paper. However, our method has the highest F-measure, accuracy, and AUC. Table 5 shows the experimental results of the STARE dataset tested and trained with the leave-one-out method. The highest accuracy, sensitivity, specificity, F-measure, and AUC are 98.62%, 93.42%, 99.47%, 88.65%, and 99.60%. The average accuracy, sensitivity, specificity, F-measure, and AUC of our method on 20 fundus images are 97.63%, 84.22%, 98.73%, 84.22% and 99.18%.
Our method used skip connections to reduce the information loss caused by pooling and convolution in the down-sampling process of the network, so that the network can extract more feature information, and the edge small blood vessels can be segmented more accurately. The attention mechanism is used to improve U-Net, so that the network can better distinguish the foreground and the background, and effectively ignore the noise. The multi-scale inputs we added allow the network to learn feature information at different scales. The bottom reconstruction module further aggregates the information obtained after down-sampling to obtain feature information under different receptive fields. Finally, the spatial activation module used in the up-sampling process promotes the recovery of peripheral small blood vessels. By analyzing the results of DRIVE, CHASE, and STARE, it was proven that our method has good performance and robustness for the segmentation of fundus blood vessels.
5. Conclusions
The segmentation of retinal blood vessels is of great significance to the diagnosis of ophthalmic diseases. In this paper, we proposed the MRA-UNet model, which can automatically segment blood vessels in fundus images. This model combines residual connection and attention mechanisms to improve the original U-Net, by adding three modules: residual attention module, bottom reconstruction module, and spatial activation module. The skip connection in the residual attention module can alleviate the loss of feature information caused by pooling and convolution in down-sampling process. The attention mechanism can allow the network to effectively ignore noise. The bottom reconstruction module multiplies the output information of all residual attention modules. Scale aggregation captures characteristic information under multiple receptive fields. The spatial activation module promotes the recovery of small blood vessels at the edge during the up-sampling process, increases the difference between blood vessels and background, and makes the network more sensitive to blood vessels. Finally, we validated the method on the DRIVE, CHASE, and STARE datasets. The experimental results show that our method has better performance in the segmentation of retinal blood vessels, compared with some of the latest algorithms (such as U-Net, R2U-Net, and AG-UNet [39]).
Multiple experimental results show that our model has good results on all three datasets, indicating its potential for practical applications in screening and diagnostic systems. The visualization results show that our proposed method has good performance on marginal small vessels. However, the drawback of our method is that it requires a large number of samples for training, but there are few datasets that have been annotated and published by medical experts. In this study, our method was validated on 2D images. In addition, future work will focus on the application of the proposed method to 3D images.
Author Contributions
Data curation, W.L.; Methodology, H.Y.; Resources, C.W.; software, H.Y.; supervision, Y.J.; validation, C.W.; writing—original draft, H.Y.; writing—review and editing, H.Y. and W.L. All authors have read and agreed to the published version of the manuscript.
Funding
This work was supported in part by the National Natural Science Foundation of China (61962054), in part by the the National Natural Science Foundation of China (61163036), in part by the 2016 Gansu Provincial Science and Technology Plan Funded by the Natural Science Foundation of China (1606RJZA047), in part by the 2012 Gansu Provincial University Fundamental Research Fund for Special Research Funds, Gansu Province Postgraduate Supervisor Program in Colleges and Universities (1201-16), and in part by the Northwest Normal University’s Third Phase of Knowledge and Innovation Engineering Research Backbone Project (nwnu-kjcxgc-03-67).
Data Availability Statement
Data available in a publicly accessible repository.
Conflicts of Interest
The authors declare no conflict of interest. The funders had no role in the design of the study; in the collection, analyses, or interpretation of data; in the writing of the manuscript, or in the decision to publish the results.
References
- Fraz, M.M.; Remagnino, P.; Hoppe, A.; Uyyanonvara, B.; Rudnicka, A.R.; Owen, C.G.; Barman, S.A. Blood vessel segmentation methodologies in retinal images—A survey. Comput. Methods Programs Biomed. 2012, 108, 407–433. [Google Scholar] [CrossRef]
- Abràmoff, M.D.; Folk, J.C.; Han, D.P.; Walker, J.D.; Williams, D.F.; Russell, S.R.; Massin, P.; Cochener, B.; Gain, P.; Tang, L.; et al. Automated analysis of retinal images for detection of referable diabetic retinopathy. JAMA Ophthalmol. 2013, 131, 351–357. [Google Scholar] [CrossRef]
- Fraz, M.M.; Barman, S.A.; Remagnino, P.; Hoppe, A.; Basit, A.; Uyyanonvara, B.; Rudnicka, A.R.; Owen, C.G. An approach to localize the retinal blood vessels using bit planes and centerline detection. Comput. Methods Programs Biomed. 2012, 108, 600–616. [Google Scholar] [CrossRef]
- Azzopardi, G.; Petkov, N. Trainable COSFIRE filters for keypoint detection and pattern recognition. IEEE Trans. Pattern Anal. Mach. Intell. 2012, 35, 490–503. [Google Scholar] [CrossRef]
- Fathi, A.; Naghsh-Nilchi, A.R. Automatic wavelet-based retinal blood vessels segmentation and vessel diameter estimation. Biomed. Signal Process. Control 2013, 8, 71–80. [Google Scholar] [CrossRef]
- Nguyen, U.T.V.; Bhuiyan, A.; Park, L.A.F.; Ramamohanarao, K. An effective retinal blood vessel segmentation method using multi-scale line detection. Pattern Recognit. 2013, 46, 703–715. [Google Scholar] [CrossRef]
- Yin, X.X.; Ng, B.W.H.; He, J.; Zhang, Y.; Abbott, D. Unsupervised segmentation of blood vessels from colour retinal fundus images. In Proceedings of the International Conference on Health Information Science, HIS 2014, Shenzhen, China, 22–23 April 2014; pp. 194–203. [Google Scholar]
- Hou, Y. Automatic segmentation of retinal blood vessels based on improved multiscale line detection. J. Comput. Sci. Eng. 2014, 8, 119–128. [Google Scholar] [CrossRef]
- Tapamo, J.R.; Viriri, S.; Gwetu, M.V. Segmentation of retinal blood vessels using normalized Gabor filters and automatic thresholding. S. Afr. Comput. J. 2014, 55, 12–24. [Google Scholar]
- Hassan, G.; El-Bendary, N.; Hassanien, A.E.; Fahmy, A.; Shoeb, A.M.; Snasel, V. Retinal blood vessel segmentation approach based on mathematical morphology. Procedia Comput. Sci. 2015, 65, 612–622. [Google Scholar] [CrossRef]
- Karunanayake, N.; Kodikara, N.D. An improved method for automatic retinal blood vessel vascular segmentation using gabor filter. Open J. Med. Imaging 2015, 5, 204. [Google Scholar] [CrossRef]
- Singh, N.P.; Srivastava, R. Retinal blood vessels segmentation by using Gumbel probability distribution function based matched filter. Comput. Methods Programs Biomed. 2016, 129, 40–50. [Google Scholar] [CrossRef] [PubMed]
- Orlando, J.I.; Blaschko, M. Learning fully-connected CRFs for blood vessel segmentation in retinal images. In Proceedings of the International Conference on Medical Image Computing and Computer-Assisted Intervention, Boston, MA, USA, 14–18 September 2014; pp. 634–641. [Google Scholar]
- Tang, S.; Lin, T.; Yang, J.; Fan, J.; Ai, D.; Wang, Y. Retinal vessel segmentation using supervised classification based on multi-scale vessel filtering and Gabor wavelet. J. Med. Imaging Health Inform. 2015, 5, 1571–1574. [Google Scholar] [CrossRef]
- Zhu, C.; Zou, B.; Xiang, Y.; Cui, J.; Wu, H. An ensemble retinal vessel segmentation based on supervised learning in fundus images. Chin. J. Electron. 2016, 25, 503–511. [Google Scholar] [CrossRef]
- Aslani, S.; Sarnel, H. A new supervised retinal vessel segmentation method based on robust hybrid features. Biomed. Signal Process. Control 2016, 30, 1–12. [Google Scholar] [CrossRef]
- Mo, J.; Zhang, L. Multi-level deep supervised networks for retinal vessel segmentation. Int. J. Comput. Assist. Radiol. Surg. 2017, 12, 2181–2193. [Google Scholar] [CrossRef] [PubMed]
- Liskowski, P.; Krawiec, K. Segmenting retinal blood vessels with deep neural networks. IEEE Trans. Med. Imaging 2016, 35, 2369–2380. [Google Scholar] [CrossRef]
- Sangeethaa, S.N.; Maheswari, P.U. An intelligent model for blood vessel segmentation in diagnosing DR using CNN. J. Med. Syst. 2018, 42, 175. [Google Scholar] [CrossRef]
- Prentašić, P.; Heisler, M.; Mammo, Z.; Lee, S.; Merkur, A.; Navajas, E.; Beg, M.F.; Šarunic, M.; Lončarić, S. Segmentation of the foveal microvasculature using deep learning networks. J. Biomed. Opt. 2016, 21, 075008. [Google Scholar] [CrossRef]
- Tan, J.H.; Acharya, U.R.; Bhandary, S.V.; Chua, K.C.; Sivaprasad, S. Segmentation of optic disc, fovea and retinal vasculature using a single convolutional neural network. J. Comput. Sci. 2017, 20, 70–79. [Google Scholar] [CrossRef]
- Jiang, Z.; Zhang, H.; Wang, Y.; Ko, S.-B. Retinal blood vessel segmentation using fully convolutional network with transfer learning. Comput. Med. Imaging Graph. 2018, 68, 1–15. [Google Scholar] [CrossRef]
- Samuel, P.M.; Veeramalai, T. Multilevel and Multiscale Deep Neural Network for Retinal Blood Vessel Segmentation. Symmetry 2019, 11, 946. [Google Scholar] [CrossRef]
- Soomro, T.A.; Afifi, A.J.; Gao, J.; Hellwich, O.; Zheng, L.; Paul, M. Strided fully convolutional neural network for boosting the sensitivity of retinal blood vessels segmentation. Expert Syst. Appl. 2019, 134, 36–52. [Google Scholar] [CrossRef]
- Wu, C.; Zou, Y.; Zhan, J. DA-U-Net: Densely connected convolutional networks and decoder with attention gate for retinal vessel segmentation. Mater. Sci. Eng. 2019, 533, 012053. [Google Scholar] [CrossRef]
- Zhang, S.; Fu, H.; Yan, Y.; Zhang, Y.; Wu, Q.; Yang, M.; Tan, M.; Xu, Y. Attention guided network for retinal image segmentation. In Proceedings of the International Conference on Medical Image Computing and Computer-Assisted Intervention, Shenzhen, China, 13–17 October 2019; pp. 797–805. [Google Scholar]
- Atli, İ.; Gedik, O.S. Sine-Net: A fully convolutional deep learning architecture for retinal blood vessel segmentation. Eng. Sci. Technol. Int. J. 2020. [Google Scholar]
- Pławiak, P.; Abdar, M.; Acharya, U.R. Application of new deep genetic cascade ensemble of SVM classifiers to predict the Australian credit scoring. Appl. Soft Comput. 2019, 84, 105740. [Google Scholar] [CrossRef]
- Pławiak, P.; Abdar, M.; Pławiak, J.; Makarenkov, V.; Acharya, U.R. DGHNL: A new deep genetic hierarchical network of learners for prediction of credit scoring. Inf. Sci. 2020, 516, 401–418. [Google Scholar] [CrossRef]
- Hammad, M.; Pławiak, P.; Wang, K.; Acharya, U.R. ResNet-Attention model for human authentication using ECG signals. Expert Syst. 2020, e12547. [Google Scholar] [CrossRef]
- Tuncer, T.; Ertam, F.; Dogan, S.; Aydemir, E.; Pławiak, P. Ensemble residual network-based gender and activity recognition method with signals. J. Supercomput. 2020, 76, 2119–2138. [Google Scholar] [CrossRef]
- Ronneberger, O.; Fischer, P.; Brox, T. U-net: Convolutional networks for biomedical image segmentation. In Proceedings of the International Conference on Medical Image Computing and Computer-Assisted Intervention, Munich, Germany, 5–9 October 2015; pp. 234–241. [Google Scholar]
- Qin, X.; Wang, Z.; Bai, Y.; Xie, X.; Jia, H. FFA-Net: Feature Fusion Attention Network for Single Image Dehazing. arXiv 2019. [Google Scholar]
- He, K.; Sun, J.; Tang, X. Single image haze removal using dark channel prior. IEEE Trans. Pattern Anal. Mach. Intell. 2010, 33, 2341–2353. [Google Scholar]
- Zhuang, J. Laddernet: Multi-path networks based on u-net for medical image segmentation. arXiv 2018, arXiv:1810.07810. [Google Scholar]
- Jiang, Y.; Zhang, H.; Tan, N.; Chen, L. Automatic Retinal Blood Vessel Segmentation Based on Fully Convolutional Neural Networks. Symmetry 2019, 11, 1112. [Google Scholar] [CrossRef]
- He, K.; Sun, J. Convolutional neural networks at constrained time cost. In Proceedings of the IEEE Conference on Computer Vision and Pattern Recognition, Boston, MA, USA, 7–12 June 2015; pp. 5353–5360. [Google Scholar]
- Alom, M.Z.; Hasan, M.; Yakopcic, C.; Taha, T.M.; Asari, V.K. Recurrent residual convolutional neural network based on u-net (r2u-net) for medical image segmentation. arXiv 2018, arXiv:1802.06955. [Google Scholar]
- Lv, Y.; Ma, H.; Li, J.; Liu, S. Attention Guided U-Net With Atrous Convolution for Accurate Retinal Vessels Segmentation. IEEE Access 2020, 8, 32826–32839. [Google Scholar] [CrossRef]
Publisher’s Note: MDPI stays neutral with regard to jurisdictional claims in published maps and institutional affiliations. |
© 2020 by the authors. Licensee MDPI, Basel, Switzerland. This article is an open access article distributed under the terms and conditions of the Creative Commons Attribution (CC BY) license (http://creativecommons.org/licenses/by/4.0/).