Article

Deep MLP-CNN Model Using Mixed-Data to Distinguish between COVID-19 and Non-COVID-19 Patients

School of Industrial and Systems Engineering, University of Oklahoma, Norman, OK 73019, USA
*
Authors to whom correspondence should be addressed.
Symmetry 2020, 12(9), 1526; https://doi.org/10.3390/sym12091526
Submission received: 13 August 2020 / Revised: 10 September 2020 / Accepted: 11 September 2020 / Published: 16 September 2020

Abstract

:
The limitations and high false-negative rates (30%) of COVID-19 test kits have been a prominent challenge during the 2020 coronavirus pandemic. Manufacturing those kits and performing the tests require extensive resources and time. Recent studies show that radiological images like chest X-rays can offer a more efficient solution and faster initial screening of COVID-19 patients. In this study, we develop a COVID-19 diagnosis model using Multilayer Perceptron and Convolutional Neural Network (MLP-CNN) for mixed-data (numerical/categorical and image data). The model predicts and differentiates between COVID-19 and non-COVID-19 patients, such that early diagnosis of the virus can be initiated, leading to timely isolation and treatments to stop further spread of the disease. We also explore the benefits of using numerical/categorical data in association with chest X-ray images for screening COVID-19 patients considering both balanced and imbalanced datasets. Three different optimization algorithms are used and tested:adaptive learning rate optimization algorithm (Adam), stochastic gradient descent (Sgd), and root mean square propagation (Rmsprop). Preliminary computational results show that, on a balanced dataset, a model trained with Adam can distinguish between COVID-19 and non-COVID-19 patients with a higher accuracy of 96.3%. On the imbalanced dataset, the model trained with Rmsprop outperformed all other models by achieving an accuracy of 95.38%. Additionally, our proposed model outperformed selected existing deep learning models (considering only chest X-ray or CT scan images) by producing an overall average accuracy of 94.6% ± 3.42%.

1. Introduction

With the advent of the Novel Coronavirus (SARS-CoV-2) in December 2019, first detected in the Wuhan Province of China, there was a major outbreak of the associated disease (COVID-19), which causes severe acute respiratory syndrome. More importantly, this virus can be transmitted directly from human to human, making it difficult to be contained. Rapidly, COVID-19 was observed in virtually all countries, triggering a severe public health crisis worldwide [1,2]. As a consequence, the World Health Organization (WHO) recognized this public health emergency as an ongoing pandemic on 11 March 2020 [3]. Coronaviruses (CoV) belong to a large family of viruses that cause diseases related to colds like the Middle East Respiratory Syndrome (MERS-CoV) and the Severe Acute Respiratory Syndrome (SARS-CoV) [4].
As of 30 August 2020, the number of Coronavirus cases in the world is approximately hitting the 25.3 million mark, with the total number of deaths surpassing 849,958 and an associated mortality rate of about 6% [5]. Statistics show that about 82 % of the COVID-19 cases have milder symptoms like fever, cough, and dyspnea. However, more serious cases can cause severe acute respiratory syndrome, pneumonia, and multi-organ failure [4]. With the number of cases increasing daily, most countries find it challenging to keep up with the number of hospitalized patients, more so in Intensive Care Units (ICU). The ICUs are mostly occupied by patients suffering from COVID-19-related pneumonia [4]. Ultimately, the development of a vaccine is necessary for the prevention and eradication of SARS-CoV-2. However, as the development of such vaccines is still a work in progress, early diagnosis, improved treatment of critical cases, and prevention of the spread through lockdowns are vital to reduce mortality rates [6].
The gold standard for the diagnosis of COVID-19 patients is the Reverse Transcription-Polymerase Chain Reaction (RT-PCR) technique. However, there has been an inadequate number of testing kits for the SARS-CoV-2 during the disease’s early outbreak. The RT-PCR test also produces a high rate of false-negative results, due to sample preparation and quality control in particular [7]. In addition, viruses such as influenza A and influenza B can cause symptoms similar to those of SARS-CoV-2, making it harder to differentiate between COVID-19 and non-COVID-19 cases, more so in the flu season [8]. Uncertainty can lead to a broader spread of the disease if suspected people with the symptoms roam freely without being tested [8]. Many overpopulated countries like India and Bangladesh have failed to conduct enough tests due to limited resources for guaranteeing widespread test kit availability [9,10]. Therefore, it is pertinent to develop an early diagnosis screening method considering cost-effectiveness and reliability, such that a larger population is impacted and can benefit from it.
Artificial intelligence (AI) is an emerging branch of computer science with demonstrated potential in a wide variety of fields, with applications ranging from decision tools in the energy and financial sectors [11,12] to medical imaging and diagnosis. With the unique capabilities of AI, safe, accurate, and efficient imaging solutions can be attained. In fact, AI has recently gained popularity as a useful tool for clinicians [13,14,15,16,17,18]. Over the years, similar to many other fields of research, deep learning (a sub-area of the machine learning field, inspired by the architecture of the brain [19]) approach has shown an impressive performance in the field of medical image processing [4]. By applying deep learning techniques, it is possible to draw meaningful results from medical data [15,20]. By benefiting from deep learning capabilities like image recognition and segmentation, detection and diagnosis of diseases like diabetes mellitus, brain tumors, skin cancer, and breast cancer have been both efficient and useful [21,22,23,24,25,26].
Recent studies show that AI-based applications can reduce dependency on the limited (RT-PCR) test kits [27]. Even if the RT-PCR test shows negative results, symptoms can be identified by examining chest radiological imaging, namely, chest X-ray images [28,29]. X-ray machines are popular injury and disease diagnosis tools in most healthcare facilities and have been widely explored by care centers and hospitals during the extent of the current pandemic [27,30]. From a global perspective, X-ray exams are comparatively affordable in developing countries, with exam costs reaching as low as 5 USD [31]. In developed countries, as an effect of a more costly healthcare infrastructure, X-ray exams may become more expensive, but are often covered by nearly 100 % of public and private health insurance policies in countries like Australia, Canada, Germany, and Japan, and 91 % in the USA [32]. Individual charges and copays range from 0 to 50 USD in those countries [33]. Regarding the common concern of exposure to ionizing radiation from X-rays, individual exams are known to be safe and expose the patient to significantly less ionization than, for instance, Computed Tomography (CT) exams [27].
As a result, chest X-ray imaging recently draws attention to the researcher and practitioner for the early diagnosis of COVID-19 patients with pneumonia symptoms [34]. For instance, Chen et al. (2020) used a deep-learning-based model for early detection of COVID-19-related pneumonia using image data from the Renmin Hospital patients at Wuhan University [35]. Narin et al. (2020) describes the use of X-ray images for the coronavirus’ automatic detection by implementing a Deep Convolutional Neural Network, achieving an accuracy of around 98% using the ResNet50 model [4]. Apart from this, Goshal and Tucker (2020) and Wang and Wong (2020) also developed a Convolutional Neural Network (CNN) to classify COVID-19 and Non-COVID-19 cases using X-ray images, with approximately 92.9% and 83.5% accuracy respectively [36,37].
Additionally, there are numerous other recent studies carried out with CT images using severaldeep learning models [38,39,40,41]. Likewise, machine learning (ML) algorithms using numerical/categorical data have also been utilized for the diagnosis of COVID-19. A number of studies [34,39,42] developed machine learning models based on Lasso regression, and multivariate logistic regression for early identification of COVID-19 patients. Some of the more significant factors in these studies were age, temperature, heart rate, blood pressure, fever, sex, uric acid, triglyceride and serum potassium.
Even though the Center for Disease Control and Prevention (CDC) currently does not recommend it, still, many studies in this field of research use Chest radiography or CT scan images to diagnose COVID-19 [43,44]. For instance, a recent report in the journal of Applied Radiology (22 March 2020) [44] claimed that using radiological images alone detects patients with ARDS (also known as acute respiratory distress syndrome [45]) or SARS (also known as severe acute respiratory syndrome [46]), as COVID-19, which is a drawback since the diseases are misclassified. Articles by Greenfieldboyce [47] and Jewell [48] suggested that a patient’s information such as age, gender, temperature, and chronic disease history are significant predictors to identify affected COVID-19 patients. Keeping this in mind, some of the studies in this field of research use (numerical or categorical) information such as age, gender, body temperature, and chronic disease history for diagnosis of COVID-19 as well. For instance, Bai et al. (2020), uses CT images (image data) and a combination of demographics, signs, and symptoms (numerical/categorical data) to establish an Artificial Intelligence (AI) model that predicts patients having mild symptoms with potential malignant progression [49]. However, none of the previous studies considered numerical, categorical, and chest X-ray images in combination. Thus, developing a model comprising of numerical/categorical data coupled with chest X-ray images may create a new reliable alternative to screen patients with COVID-19 symptoms.
Taking these opportunities into account, our study focuses on mixed-data analysis using both image and numerical/categorical data to assist the early diagnosis of COVID-19 patients using a deep learning approach. A deep Multilayer Perceptron-Convolutional Neural network (Deep MLP-CNN) model is proposed, considering the age, gender, temperature, and chest X-ray images of patients. The model was tested under two conditions: a balanced dataset (containing 13 COVID-19 and 13 non-COVID-19 patients), henceforth referred to as Study One, and an imbalanced dataset (containing 112 COVID-19 and 30 non-COVID-19 patients), referred to as Study Two.

2. Dataset and Methodology

We adopted a COVID-19 data set containing both X-ray images and numerical/categorical data for each patient, collected from the open-source GitHub repository shared by Dr. Joseph Cohen [50]. This database is continuously being updated with data shared by several entities around the world and has been used by many studies for detecting COVID-19 patients considering various data mining techniques. At the time of our study, the dataset contains data from 184 different patients with information such as age, gender, temperature, survival, intubation, partial pressure of oxygen dissolved in the blood (PO2) and classification as COVID-19, SARS, Pneumocystis, E. coli, Streptococcus, or “no findings” patients. For simplicity, we have organized the dataset in two groups: COVID-19 patients, and all others as non-COVID-19 patients (Figure 1).
One of the challenges associated with this dataset was the missing data for select parameters across patients. In consideration of that limitation, for Study One (balanced dataset), a small dataset was set up with 13 COVID-19 and non-COVID-19 patients considering age, gender, temperature, and chest X-ray images as variables. Since there were numerous missing entries in the temperature column, only rows with complete information of the aforementioned variables were taken into account. No statistically significant difference (p values were obtained using t-tests (*) and chi-square tests (**)) was found between COVID-19 (6 female, 7 male) and non-COVID-19 (5 female and 8 male) groups in terms of sex distribution (p * = 0.69 > 0.05), mean of age and temperature (p ** = 0.49 > 0.05). Contrarily, the size of the dataset was enlarged by ignoring the “Temperature” column entirely for Study Two. In this case, an imbalanced dataset was constructed with information from 142 patients (112 COVID-19, 30 non-COVID-19) to compare and contrast the model’s performance with the imbalanced class. No statistically significant difference was observed between COVID-19 and non-COVID-19 groups in regards to the sex distribution (p * = 0.34 > 0.05) and the mean of age (p ** = 0.06 > 0.05). Table 1 summarizes the datasets used for both studies.
The implementation of the MLP-CNN models and calculation of computational times took place using the Anaconda modules with Python 3.7, and ran on an office-grade laptop with common specifications (Windows 10, Intel Core I7-7500U, and 16 GB of RAM).

2.1. Proposed Model

Neural Networks (NN) recently showed more promising results over traditional machine learning (ML) algorithms like Linear regression, Logistic regression, and Random Forest, with high dimensional datasets, primarily when they contains combined numerical, categorical, and image data [51]. Classical ML approaches may perform better with a small dataset as it is computationally inexpensive and easily interpretable. However, once the size of the data increases (big data), handling such big data becomes challenging for traditional ML approaches. Conversely, deep NN methods guarantee an opportunity to develop a more robust model that perform well on both small and large datasets, mainly due to recent advancements in different NN approaches such as transfer learning, Recurrent Neural Network (RNN), and CNN. Additionally, classical ML approaches often require sophisticated feature engineering or dimensionality reduction [52]. In contrast, deep NN methods: provide better feature engineering methods, can be implemented directly, and achieve good results [53].
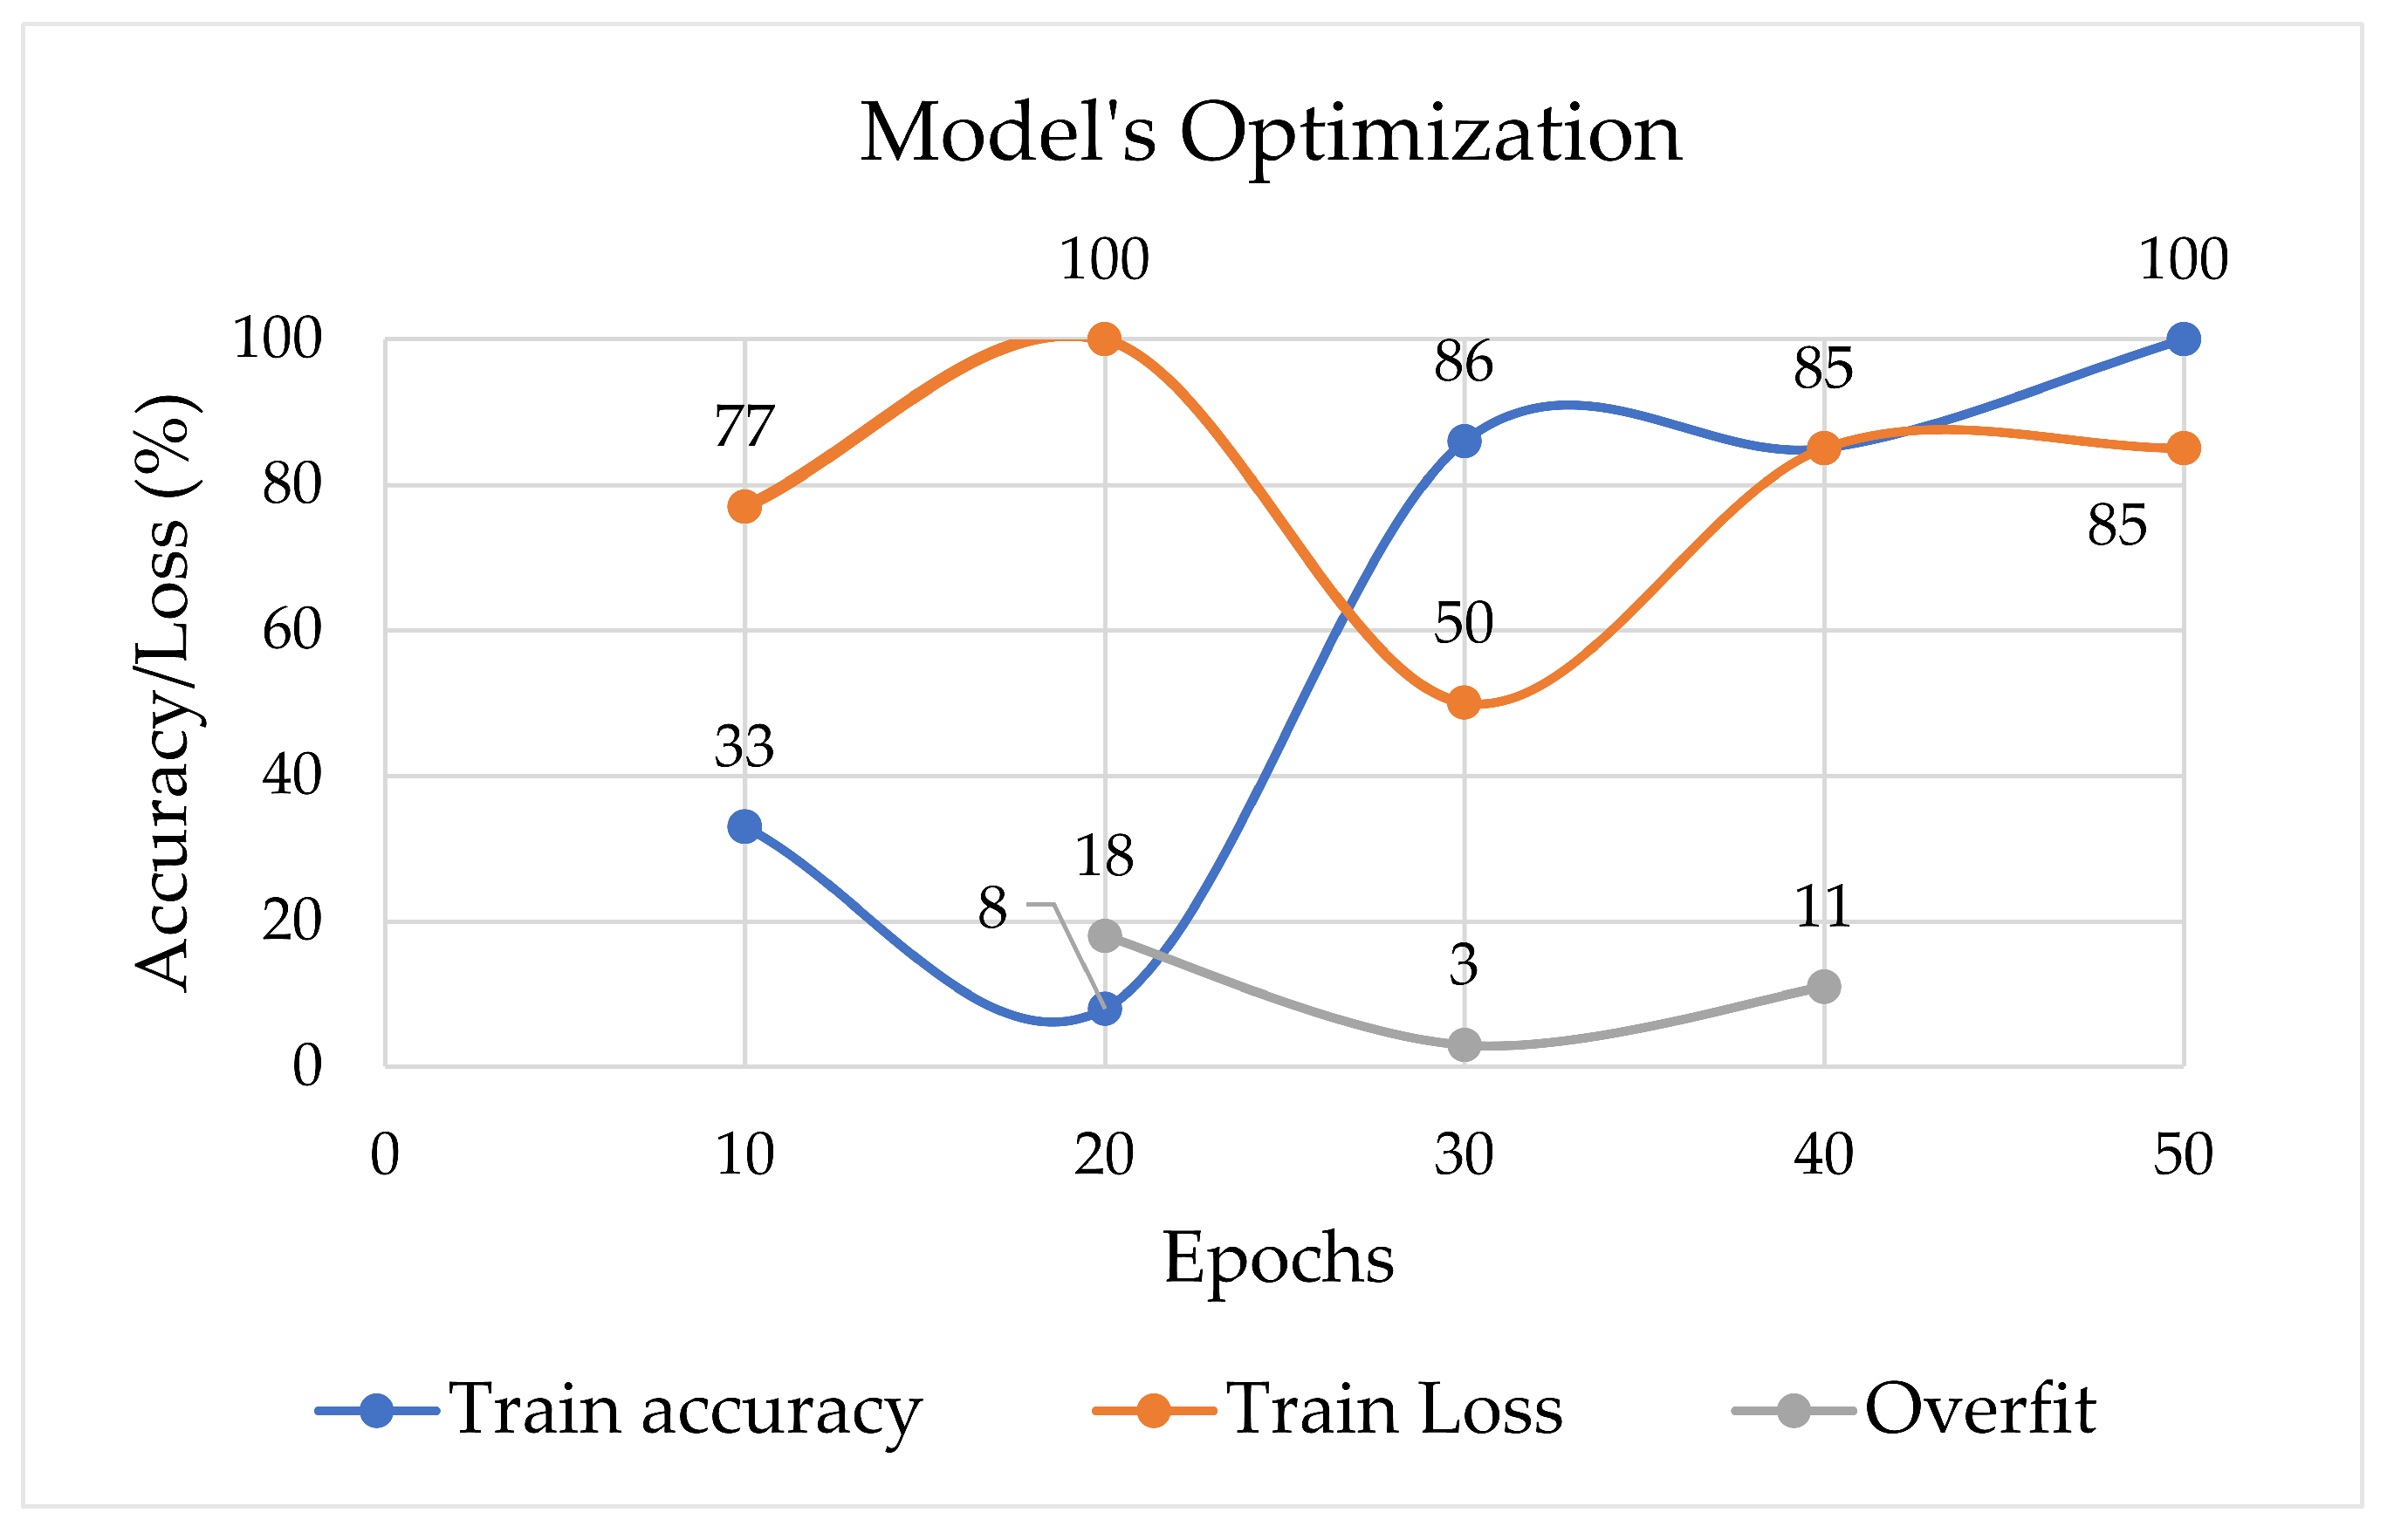
We developed a deep learning-based model inspired from [54]. Our choice for this architecture was motivated by its predictive performance on visual and textual features, addressed in many recent papers [55,56,57,58]. Our proposed model is a combination of a Multilayer Perceptron (MLP) and Convolutional Neural Network (CNN). On one hand, MLP was used to handle the numerical/categorical data; on the other, CNN was used to extract features from the X-ray images. Parameter tuning was performed to improve the model’s performance, mainly: the number of hidden layers, number of neurons, epochs, and the batch size. At first, hidden layers and the number of neurons were set randomly; however, the optimal parameters were later determined using the grid search method. The optimized parameters using the grid search method were as follows: Learning Rate = 0.001, Batch Size = 5, Epochs = 50. Finally, the proposed MLP model was combined with the CNN architecture, as suggested by [54]. As shown in Figure 2, the highest accuracy (100%) was achieved on 50 epochs, while the training loss was minimized up to 85%.
Table 2 shows how different numbers of neurons and hidden layers affect the MLP models. Based on our experiment, with two hidden layers and four neurons, it is possible to achieve 100% accuracy while reducing the loss up to 100%.
In order to obtain the best model, optimization algorithms needed to be applied during the training phase [59]. For that purpose, we have tested three popular optimization algorithms: adaptive learning rate optimization algorithm (Adam) [60], stochastic gradient descent (Sgd) [61], and root mean square propagation (Rmsprop) [62].

2.2. How Our Proposed MLP-CNN Model Works

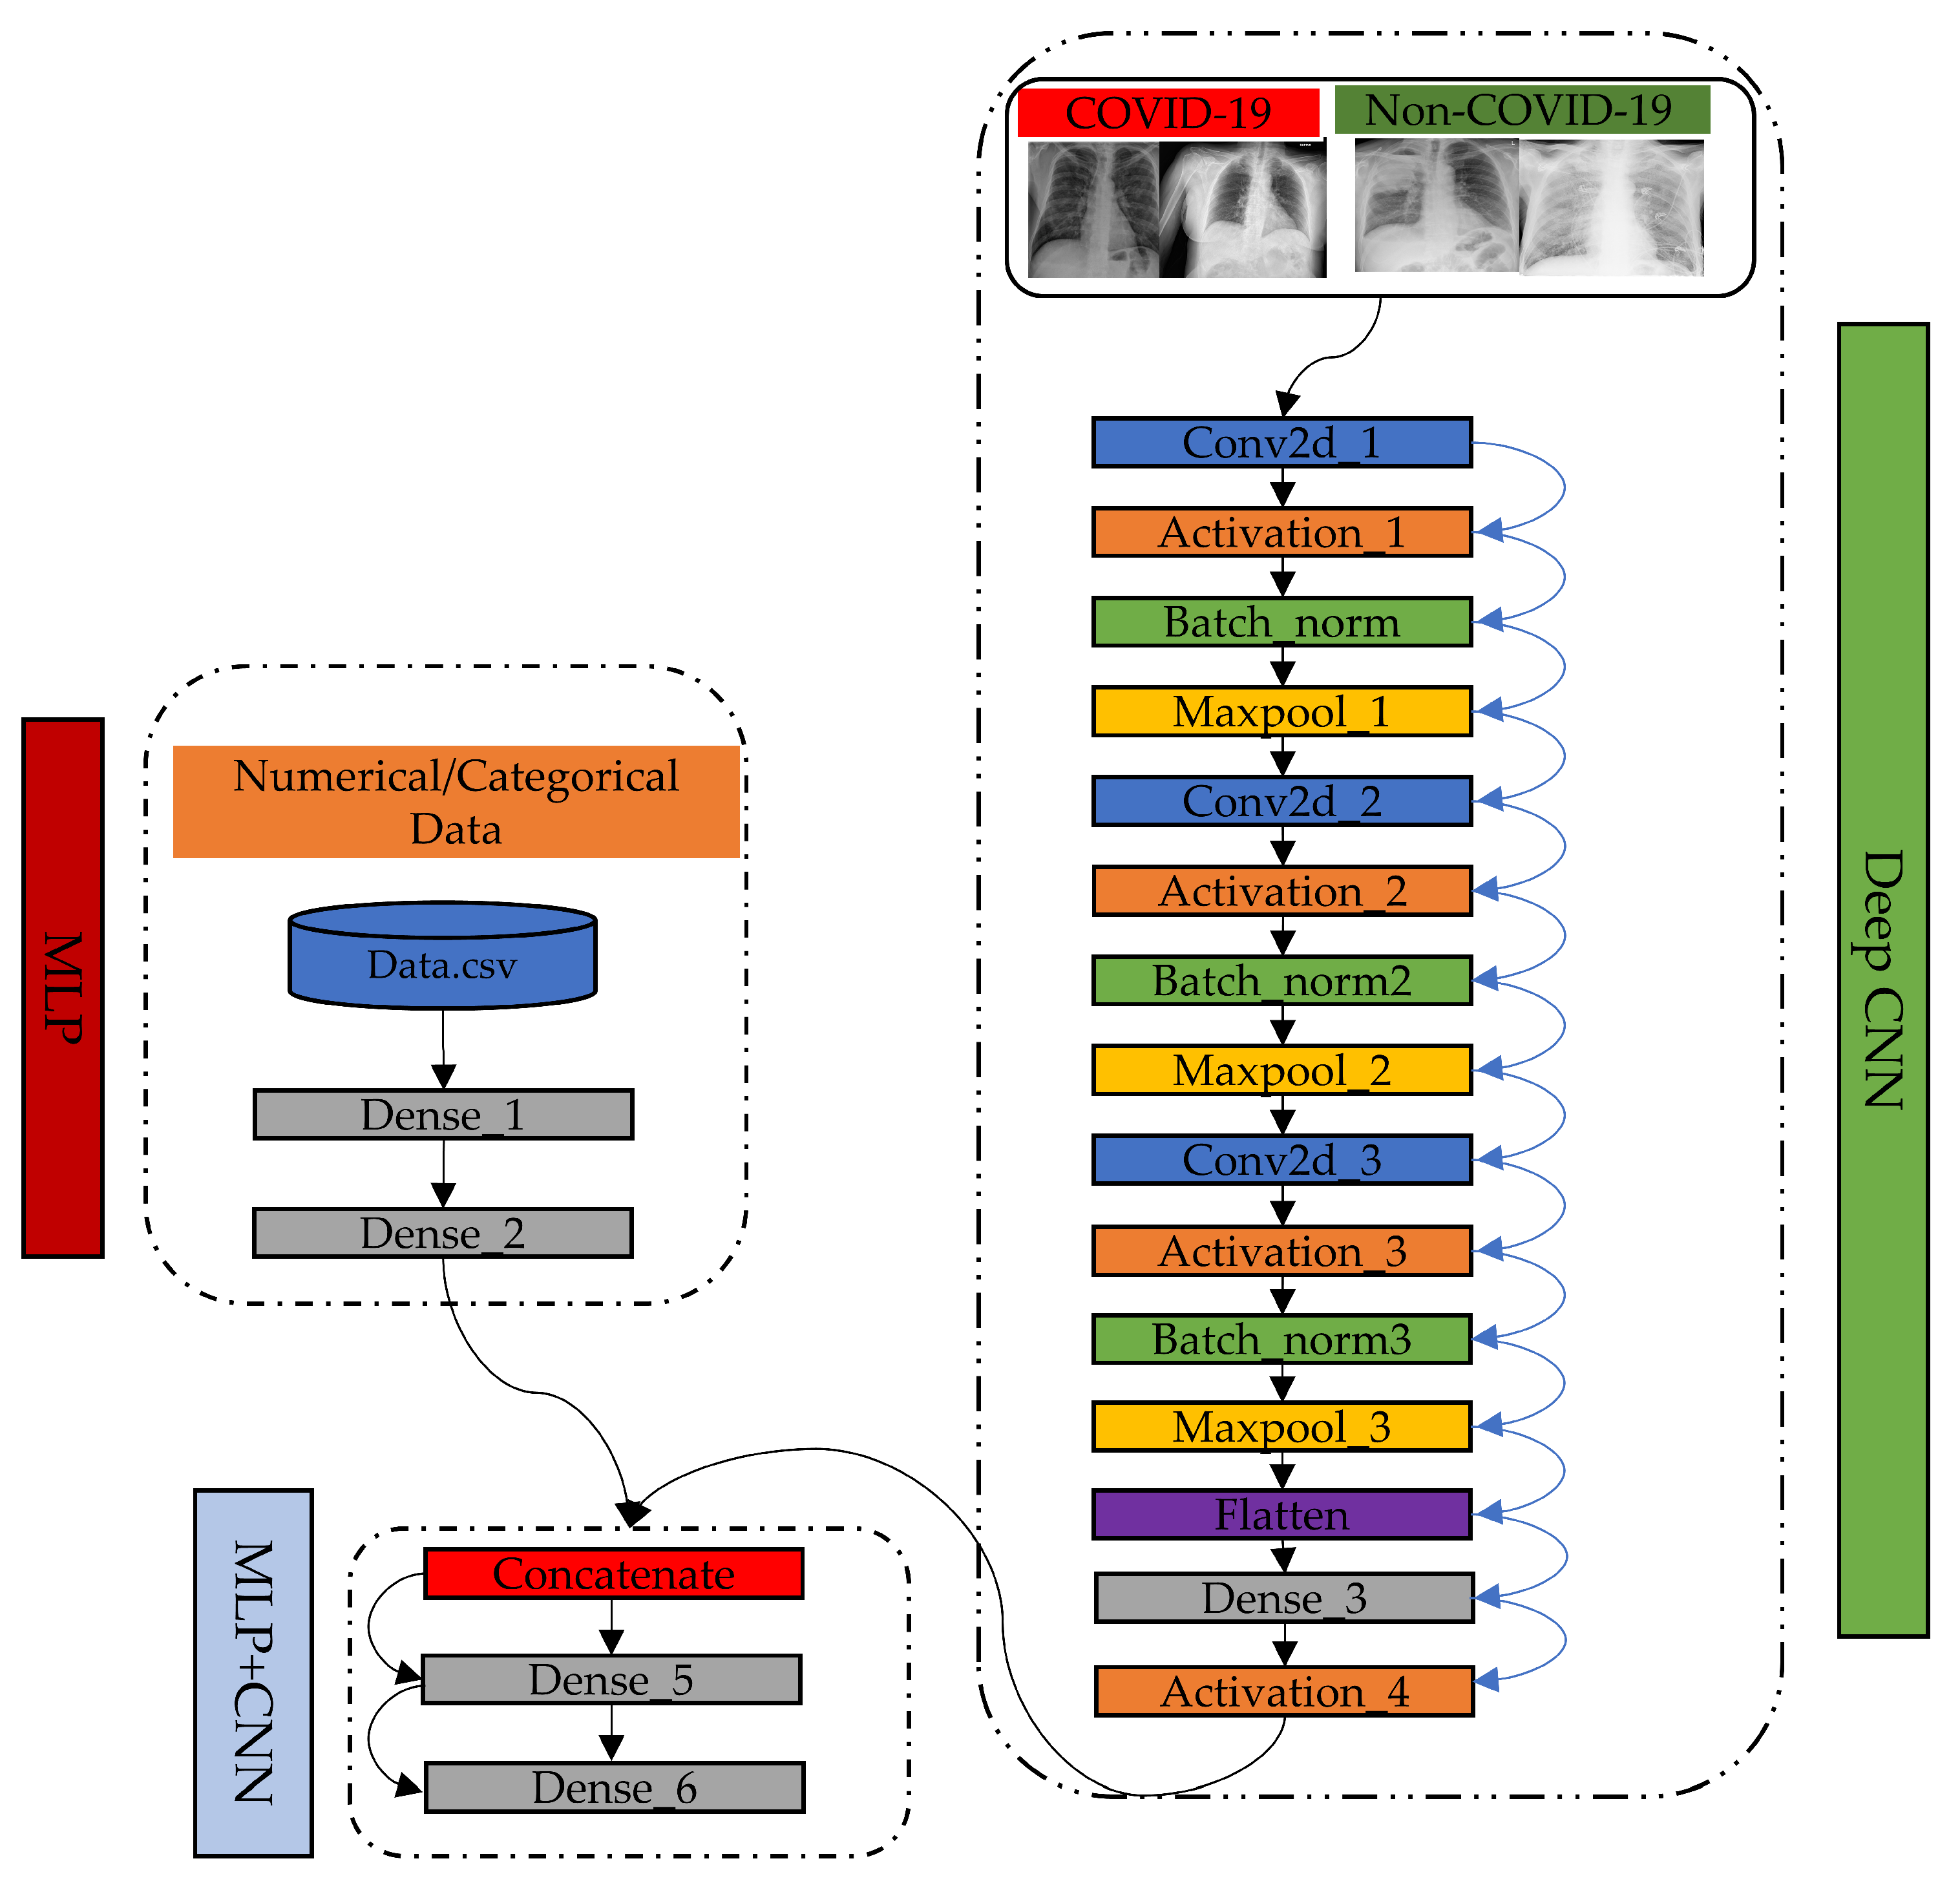
We applied the Rectified Linear Unit (ReLU) as the activation of each neuron in the input and hidden layers and utilized the “linear” function in the final layer [63]. The first input layer of the MLP consists of eight neurons and takes the numerical/categorical data as a one-dimensional array. The hidden layer consists of four neurons and the final layer consists of one neuron. Secondly, the proposed CNN model contains three convolution layers, along with three pooling layers (Max Pooling). The first hidden layer is a convolutional layer with 16 feature maps, each with a kernel size of 64 pixels and a “ReLu” activation function. Then, we have defined the pooling layer that takes the maximum value, configured with a pool size of (2,2). The following pooling layer is a dense layer that takes 16 neurons, succeeded by activation function-ReLU. The next layer is another dense layer with four neurons. Two individual outputs emerged from two separate models—one from the MLP model and the other from the CNN model. Both outputs are concatenated and considered as a single input. The newly acquired single input was counted as an initial input followed by additional two dense layers consisting of four neurons. The Keras functional API was utilized to concatenate the MLP and the CNN models, as it provides a potential opportunity to develop models with multiple inputs and outputs. Typically, such models merge inputs from different layers using an additional layer and combine several tensors, as shown in Figure 3, which illustrates the overall diagram of our proposed end-to-end model. In summary, we have encoded the numerical/categorical inputs and the chest X-ray input as vector inputs, then concatenated these vectors. Finally, the output layer has one neuron for the two classes and a linear activation function to provide probability-like predictions for each class.

2.3. Experiment Setup

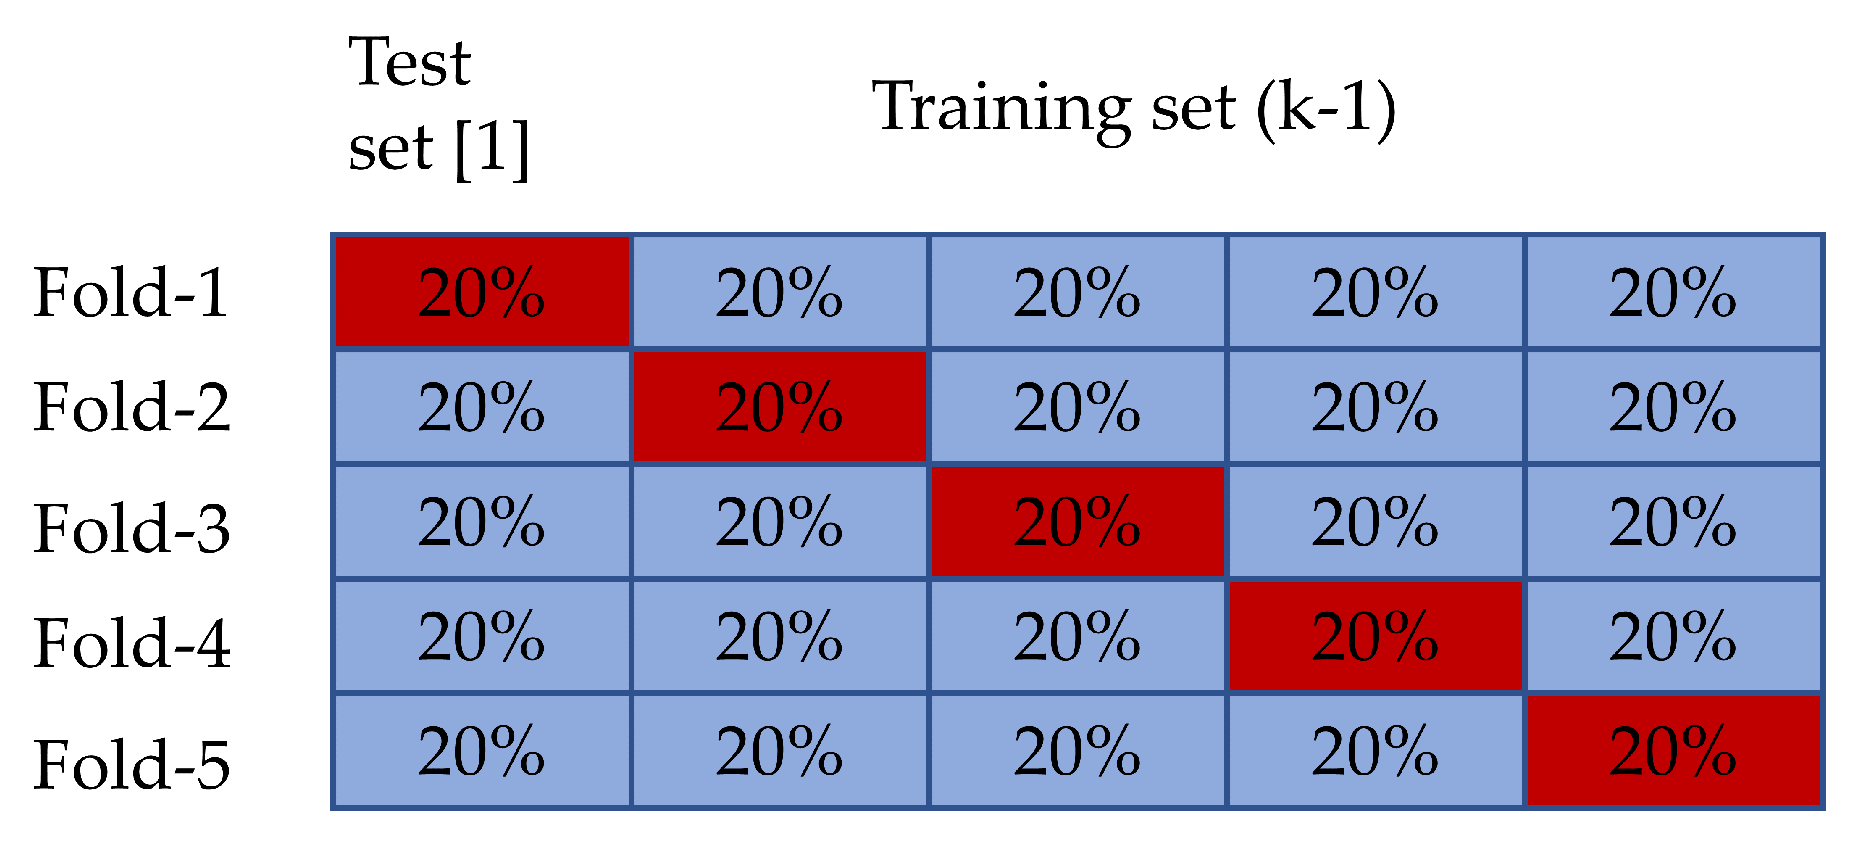
The performance of the model was evaluated using 5-fold cross-validation for both Studies (Study One and Study Two). The experiment was repeated five times (as shown in Figure 4), and the overall performance of the model is computed by averaging the outcomes of all the 5 folds.
The results were presented in terms of accuracy, precision, recall, and F1 score with 95 % confidence interval [64].
A c c u r a c y = t p + t n t p + t n + f p + f n
P r e c i s i o n = t p t p + f p
R e c a l l = t p t n + f p
F 1 = 2 × P r e c i s i o n × R e c a l l P r e c i s i o n + R e c a l l
where:
  • True Positive ( t p )= COVID-19 patient classified as patient
  • False Positive ( f p )= Healthy individuals classified as patient
  • True Negative ( t n )= Healthy individuals classified as healthy
  • False Negative ( f n )= COVID-19 patients classified as healthy

3. Computational Results

At first, as means of identifying appropriate training and testing set ratios for validation, we have split our data into the following training set/testing set ratios: 75:25, 70:30, 60:40, 85:15, and 80:20. Such split ratios are commonly used in deep learning techniques for model evaluation and validation [65,66,67]. The best results in terms of training and testing accuracy were found when the dataset was split randomly into 80% and 20% for training and testing sets, respectively. To exemplify that, Table 3 presents the performance of our proposed models with different ratios of randomly split data between training and testing. Since the dataset is comparatively small, reducing training data also reduces the model’s ability to achieve better performance in terms of accuracy. In contrast, increasing the training set with a small number of datapoints for testing is not sufficient to confidently measure the model’s overall performance.
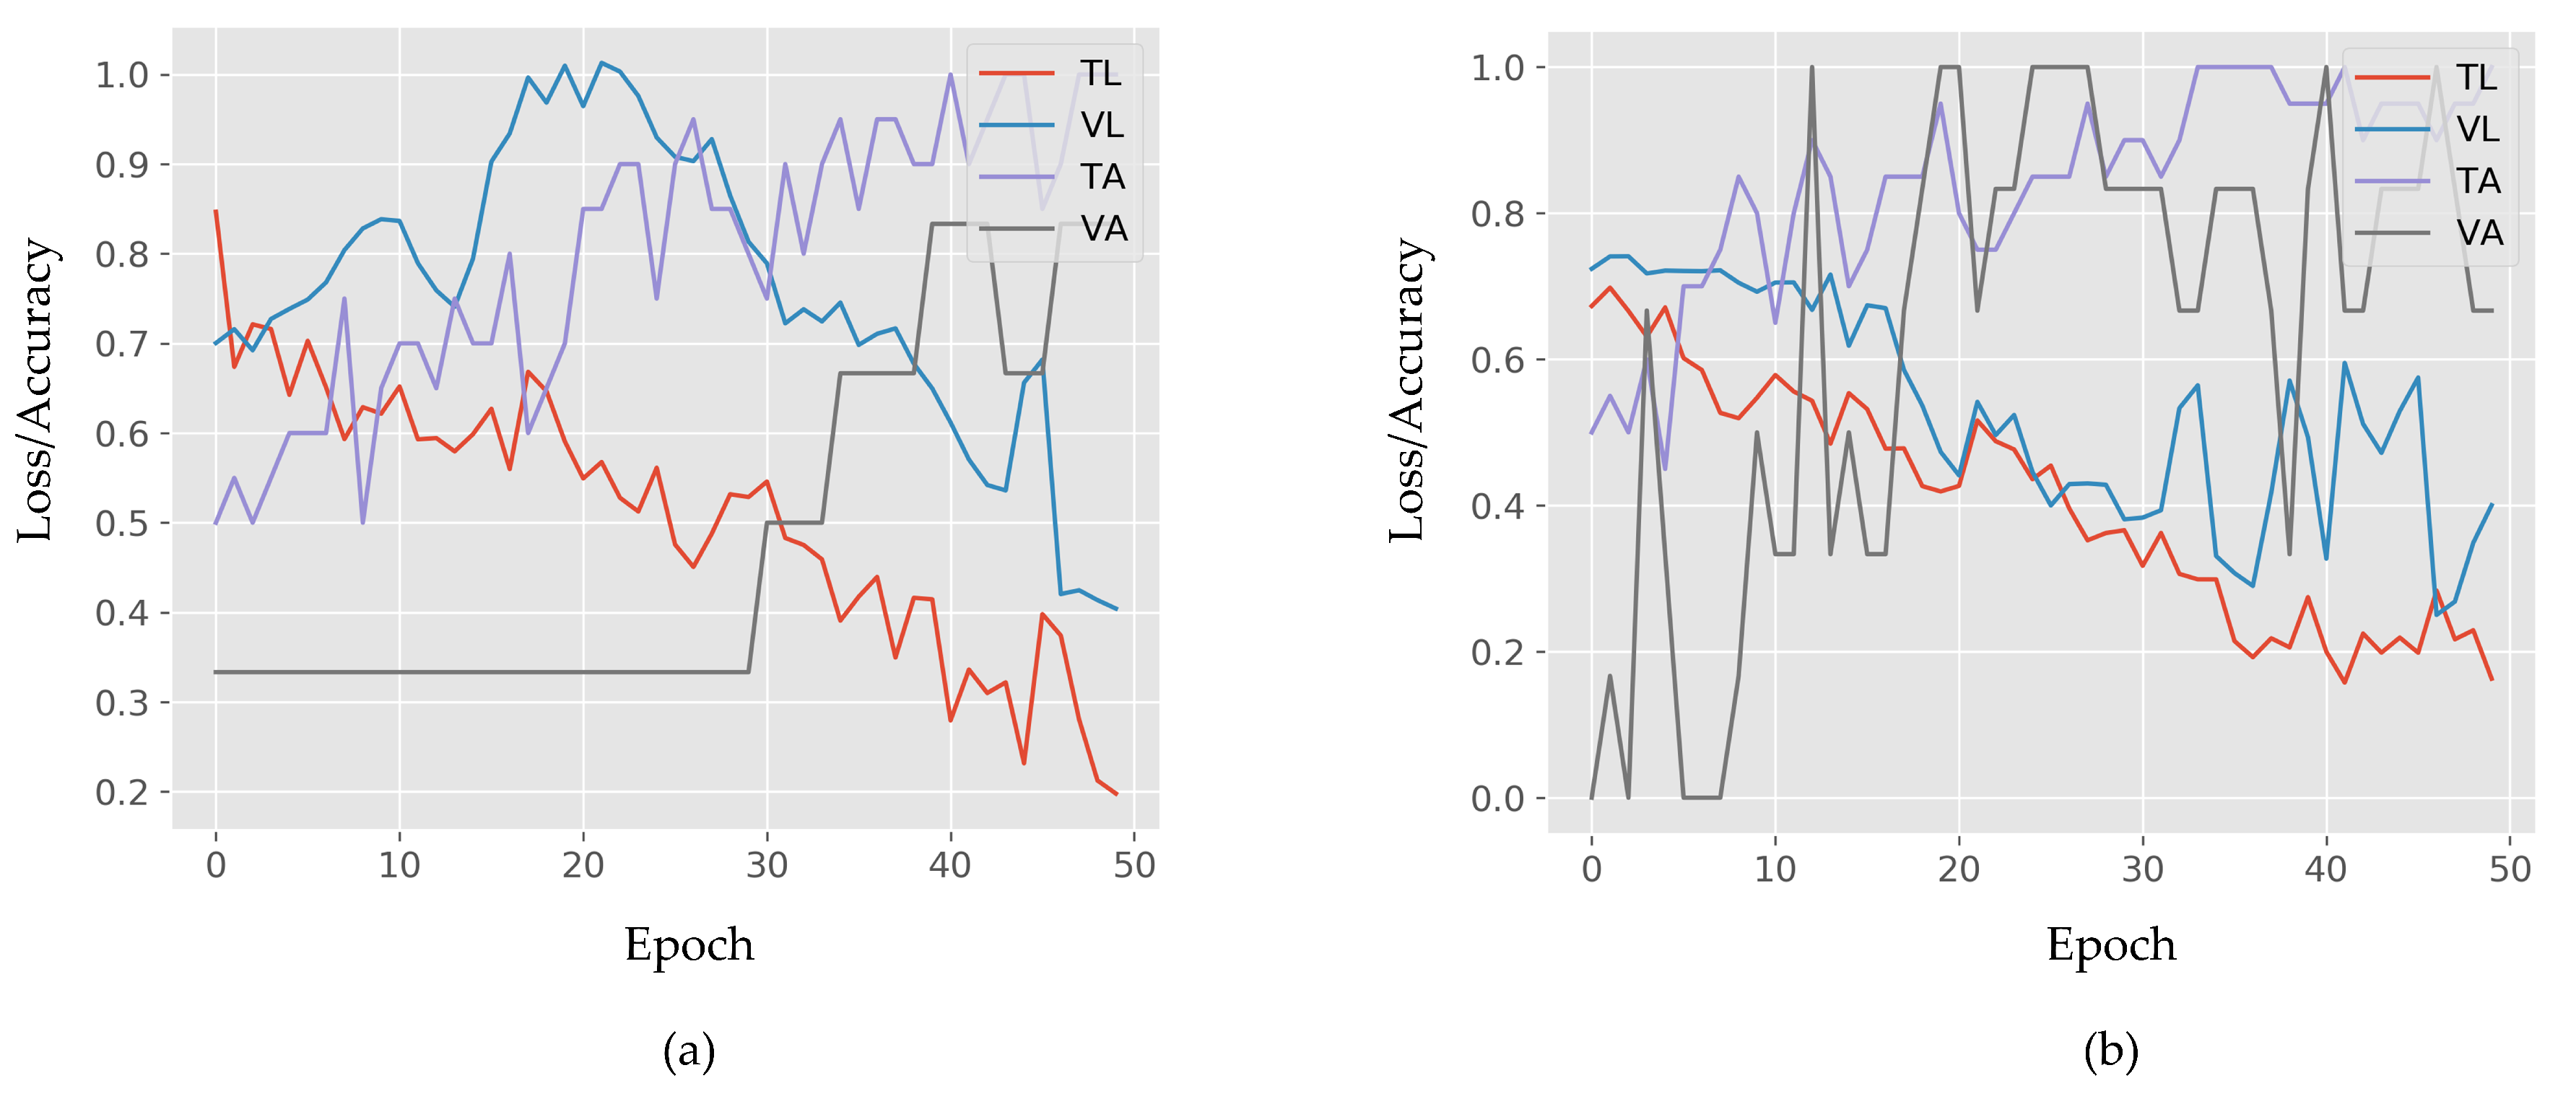
The training stage was carried out up to no more than 50 epochs to avoid overfitting. A graphical illustration of the model’s overall performance using Adam and Rmsprop is presented for the 5th fold in Figure 5.
Each model’s average performance on both balanced (Study One) and imbalanced (Study Two) datasets along with 95% confidence intervals are displayed in Table 4. For the balanced dataset, Adam had the highest accuracy (96.3%), precision (97.2%), recall (96.3%), and F1 score (96.4%) compared to the other two models-trained with Rmsprop and Sgd. Rmsprop outperformed all other models on the imbalanced dataset. While considering the overall performance on both datasets (average of both studies) the model trained with Adam is the best in terms of accuracy (94.6% ± 3.4%), precision (93.5% ± 3.7%), recall (94.5% ± 3.5%), and F1 score (93.5% ± 3.7%).
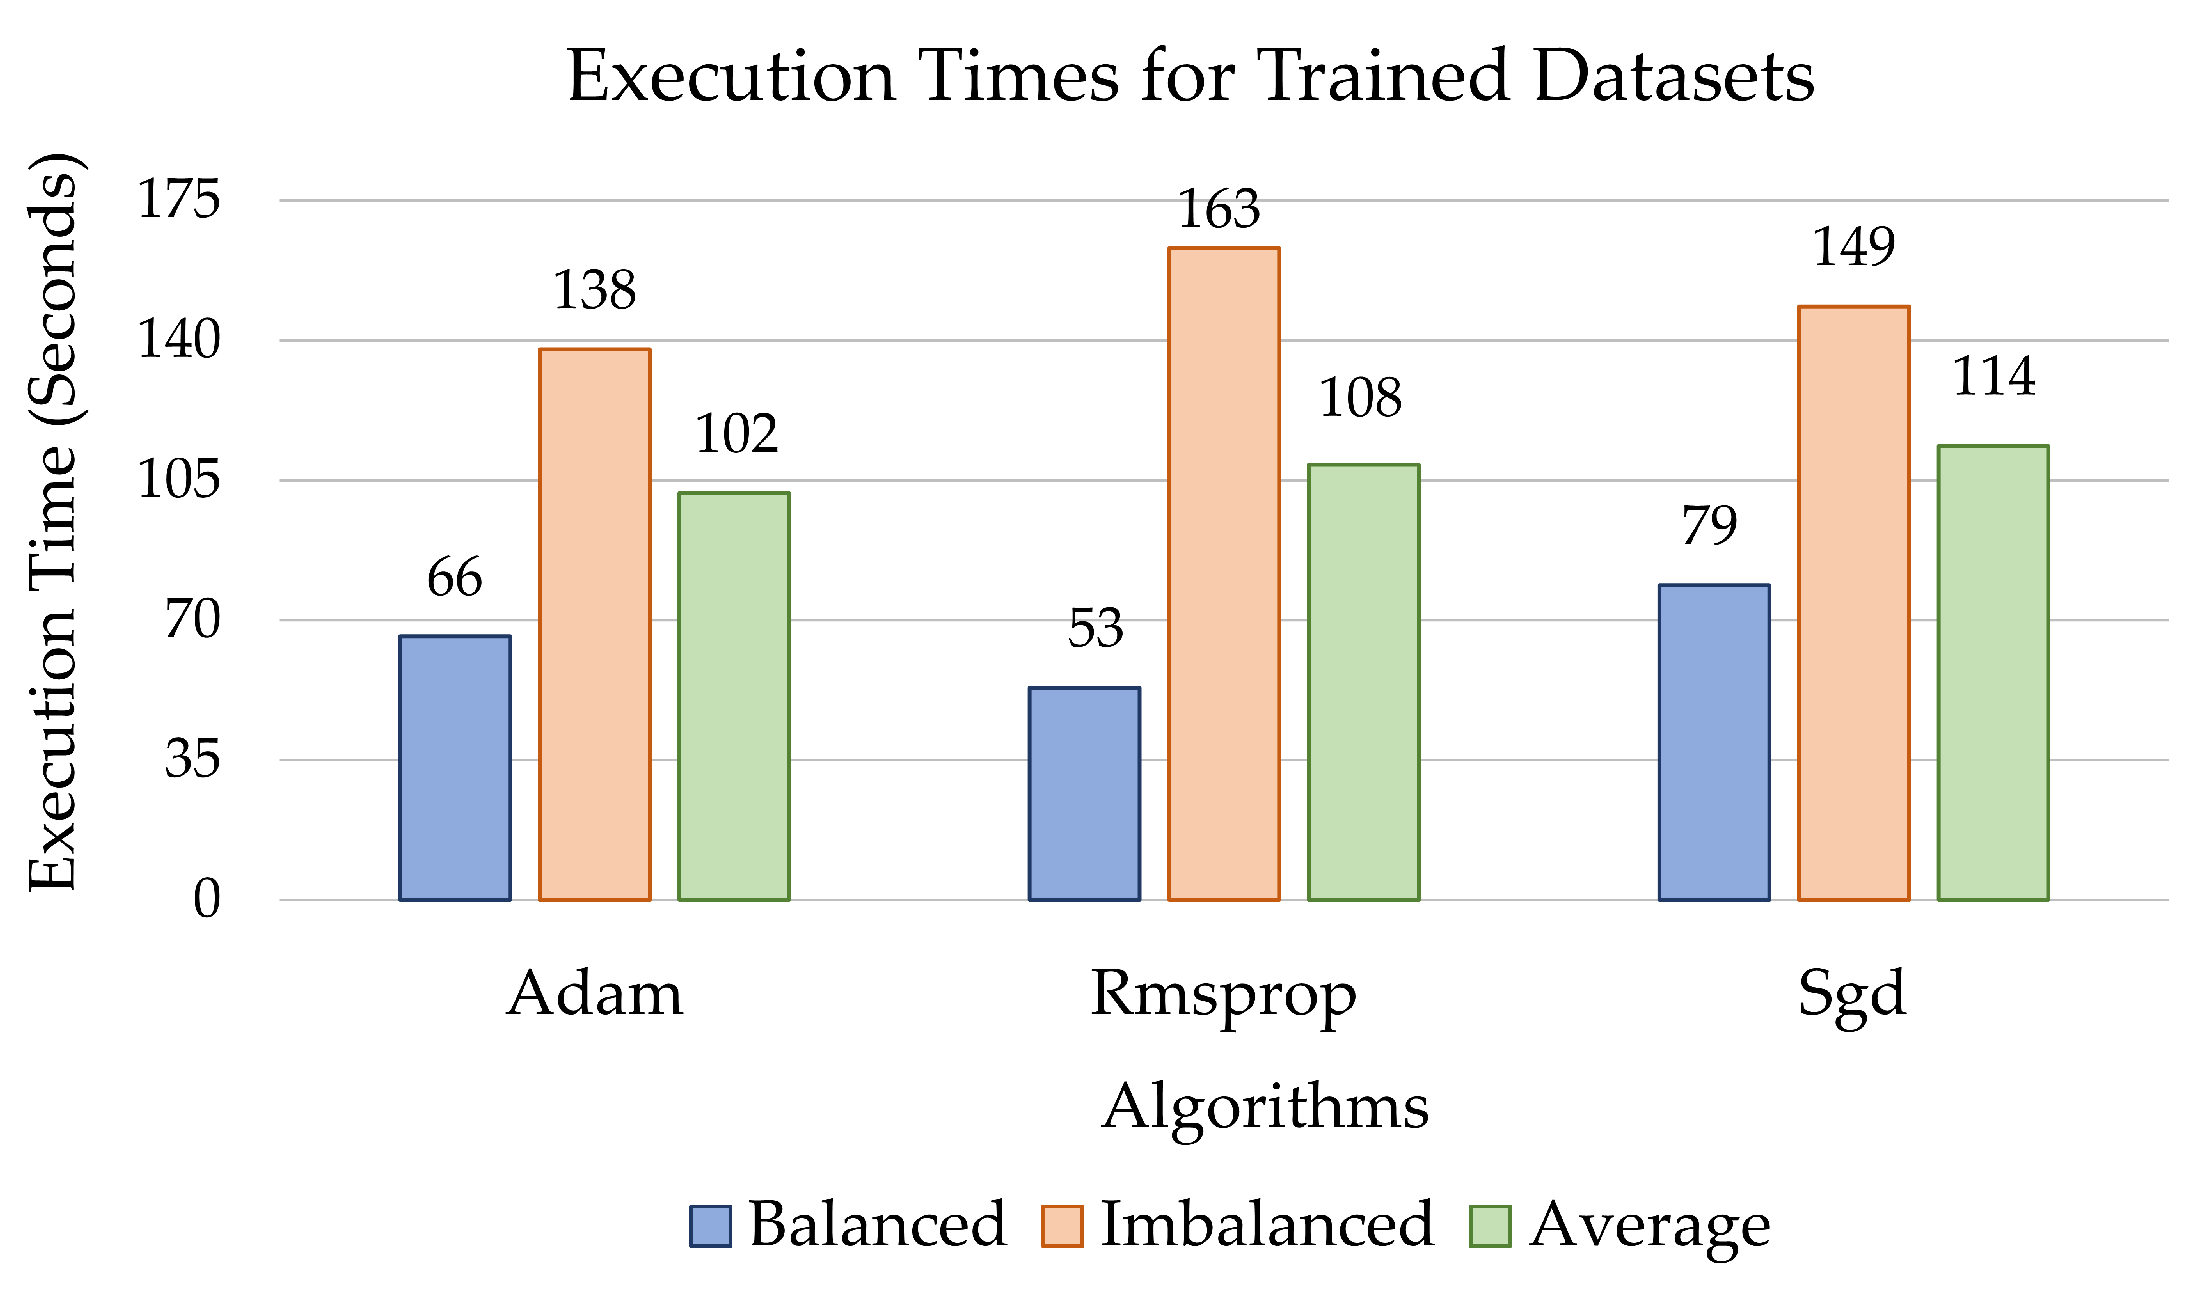
Overall execution time for both datasets is shown in Figure 6. The lowest registered execution time was 53 s for the model trained with Rmsprop in the balanced dataset, whereas the maximum execution time was 79 s when the model was trained with Sgd. Conversely, for the imbalanced dataset, Adam showed the lowest execution time of 138 s, while Rmsprop displayed the maximum execution time of 163 s. In conclusion, when both studies are considered holistically, the average execution time for Adam was lowest in comparison with the other two.
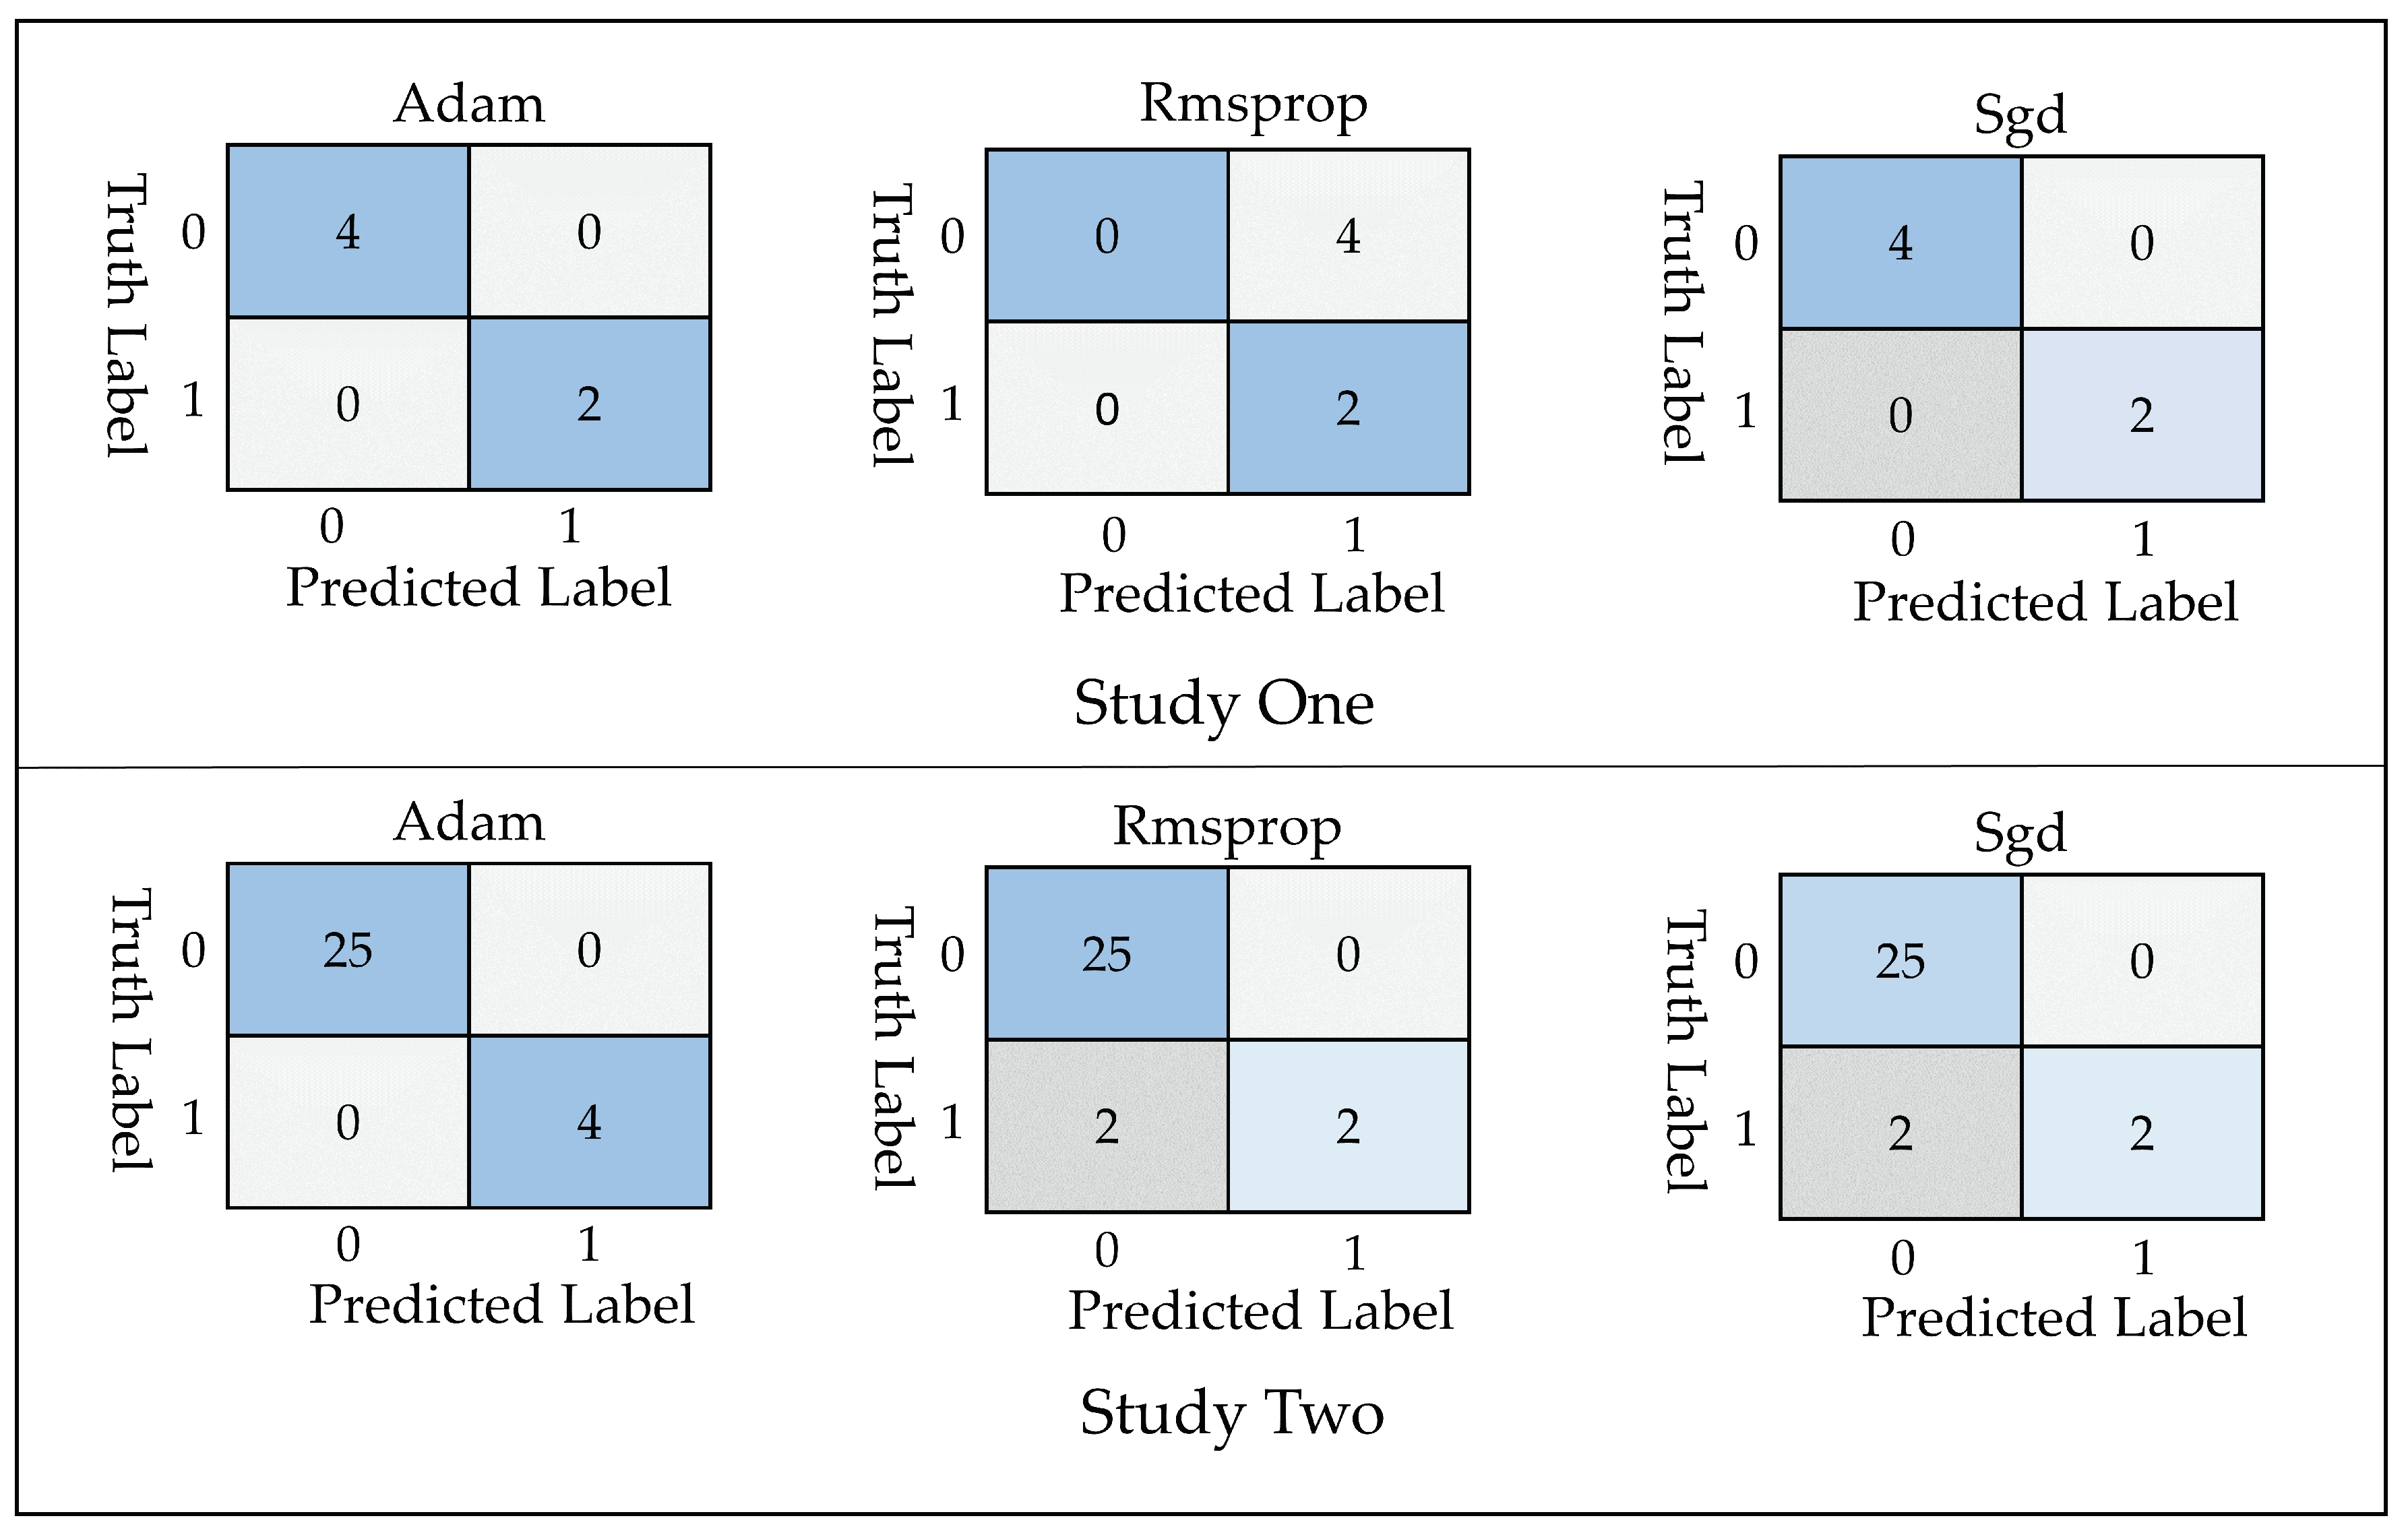
To evaluate the predictive performance of each model, confusion matrices were generated. Figure 7 shows confusion matrices for the models trained with Adam, Rmsprop, and Sgd, respectively, for fold-5. In Study One, the test set contained 6 patients, where 4 were COVID-19, and 2 were non-COVID-19. In this case, both Adam and Sgd correctly classified all the samples, while Rmsprop misclassified 4 out of 6 samples. On the other hand, in Study Two, 29 samples were used for the test set (25 COVID-19 and 4 non-COVID-19). Here, Adam illustrated the best performance by correctly classifying 29 samples, while Rmsprop and Sgd show the worst performance by classifying 27 samples out of 29.

4. Discussion

In this study, we proposed and evaluated an MLP-CNN based model that can distinguish between patients with and without COVID-19, and demonstrated the advantage of combined MLP-CNN models over traditional CNN or MLP used exclusively for that purpose. Our combined model achieved an accuracy of around 96.3 (using Adam optimization algorithm) in comparison to few published studies that used only CNN [36,37,39] or traditional ML [41] approaches. On the one hand, MLP models are fast and time-efficient when used with numerical and/or categorical data only. On the other hand, CNN models are notably more accurate in extracting useful features from chest X-ray images for respiratory disease diagnosis. For instance, Wang and Wong [37] and Khan et al. [68] used CNN-based approaches to detect the onset of COVID-19 disease using chest X-ray images and achieved an accuracy of 83.5% and 89.6%, respectively. In comparison, as previously stated, our combined model demonstrated an accuracy of around 95.4%.
In Study One, our model learned from only 26 COVID-19 subjects, which represents 18% of the data used by Zhang et al. [69] and 2% by Shi et al. [41] (see Table 5 and Table 6). Therefore, our proposed model may be used as a useful computer-aided diagnosis tool for low-cost and fast COVID-19 screening considering small datasets.
Additionally, our model performed better with an imbalanced dataset compared to recent studies [37,38,39,40,41] that also used imbalanced datasets (Table 6). For instance, Jin et al. [38] used 1882 CT scan images where the data ratio was 1:2.78 (497 COVID-19:1385 other) and achieved 94.1% accuracy. Similarly, the data ratios of a range of other recent studies, particularly Song et al. (2020) [39], Butt et al. (2020) [40], and Shi et al. (2020) [41] were 1:2.11, 1:1.82, and 1:1.62 respectively; while their measured accuracies were 82.9%, 86.7% and 90.7%, accordingly. For the imbalanced dataset, we used 112 COVID-19 and 30 non-COVID-19 patients’ (ratio 1:3.73) chest X-ray images. Even with a higher ratio of imbalance in our dataset, it outperformed several recent similar studies [37,38,39,40,41] by achieving a higher accuracy of 95.4%. It should be noted that all studies mentioned in Table 6 used only image data in their experiments, while we considered a mixed-data approach, using both numerical/categorical and image data.
In summary, we have proposed an MLP-CNN based model that can determine between COVID-19 and non-COVID-19 patients using information like age, gender, temperature, and chest X-ray images. Both balanced and imbalanced data were considered for the experiments, achieving an average accuracy of around 95% (96.3% from Study One and 95.4% from Study Two).
Finally, our model can be easily adopted by healthcare professionals as it is cost and time-effective, which accelerates COVID-19 screening procedures and enables patients with the disease to be isolated at earlier stages. Real-time screening of COVID-19 patients using MLP-CNN approaches might be possible with minimal human interaction, provided that chest X-ray images and other relevant information such as age, gender, and temperature of the respective patients are available. Additionally, AI-based screenings can be tailored to a low degree of complexity to the end user, and may not require the training of technicians in the complex computational tools herein described. We identify the following limitations of our study, which present immediate opportunities for future investigations:
  • the size of the dataset adopted is comparatively small, and
  • only four numerical and categorical parameters were considered.

5. Conclusions

In this study, we proposed an MLP-CNN based model for early diagnosis of patients with COVID-19 symptoms considering mixed input data, specifically numerical/categorical data (age, gender, and temperature) and image data (chest X-ray images). Our results have shown that using input data of mixed nature enables the development of highly accurate models with small and balanced datasets (96.30% accuracy) for COVID-19 patient identification. Moreover, on larger and imbalanced datasets, our model performed notably well (95.4% accuracy) compared to similar models proposed by other authors, as shown in Table 6.
In conclusion, our study provides valuable insights into the development of a more robust screening system that supports healthcare providers in the identification of COVID-19 patients, such that individuals carrying the disease can be screened and isolated at an earlier stage. Our contributions are in line with the focus areas of global-scale initiatives such as the Rapid Assistance in Modelling the Pandemic (RAMP) [70] and associated literature focusing on the modeling of the pandemic. Specifically, we have developed a tool that partially addresses key points and opportunities in COVID-19 research, especially those with respect to medical care and monitoring of the contagion, as discussed by Bellomo et al. (2020) [71]. Future studies should reapply these methods in larger datasets with more images and complete patient information, work with highly imbalanced data, apply mixed-data analysis using kernel methods, and consider data containing the geographical location of patients.

Author Contributions

Conceptualization—M.M.A. and T.E.A.; methodology—M.M.A., T.E.A., T.T. and P.H.; software—M.M.A.; validation—P.H. and T.T.; formal analysis—P.H.; investigation—T.T.; writing—original draft preparation—M.M.A. and T.E.A.; writing—review and editing—P.H., T.T., T.E.A.; visualization—M.M.A.; supervision—P.H. and T.T. All authors have read and agreed to the published version of the manuscript.

Funding

This research received no external funding.

Conflicts of Interest

The authors declare no conflict of interest.

References

  1. Roosa, K.; Lee, Y.; Luo, R.; Kirpich, A.; Rothenberg, R.; Hyman, J.; Yan, P.; Chowell, G. Real-Time Forecasts of the COVID-19 Epidemic in China from February 5th to February 24th, 2020. Infect. Dis. Model. 2020, 5, 256–263. [Google Scholar] [CrossRef]
  2. Yan, L.; Zhang, H.T.; Xiao, Y.; Wang, M.; Sun, C.; Liang, J.; Li, S.; Zhang, M.; Guo, Y.; Xiao, Y. Prediction of Criticality in Patients with Severe Covid-19 Infection Using Three Clinical Features: A Machine Learning-Based Prognostic Model with Clinical Data in Wuhan. MedRxiv 2020. [Google Scholar] [CrossRef] [Green Version]
  3. Grasselli, G.; Pesenti, A.; Cecconi, M. Critical Care Utilization for the COVID-19 Outbreak in Lombardy, Italy: Early Experience and Forecast During an Emergency Response. JAMA 2020, 323, 1545–1546. [Google Scholar] [CrossRef] [PubMed] [Green Version]
  4. Narin, A.; Kaya, C.; Pamuk, Z. Automatic Detection of Coronavirus Disease (covid-19) Using x-ray Images and Deep Convolutional Neural Networks. arXiv 2020, arXiv:2003.10849. [Google Scholar]
  5. Dashbord. Covid-19 WorldMeter. August 2020. Available online: https://www.worldometers.info/coronavirus/ (accessed on 30 August 2020).
  6. Yuen, K.S.; Ye, Z.W.; Fung, S.Y.; Chan, C.P.; Jin, D.Y. SARS-CoV-2 and COVID-19: The Most Important Research Questions. Cell Biosci. 2020, 10, 1–5. [Google Scholar] [CrossRef] [PubMed] [Green Version]
  7. Liang, T. Handbook of COVID-19 Prevention and Treatment; Compiled According to Clinical Experience; The First Affiliated Hospital, Zhejiang University School of Medicine: Hangzhou, China, 2020. [Google Scholar]
  8. Zhao, W.; Zhong, Z.; Xie, X.; Yu, Q.; Liu, J. Relation Between Chest CT Findings and Clinical Conditions of Coronavirus Disease (COVID-19) Pneumonia: A Multicenter Study. Am. J. Roentgenol. 2020, 214, 1072–1077. [Google Scholar] [CrossRef]
  9. Mohiuddin, A.K. Covid-19 Situation in Bangladesh. Preprints 2020. [Google Scholar] [CrossRef]
  10. Alam, M.S.; Alam, M.Z.; Nazir, K.N.H.; Bhuiyan, M.A.B. The Emergence of Novel Coronavirus Disease (COVID-19) in Bangladesh: Present Status, Challenges, and Future Management. J. Adv. Vet. Anim. Res. 2020, 7, 198–208. [Google Scholar] [CrossRef]
  11. Weron, R. Electricity Price Forecasting: A Review of the State-of-the-Art with a Look into the Future. Int. J. Forecast. 2014, 30, 1030–1081. [Google Scholar] [CrossRef] [Green Version]
  12. Ponta, L.; Puliga, G.; Oneto, L.; Manzini, R. Identifying the Determinants of Innovation Capability with Machine Learning and Patents. IEEE Trans. Eng. Manag. 2020. [Google Scholar] [CrossRef]
  13. Litjens, G.; Kooi, T.; Bejnordi, B.E.; Setio, A.A.A.; Ciompi, F.; Ghafoorian, M.; Van Der Laak, J.A.; Van Ginneken, B.; Sánchez, C.I. A Survey on Deep Learning in Medical Image Analysis. Med. Image Anal. 2017, 42, 60–88. [Google Scholar] [CrossRef] [PubMed] [Green Version]
  14. Ker, J.; Wang, L.; Rao, J.; Lim, T. Deep Learning Applications in Medical Image Analysis. IEEE Access 2017, 6, 9375–9389. [Google Scholar] [CrossRef]
  15. Shen, D.; Wu, G.; Suk, H.I. Deep Learning in Medical Image Analysis. Annu. Rev. Biomed. Eng. 2017, 19, 221–248. [Google Scholar] [CrossRef] [PubMed] [Green Version]
  16. Faust, O.; Hagiwara, Y.; Hong, T.J.; Lih, O.S.; Acharya, U.R. Deep Learning for Healthcare Applications Based on Physiological Signals: A Review. Comput. Methods Programs Biomed. 2018, 161, 1–13. [Google Scholar] [CrossRef] [PubMed]
  17. Murat, F.; Yildirim, O.; Talo, M.; Baloglu, U.B.; Demir, Y.; Acharya, U.R. Application of Deep Learning Techniques for Heartbeats Detection Using ECG Signals-Analysis and Review. Comput. Biol. Med. 2020, 644, 103726. [Google Scholar] [CrossRef]
  18. Rizvi, A.S.; Murtaza, G.; Yan, D.; Irfan, M.; Xue, M.; Meng, Z.H.; Qu, F. Development of Molecularly Imprinted 2D Photonic Crystal Hydrogel Sensor for Detection of L-Kynurenine in Human Serum. Talanta 2020, 208, 120403. [Google Scholar] [CrossRef]
  19. Jakhar, D.; Kaur, I. Artificial Intelligence, Machine Learning and Deep Learning: Definitions and Differences. Clin. Exp. Dermatol. 2020, 45, 131–132. [Google Scholar] [CrossRef]
  20. Greenspan, H.; Van Ginneken, B.; Summers, R.M. Guest Editorial Deep Learning in Medical Imaging: Overview and Future Promise of an Exciting New Technique. IEEE Trans. Med. Imaging 2016, 35, 1153–1159. [Google Scholar] [CrossRef]
  21. Yildirim, O.; Talo, M.; Ay, B.; Baloglu, U.B.; Aydin, G.; Acharya, U.R. Automated Detection of Diabetic Subject Using Pre-Trained 2D-CNN Models with Frequency Spectrum Images Extracted from Heart Rate Signals. Comput. Biol. Med. 2019, 113, 103387. [Google Scholar] [CrossRef]
  22. Saba, T.; Mohamed, A.S.; El-Affendi, M.; Amin, J.; Sharif, M. Brain Tumor Detection Using Fusion of Hand Crafted and Deep Learning Features. Cogn. Syst. Res. 2020, 59, 221–230. [Google Scholar] [CrossRef]
  23. Dorj, U.O.; Lee, K.K.; Choi, J.Y.; Lee, M. The Skin cancer Classification Using Deep Convolutional Neural Network. Multimed. Tools Appl. 2018, 77, 9909–9924. [Google Scholar]
  24. Kassani, S.H.; Kassani, P.H. A Comparative Study of Deep Learning Architectures on Melanoma Detection. Tissue Cell 2019, 58, 76–83. [Google Scholar]
  25. Ribli, D.; Horváth, A.; Unger, Z.; Pollner, P.; Csabai, I. Detecting and Classifying Lesions in Mammograms with Deep Learning. Sci. Rep. 2018, 8, 1–7. [Google Scholar] [CrossRef] [PubMed] [Green Version]
  26. Celik, Y.; Talo, M.; Yildirim, O.; Karabatak, M.; Acharya, U.R. Automated Invasive Ductal Carcinoma Detection Based Using Deep Transfer Learning with Whole-Slide Images. Pattern Recognit. Lett. 2020. [Google Scholar] [CrossRef]
  27. Ozturk, T.; Talo, M.; Yildirim, E.A.; Baloglu, U.B.; Yildirim, O.; Acharya, U.R. Automated Detection of COVID-19 Cases Using Deep Neural Networks with X-ray Images. Comput. Biol. Med. 2020, 121, 103792. [Google Scholar] [CrossRef]
  28. Kanne, J.P.; Little, B.P.; Chung, J.H.; Elicker, B.M.; Ketai, L.H. Essentials for Radiologists on COVID-19: An Update—Radiology Scientific Expert Panel. Radiology 2020. [Google Scholar] [CrossRef] [Green Version]
  29. Fang, Y.; Zhang, H.; Xie, J.; Lin, M.; Ying, L.; Pang, P.; Ji, W. Sensitivity of chest CT for COVID-19: Comparison to RT-PCR. Radiology 2020, 296, 200432. [Google Scholar] [CrossRef] [PubMed]
  30. Haghanifar, A.; Majdabadi, M.M.; Ko, S. COVID-CXNet: Detecting COVID-19 in Frontal Chest X-ray Images using Deep Learning. arXiv 2020, arXiv:2006.13807. [Google Scholar]
  31. National Heart Foundation of Bangladesh. Available online: http://www.nhf.org.bd/hospital_charge.php?id=6 (accessed on 29 August 2020).
  32. Health System Tracker. Available online: https://www.healthsystemtracker.org/indicator/access-affordability/percent-insured/ (accessed on 28 August 2020).
  33. How Much Does an X-ray Cost. Available online: https://health.costhelper.com/x-rays.html (accessed on 28 August 2020).
  34. Meng, L.; Hua, F.; Bian, Z. Coronavirus Disease 2019 (COVID-19): Emerging and Future Challenges for Dental and Oral Medicine. J. Dent. Res. 2020, 99, 481–487. [Google Scholar] [CrossRef] [Green Version]
  35. Chen, J.; Wu, L.; Zhang, J.; Zhang, L.; Gong, D.; Zhao, Y.; Hu, S.; Wang, Y.; Hu, X.; Zheng, B. Deep Learning-Based Model for Detecting 2019 Novel Coronavirus Pneumonia on High-Resolution Computed Tomography: A Prospective Study. MedRxiv 2020. [Google Scholar] [CrossRef] [Green Version]
  36. Ghoshal, B.; Tucker, A. Estimating Uncertainty and Interpretability in Deep Learning for Coronavirus (COVID-19) Detection. arXiv 2020, arXiv:2003.10769. [Google Scholar]
  37. Wang, L.; Wong, A. Covid-net: A Tailored Deep Convolutional Neural Network Design for Detection of Covid-19 Cases from Chest X-ray Images. arXiv 2020, arXiv:2003.09871. [Google Scholar]
  38. Jin, C.; Chen, W.; Cao, Y.; Xu, Z.; Zhang, X.; Deng, L.; Zheng, C.; Zhou, J.; Shi, H.; Feng, J. Development and Evaluation of an AI System for COVID-19 Diagnosis. MedRxiv 2020. [Google Scholar] [CrossRef] [Green Version]
  39. Song, Y.; Zheng, S.; Li, L.; Zhang, X.; Zhang, X.; Huang, Z.; Chen, J.; Zhao, H.; Jie, Y.; Wang, R. Deep Learning Enables Accurate Diagnosis of Novel Coronavirus (COVID-19) with CT Images. MedRxiv 2020. [Google Scholar] [CrossRef] [Green Version]
  40. Butt, C.; Gill, J.; Chun, D.; Babu, B.A. Deep Learning System to Screen Coronavirus Disease 2019 Pneumonia. arXiv 2020, arXiv:2002.09334. [Google Scholar]
  41. Shi, F.; Xia, L.; Shan, F.; Wu, D.; Wei, Y.; Yuan, H.; Jiang, H.; Gao, Y.; Sui, H.; Shen, D. Large-Scale Screening of Covid-19 from Community Acquired Pneumonia Using Infection Size-Aware Classification. arXiv 2020, arXiv:2003.09860. [Google Scholar]
  42. Gong, J.; Ou, J.; Qiu, X.; Jie, Y.; Chen, Y.; Yuan, L.; Cao, J.; Tan, M.; Xu, W.; Zheng, F. A Tool to Early Predict Severe 2019-Novel Coronavirus Pneumonia (COVID-19): A Multicenter Study Using the Risk Nomogram in Wuhan and Guangdong, China. MedRxiv 2020. [Google Scholar] [CrossRef] [Green Version]
  43. COVID-19 Diagnostic Imaging Recommendations. Available online: https://www.appliedradiology.com/articles/covid-19-diagnostic-imaging-recommendations (accessed on 27 June 2020).
  44. ACR Issues Statement for Use of Chest Radiography, CT for Suspected COVID-19 Infection. Available online: https://www.appliedradiology.com/communities/CT-Imaging/acr-issues-statement-for-use-of-chest-radiography-ct-for-suspected-covid-19-infection (accessed on 27 June 2020).
  45. Force, A.D.T.; Ranieri, V.; Rubenfeld, G.; Thompson, B.; Ferguson, N.; Caldwell, E. Acute Respiratory Distress Syndrome. JAMA 2012, 307, 2526–2533. [Google Scholar]
  46. Lau, A.L.; Chi, I.; Cummins, R.A.; Lee, T.M.; Chou, K.L.; Chung, L.W. The SARS (Severe Acute Respiratory Syndrome) Pandemic in Hong Kong: Effects on the Subjective Wellbeing of Elderly and Younger People. Aging Ment. Health 2008, 12, 746–760. [Google Scholar] [CrossRef] [Green Version]
  47. The New Coronavirus Appears to Take A Greater Toll on Men Than on Women. Available online: https://www.npr.org/sections/goatsandsoda/2020/04/10/831883664/the-new-coronavirus-appears-to-take-a-greater-toll-on-men-than-on-women (accessed on 25 June 2020).
  48. Everything You Should Know About the 2019 Coronavirus and COVID-19. Available online: https://www.healthline.com/health/coronavirus-covid-19#symptoms (accessed on 20 June 2020).
  49. Bai, H.X.; Hsieh, B.; Xiong, Z.; Halsey, K.; Choi, J.W.; Tran, T.M.L.; Pan, I.; Shi, L.B.; Wang, D.C.; Mei, J. Performance of Radiologists in Differentiating COVID-19 from Viral Pneumonia on Chest CT. Radiology 2020, 200823. [Google Scholar] [CrossRef]
  50. Cohen, J.P.; Morrison, P.; Dao, L. COVID-19 Image Data Collection. arXiv 2020, arXiv:2003.11597. [Google Scholar]
  51. Nakada, R.; Imaizumi, M. Adaptive Approximation and Estimation of Deep Neural Network to Intrinsic Dimensionality. arXiv 2019, arXiv:1907.02177. [Google Scholar]
  52. Zhou, L.; Pan, S.; Wang, J.; Vasilakos, A.V. Machine Learning on Big Data: Opportunities and Challenges. Neurocomputing 2017, 237, 350–361. [Google Scholar] [CrossRef] [Green Version]
  53. Chollet, F. Deep Learning with Python; Apress: Berkeley, CA, USA, 2017. [Google Scholar]
  54. Ahmed, E.; Moustafa, M. House Price Estimation from Visual and Textual Features. arXiv 2016, arXiv:1609.08399. [Google Scholar]
  55. Law, S.; Paige, B.; Russell, C. Take a Look Around: Using Street View and Satellite Images to Estimate House Prices. ACM Trans. Intell. Syst. Technol. (TIST) 2019, 10, 1–19. [Google Scholar] [CrossRef] [Green Version]
  56. Wang, F.; Zou, Y.; Zhang, H.; Shi, H. House Price Prediction Approach Based on Deep Learning and ARIMA Model. In Proceedings of the 2019 IEEE 7th International Conference on Computer Science and Network Technology (ICCSNT), Dalian, China, 19–21 October 2019; pp. 303–307. [Google Scholar]
  57. Koch, D.; Despotovic, M.; Leiber, S.; Sakeena, M.; Döller, M.; Zeppelzauer, M. Real Estate Image Analysis—A Literature Review. J. Real Estate Lit. 2019, 27, 269–300. [Google Scholar]
  58. Kumar, E.S.; Talasila, V.; Rishe, N.; Kumar, T.S.; Iyengar, S. Location Identification for Real Estate Investment Using Data Analytics. Int. J. Data Sci. Anal. 2019, 8, 299–323. [Google Scholar] [CrossRef]
  59. Sutskever, I.; Martens, J.; Dahl, G.; Hinton, G. On the Importance of Initialization and Momentum in Deep Learning. In Proceedings of the International Conference on Machine Learning, Atlanta, GA, USA, 16–21 June 2013; pp. 1139–1147. [Google Scholar]
  60. Kingma, D.P.; Ba, J. Adam: A method for Stochastic Optimization. arXiv 2014, arXiv:1412.6980. [Google Scholar]
  61. Zhang, C.; Liao, Q.; Rakhlin, A.; Miranda, B.; Golowich, N.; Poggio, T. Theory of Deep Learning IIb: Optimization Properties of SGD. arXiv 2018, arXiv:1801.02254. [Google Scholar]
  62. Bengio, Y. Rmsprop and Equilibrated Adaptive Learning Rates for Nonconvex Optimization. arXiv 2015, arXiv:1502.04390v1. [Google Scholar]
  63. Tang, Y. Deep Learning Using Linear Support Vector Machines. arXiv 2013, arXiv:1306.0239. [Google Scholar]
  64. Ahsan, M.M. Real Time Face Recognition in Unconstrained Environment; Lamar University-Beaumont: Beaumont, TX, USA, 2018. [Google Scholar]
  65. Mohanty, S.P.; Hughes, D.P.; Salathé, M. Using Deep Learning for Image-Based Plant Disease Detection. Front. Plant Sci. 2016, 7, 1419. [Google Scholar] [CrossRef] [PubMed] [Green Version]
  66. Menzies, T.; Greenwald, J.; Frank, A. Data Mining Static Code Attributes to Learn Defect Predictors. IEEE Trans. Softw. Eng. 2006, 33, 2–13. [Google Scholar] [CrossRef]
  67. Stolfo, S.J.; Fan, W.; Lee, W.; Prodromidis, A.; Chan, P.K. Cost-Based Modeling for Fraud and Intrusion Detection: Results from the JAM Project. In Proceedings of the DARPA Information Survivability Conference and Exposition, DISCEX’00, Hilton Head, SC, USA, 25–27 January 2000; Volume 2, pp. 130–144. [Google Scholar]
  68. Khan, A.I.; Shah, J.L.; Bhat, M.M. Coronet: A Deep Neural Network for Detection and Diagnosis of COVID-19 from Chest X-ray Images. Comput. Methods Programs Biomed. 2020, 196, 105581. [Google Scholar] [CrossRef] [PubMed]
  69. Zhang, J.; Xie, Y.; Li, Y.; Shen, C.; Xia, Y. Covid-19 Screening on Chest X-ray Images Using Deep Learning Based Anomaly Detection. arXiv 2020, arXiv:2003.12338. [Google Scholar]
  70. Rapid Assistance in Modelling the Pandemic: RAMP. Available online: https://epcced.github.io/ramp/ (accessed on 8 September 2020).
  71. Bellomo, N.; Bingham, R.; Chaplain, M.A.; Dosi, G.; Forni, G.; Knopoff, D.A.; Lowengrub, J.; Twarock, R.; Virgillito, M.E. A Multi-Scale Model of Virus Pandemic: Heterogeneous Interactive Entities in a Globally Connected World. arXiv 2020, arXiv:2006.03915. [Google Scholar]
Figure 1. Sample set of test images, including the chest X-ray images of COVID-19 and non-COVID-19 patients [50].
Symmetry 12 01526 g001
Figure 2. Training accuracy and loss with number of epochs.
Symmetry 12 01526 g002
Figure 3. Flow diagram of proposed Multilayer Perceptron and Convolutional Neural Network (MLP-CNN) models. The model contains three components: MLP, CNN, and Merged MLP-CNN.
Symmetry 12 01526 g003
Figure 4. A graphical illustration of each of 5-fold cross-validation for the training and testing dataset.
Symmetry 12 01526 g004
Figure 5. Model accuracy and loss in fold 5. TL—train loss; VL—validation loss; TA—train accuracy; VA—validation accuracy. In Study One, the model trained with Adam (a) reached 100 % accuracy and loss decreased by almost 100 % after 50 epochs. Alternatively, for Study Two, the model trained with Rmsprop (b) reached 100 % accuracy and loss decreased below 5%.
Symmetry 12 01526 g005
Figure 6. Execution time of models trained with Adam, Rmsprop, and Sgd for both balanced and imbalanced datasets.
Symmetry 12 01526 g006
Figure 7. Confusion matrix of our models trained with optimization algorithms (Adam, Rmsprop, and Sgd) for both studies at fold 5.
Symmetry 12 01526 g007
Table 1. Balanced and imbalanced datasets used in this study.
DatasetLabelTraining SetTesting SetTotalMean± SDp-Value
Age (Years)Temperature (Celsius)
Study OneCOVID-19941351.29 ± 16.7238.26 ± 0.850.49
(Balanced dataset)Non-COVID-1911213
Study TwoCOVID-19872511255.73 ± 16.660.06
(Imbalanced dataset)Non-COVID-1926430
Table 2. Model performance with different numbers of neurons and hidden layers.
Number of Hidden LayersNeuronAccuracy (%)Loss (%)
144276
1856100
24100100
283576
343377
3864100
Table 3. Proposed MLP-CNN models performance incorporating different amounts of training and testing data in Studies One and Two.
Data Ratio (%)Study OneStudy Two
Training/TestingTraining AccuracyTesting AccuracyTraining AccuracyTesting Accuracy
75/2594%71%90%70%
70/3066%50%95%60%
60/4073%45%70%71%
80/20100%100%100%96%
Table 4. COVID-19 screening performance of our model on Study One and Study Two with 95% confidence interval ( α = 0.05). S 1 —Study One; S 2 —Study Two; CI—Confidence Interval.
AlgorithmAccuracy (%)Precision (%)Recall (%)F1 Score (%)
S 1 S 2 CI S 1 S 2 CI S 1 S 2 CI S 1 S 2 CI
Adam96.392.994.6 ± 3.497.289.993.5 ± 3.796.392.894.5 ± 3.596.490.793.5 ± 3.7
Rmsprop82.595.488.9 ± 4.779.492.585.9 ± 5.382.99588.9 ± 4.879.693.686.6 ± 5.2
Sgd91.885.188.4 ± 4.995.482.188.7 ± 4.891.886.188.5 ± 4.882.483.683 ± 5.7
Table 5. Comparison of the proposed COVID-19 diagnostic method (MLP-CNN) with other deep learning methods developed using chest X-ray images.
ModelAccuracy
Ghoshal and Tucker [36]92.9%
Zhang et al. [69]96%
Wang and Wong [37]83.5%
Proposed model96.3% with Adam
Table 6. Comparison between current literatures with other deep-learning methods developed using imbalanced datasets.
ReferenceData TypeMethodDatabase SizeAccuracy
Jin et al. [38]CTCNN497 COVID-19, 1385 others94.1%
Song et al. [39]CTResNet5088 COVID-19, 186 others82.9%
Butt et al. [40]CTCNN219 COVID-19, 399 others86.7%
Shi et al. [41]CTRF1658 COVID-19, 1027 others90.7%
Wang and Wong [37]X-rayCNN45 COVID-19, 2794 others83.5%
Khan et al. [68]X-rayXception284 COVID-19, 967 others89.6%
Proposed modelX-rayMLP-CNN + Rmsprop112 COVID-19, 30 others95.38%