1. Introduction
Stocks traded on the financial market are often observed as unpredictable and unstable. This is due to the uncertain fluctuations of the daily prices of stocks, which leads to hesitance in the process of selecting the right stocks to invest in [
1,
2,
3]. Dubious investors’ selection preferences due to the hefty identification of the well-balanced interaction between risks and returns also contribute toward indefinite stock selection [
1]. In making investment decisions regarding stock selection, investors usually aim to select stocks when both the risks and the returns are consistent, such that the prior is low and the latter is high [
1,
4]. Stocks providing high returns and low risks are ranked as profitable investments by investors [
3,
4].
In the literature of modern portfolio theory, the initial stock selection approach developed for investment focuses on clustering stocks based on risk tolerance and return expectations [
3,
5,
6,
7,
8]. When employing this approach, risk is measured using variance, while asset return data are assumed to be normally distributed. However, this is misleading, as the risk measures obtained are not consistent with investors’ preferences and the assumption made on the asset return data is invalid for a real market scenario, which are actually left or right-skewed [
2,
9]. Thus, methods based on cluster analysis are presented as alternative stock selection approaches that aim at clustering multiple best stocks simultaneously, otherwise known as the optimal portfolio [
1,
10]. The established clustering analysis-based methods, such as k-means and hierarchical, generally cluster stocks based on the averages of variables involved, where stocks with similar average scores are presumed as having the same performances [
4]. Among the advantages of using these methods in stock clustering are the reduced time taken to develop the optimal portfolio given many diverse stocks, the important investment-related information made available to investors, and the minimal risk level obtained on the optimal portfolio [
7,
8,
11].
In the past two decades, clustering equities (i.e., stock and mutual funds) have received global attention from researchers utilizing numerous clustering techniques to study their local market situations [
4,
6,
10,
11,
12,
13]. A survey conducted by Chen and Huang [
4] on Taiwan’s mutual funds used the k-means clustering method. In the evaluation, the funds were measured based on the return rates, standard deviation, turnover rate, and Treynor index, where the results obtained were clustered into four clustering performance groups—namely, inferior, stable, good, and aggressive. Among the four clustering performance groups, the researchers considered good and aggressive performances as the best group of funds for investment. Similarly, Kiliçman and Sivalingam [
3] used 38 funds to examine the performance of the Malaysian stock market using the return rate, Treynor index, and variance. Employing the same method used by Chen and Huang [
4], Mirnoori and Shariati [
7] studied 39 funds and formed three clusters designated as inferior, good, and aggressive. Although these clustering methods have distinct procedures for obtaining the best stock or optimal portfolio, both achieve equivalent clustering results for investment [
4]. Nevertheless, the performance results obtained by known established methods do not reflect the actual performance of stocks. Actual stock performance depends on its market situations, which are volatile in nature, by taking the outcome using average scores of each variable, although this is deemed to be insufficient when there exist extreme values of returns and risks [
14,
15,
16]. In addition, the average score tends to be influenced by outliers [
17,
18].
In the literature, k-means clustering is the most applied clustering method [
4,
10]. A study on the Indian stock market by Nanda et al. [
10] carried out analysis based on three distinct clustering methods, namely, k-means, self-organizing maps (SOMs), and fuzzy c-means clustering, that were applied to the Markowitz model to generate an efficient portfolio. The results show that k-means clustering is the best clustering method, as it produced 12 clusters. Instead of using the k-means clustering method, Tekin and Gümüş [
6] used the hierarchical clustering method to evaluate the stock performance in Borsa Istanbul. The variables considered were the price per earnings ratio, the market value per book value ratio, the dividend yield, the return on assets, the return on equity, the change in sales and equity, the return on average, the returns, and the risks, producing 12 clusters. Meanwhile, Alqaryouti et al. [
11] studied the Abu Dhabi stocks using the k-means and k-medoids clustering methods, testing 61 stocks and forming four distinct clusters.
K-means clustering is favored among researchers; however, the clustering results of this method depend on the initial value assigned, and this value needs to be predetermined, which is a disadvantage of this method [
17,
18]. This leads to inconsistency in forming clusters, depending on the situation. Another limitation is that the method is sensitive to outliers [
17,
18]. Other research [
12,
19] of cluster stocks was based on the individual stock performance, by comparing the values of the variables considered for each stock one by one. The main reason for evaluating stock performance individually is to consider their effects on fundraising by non-professional investors [
19]. In [
12], the authors evaluated the performance of 10 sectorial stock indices individually, using the Sharpe, Treynor, Jensen alpha, adjusted Sharpe, adjusted Jensen, and Sortino indices. Unfortunately, it is time consuming to analyze stocks one at a time, and thus, this concept is unsuitable for large data sets.
Apart from the variables that are related to stocks, investors’ preferences toward risk-taking have also been considered as one of the most important factors for evaluating stock performance. Shams and Rezvani [
20] investigated investors’ risk aversion and risk taking by ranking the performance of investment companies using three loss aversion indices and comparing the results against the Treynor index. The result shows that the loss aversion behavior of investment companies is influenced by the outcome of previous performances. In [
21], multiple hybrid methods were developed by combining SOM and k-means cluster stocks, the Technique for Order of Preference by Similarity to Ideal Solution (TOPSIS) to rank stocks, and the genetic algorithm to establish different classes of investors with respect to their risk-taking levels.
The established clustering methods in the literature consider several options to ensure that the stocks preferred by investors are good and the best to invest in. Among investors’ preferences studied are stocks that have high return rates, low standard deviation and high Treynor index values [
3,
4], low standard deviations, moderate return rates, moderate turnover ratios, and moderate Sortino index values [
7], or high return rates, high Sharpe index values, high appraisal ratios, high Sortino index values, low standard deviations, and downside risks [
8]. However, investors’ preferences considered by these methods are ambiguous, since such evaluation focuses only on one unknown investor’s selection preference when clustering stock performance. These evaluations are inconsistent with investors’ genuine preferences, which can be either pessimistic or optimistic in nature; thus, clustering methods are unable to track the true performance of stocks [
2,
22]. The inefficiencies of the established clustering methods justify the motivation for this study.
As indicated above, the established clustering methods neglect to take into consideration the importance of diverse investors’ preferences when selecting stocks, and thus are inefficient in accurately clustering stocks. This study extends the works of [
4,
6] by proposing a novel fuzzy clustering method that has the capability to distinctively express investors’ vague preferences which establish clustering methods cannot capture. Furthermore, investors’ diverse preferences, which can be distinguished in various forms, such as pessimistic or optimistic, enhance and complement fuzzy inference systems for developing specific stock selection strategies for different types of investors. A fuzzy inference system was utilized in this study, as it possesses great capability for considering vague decision-makers’ preferences, as well as the uncertainty in the decision-making environment [
23,
24]. In this proposed method, the variables considered were defined as the linguistic inputs, while stock performance was defined as the linguistic output. All defined linguistic inputs were then aggregated using fuzzy rule bases that were developed in accordance with established investors’ preferences on stock clustering. In this case, rule base development is important to achieve rational interaction between the variables and the performances of stocks that are defined linguistically based on investors’ preferences [
23,
24]. As for the output, the proposed method produces two distinct views of investors’ preferences, which are pessimistic and optimistic, with each view consisting of multiple levels of investors’ preferences differentiated based on confidence levels and the frequency of stock performance. The novel differentiation process in this study is the first of its kind to be developed with the objective of assisting investors in selecting the best stock to invest, given their preferences. For efficiency purposes, the results obtained from the analysis of this proposed method were compared against the established clustering methods.
The rest of the paper is structured as follows.
Section 2 explains the development of the novel proposed fuzzy clustering method.
Section 3 presents a case study on clustering 30 Syariah-compliant stocks in Malaysia for the year 2011, and then validation of the results is provided in
Section 4. The discussion and conclusion are presented in
Section 5 and
Section 6, respectively.
2. Research Formulation
As mentioned in the introduction section, previous works on clustering were unable to handle outliers, providing inconsistent numbers of clusters and neglecting investor’s preferences. Taking into consideration the limitations of previous studies, in this study, a novel fuzzy clustering method that is capable of distinctively expressing vague investors’ preferences is presented. Furthermore, investors’ diverse preferences, which can be distinguished in various forms, such as pessimistic or optimistic, enhance and complement fuzzy inference systems for developing specific stock selection strategies for different types of investors.
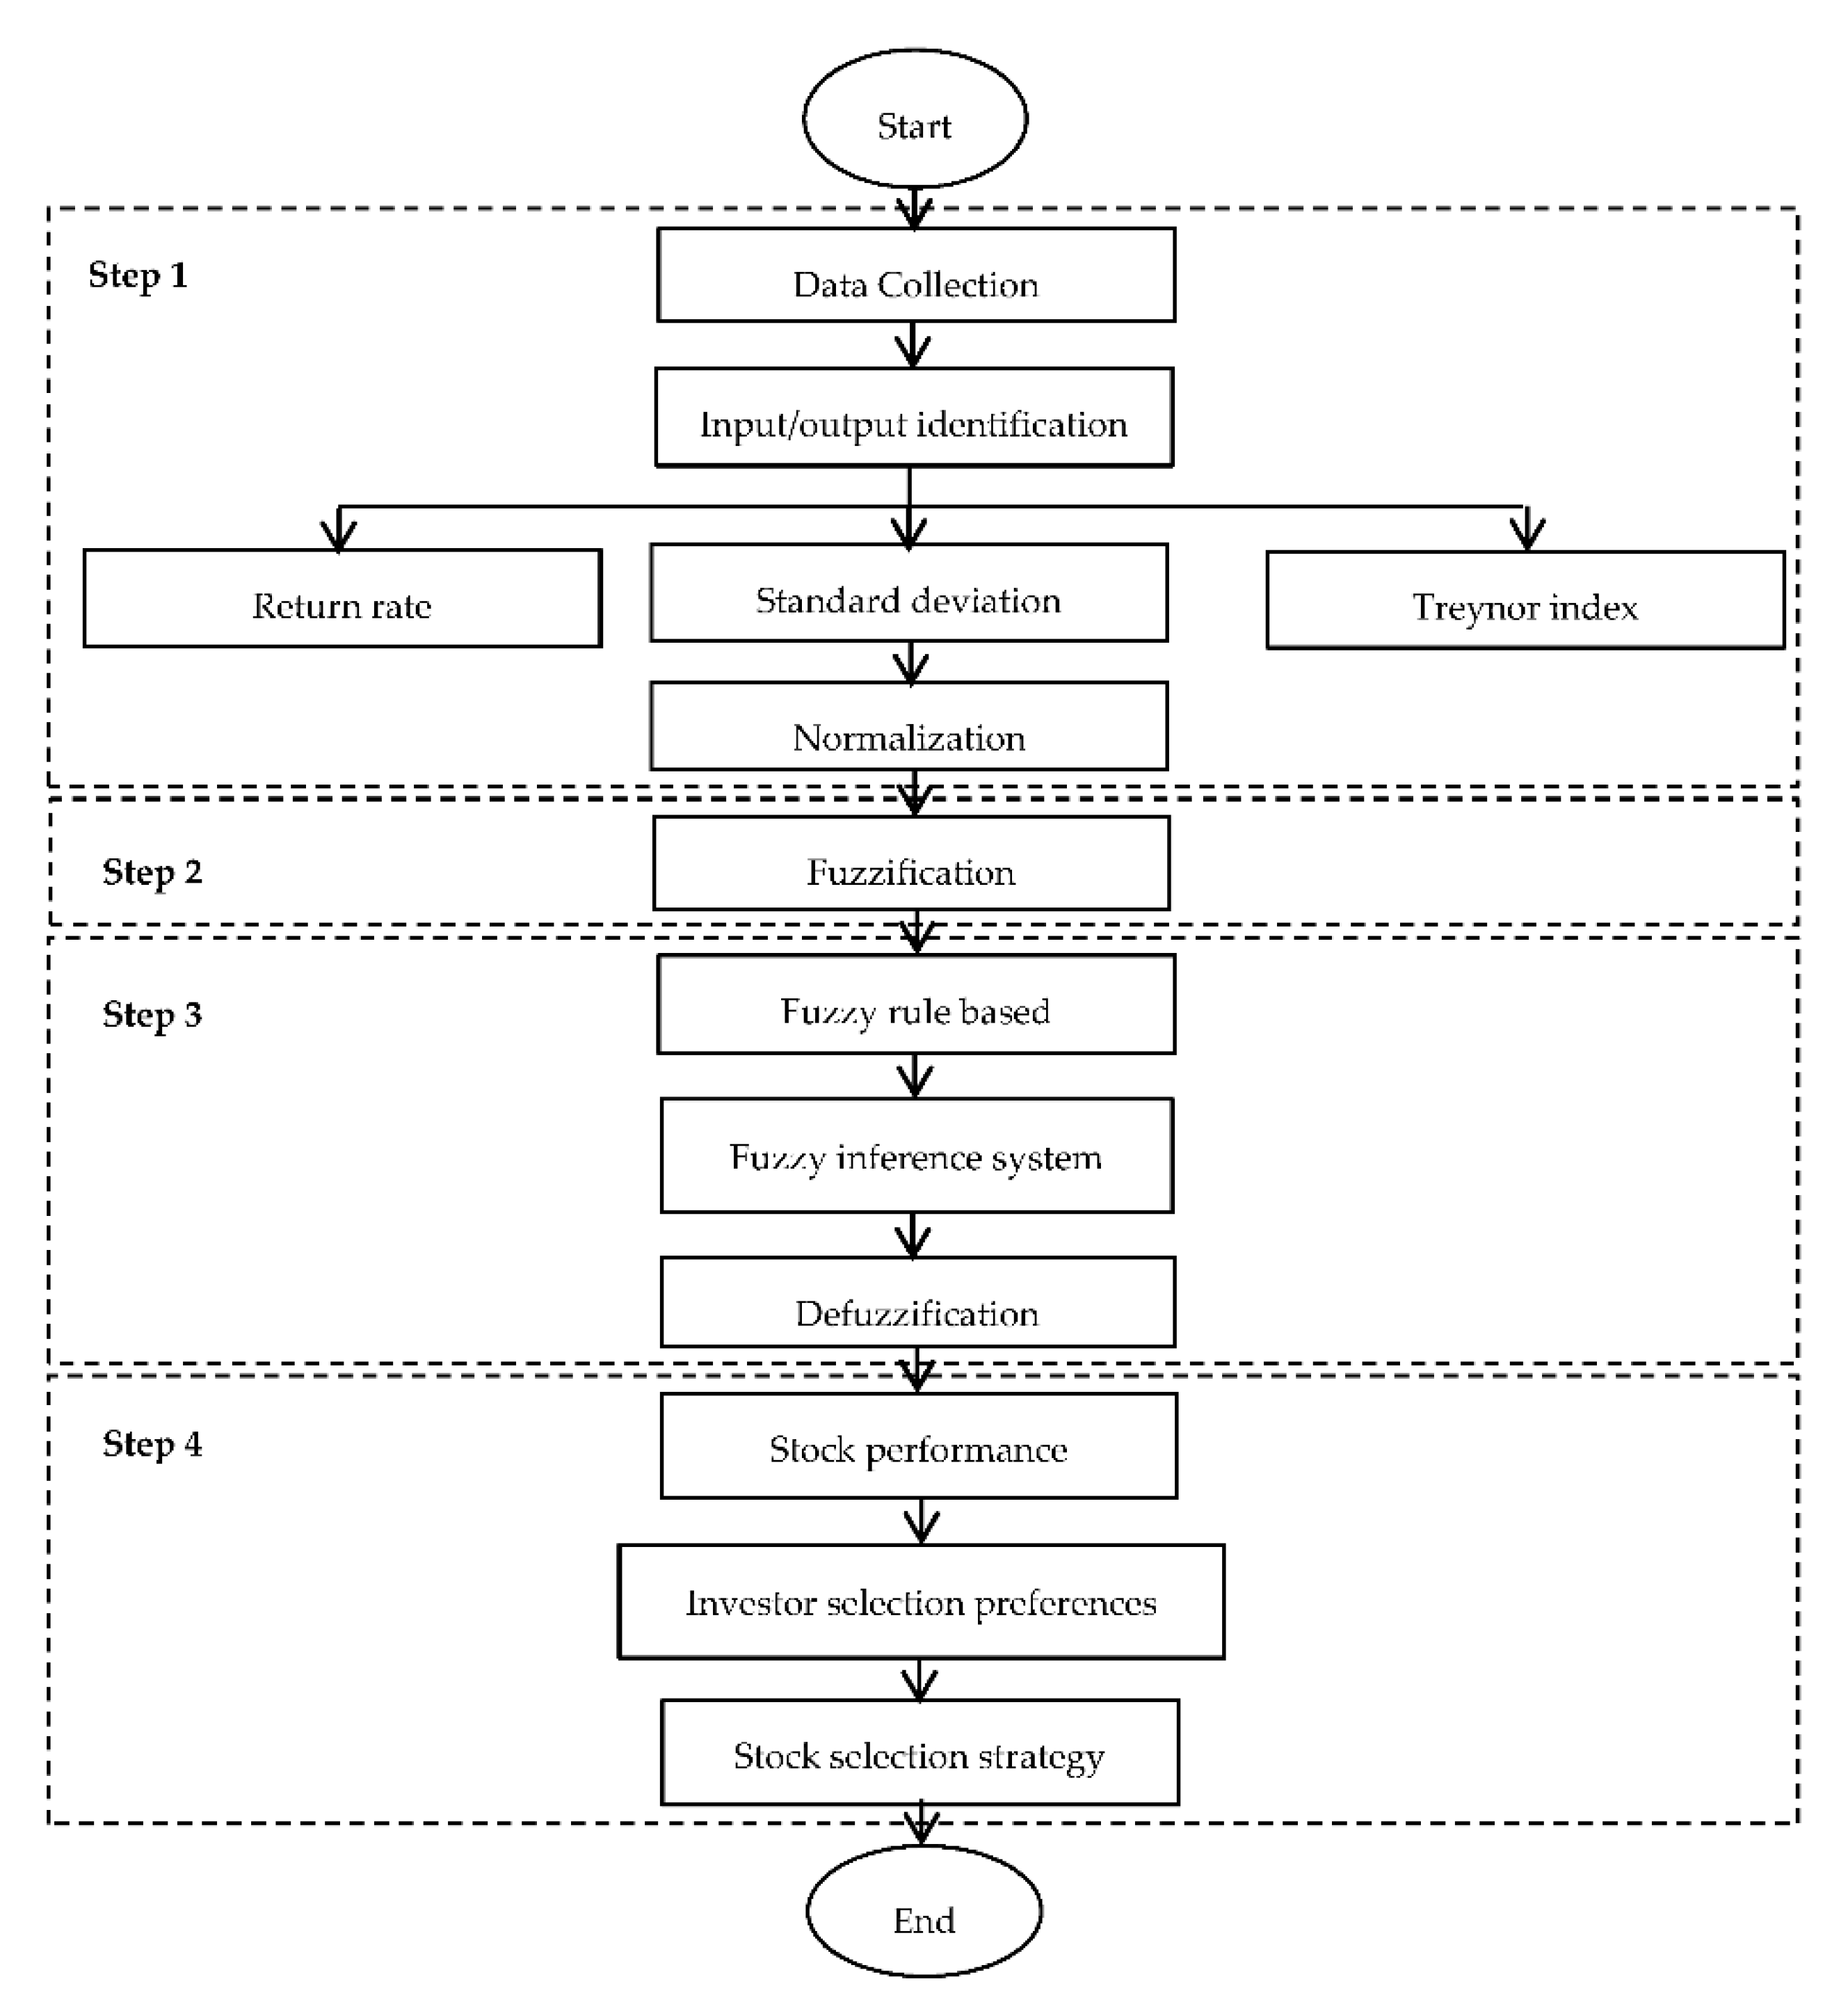
The development of the novel proposed fuzzy clustering method using a fuzzy inference system involved four steps. The first step was data collection and the identification of the inputs and outputs, as well as normalization. In this step, the inputs were variables related to the stocks—namely, return rates, standard deviations and Treynor index values—while stock performance served as the output. All inputs and outputs were then normalized to ensure that the data were in generic forms. In the second step, the results obtained from the normalization process were transformed into triangular fuzzy numbers—this process is known as fuzzification. All normalized inputs and outputs defined were in the form of linguistics terms described as triangular fuzzy numbers. For step 3, processes such as fuzzy rule base, fuzzy inference system, and defuzzification were performed. Fuzzy rule bases were developed based on the results of [
3,
4,
7,
8] and characterized by IF THEN rules. These rule bases were then aggregated in the fuzzy inference system, and the products were converted into crisp values that represent stock performance. This conversion process is known as defuzzification. The defuzzification process covers the limitation of outliers and inconsistent numbers of clusters. In step 4, the results obtained from defuzzification were projected according to confidence levels, where the confidence levels represent the actual levels of investors’ preferences. This step covered the limitation of neglecting investors’ preferences. For the purpose of distinguishing each stock based on its performance and on investors’ confidence levels, this study presents a unique stock selection strategy, whereby the best stocks are ranked based on investors’ preference priority. A flowchart on the development of the novel proposed fuzzy clustering method is given in
Figure 1. The steps involved in the development of the novel proposed fuzzy clustering method are described below.
2.1. Step 1: Data Collection, Input and Output Identification, and Normalization
This study started with data collection, where information related to the input and output variables was identified. The inputs were return rates, standard deviations, and Treynor index values, while the output was the stock performance. Based on [
4,
12,
25,
26], a definition for each input variable is given, as follows.
Definition 1. Return rates,: The return rate,, is the return gained from investment. A high value ofindicates a high profit gain, and thus positive stock performance is a good sign for investors. As Chen and Huang [4] demonstrated,is defined based on the concept of net asset value (NAV), where the definition ofis given as follows:whereis the return rate for stock t,is the net asset value for the current transaction, andis the net asset value of the previous transaction. Definition 2. Standard Deviation,: Standard deviation,, measures the volatility of returns denoted as the investment risk level [4,25]. The standard deviation,, can be calculated using Equation (2), shown as follows:
whereis the rate return of stock t on the ith day, andis the average return rate for n period of time. Definition 3. Treynor Index,: The Treynor index,, is a measure of the excess return earned per unit of systematic risk [4]. The Treynor index was chosen in this study as it examines the stock portfolio against the market as a whole and is highly sensitive to market risk [12,26]. A high value ofdenotes a high return per market risk [4]. The Treynor index is given by Equation (3), as follows:whereis the systematic risk or the market risk, andis the daily average risk-free rate for a week. As mentioned earlier, step 1 of the novel proposed fuzzy clustering method involved the normalization process. In this case, all of the values obtained from the inputs were normalized using the following definition.
Definition 4. Normalization,: Letbe the normalization of input variables [9] with, andis given aswhereandis the minimum and maximumwithrespectively. With respect to all inputs defined above, all variables were normalized using Equation (4), as shown in Equations (5)–(7):
where
,
and
are the values of normalization for the return rates, standard deviations, and Treynor index values, respectively.
2.2. Step 2: Fuzzification
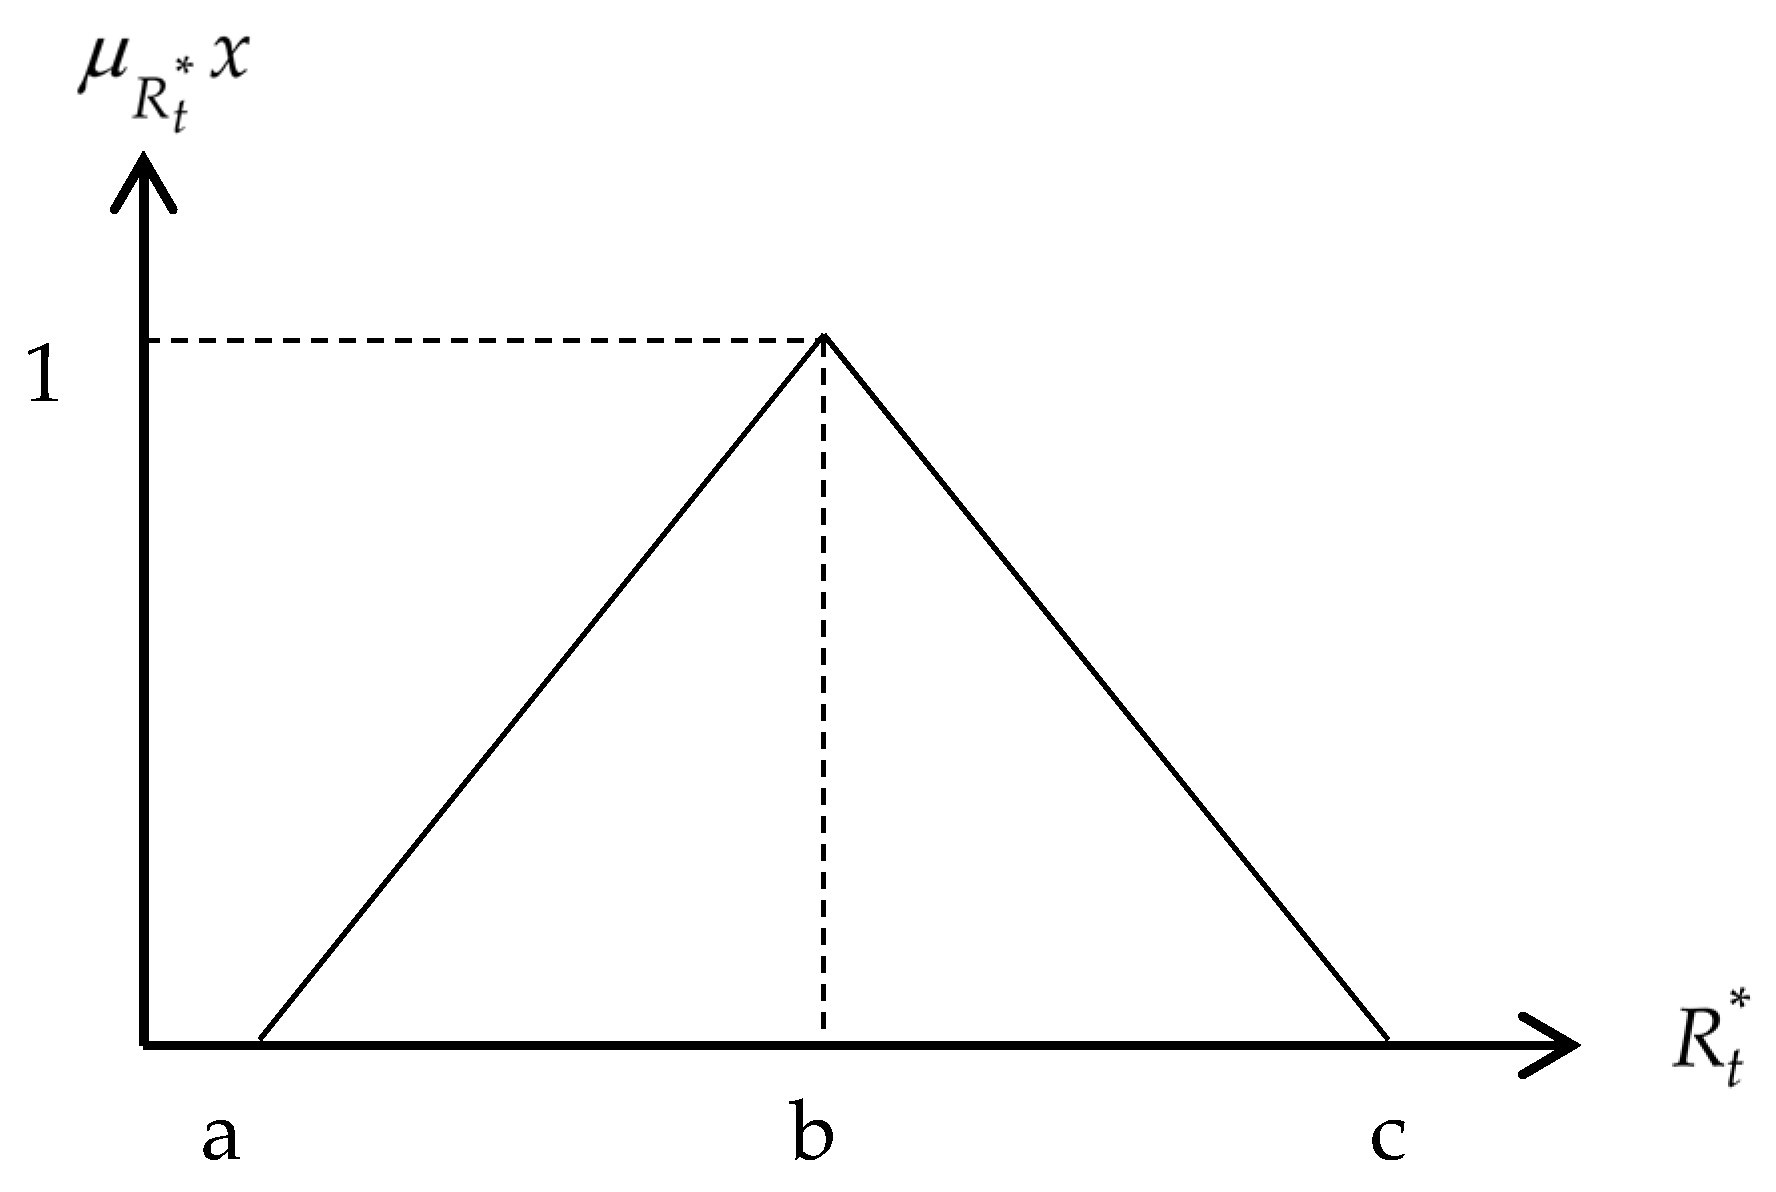
The results obtained from the normalization process in step 1 were then transformed into linguistic triangular fuzzy numbers shown by Equations (8)–(10).
where
,
, and
are the linguistic triangular fuzzy numbers for the return rates, standard deviations and Treynor index values, respectively.
Figure 2 shows the generic linguistic triangular fuzzy numbers for
.
Where
and
are the minimum and maximum values, respectively, while
is the modal value of the triangular fuzzy numbers [
27,
28].
2.3. Step 3: Fuzzy Rule Base, Fuzzy Inference System, and Defuzzification
In this step, rule bases in the form of linguistic terms were developed based on established stock performance decisions [
23,
24,
29,
30,
31]. All inputs in step 2 were aggregated using the rule bases developed in this step and the output obtained represent the performance of the stocks. It is worth noting that the output produced underwent defuzzification where the linguistic triangular fuzzy numbers were transformed into crisp values. The interaction between the inputs, fuzzy rule bases, and outputs are generically given as follows:
2.4. Step 4: Stock Performance, Investor Selection Preferences and Stock Selection Strategy
The stock performance obtained from the defuzzification process in step 3 was expressed as a single value; this value represents investors’ evaluation of the stocks. The evaluation was then projected onto the height of the linguistics triangular fuzzy numbers, where the two confidence levels were obtained. The confidence level represents the selection preferences of two types of investors, namely, pessimistic and optimistic investors. To distinguish the stocks in accordance to investors’ preference priority, a stock selection strategy was developed, and is displayed using Equation (11):
where
is the weight of the performance,
is the number of performances obtained for the stock,
is the stock performance, and
is the average of the confidence levels for stock performance.
5. Discussion
As projected in
Section 4, this study successfully extended the established clustering methods [
4,
6] by developing a novel fuzzy clustering method using a fuzzy inference system. The novel fuzzy clustering method is capable of determining stock performance based on investor preferences, as well as ranking stock based on priority. As shown in
Table 5, four performance evaluations, namely, inferior, stable, good, and aggressive, were formed. As exhibited in this study, inferior performance consists of stocks that are unstable and in poor condition, yielding high risk and low return gains. Investment in this performance classification is deemed to be unworthy. The classification of stable performance for stocks consists of stocks that are still considered to be high risk and to have low return gains, but the performance is slightly better than that of inferior performance. Moreover, stable performance also consists of stocks that have moderate return rates and risk levels, but are unable to provide profit for shorter investment periods. Good performance stocks are the best stocks for investment, since the risk is low and the return rate is high, indicating that investors’ chances of losing are low and that they are able to secure high returns in investments. Finally, the aggressive performance classification consists of stocks that provide higher returns but with higher risk. This stock classification is for investors who are not intimidated by high investment risk to gain high profit returns. Stocks with a lack of investor preference are classified as inferior and stable, rather than good or aggressive. Therefore, it is suggested that investors invest in stocks classified as having good and aggressive performance.
Unlike established past works that only considered a single investors’ selection preferences, which cannot be justified, the proposed novel fuzzy clustering method is able to distinguish investors’ preferences based on stock performance. Real investors’ selection preferences can be either pessimistic or optimistic, as shown by the results obtained using the novel fuzzy clustering method. The types of investors are represented based on confidence levels, with a low value indicating pessimistic investors, while a high value denotes optimistic investors, as shown in
Table 5 and
Table 7. Even though investors express different preferences toward performance evaluation, the results of overall stock performance show that some stocks are given the same performance evaluation by both optimistic and pessimistic investors. This implies that investors’ preferences are an important element to consider when selecting appropriate stocks.
The stock performance presented using the novel fuzzy clustering method is in the form of a numerical value. This numerical value shows the strength of the stock performance, which can be used to rank stocks based on priority, and which established works were unable to do. Typically, most established works used more than one method to sort and rank stocks based on priority, as was done by [
20,
21]. Providentially, this study used only one method to determine stock performance, to cluster stock performance, to rank stocks based on priority, as well as to determine and rank priority stocks based on investor preferences.
In step 4, stocks based on priority were applied to search for the best stocks to invest in. At this stage, the stocks were rank based on the priority of the stock performance, as shown in
Table 10. Such ranking was done for both pessimistic and optimistic investors. The performance of the proposed method was validated against established works, and was actual rank using Spearman’s rank coefficient of correlation. The results show that the proposed novel fuzzy clustering method is superior compared to the k-means and hierarchical clustering methods.


 ,
, 

