Dragonfly Algorithm with Opposition-Based Learning for Multilevel Thresholding Color Image Segmentation


Abstract
1. Introduction
2. Dataset
3. The Proposed Method for Multilevel Thresholding
3.1. Thresholding Technique
3.1.1. Otsu’s Method
3.1.2. Kapur’s Entropy
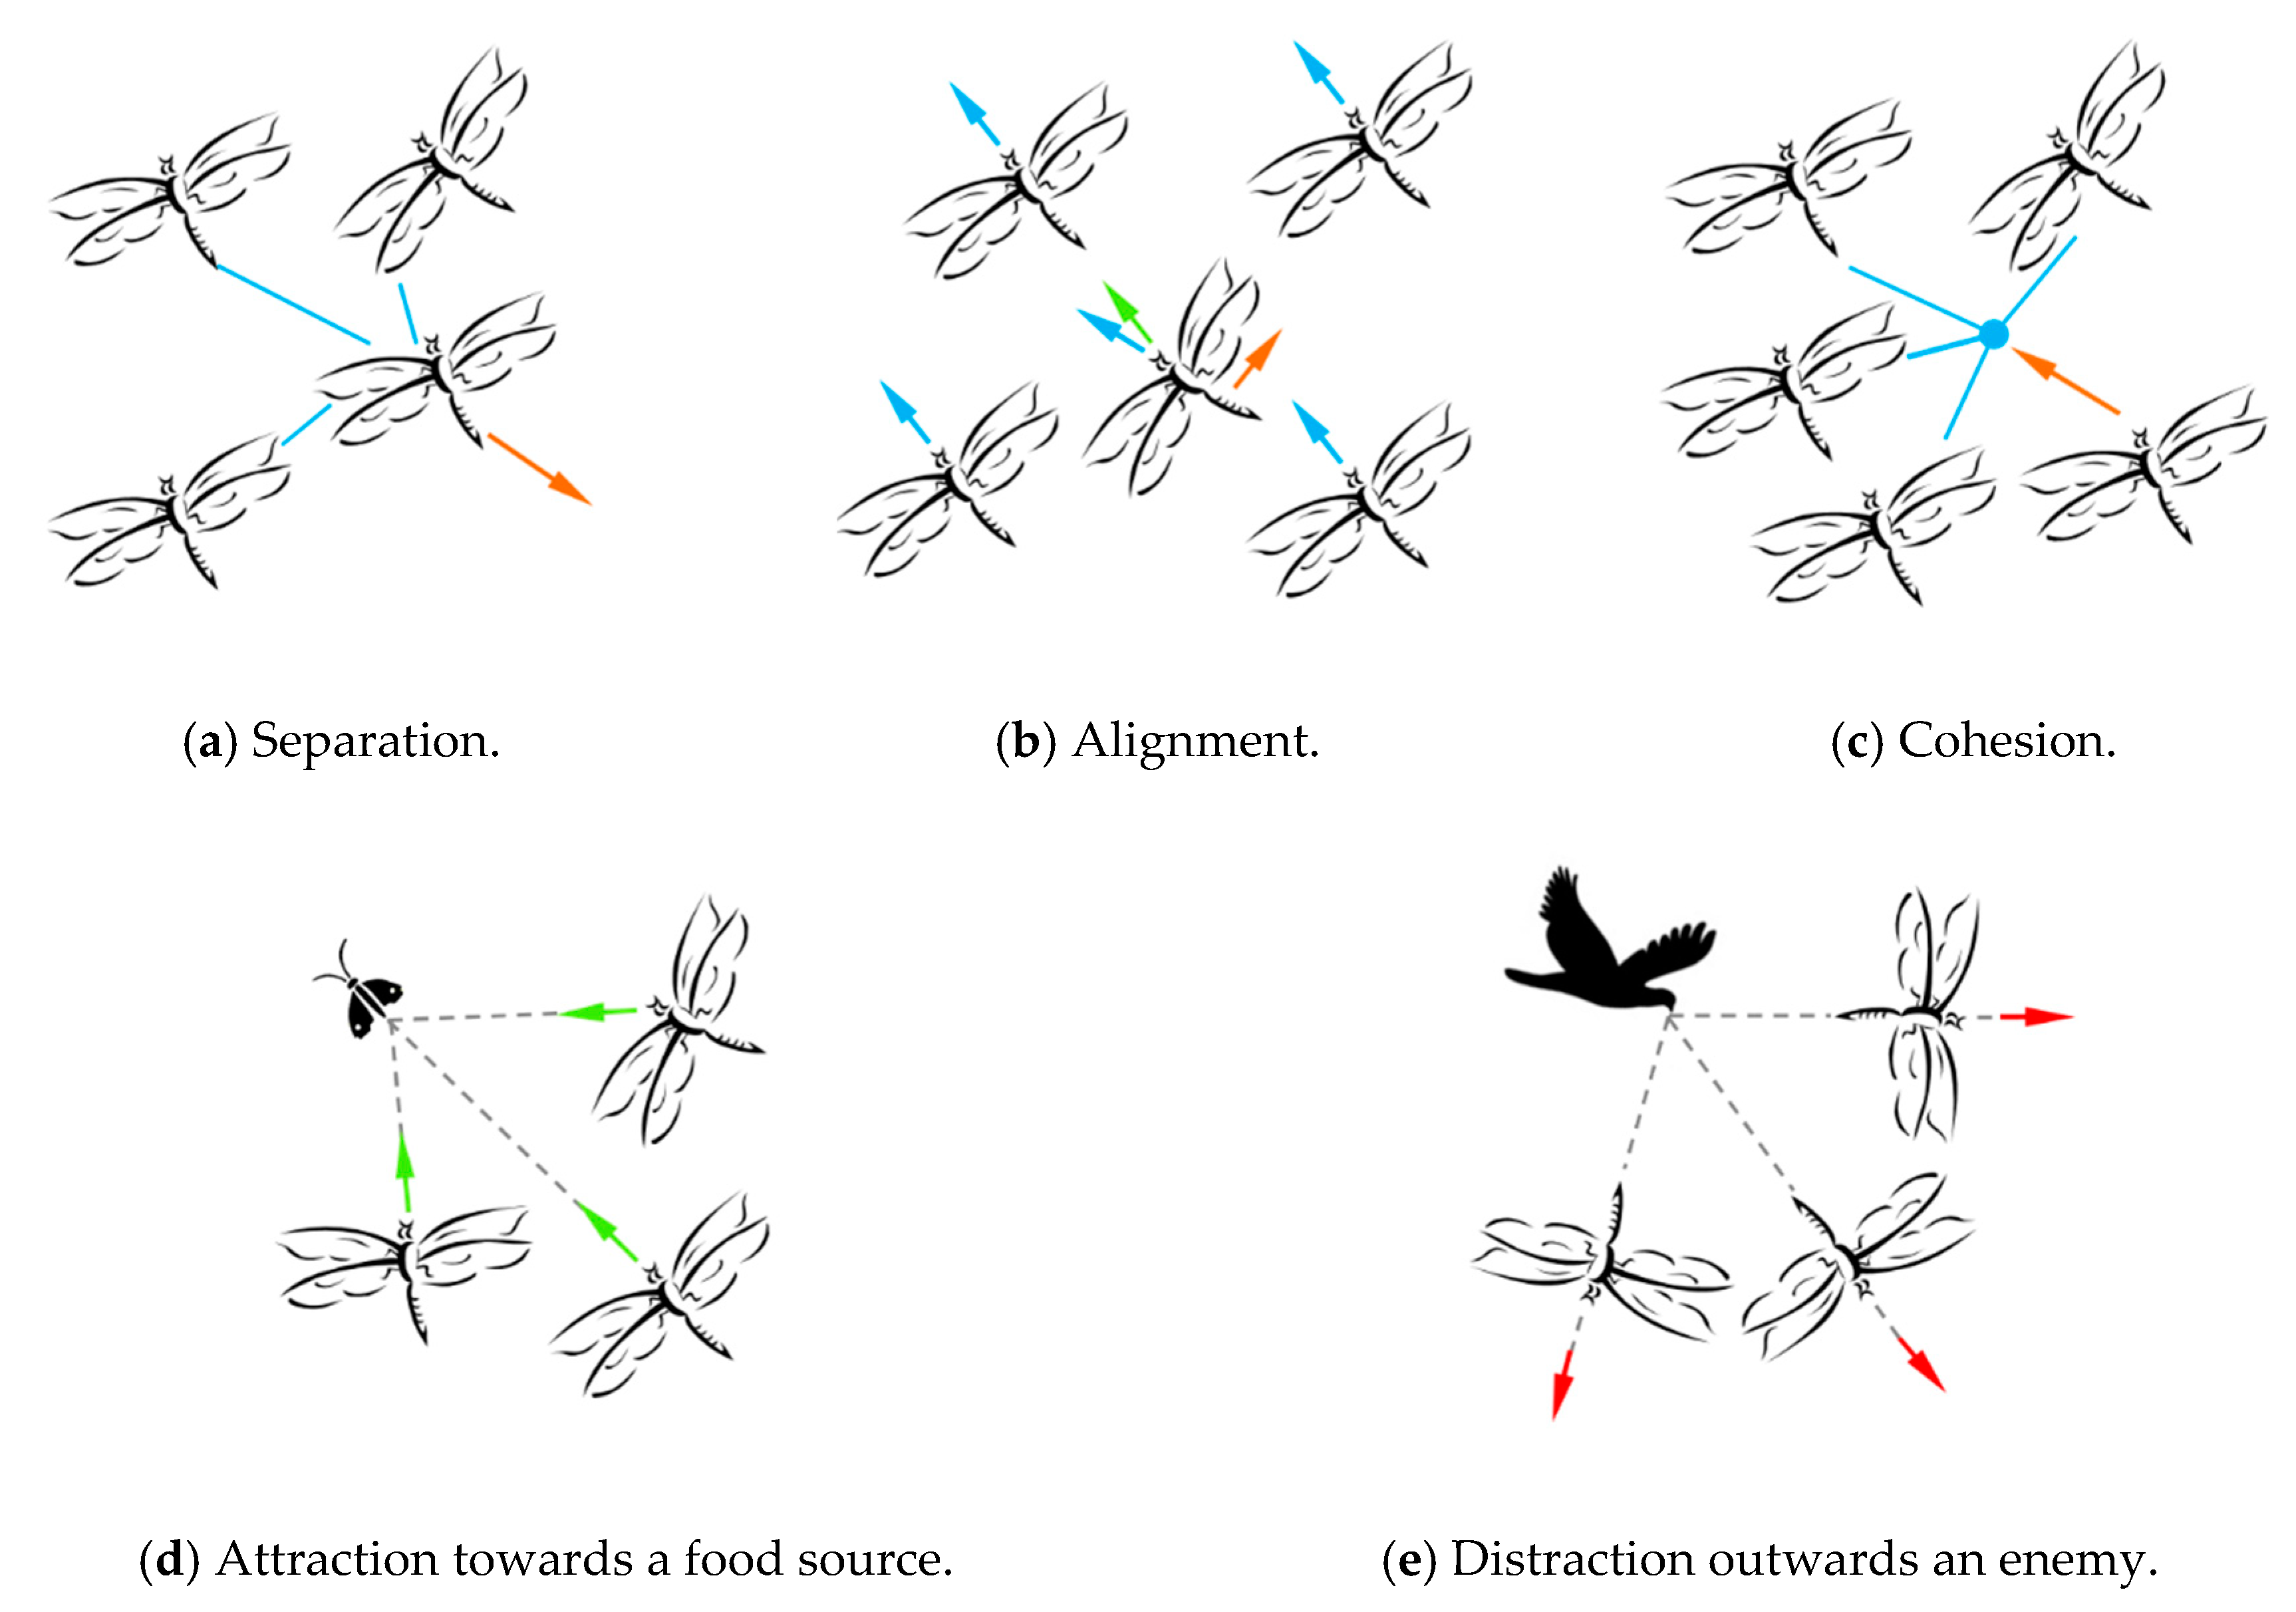
3.2. Dragonfly Algorithm (DA)
| Algorithm 1. Pseudocode of dragonfly algorithm for multilevel thresholding |
| Initialize the position of dragonfly population based on opposition-based learning. |
| Initialize step vectors . |
| WHILE the end condition is not satisfied |
| FOR |
| Calculate the objective value of each dragonfly by using the Equation (1) for Kapur’s entropy or |
| Equation (2) for Between-class variance |
| Update the position of the food source and enemy . |
| Update and |
| Calculate and using Equations (4) to (7) |
| Update neighboring radius |
| IF a dragonfly has at least one neighboring dragonfly |
| Update velocity vector; Update position vector using Equation (8) |
| ELSE |
| Update position vector using Equation (9) |
| END IF |
| Select half of dragonflies from the current population randomly, and the opposition-based |
| learning is embedded in them. |
| Check and correct the new positions based on the boundaries of variables |
| END FOR |
| END WHILE |
| Return , which represents the optimal values for multilevel thresholding segmentation. |
3.3. Dragonfly Algorithm with Opposition-Based Learning (OBLDA) Based on Multilevel Thresholding
4. Experiments
4.1. Experimental Setup
4.2. Parameter Setting
4.3. Segmented Image Quality Metrics
5. Results and Discussions
5.1. Objective Function Measure
5.2. Stability Analysis
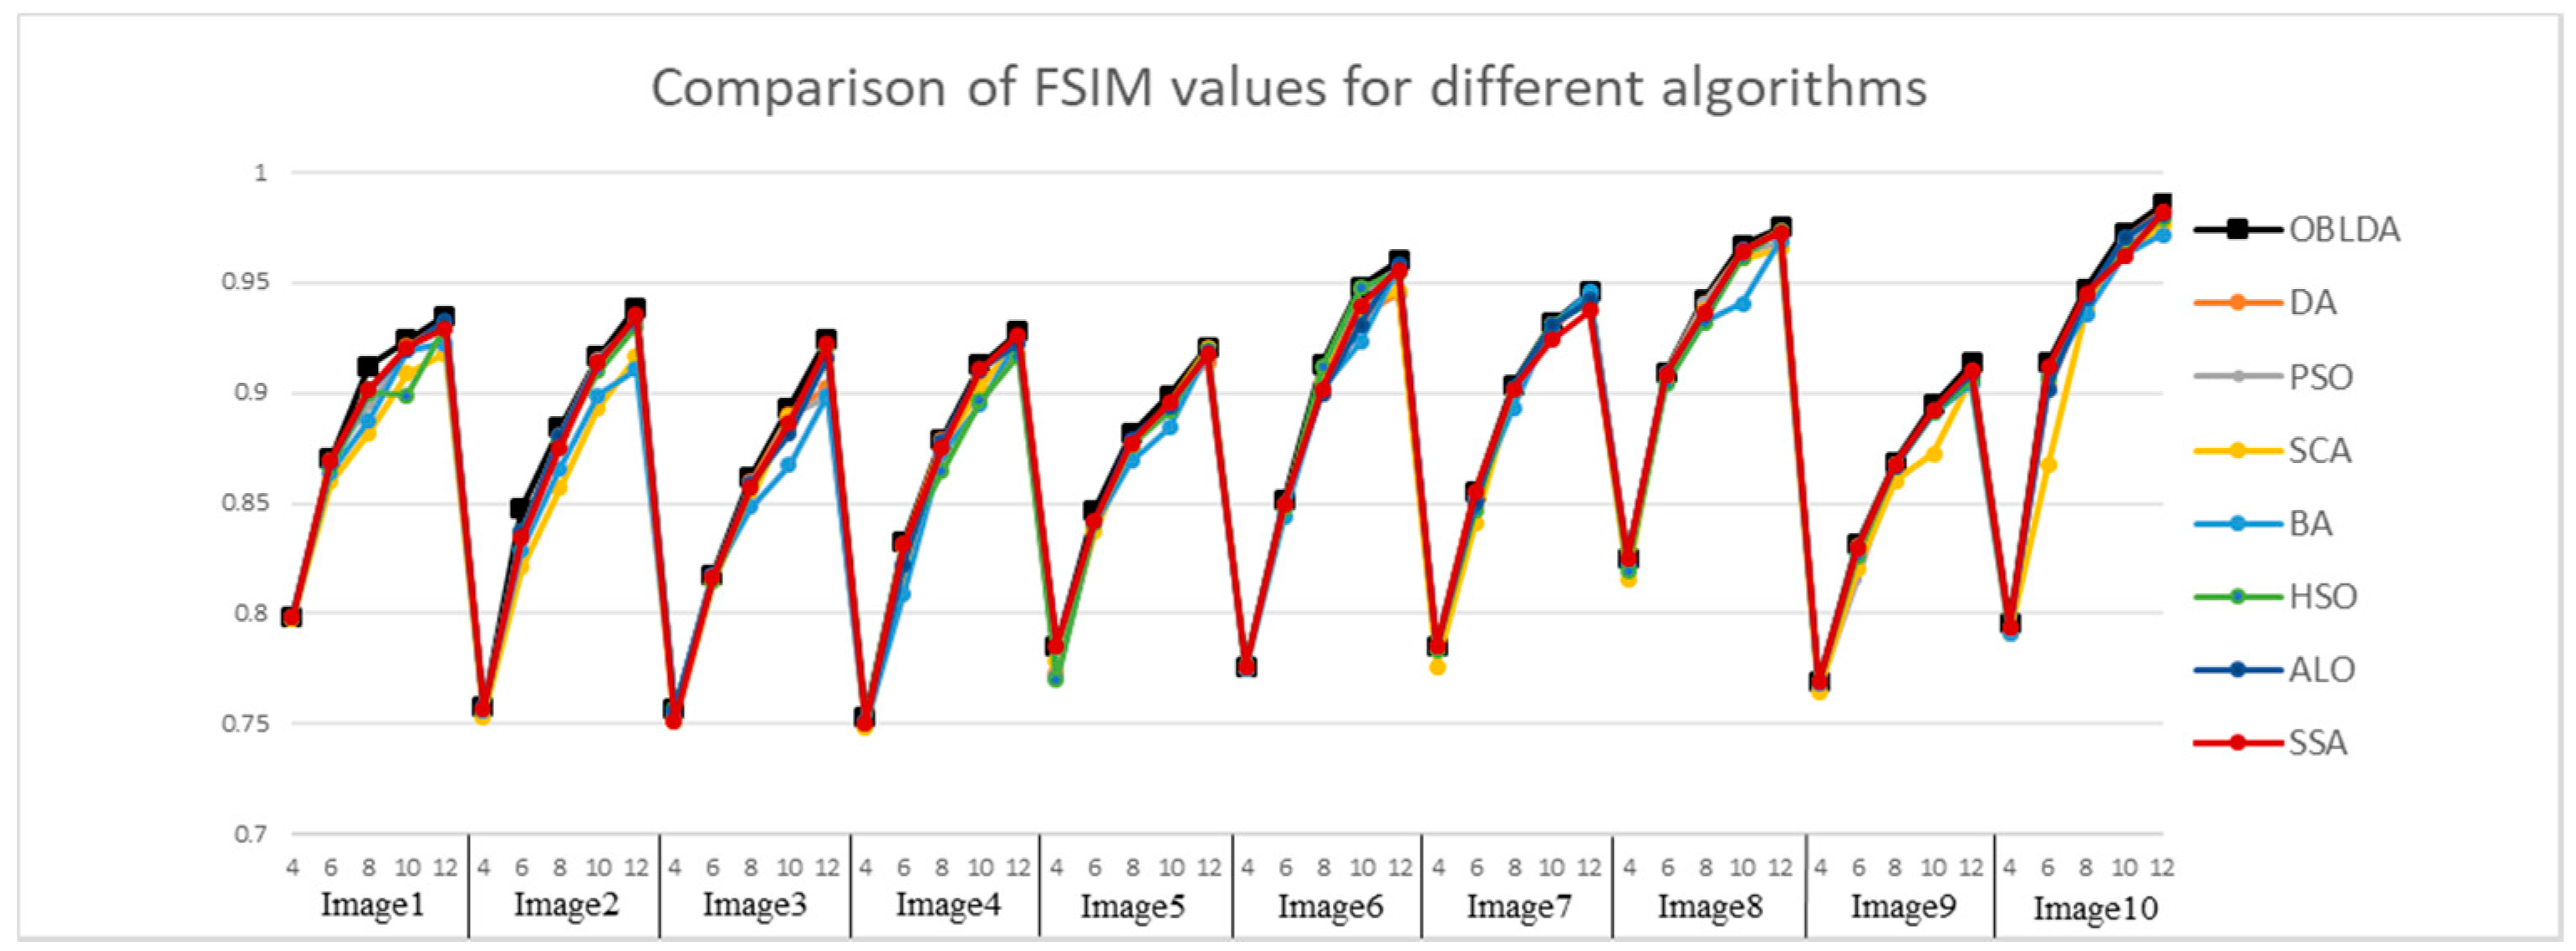
5.3. Segmentation Evaluation
5.4. Statistical Analysis
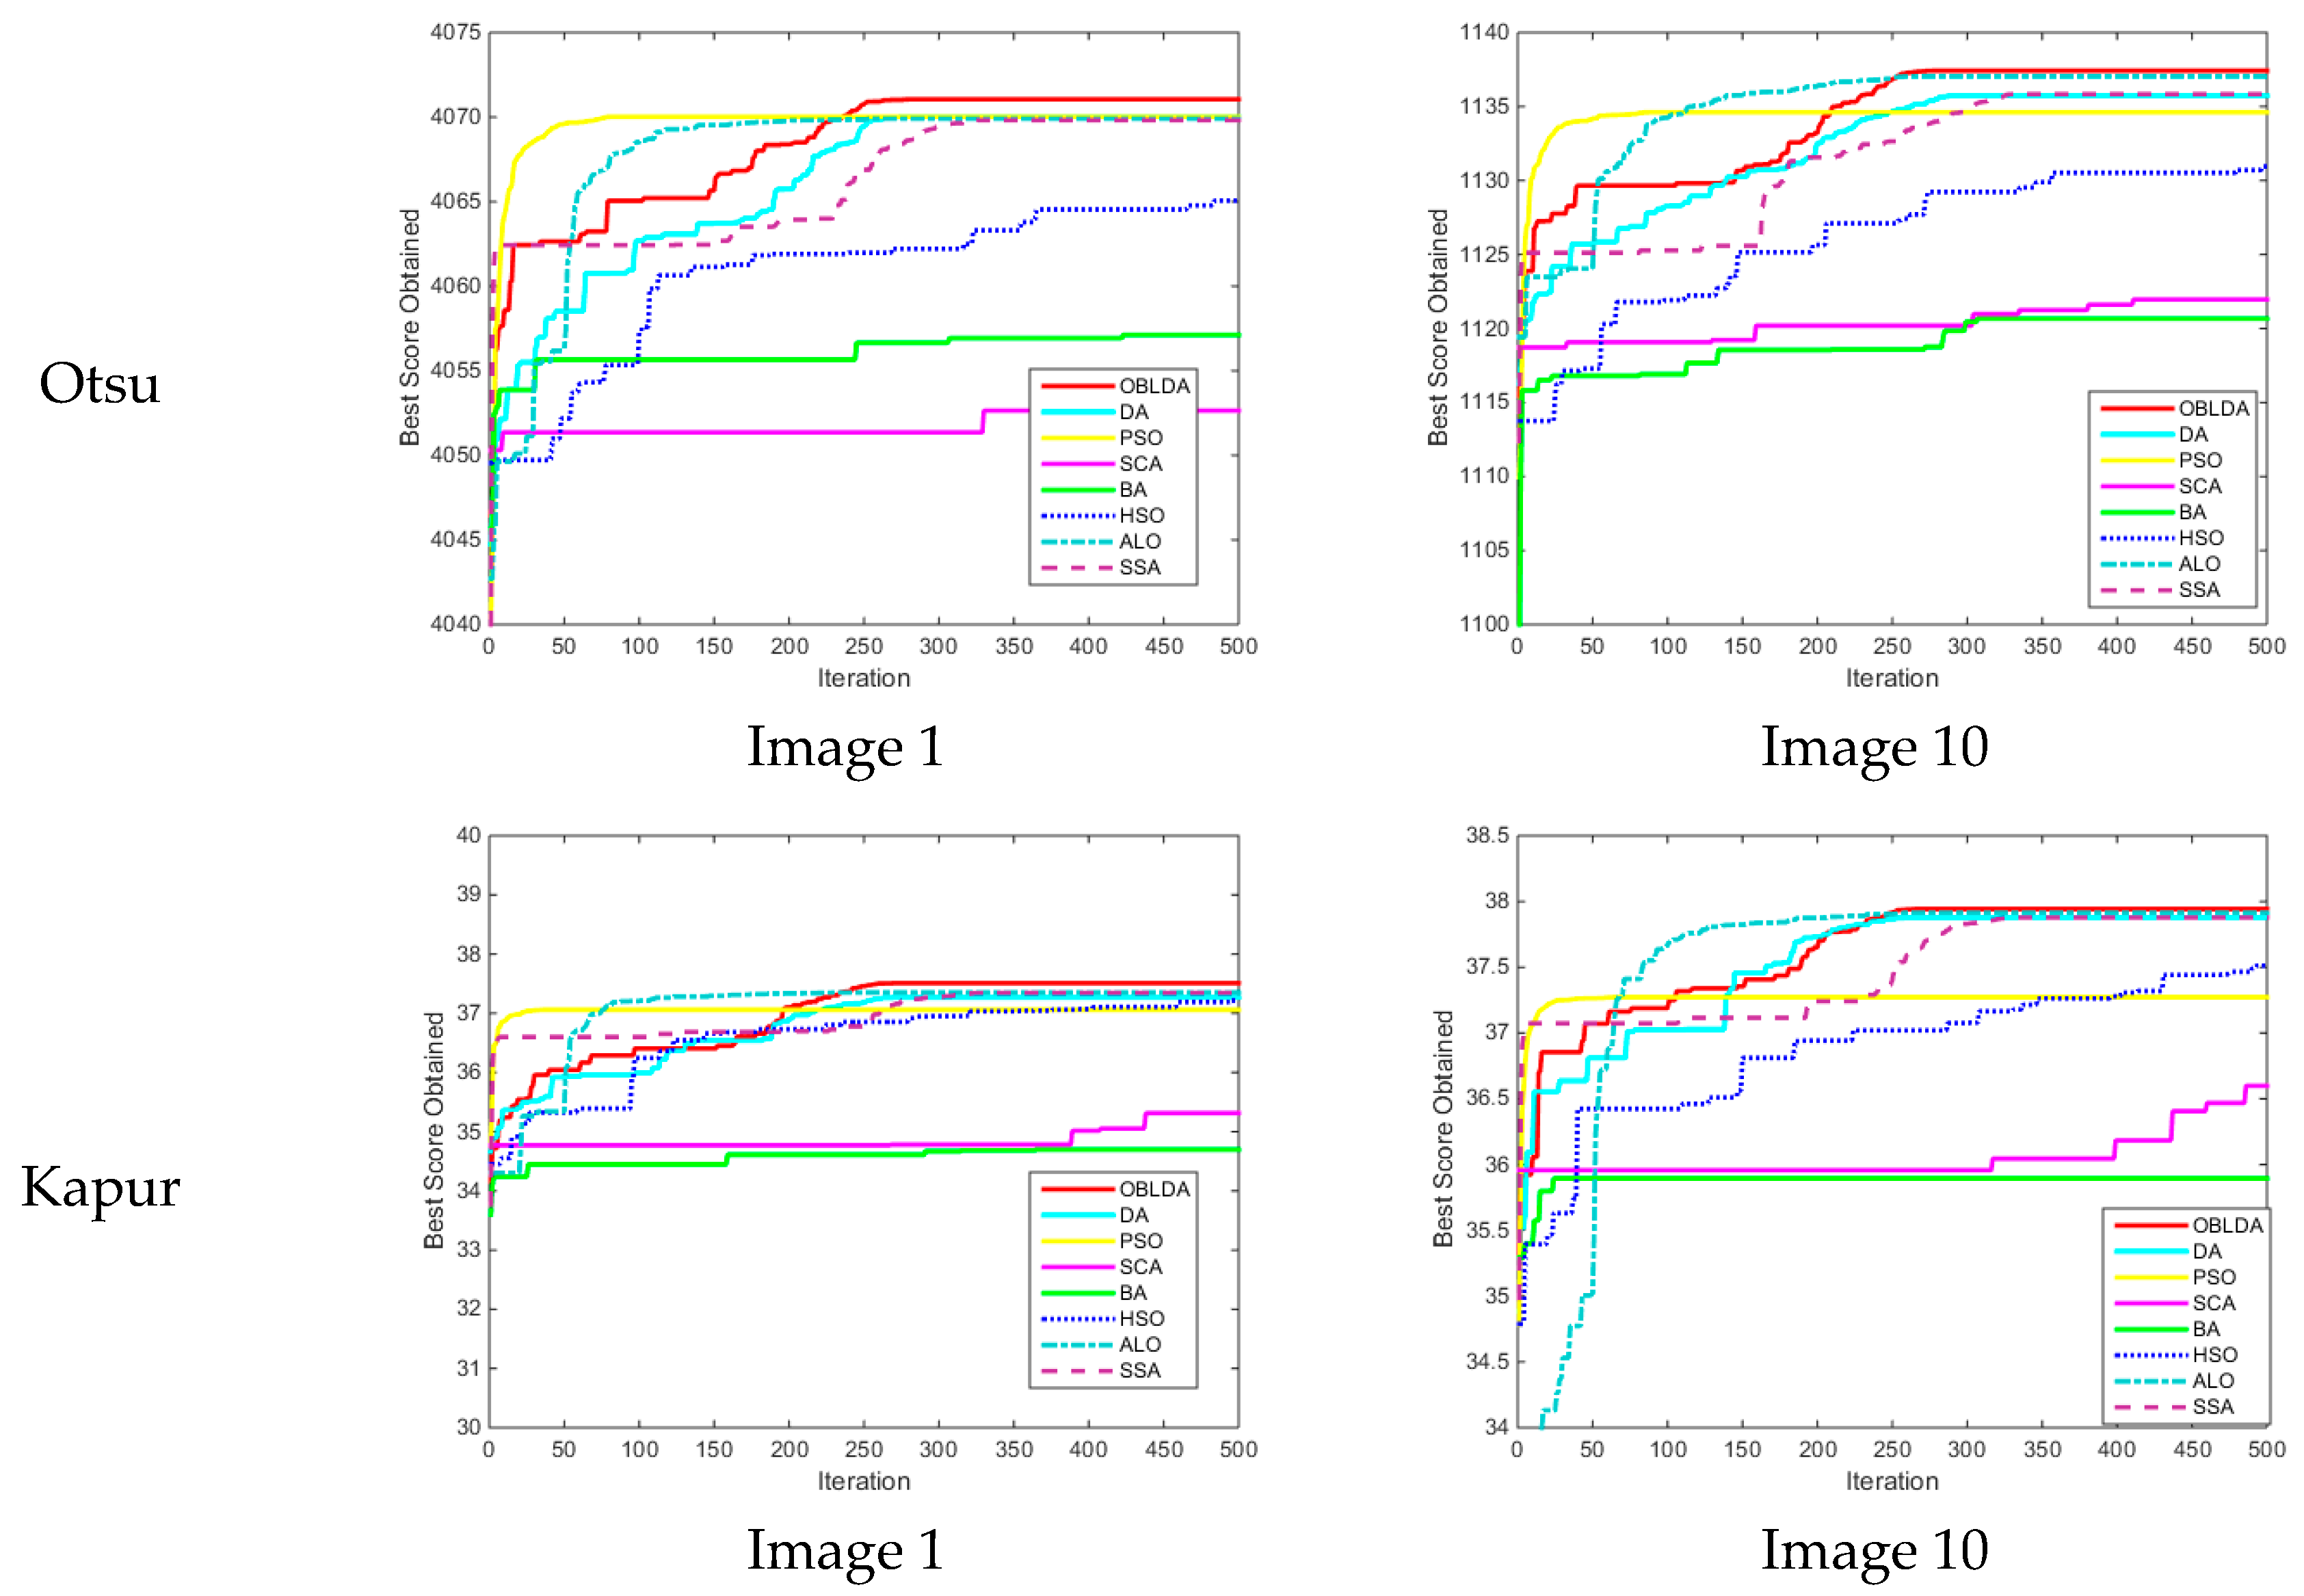
5.5. Convergence Performance
5.6. Computation Time
5.7. Application in Plant Canopy Image
6. Conclusions
Author Contributions
Funding
Acknowledgments
Conflicts of Interest
References
- Robert, M.; Carsten, M.; Olivier, E.; Jochen, P.; Noordhoek, N.J.; Aravinda, T.; Reddy, V.Y.; Chan, R.C.; Jürgen, W. Automatic segmentation of rotational X-ray images for anatomic intra-procedural surface generation in atrial fibrillation ablation procedures. IEEE Trans. Med. Imaging. 2010, 29, 260–272. [Google Scholar]
- Qian, P.; Zhao, Y.; Jiang, K.; Deng, Z.; Wang, S.; Muzic, R.F. Knowledge-leveraged transfer fuzzy C-Means for texture image segmentation with self-adaptive cluster prototype matching. Knowl. Based Syst. 2017, 130, 33–50. [Google Scholar]
- Lv, J.; Wang, F.; Xu, L.; Ma, Z.; Yang, B. A segmentation method of bagged green apple image. Sci. Hortic. 2019, 246, 411–417. [Google Scholar] [CrossRef]
- Lee, S.H.; Koo, H.I.; Cho, N.I. Image segmentation algorithms based on the machine learning of features. Pattern Recognit. Lett. 2010, 31, 2325–2336. [Google Scholar] [CrossRef]
- Breve, F. Interactive image segmentation using label propagation through complex networks. Expert Syst. Appl. 2019, 123, 18–33. [Google Scholar] [CrossRef]
- Tang, N.; Zhou, F.; Gu, Z.; Zheng, H.; Yu, Z.; Zheng, B. Unsupervised pixel-wise classification for Chaetoceros image segmentation. Neurocomputing 2018, 318, 261–270. [Google Scholar] [CrossRef]
- Meher, B.; Agrawal, S.; Panda, R.; Abraham, A. A survey on region based image fusion methods. Inf. Fusion 2019, 48, 119–132. [Google Scholar] [CrossRef]
- Mittal, H.; Saraswat, M. An automatic nuclei segmentation method using intelligent gravitational search algorithm based superpixel clustering. Swarm Evol. Comput. 2019, 45, 15–32. [Google Scholar] [CrossRef]
- Chen, J.; Zheng, H.; Lin, X.; Wu, Y.; Su, M. A novel image segmentation method based on fast density clustering algorithm. Eng. Appl. Artif. Intell. 2018, 73, 92–110. [Google Scholar] [CrossRef]
- Ishak, A.B. A two-dimensional multilevel thresholding method for image segmentation. Appl. Soft Comput. 2017, 52, 306–322. [Google Scholar] [CrossRef]
- Manikandan, S.; Ramar, K.; Iruthayarajan, M.W.; Srinivasagan, K.G. Multilevel thresholding for segmentation of medical brain images using real coded genetic algorithm. Measurement 2014, 47, 558–568. [Google Scholar] [CrossRef]
- Fu, X.; Liu, T.; Xiong, Z.; Smaill, B.H.; Stiles, M.K.; Zhao, J. Segmentation of histological images and fibrosis identification with a convolutional neural network. Comput. Biol. Med. 2018, 98, 147–158. [Google Scholar] [CrossRef]
- Li, J.; Tang, W.; Wang, J.; Zhang, X. A multilevel color image thresholding scheme based on minimum cross entropy and alternating direction method of multipliers. Optik 2019, 183, 30–37. [Google Scholar] [CrossRef]
- Jiang, Y.; Tasi, P.; Yeh, W.; Cao, L. A honey-bee-mating based algorithm for multilevel image segmentation using Bayesian theorem. Appl. Soft Comput. 2017, 52, 1181–1190. [Google Scholar] [CrossRef]
- Feng, Y.; Zhao, H.; Li, X.; Zhao, X.; Li, H. A multi-scale 3D Otsu thresholding algorithm for medical image segmentation. Dig. Signal Process. 2017, 60, 186–199. [Google Scholar] [CrossRef]
- Otsu, N. A threshold selection method from gray-level histograms. IEEE Trans. Syst. Man Cybern. 1979, 9, 62–66. [Google Scholar] [CrossRef]
- Kapura, J.N.; Sahoob, P.K.; Wongc, A.K.C. A new method for gray-level picture thresholding using the entropy of the histogram. Comput. Vis. Gr. Image Proc. 1985, 29, 273–285. [Google Scholar] [CrossRef]
- Fredo, A.R.J.; Abilash, R.S.; Kumar, C.S. Segmentation and analysis of damages in composite images using multi-level threshold methods and geometrical features. Measurement 2017, 100, 270–278. [Google Scholar] [CrossRef]
- Demirhan, A.; Törü, M.; Güler, İ. Segmentation of tumor and edema along with healthy tissues of brain using wavelets and neural networks. IEEE J. Biomed. Health Inf. 2015, 19, 1451–1458. [Google Scholar] [CrossRef] [PubMed]
- Dirami, A.; Hammouche, K.; Diaf, M.; Siarry, P. Fast multilevel thresholding for image segmentation through a multiphase level set method. Signal Process. 2013, 93, 139–153. [Google Scholar] [CrossRef]
- He, L.; Huang, S. Modified firefly algorithm based multilevel thresholding for color image segmentation. Neurocomputing 2017, 240, 152–174. [Google Scholar] [CrossRef]
- Khairuzzaman, A.K.M.; Chaudhury, S. Multilevel thresholding using grey wolf optimizer for image segmentation. Expert Syst. Appl. 2017, 86, 64–76. [Google Scholar] [CrossRef]
- Pham, T.X.; Siarry, P.; Oulhadj, H. Integrating fuzzy entropy clustering with an improved PSO for MRI brain image segmentation. Appl. Soft Comput. 2018, 65, 230–242. [Google Scholar] [CrossRef]
- Pan, Y.; Xia, Y.; Zhou, T.; Fulham, M. Cell image segmentation using bacterial foraging optimization. Appl. Soft Comput. 2017, 58, 770–782. [Google Scholar] [CrossRef]
- Ye, Z.; Wang, M.; Liu, W.; Chen, S. Fuzzy entropy based optimal thresholding using bat algorithm. Appl. Soft Comput. 2015, 31, 381–395. [Google Scholar] [CrossRef]
- Aziz, M.A.E.; Ewees, A.A.; Hassanien, A.E. Whale Optimization Algorithm and Moth-Flame Optimization for multilevel thresholding image segmentation. Expert Syst. Appl. 2017, 83, 242–256. [Google Scholar] [CrossRef]
- Gao, H.; Fu, Z.; Pun, C.; Hu, H.; Lan, R. A multi-level thresholding image segmentation based on an improved artificial bee colony algorithm. Comput. Electr. Eng. 2018, 70, 931–938. [Google Scholar] [CrossRef]
- Pare, S.; Kumar, A.; Bajaj, V.; Singh, G.K. An efficient method for multilevel color image thresholding using cuckoo search algorithm based on minimum cross entropy. Appl. Soft Comput. 2017, 61, 570–592. [Google Scholar] [CrossRef]
- Remli, M.A.; Mohamad, M.S.; Deris, S.; Samah, A.A. Cooperative enhanced scatter search with opposition-based learning schemes for parameter estimation in high dimensional kinetic models of biological systems. Expert Syst. Appl. 2019, 116, 131–146. [Google Scholar] [CrossRef]
- Mahdavi, S.; Rahnamayan, S.; Deb, K. Opposition based learning: A literature review. Swarm Evol. Comput. 2018, 39, 1–23. [Google Scholar] [CrossRef]
- Bulbul, S.M.A.; Pradhan, M.; Roy, P.K.; Pal, T. Opposition-based krill herd algorithm applied to economic load dispatch problem. Ain Shams Eng. J. 2018, 9, 423–440. [Google Scholar] [CrossRef]
- Ewees, A.A.; Elaziz, M.A.; Houssein, E.H. Improved grasshopper optimization algorithm using opposition-based learning. Expert Syst. Appl. 2018, 112, 156–172. [Google Scholar] [CrossRef]
- Seyedali, M. Dragonfly algorithm: a new meta-heuristic optimization technique for solving single-objective, discrete, and multi-objective problems. Neural Comput. Appl. 2016, 27, 1053–1073. [Google Scholar]
- Shen, L.; Huang, X.; Fan, C. Double-group particle swarm optimization and its application in remote sensing image segmentation. Sensors 2018, 18, 1393. [Google Scholar] [CrossRef]
- Díaz-Cortés, M.; Ortega-Sánchez, N.; Hinojosa, S.; Oliva, D.; Cuevas, E.; Rojas, R.; Demin, A. A multi-level thresholding method for breast thermograms analysis using Dragonfly algorithm. Infrared Phys. Technol. 2018, 93, 346–361. [Google Scholar] [CrossRef]
- Guha, D.; Roy, P.K.; Banerjee, S. Optimal tuning of 3 degree-of-freedom proportional-integral-derivative controller for hybrid distributed power system using dragonfly algorithm. Comput. Electr. Eng. 2018, 72, 137–153. [Google Scholar] [CrossRef]
- Kizhakkethil, S.R.; Murugan, S. Memory based hybrid dragonfly algorithm for numerical optimization problems. Expert Syst. Appl. 2017, 83, 63–77. [Google Scholar]
- Sambandam, R.K.; Jayaraman, S. Self-adaptive dragonfly based optimal thresholding for multilevel segmentation of digital images. J. King Saud Univ.-Comput. Inf. Sci. 2018, 30, 449–461. [Google Scholar] [CrossRef]
- Jafari, M.; Chaleshtari, M.H.B. Using dragonfly algorithm for optimization of orthotropic infinite plates with a quasi-triangular cut-out. Eur. J. Mech. A. Solids. 2017, 66, 1–14. [Google Scholar] [CrossRef]
- Hariharan, M.; Sindhu, R.; Vijean, V.; Yazid, H.; Nadarajaw, T.; Yaacob, S.; Polat, K. Improved binary dragonfly optimization algorithm and wavelet packet based non-linear features for infant cry classification. Comput. Methods Programs Biomed. 2018, 155, 39–51. [Google Scholar] [CrossRef]
- Mirjalili, S. SCA: A Sine Cosine Algorithm for solving optimization problems. Knowl.-Based Syst. 2016, 96, 120–133. [Google Scholar] [CrossRef]
- Horng, M. A multilevel image thresholding using the honey bee mating optimization. Appl. Math. Comput. 2010, 215, 3302–3310. [Google Scholar] [CrossRef]
- Moghaddam, M.J.H.; Nowdeh, S.A.; Bigdeli, M.; Azizian, D. A multi-objective optimal sizing and siting of distributed generation using ant lion optimization technique. Ain Shams Eng. J. 2018, 9, 2101–2109. [Google Scholar] [CrossRef]
- Mirjalili, S.; Gandomi, A.H.; Mirjalili, S.Z.; Saremi, S.; Faris, H.; Mirjalili, S.M. Salp Swarm Algorithm: A bio-inspired optimizer for engineering design problems. Adv. Eng. Software 2017, 114, 163–191. [Google Scholar] [CrossRef]
- Frank, W. Individual Comparisons of Grouped Data by Ranking Methods. J. Econ. Entomol. 1946, 39, 269–270. [Google Scholar]
- Friedman, M. The use of ranks to avoid the assumption of normality implicit in the analysis of variance. J. Am. Stat. Assoc. 1937, 32, 676–701. [Google Scholar] [CrossRef]
- The Berkeley Segmentation Dataset and Benchmark. Available online: https://www2.eecs.berkeley.edu/Research/Projects/CS/vision/grouping/segbench/ (accessed on 3 March 2019).
- Landsat imagery courtesy of NASA Goddard Space Flight Center and U.S. Geological Survey. Available online: https://landsat.visibleearth.nasa.gov/index.php?&p=1 (accessed on 3 March 2019).
- Jia, H.; Lang, C.; Oliva, D.; Song, W.; Peng, X. Hybrid Grasshopper Optimization Algorithm and Differential Evolution for Multilevel Satellite Image Segmentation. Remote Sens. 2019, 11, 1134. [Google Scholar] [CrossRef]
- Bhandari, A.K.; Singh, V.K.; Kumar, A.; Singh, G.K. Cuckoo search algorithm and wind driven optimization based study of satellite image segmentation for multilevel thresholding using Kapur’s entropy. Expert Syst. Appl. 2014, 41, 3538–3560. [Google Scholar] [CrossRef]
- Elaziz, M.A.; Oliva, D.; Xiong, S. An improved opposition-based sine cosine algorithm for global optimization. Expert Syst. Appl. 2017, 90, 484–500. [Google Scholar] [CrossRef]
- Dinkar, S.K.; Deep, K. An efficient opposition based Lévy Flight Antlion optimizer for optimization problems. Int. J. Comput. Sci. Eng. 2018, 29, 119–141. [Google Scholar] [CrossRef]
- Aldahdooh, A.; Masala, E.; Wallendael, G.V.; Barkowsky, M. Framework for reproducible objective video quality research with case study on PSNR implementations. Dig. Signal Process. 2018, 77, 195–206. [Google Scholar] [CrossRef]
- John, J.; Nair, M.S.; Kumar, P.R.A.; Wilscy, M. A novel approach for detection and delineation of cell nuclei using feature similarity index measure. Biocybern. Biomed. Eng. 2016, 36, 76–88. [Google Scholar] [CrossRef]
- Wang, Z.; Bovik, A.C.; Sheikh, H.R.; Simoncelli, E.P. Image quality assessment: from error visibility to structural similarity. IEEE T. Image Process. 2004, 13, 600–612. [Google Scholar] [CrossRef]
- data-Dragonfly-Algorithm-with-Opposition-based-Learning-for-Multilevel-Thresholding-Color-Image-Segmentation. Available online: https://github.com/baoxiaoxue/Dragonfly-algorithm/blob/master/data-Dragonfly-Algorithm-with-Opposition-based-Learning-for-Multilevel-Thresholding-Color-Image-Segmentation.pdf (accessed on 8 March 2019).


| Original Image | Histogram | Original Image | Histogram |
|---|---|---|---|
 Cow |  |  Cat |  |
| Image 1 | Image 2 | ||
 Zebra |  |  Weasel |  |
| Image 3 | Image 4 | ||
 Massif |  |  The stark transitions and vertical ecology of the canyon. |  |
| Image 5 | Image 6 | ||
 Chesapeake Bay in America. |  |  An area about 50 kilometers southeast of Paso de Indios. |  |
| Image 7 | Image 8 | ||
 The emergence of performance made by the Kilauea eruption. |  |  The growth in the city of New Delhi and its adjacent areas. |  |
| Image 9 | Image 10 | ||
| Algorithm | Parameters Setting |
|---|---|
| DA [39] | Constant |
| PSO [23] | Learning factors , Maximum velocity |
| SCA [41] | Controlling parameter |
| BA [25] | Loudness ; Factor updating pulse emission rate |
| HSO [42] | PAR (Pitch Adjustment Rate) HMCR (Harmony Memory Considering Rate) |
| ALO [43] | controlling parameter |
| SSA [44] | Constant |
| Images | K | Otsu’s Method | Kapur’s Entropy | ||||||||||||||
|---|---|---|---|---|---|---|---|---|---|---|---|---|---|---|---|---|---|
| OBLDA | DA | PSO | SCA | BA | HSO | ALO | SSA | OBLDA | DA | PSO | SCA | BA | HSO | ALO | SSA | ||
| Image 1 | 4 | 3953.7954 | 3953.7954 | 3953.7950 | 3948.8042 | 3953.6831 | 3953.3067 | 3953.7954 | 3953.7954 | 18.5002 | 18.5000 | 18.4897 | 18.4613 | 18.4166 | 18.4963 | 18.5004 | 18.5000 |
| 6 | 4019.8423 | 4019.5048 | 4018.7985 | 4006.9266 | 4017.3416 | 4017.2234 | 4018.8162 | 4018.8103 | 24.0001 | 23.9799 | 23.9811 | 23.6436 | 23.8908 | 23.8975 | 23.9811 | 23.9812 | |
| 8 | 4048.9152 | 4048.8504 | 4043.3223 | 4024.1493 | 4037.8143 | 4045.3231 | 4048.8877 | 4048.9101 | 28.8948 | 28.8129 | 28.7723 | 27.9375 | 28.5409 | 28.7200 | 28.8752 | 28.8702 | |
| 10 | 4063.1978 | 4063.1284 | 4061.1137 | 4039.0225 | 4050.5883 | 4059.3896 | 4062.5624 | 4061.703 | 33.4351 | 33.3523 | 33.1358 | 32.1934 | 31.8645 | 33.1194 | 33.3902 | 33.3934 | |
| 12 | 4070.6228 | 4070.1573 | 4070.6001 | 4054.429 | 4046.507 | 4066.2912 | 4069.932 | 4068.7841 | 37.4560 | 37.4284 | 37.3461 | 34.7885 | 35.2101 | 37.2779 | 37.4413 | 37.4221 | |
| Image 2 | 4 | 3485.1247 | 3485.1199 | 3485.1147 | 3479.1374 | 3484.6777 | 3484.7292 | 3485.1247 | 3485.1247 | 19.1186 | 19.1186 | 19.1185 | 19.1085 | 19.1174 | 19.1166 | 19.1180 | 19.1186 |
| 6 | 3569.7989 | 3569.7975 | 3569.7922 | 3553.9263 | 3562.3733 | 3569.7989 | 3569.7902 | 3569.7900 | 24.5049 | 24.5036 | 24.5045 | 24.3797 | 24.4700 | 24.4768 | 24.5040 | 24.5040 | |
| 8 | 3604.7775 | 3604.7703 | 3604.6050 | 3576.8452 | 3583.8077 | 3600.4796 | 3604.7761 | 3601.4317 | 29.2700 | 29.2643 | 29.2628 | 28.6983 | 28.8901 | 29.1724 | 29.2609 | 29.2626 | |
| 10 | 3622.8818 | 3622.4558 | 3620.6747 | 3597.7083 | 3583.8832 | 3618.0966 | 3622.6152 | 3622.5331 | 33.6123 | 33.5556 | 33.5548 | 32.2689 | 32.6558 | 33.4410 | 33.5631 | 33.5566 | |
| 12 | 3631.3102 | 3630.5562 | 3630.7006 | 3614.941 | 3612.3747 | 3626.1269 | 3630.062 | 3630.8461 | 37.5249 | 37.5245 | 37.5247 | 34.4781 | 35.1123 | 37.1587 | 37.4867 | 37.4748 | |
| Image 3 | 4 | 1632.9348 | 1632.9348 | 1632.9325 | 1629.3742 | 1632.8832 | 1632.5101 | 1632.9329 | 1632.9348 | 17.9080 | 17.9078 | 17.9080 | 17.8708 | 17.9068 | 17.8966 | 17.9080 | 17.9078 |
| 6 | 1679.6273 | 1679.6224 | 1679.6217 | 1663.4943 | 1675.7384 | 1678.9156 | 1678.6165 | 1679.0983 | 23.0198 | 23.0113 | 23.0190 | 22.8565 | 22.9702 | 22.9593 | 23.0187 | 23.0159 | |
| 8 | 1699.6539 | 1699.6112 | 1696.9162 | 1677.6783 | 1694.3511 | 1697.2418 | 1699.6475 | 1699.3764 | 27.6599 | 27.6578 | 27.5934 | 26.8723 | 27.5156 | 27.5298 | 27.6759 | 27.6531 | |
| 10 | 1709.7547 | 1709.2274 | 1709.5613 | 1691.5336 | 1689.6933 | 1704.8673 | 1709.7315 | 1709.4691 | 31.9288 | 31.9280 | 31.8964 | 30.1086 | 30.4496 | 31.6635 | 31.9204 | 31.9034 | |
| 12 | 1715.2551 | 1714.8516 | 1712.1207 | 1700.6739 | 1700.4449 | 1709.738 | 1715.0877 | 1714.0964 | 35.7785 | 35.2063 | 35.7770 | 32.6783 | 32.7375 | 35.2639 | 35.7784 | 35.1769 | |
| Image 4 | 4 | 1319.9491 | 1319.9489 | 1319.9491 | 1315.3303 | 1318.9811 | 1319.5916 | 1319.9491 | 1319.9488 | 18.4918 | 18.4916 | 18.4912 | 18.4622 | 18.4872 | 18.4819 | 18.4918 | 18.4918 |
| 6 | 1369.0221 | 1369.0213 | 1368.9969 | 1357.1484 | 1366.7841 | 1367.9945 | 1369.0211 | 1369.0126 | 23.6922 | 23.6914 | 23.6905 | 23.4468 | 23.6669 | 23.6125 | 23.6912 | 23.6905 | |
| 8 | 1390.0326 | 1390.0305 | 1387.4005 | 1374.3224 | 1389.2622 | 1387.4095 | 1389.1814 | 1388.5589 | 28.3095 | 28.3024 | 28.3067 | 27.9281 | 27.9847 | 28.2587 | 28.3063 | 28.3095 | |
| 10 | 1399.6458 | 1399.4009 | 1393.7362 | 1384.4908 | 1384.9509 | 1396.9234 | 1399.0229 | 1187.096 | 32.5892 | 32.5865 | 32.5866 | 31.5723 | 31.3348 | 32.2579 | 32.5867 | 32.5830 | |
| 12 | 1405.8609 | 1405.6402 | 1404.5624 | 1384.8868 | 1393.2781 | 1401.2297 | 1403.591 | 1404.5764 | 36.3739 | 36.3688 | 36.3520 | 35.5627 | 34.4852 | 35.9779 | 36.3635 | 36.3490 | |
| Image 5 | 4 | 2424.6317 | 2424.5708 | 2424.5708 | 2421.2203 | 2424.5139 | 2424.2945 | 2424.5708 | 2424.5708 | 18.7381 | 18.7380 | 18.7372 | 18.6731 | 18.7217 | 18.7326 | 18.7368 | 18.7381 |
| 6 | 2487.0084 | 2480.7669 | 2482.092 | 2478.4116 | 2485.5045 | 2483.8617 | 2487.0064 | 2487.0084 | 24.0292 | 24.0291 | 24.0237 | 23.6952 | 23.9584 | 24.0064 | 24.0234 | 24.0273 | |
| 8 | 2512.4189 | 2512.3053 | 2510.9344 | 2483.7068 | 2501.1752 | 2507.5583 | 2512.0236 | 2509.5901 | 28.7437 | 28.7079 | 28.7114 | 27.7347 | 28.2776 | 28.5286 | 28.7435 | 28.5687 | |
| 10 | 2525.6094 | 2523.4752 | 2519.899 | 2501.6225 | 2509.8173 | 2520.1389 | 2525.2327 | 2523.6277 | 32.9891 | 32.9847 | 32.9252 | 30.6967 | 31.0099 | 32.6646 | 32.9300 | 32.9754 | |
| 12 | 2530.8468 | 2528.9949 | 2529.6907 | 2516.2091 | 2520.8127 | 2527.7053 | 2529.6778 | 2530.163 | 36.8054 | 36.8009 | 36.0273 | 34.6304 | 34.6947 | 36.4877 | 36.8046 | 36.7984 | |
| Image 6 | 4 | 1729.2257 | 1729.2257 | 1710.9382 | 1726.02 | 1728.9882 | 1728.7219 | 1729.2257 | 1729.2257 | 18.7778 | 18.7777 | 18.7778 | 18.7436 | 18.7745 | 18.7679 | 18.7769 | 18.7771 |
| 6 | 1779.9929 | 1779.9572 | 1779.9568 | 1763.9461 | 1779.0967 | 1777.7373 | 1779.9756 | 1779.9854 | 24.3551 | 24.3548 | 24.3540 | 24.1236 | 24.3076 | 24.3070 | 24.3542 | 24.3547 | |
| 8 | 1803.9526 | 1802.8008 | 1795.0211 | 1784.771 | 1790.259 | 1799.7721 | 1802.807 | 1802.7834 | 29.3048 | 29.2998 | 29.3031 | 28.8361 | 28.7555 | 29.1911 | 29.3036 | 29.3047 | |
| 10 | 1815.0429 | 1814.9534 | 1811.5293 | 1790.7357 | 1801.2403 | 1810.245 | 1814.0664 | 1814.4409 | 33.8351 | 33.8267 | 33.8347 | 31.9216 | 32.8086 | 33.6537 | 33.8307 | 33.8329 | |
| 12 | 1821.8206 | 1820.4563 | 1820.6098 | 1808.1162 | 1811.6587 | 1815.7141 | 1820.9947 | 1820.3147 | 37.9567 | 37.9542 | 37.9549 | 35.9544 | 35.8609 | 37.7342 | 37.9491 | 37.9458 | |
| Image 7 | 4 | 1400.5487 | 1400.5411 | 1401.5411 | 1398.0046 | 1400.263 | 1399.7372 | 1400.5411 | 1400.5411 | 18.8176 | 18.8176 | 18.7891 | 18.7644 | 18.8076 | 18.8011 | 18.7891 | 18.8176 |
| 6 | 1441.0137 | 1440.9204 | 1440.957 | 1434.6068 | 1439.9286 | 1438.5452 | 1441.0115 | 1441.0045 | 24.2838 | 24.2726 | 24.2829 | 24.1141 | 24.0625 | 24.2560 | 24.2830 | 24.2811 | |
| 8 | 1459.6243 | 1459.4003 | 1457.3171 | 1444.2693 | 1437.1488 | 1454.8626 | 1459.6151 | 1459.5502 | 29.2380 | 29.2294 | 29.2352 | 28.9236 | 28.6026 | 29.1200 | 29.2287 | 29.1742 | |
| 10 | 1469.8421 | 1469.7252 | 1469.5444 | 1454.5045 | 1456.5918 | 1466.0482 | 1469.7097 | 1468.6476 | 33.6991 | 33.3882 | 33.5775 | 32.1851 | 31.6970 | 33.4260 | 33.5922 | 33.5392 | |
| 12 | 1475.6342 | 1475.1504 | 1470.2697 | 1458.6954 | 1464.184 | 1472.219 | 1475.04 | 1472.8635 | 37.7112 | 37.7027 | 37.7076 | 36.0898 | 35.1335 | 37.5058 | 37.7066 | 37.7104 | |
| Image 8 | 4 | 1435.7222 | 1435.7222 | 1435.6897 | 1433.7968 | 1435.3505 | 1435.276 | 1435.7102 | 1435.7222 | 18.9585 | 18.9577 | 18.9585 | 18.9197 | 18.9482 | 18.9551 | 18.9583 | 18.9585 |
| 6 | 1500.0958 | 1500.0244 | 1500.0858 | 1484.1328 | 1498.127 | 1497.5381 | 1500.0134 | 1500.0237 | 24.4135 | 24.4116 | 24.4134 | 24.2572 | 24.3735 | 24.3847 | 24.4119 | 24.4102 | |
| 8 | 1525.3523 | 1524.7003 | 1525.3076 | 1510.2877 | 1501.9411 | 1521.2577 | 1525.1779 | 1525.17 | 29.3185 | 29.3176 | 29.3148 | 28.8671 | 28.7157 | 29.2512 | 29.3110 | 29.3181 | |
| 10 | 1539.6603 | 1539.1758 | 1537.4876 | 1523.3336 | 1526.3035 | 1533.9908 | 1539.5515 | 1539.3363 | 33.7653 | 33.7651 | 33.7626 | 32.6958 | 31.8454 | 33.4981 | 33.7650 | 33.7640 | |
| 12 | 1547.4005 | 1547.3542 | 1542.4244 | 1530.2169 | 1535.4957 | 1542.9102 | 1547.3996 | 1547.319 | 37.8293 | 37.8240 | 37.8254 | 36.2574 | 35.9844 | 37.6199 | 37.8005 | 37.8229 | |
| Image 9 | 4 | 2853.1743 | 2853.1743 | 2853.1743 | 2849.576 | 2853.0584 | 2852.8073 | 2853.1743 | 2853.1743 | 18.7385 | 18.7381 | 18.7384 | 18.7146 | 18.7368 | 18.7333 | 18.7380 | 18.7399 |
| 6 | 2915.6723 | 2915.6408 | 2894.6826 | 2890.4899 | 2905.9451 | 2914.0036 | 2915.6679 | 2915.6702 | 24.0631 | 24.0627 | 24.0627 | 23.7434 | 24.0047 | 23.9918 | 24.0582 | 24.0356 | |
| 8 | 2941.2851 | 2941.1941 | 2933.3113 | 2918.6224 | 2910.8135 | 2939.6153 | 2941.0111 | 2941.237 | 28.9499 | 28.9433 | 28.9440 | 28.1130 | 27.8489 | 28.7974 | 28.9490 | 28.9297 | |
| 10 | 2954.834 | 2954.2199 | 2951.2338 | 2927.0843 | 2937.4698 | 2950.6298 | 2954.8092 | 2954.7299 | 33.3109 | 33.3062 | 33.3021 | 31.6533 | 31.6872 | 33.3069 | 33.3070 | 33.2021 | |
| 12 | 2962.1541 | 2961.8913 | 2960.7891 | 2959.7651 | 2952.4187 | 2958.9889 | 2962.037 | 2961.0798 | 37.5425 | 37.5421 | 37.3316 | 34.9365 | 34.8915 | 37.3107 | 37.5144 | 37.4505 | |
| Image 10 | 4 | 1052.6908 | 1052.6841 | 1052.6714 | 1048.6873 | 1052.5839 | 1052.0294 | 1052.6908 | 1052.6908 | 18.8252 | 18.8252 | 18.8250 | 18.7850 | 18.8041 | 18.8167 | 18.8246 | 18.8246 |
| 6 | 1098.1595 | 1098.1333 | 1092.3076 | 1074.308 | 1088.9246 | 1096.6478 | 1098.1543 | 1098.1595 | 24.4177 | 24.4173 | 24.4172 | 24.2592 | 24.3146 | 24.3716 | 24.4170 | 24.4144 | |
| 8 | 1119.4996 | 1119.4816 | 1113.553 | 1095.8843 | 1113.587 | 1118.2696 | 1119.4058 | 1119.4948 | 29.3734 | 29.3678 | 29.3727 | 28.5648 | 28.7556 | 29.2970 | 29.3724 | 29.3639 | |
| 10 | 1130.8408 | 1130.7943 | 1127.75 | 1112.7634 | 1119.2282 | 1126.4325 | 1130.8091 | 1130.5106 | 33.8442 | 33.8427 | 33.8357 | 32.6137 | 32.3177 | 33.7053 | 33.8423 | 33.8435 | |
| 12 | 1137.1022 | 1136.8308 | 1133.8866 | 1121.5446 | 1126.9476 | 1131.71 | 1137.0952 | 1136.4462 | 37.9201 | 37.9055 | 37.9185 | 37.9017 | 37.0123 | 37.5918 | 37.9171 | 37.9133 | |
| Images | K | OBLDA | DA | PSO | SCA | BA | HSO | ALO | SSA |
|---|---|---|---|---|---|---|---|---|---|
| Image 1 | 4 | 0.000 | 0.134 | 0.013 | 5.200 | 0.165 | 0.276 | 0.000 | 0.000 |
| 6 | 0.015 | 0.232 | 3.230 | 6.040 | 3.160 | 0.697 | 1.670 | 0.156 | |
| 8 | 0.189 | 0.340 | 3.780 | 5.150 | 7.220 | 1.090 | 1.470 | 1.710 | |
| 10 | 0.401 | 1.250 | 1.420 | 5.630 | 52.500 | 1.390 | 0.558 | 0.519 | |
| 12 | 0.431 | 0.579 | 0.685 | 4.620 | 4.690 | 0.986 | 0.625 | 0.805 | |
| Image 3 | 4 | 0.000 | 0.020 | 5.280 | 1.040 | 0.109 | 0.228 | 0.000 | 0.000 |
| 6 | 0.067 | 0.090 | 3.410 | 4.890 | 7.150 | 0.690 | 0.070 | 0.074 | |
| 8 | 0.112 | 0.315 | 3.780 | 5.670 | 4.420 | 1.430 | 1.480 | 0.250 | |
| 10 | 0.199 | 2.310 | 1.860 | 3.650 | 4.480 | 1.460 | 0.503 | 0.588 | |
| 12 | 0.542 | 0.793 | 2.850 | 5.120 | 4.790 | 0.804 | 0.876 | 0.842 | |
| Image 5 | 4 | 0.004 | 0.024 | 4.150 | 5.630 | 4.500 | 0.492 | 0.026 | 0.000 |
| 6 | 0.002 | 0.322 | 2.100 | 6.070 | 5.780 | 0.596 | 2.140 | 0.005 | |
| 8 | 0.012 | 1.580 | 1.450 | 2.560 | 9.090 | 1.210 | 1.010 | 0.058 | |
| 10 | 0.250 | 1.510 | 2.890 | 5.480 | 7.350 | 1.090 | 0.996 | 0.690 | |
| 12 | 0.610 | 1.080 | 2.100 | 3.350 | 5.210 | 1.170 | 0.744 | 0.881 | |
| Image 7 | 4 | 0.000 | 0.030 | 5.190 | 6.180 | 0.443 | 1.080 | 0.000 | 0.000 |
| 6 | 0.003 | 0.178 | 2.360 | 4.890 | 3.550 | 0.480 | 0.007 | 0.006 | |
| 8 | 0.242 | 0.254 | 2.550 | 5.790 | 5.770 | 0.857 | 0.310 | 0.502 | |
| 10 | 0.398 | 0.460 | 1.020 | 2.450 | 4.780 | 1.370 | 0.394 | 0.489 | |
| 12 | 0.501 | 0.671 | 0.658 | 6.990 | 3.470 | 0.963 | 0.545 | 0.712 | |
| Image 9 | 4 | 0.000 | 0.000 | 0.278 | 1.100 | 0.105 | 0.370 | 0.002 | 0.000 |
| 6 | 0.021 | 0.028 | 3.170 | 2.890 | 5.150 | 1.160 | 0.027 | 0.022 | |
| 8 | 0.196 | 0.216 | 3.630 | 3.460 | 5.190 | 0.660 | 0.199 | 0.201 | |
| 10 | 0.124 | 0.433 | 1.990 | 3.210 | 4.890 | 1.840 | 0.358 | 0.577 | |
| 12 | 0.232 | 0.272 | 1.310 | 2.660 | 3.990 | 0.892 | 0.993 | 1.180 |
| Images | K | OBLDA | DA | PSO | SCA | BA | HSO | ALO | SSA |
|---|---|---|---|---|---|---|---|---|---|
| Image 2 | 4 | 0.000 | 0.000 | 0.000 | 0.007 | 0.001 | 0.025 | 0.000 | 0.000 |
| 6 | 0.000 | 0.000 | 0.000 | 0.031 | 0.051 | 0.033 | 0.000 | 0.001 | |
| 8 | 0.002 | 0.006 | 0.005 | 0.200 | 0.357 | 0.031 | 0.003 | 0.004 | |
| 10 | 0.015 | 0.073 | 0.305 | 0.313 | 0.478 | 0.033 | 0.015 | 0.059 | |
| 12 | 0.027 | 0.030 | 0.214 | 0.589 | 0.790 | 0.066 | 0.029 | 0.029 | |
| Image 4 | 4 | 0.000 | 0.000 | 0.001 | 0.015 | 0.001 | 0.021 | 0.001 | 0.000 |
| 6 | 0.001 | 0.001 | 0.007 | 0.035 | 0.051 | 0.015 | 0.013 | 0.015 | |
| 8 | 0.021 | 0.021 | 0.028 | 0.251 | 0.313 | 0.064 | 0.022 | 0.030 | |
| 10 | 0.030 | 0.034 | 0.202 | 0.387 | 0.534 | 0.079 | 0.032 | 0.049 | |
| 12 | 0.039 | 0.043 | 0.467 | 0.508 | 0.602 | 0.055 | 0.048 | 0.060 | |
| Image 6 | 4 | 0.000 | 0.008 | 0.016 | 0.007 | 0.003 | 0.003 | 0.001 | 0.001 |
| 6 | 0.002 | 0.004 | 0.003 | 0.034 | 0.024 | 0.012 | 0.001 | 0.001 | |
| 8 | 0.005 | 0.012 | 0.014 | 0.199 | 0.499 | 0.022 | 0.007 | 0.007 | |
| 10 | 0.012 | 0.033 | 0.012 | 0.266 | 0.742 | 0.035 | 0.035 | 0.027 | |
| 12 | 0.031 | 0.046 | 0.044 | 0.353 | 0.672 | 0.082 | 0.050 | 0.045 | |
| Image 8 | 4 | 0.000 | 0.000 | 0.000 | 0.008 | 0.012 | 0.003 | 0.001 | 0.000 |
| 6 | 0.001 | 0.005 | 0.004 | 0.065 | 0.049 | 0.012 | 0.004 | 0.003 | |
| 8 | 0.002 | 0.019 | 0.002 | 0.185 | 0.201 | 0.037 | 0.012 | 0.002 | |
| 10 | 0.011 | 0.015 | 0.013 | 0.297 | 0.342 | 0.069 | 0.035 | 0.018 | |
| 12 | 0.022 | 0.033 | 0.026 | 0.355 | 0.426 | 0.033 | 0.048 | 0.027 | |
| Image 10 | 4 | 0.001 | 0.002 | 0.001 | 0.015 | 0.003 | 0.005 | 0.001 | 0.001 |
| 6 | 0.002 | 0.002 | 0.002 | 0.057 | 0.053 | 0.022 | 0.002 | 0.002 | |
| 8 | 0.006 | 0.006 | 0.006 | 0.096 | 0.384 | 0.016 | 0.006 | 0.006 | |
| 10 | 0.001 | 0.017 | 0.006 | 0.232 | 0.498 | 0.051 | 0.003 | 0.010 | |
| 12 | 0.002 | 0.023 | 0.007 | 0.432 | 0.631 | 0.063 | 0.005 | 0.018 |
| Comparison | P-value (Otsu) | P-value (Kapur) |
|---|---|---|
| OBLDA versus DA | 2.5389 × 10⁻⁶ | 5.1569 × 10⁻⁴ |
| OBLDA versus PSO | 1.4569 × 10⁻⁶ | 8.5902 × 10⁻⁵ |
| OBLDA versus SCA | 2.4901 × 10⁻⁸ | 3.7915 × 10⁻⁶ |
| OBLDA versus BA | 2.3762 × 10⁻⁴ | 6.8903 × 10⁻⁷ |
| OBLDA versus HSO | 6.3917 × 10⁻⁵ | 6.1372 × 10⁻⁵ |
| OBLDA versus ALO | 4.7835 × 10⁻⁶ | 1.0937 × 10⁻⁵ |
| OBLDA versus SSA | 0.1003 | 0.0005 |
| K | OBLDA | DA | PSO | SCA | BA | HSO | ALO | SSA | P-value |
|---|---|---|---|---|---|---|---|---|---|
| 4 | 2.5167 | 3.7667 | 4.6333 | 7.3000 | 5.8333 | 6.0667 | 2.0833 | 3.3000 | 4.3904 × 10⁻²³ |
| 6 | 1.5125 | 3.8625 | 7.2250 | 6.2000 | 5.3500 | 4.5125 | 3.5750 | 3.7625 | 2.1183 × 10⁻²⁹ |
| 8 | 1.3534 | 3.8833 | 5.9000 | 5.9667 | 6.3500 | 5.2500 | 3.5333 | 4.1167 | 1.3943 × 10⁻²⁰ |
| 10 | 1.0125 | 3.6375 | 4.8875 | 5.9375 | 6.7000 | 5.6625 | 3.7875 | 4.3750 | 2.9605 × 10⁻²⁸ |
| 12 | 1.0125 | 4.5125 | 5.4250 | 6.0250 | 6.3125 | 5.1750 | 3.7250 | 3.8125 | 6.6435 × 10⁻²⁶ |
| all | 1.2525 | 3.9450 | 5.1150 | 6.4250 | 6.3075 | 5.5350 | 3.6175 | 3.8025 | 1.3442 × 10−86 |
| K | Exhaustive Search Method | Otsu’s Method | Kapur’s Method | ||||
|---|---|---|---|---|---|---|---|
| OBLDA | DA | Δ | OBLDA | DA | Δ | ||
| 2 | 600.676 | 3.66784 | 3.78047 | 2.97% | 3.76887 | 3.89403 | 3.34% |
| 4 | ─ | 3.88478 | 4.10389 | 5.33% | 3.87450 | 4.09988 | 5.37% |
| 6 | ─ | 4.17290 | 4.46438 | 6.52% | 4.13641 | 4.46217 | 7.39% |
| 8 | ─ | 4.59074 | 4.99335 | 8.06% | 4.58363 | 4.99469 | 8.21% |
| 10 | ─ | 5.06321 | 5.52094 | 8.49% | 5.04612 | 5.51358 | 8.52% |
| 12 | ─ | 5.57285 | 6.20345 | 10.1% | 5.56335 | 6.20046 | 10.3% |
© 2019 by the authors. Licensee MDPI, Basel, Switzerland. This article is an open access article distributed under the terms and conditions of the Creative Commons Attribution (CC BY) license (http://creativecommons.org/licenses/by/4.0/).
Share and Cite
Bao, X.; Jia, H.; Lang, C. Dragonfly Algorithm with Opposition-Based Learning for Multilevel Thresholding Color Image Segmentation. Symmetry 2019, 11, 716. https://doi.org/10.3390/sym11050716
Bao X, Jia H, Lang C. Dragonfly Algorithm with Opposition-Based Learning for Multilevel Thresholding Color Image Segmentation. Symmetry. 2019; 11(5):716. https://doi.org/10.3390/sym11050716
Chicago/Turabian StyleBao, Xiaoli, Heming Jia, and Chunbo Lang. 2019. "Dragonfly Algorithm with Opposition-Based Learning for Multilevel Thresholding Color Image Segmentation" Symmetry 11, no. 5: 716. https://doi.org/10.3390/sym11050716
APA StyleBao, X., Jia, H., & Lang, C. (2019). Dragonfly Algorithm with Opposition-Based Learning for Multilevel Thresholding Color Image Segmentation. Symmetry, 11(5), 716. https://doi.org/10.3390/sym11050716