Abstract
Collaboration has been common in workplaces in various engineering settings and in our daily activities. However, how to effectively engage collaborators with collaborative tasks has long been an issue due to various situational and technical constraints. The research in this paper addresses the issue in a specific scenario, which is how to enable users to interact with public information from their own perspective. We describe a 3D mobile interaction technique that allows users to collaborate with other people by creating a symmetric and collaborative ambience. This in turn can increase their engagement with public displays. In order to better understand the benefits and limitations of this technique, we conducted a usability study with a total of 40 participants. The results indicate that the 3D mobile interaction technique promotes collaboration between users and also improves their engagement with the public displays.
1. Introduction
The presence of interactive displays in public spaces is no longer uncommon [1]. This prevalence has caused people to become reliant on them to get information for various purposes. For example, a touch display is installed at the entrance of a shopping mall for customers to find information, contact details and floor locations of all the retail stores, service providers, cafés and restaurants. Public displays can be also seen in urban spaces and public areas to display commercial advertisements or information such as a street map. Despite their usefulness in our everyday environments, how to effectively engage users with public displays has long been a research topic. Parra et al. [2] conducted a field study and found that interactive displays may be effective in capturing attention, but this does not necessarily mean users will be guided toward achieving the specific goal of the display. Hosio et al. [1] suggested that for public displays to sustain engagement over extended periods of time, it is important to use appropriate techniques and input modalities to motivate users. However, much of the attention of current research has been paid to public displays that focus on individual activities, isolating users from each other. This characteristic is one of the reasons why, as a medium, interactive public displays have problems holding a user’s attention [3].
We propose a 3D mobile technique using augmented reality (AR) technologies [4,5] that allow users to collaboratively interact with public displays in real time. AR enables content created by 3D modeling tools such as Autodesk 3ds Max and Blender to be spatially interacted with in real-world three-dimensional space. It uses the screen of mobile devices as a way to give individual users a unique perspective of the information on the public display and at the same time is a tool that lets users interact with that information. It is believed that these characteristics afford users the ability to collaborate with other people by creating a collaborative ambience that can increase their engagement with public displays.
In this article, we describe the proposed 3D mobile interaction technique and report on a usability study that was conducted to understand the differences between the proposed technique and traditional public display interactions. The usability study was based on a real-world scenario, in which users had to plan a hiking trip around Cradle Mountain in Tasmania, Australia. Results show that using the mobile device screen to give users unique points of view of the same content with private information creates new forms of collaboration. Results from the experiment also show that using these tools to achieve collaboration allows for the enhancement of user engagement with public displays. These results confirm that engagement can happen if users are involved with sociable and dedicated activities [6].
This paper is an extended version based on its conference paper [4] and is organized as follows: the next section describes the state of the art in the area of user experimentation with public displays for general use and collaboration. Section 3 presents the proposed 3D mobile interaction. Section 4 describes the usability study. Section 5 presents a discussion of the usability test results. Finally, the paper finishes with Section 6, where the conclusions are presented and future work in this area is discussed.
2. Related Work
Previous studies conducted with public displays can be classified into two types. The first type refers to those that investigate the individual user experience around public displays (e.g., [7]). The second type of study is about enabling collaboration around public displays and creating interaction techniques that allow multiple users to share and participate in common activities (e.g., [8,9]).
2.1. Individual User Experience
There have been three types of public display interaction previously explored. Kurdyukova et al. [7] classify these as gestural, touch, and mobile interactions. Gestural interaction entails moving the body or moving a tool in front of the public display (e.g., [10]). Touch interaction allows the use of a tool or the body to control the public display by touching it. The third category—mobile interaction—uses a mobile device as a remote control of the public display.
One aspect that puts constraints in the creation of a positive individual user experience is that public displays can be used by any person. Different users have different backgrounds, thus having different preferences when it comes to experience [3]. Kurdyukova et al. [7] compared user experience when those three interactions were used. It was found that users preferred to remain discreet while being able to control the display from a distance. They also found that there was a need to minimize physical motion while interacting with the screen, and that users preferred to have an overview of the whole screen at all times. In other words, an interaction technique for public displays needs to give users the freedom to choose any position to interact with the screen. Moreover, users would like an interaction technique that can change between touching the display and using mobile devices depending on the situation.
Another aspect that needs to be taken into consideration when designing interactions for public displays is the need to keep interactions easy enough for all users to be able to understand them, as public display users do not always have the time or the will to learn new interaction techniques. Therefore, one challenge of public displays regarding user experience is the need to give users input expressiveness [11]. In other words, enabling natural input is made by letting users use familiar skills or movements to control the public display. Research has been done to explore mobile interactions that use a mobile device with a touch screen to control the public display. For example, Hyakutake et al. [12] and Baldauf et al. [13] utilized the mobile device screen as a private screen. Brignull and Rogers [14] proposed to point the mobile device camera to the public display and control the content directly on the mobile device screen, thus giving both input expressiveness and privacy at the same time.
2.2. Collaborative User Experience
A public display’s setting means it is difficult to foresee the way users will interact with it [15]. An interaction can start and end without notice, can happen in groups or individuals, and can be affected by everything happening around the public display. Technologies have been developed to address this challenge, but they require extra setup as shown by Matsushita and Rekimoto [16] and Clayphan et al. [17].
Mobile devices have been used before to create an easy-to-set collaborative public display experience. These interactions use mobile devices as a way to personalize a user’s experience by giving private feedback, showing private information, and transferring content using a Wi-Fi connection. Three examples that use mobile interactions with public displays are systems reported by Reid, et al. [18], Scheible and Ojala [19], and Lucero et al. [20]. These systems all separate the interactions into two distinct steps. In the first step, users will use the mobile device to do an action, and in the second step, that action may be shared with all participants of the activity using the public display. For example, in [20], interacting users used the mobile device to create comic strips in groups of three, and then they sent that comic strip to a public display via Wi-Fi. In the end, individual users voted for the best comics displayed on the public display using their mobile devices.
2.3. Summary
Based on this literature review, we can see that using mobile devices as an interaction tool keeps the setup to interact with public displays to a minimum. This in turn lets users start an interaction quickly and easily, thus increasing the possibility for it to happen. Mobile devices have other advantages. For example, their screen gives users the ability to keep some of the information private, and most users are already familiar with touch gestures. However, when analyzing the literature about the use of mobile devices to create collaboration around public displays, we found there exists a separation between the mobile device screen and the public display screen, as users are guided to pay more attention to one of the screens. This separation limits the way users can interact with each other as each user can see the same information all the time and their main attention is on their own mobile device. Other features of mobile devices such as entertainment and input expressiveness have also not been fully explored in this setting, as most interaction techniques focus solely on touch gestures.
3. 3D Mobile Interaction
We propose a 3D mobile interaction based on augmented reality (AR) technologies to take advantage of the two screens available in order to make collaboration around public displays fluid. Instead of making users focus on the mobile device screen or the public display we connect both screens, creating a multidimensional space where 3D content could exist outside the public display. Special attention was given to create tools that users could utilize to collaborate with other users without the need to depend on those users, i.e., tools that allow for interactions to start and finish independent of the other users. This is an important characteristic for public display users [3]. Additionally, successful characteristics of other interactions were incorporated, mostly the use of the mobile device’s camera to give input expressiveness to the interaction techniques, and the use of the mobile device screen to display private information.
Based on the need to link two different screens, i.e., the public display and the mobile device screen, we designed for three different layers of information visualization (see also Figure 1)—the public layer, virtual layer, and private layer. Our conceptual model was based on the model of Lee et al. [21] for various screens that not only visualize information individually, but also allow for layers of visualization that work together and complement each other to form a single information/virtual space.
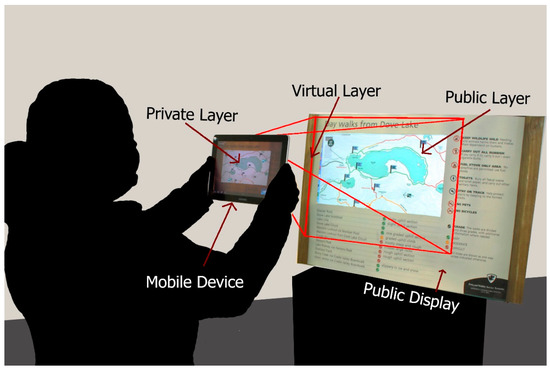
Figure 1.
Interaction space outlining three different visual layers in a 3D space, i.e., a private layer, a virtual layer, and a public layer.
Each individual layer has a unique function in the overall interaction. The public layer has information accessible by all of the people around the public display with or without a mobile device. Its working space is on the public display screen, as is typically the case with a normal static or interactive public display. The virtual layer is the space formed between the mobile device and the public display. Here, users that are seeing the public display through their mobile device, can see and interact with public 3D content spatially stabilized in the real world. As the content is superimposed on top of the real world, the physical location of the user(s) around the public display gives them a unique point of view of the content. Finally, the private layer working space is on the mobile device screen, and is where information personalized to each user is presented. This information is private and secure, as it is only visible and accessible on each individual mobile device screen. Using these three interaction layers, the 3D mobile interaction with public displays creates a collaborative ambience around the display. In this space, users have two interaction layers, public and virtual, where the content is available for all users and where they can collaborate together and see each other’s contributions. Additionally, there is the private layer, where users have their own personalized user interface, thus giving them the ability to privately navigate through content. In addition to giving users visual feedback for each input, the mobile device can provide users also with audio and haptic clues after they perform an action. This means the users can have a shared space where they can concurrently work together, but with the option to exit that space at any given moment to continue their own exploration of the public display content alone.
3.1. System Development
The proposed prototype for 3D mobile interactions for public displays was developed using Unity 3D and the C# programming language. It follows server–client architecture and has four main components. The first component is the tracking module that determines the location of nearby mobile devices relative to the public display. The Vuforia Unity 3D extension, an AR software library, was used to provide the core tracking capability. The second component is the spatial mapping module that spatially correlates the interaction/touch surface of the mobile devices to the surface area of the large displays. The third component is the processing and communication module, in which an authoritative server controls the client’s connection to the public display. The server is in charge of making sure that all clients are updated on the actions of the other clients and that personalized feedback is given to each client depending on their action. The fourth component is the user gestures module, which utilizes existing multitouch user interaction available on mobile devices. After the multitouch interaction is processed on the mobile device, a command-based input is sent through a Wi-Fi network to the server to execute the command input such as repositioning.
The implementation of the virtual layer, where the collaborative ambience resides, uses the four previously described modules that link the virtual layers created by each client together with the server. Each client has a unique private layer that enables them to see the changes made to the content and to bring that content (especially 3D content) outside the public display screen. To interact with that content, the tracking module spatially maps the user’s touch in 2D coordinates with the 3D space inside the public display. This is achieved by superimposing a 3D transparent grid that covers the whole screen surface in front of the entire public display’s background. When the user touches the screen, a raycast from the camera to the client grid is sent from the user’s input position. If the raycast hits a tile from the grid, the tile name is sent to the server. After the position is obtained, a second raycast is sent from the server tile position to the specific client position, values that previously are sent to the server. When either the first raycast or the second raycast hits an object, this object is selected by the client who sends the input. The method described above is shown in Figure 2.
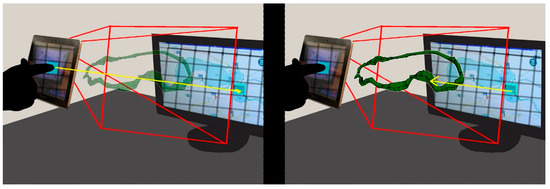
Figure 2.
System mapping.
Once the object is selected, its coordinate system changes to mimic the coordinate system of the client’s device. This is achieved by copying the rotation values of the client, depending on the rotation of the client, the angle changes and the selected object will be moved. Therefore, if the client is not parallel to the public display, the selected object will be brought out from the public layer into the virtual layer and a 3D model of the object is created in each client with the same transformation values.
3.2. Interaction Design
The design of the proposed 3D mobile interaction is guided by the visualization technique called content augmentation. This is a technique that follows an augmented reality approach that superimposes private 2D and 3D content on the public display onto a specific position and scale, so that it can be easily related to the content displayed on the public layer. Users see this augmented content on their private screens depending on the settings they have and the area of the public display they are seeing. The interaction with this content is achieved by using the interaction technique called content manipulation, in which touch gestures translate and rotate the content. Additionally, using a Magic Lenses metaphor proposed by Bier et al. [22], a multiple view interaction technique gives users the ability to see all the faces of content in 3D, by moving the mobile device around it. This also empowers users to increase or decrease the content size of 2D content by reducing or increasing the distance between the mobile device and the public display.
This multiple-layer approach could lead to having multiple objects on screen at the same time. Therefore, the user interface design was focused on giving users a clean screen. The main goal was to let users see the content on the three interaction layers without overlaying information. Figure 3 shows the user interface layout divided in four sections. Three sections of extra information with server connection buttons (1); log information (2); input buttons (3); and an input area (4). The buttons are grouped together and their visual style and position on the screen corresponds to the frequency the user will be needing them.
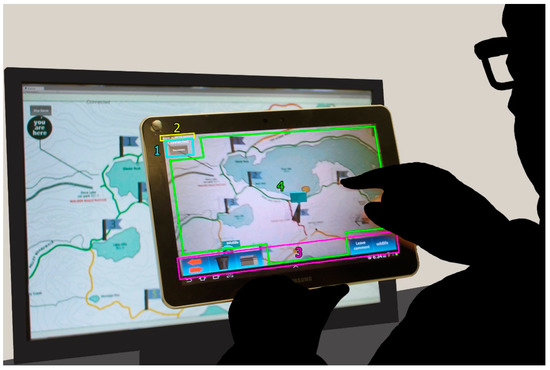
Figure 3.
User Interface, showing the server connection button (1); log information (2); input buttons (3); and the input area (4).
Each button has a different functionality linked to a different interaction technique. The content modification and content creation interaction techniques are achieved with the buttons: “delete content” and “create content”. Both interactions work in the private layer, where users can previsualize the result of their action in private before making it public using the content transfer interaction techniques. In the prototype, this transfer is achieved by using the transfer button. An extra button, “store content for future use”, helps users to retain the information from the public layers on their mobile device. The last button, “see more information”, was created as a way to give users different points of view from the information on the public display. To avoid clutter on the screen, the more the info button is used, the more button leads to the extra information appearing as markers on the map. If users want to explore that information, they need to select the icon, which reveals the information available for that place. In this manner, users have a way to individually explore the content of the public display without interrupting other users’ activities. They can however at that same time talk together about the content, thus creating collaboration with those around them.
At the center of the screen (in Figure 3 area (4)) is the touch input area. It is where the content manipulation interaction technique occurs and users use common touch input gestures to interact with the public display content. The available interaction techniques in the prototype are shown in Figure 4; these are: one finger touch and select, one finger drag and translate, two fingers scale, and two fingers rotate.
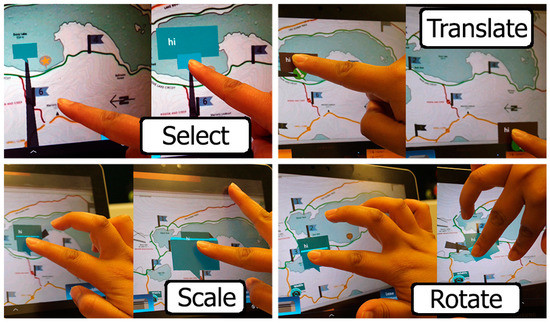
Figure 4.
Interaction Techniques.
All of these content manipulation interaction techniques (selection, reposition/translation, scale, and rotation) can be achieved either in 2D or 3D depending on the mobile device position to the public display. This approach facilitates the understanding of the movement in 6DOF, as the user always moves the object in two axes, but depending on the view the final result changes. All these interaction techniques give users the ability to manipulate and interact with 6DOF, as they are tools that can create a fluid collaborative ambience that is integrated with the real world.
4. Experiment
The study focused on answering the following two research questions:
- (1)
- Can the proposed 3D mobile interaction increase the level of engagement to the content displayed on the public display?
- (2)
- How can the proposed 3D mobile interactions enable collaboration among users of public displays?
These research questions were based on the ability of the 3D mobile interaction to create a collaborative ambience for collaborators to interact with each other around the public displays where users have different perspectives of the information on the public display [23]. Our goal was to determine if creating a collaborative space enables collaboration and increases engagement.
For the experiment, the proposed 3D mobile interaction with public displays was deployed in a controlled environment. We had two different groups choosing between the same answers to the same questions—those that used the proposed 3D mobile interaction, and those that used a traditional public display interaction. In order for all groups to have the same starting conditions, all participants role-played their part with the information given to them, for example: age of the hikers, starting time, and weather. The dependent variables were the time it takes to complete each task, the total talking time, the quantity of topics that the group talks about, the type of conversations each group has, and the number of tools and information the participants use to complete the task.
4.1. Context
A total of 40 participants (22 males, 18 females; age range 19–58; mean age 24.5 years) participated in the study. Most of the participants were computer science students, but some were also community members interested in testing a new way to control and interact with public displays. The participants were asked to come with a friend, and each pair was randomly assigned to either the traditional group (which used a static public display) or the mobile group (which used the proposed 3D mobile interaction prototype). The participants were asked to role-play as two tourists that want to spend the day hiking and taking pictures of Dove Lake at Cradle Mountain National Park and to plan their route with the given tools.
The proposed 3D mobile interaction prototype was adapted to this scenario. The focus was to create a tool that casual hikers or tourists could use to plan a more informed hiking trip, focusing on activities they would want to do in the park, e.g., taking pictures, looking for wildlife, and knowing the “real” shape and inclination of each trail without relying on topographic lines that they may not know how to read. The first modification to the prototype was to create a “more information” button to give members of the same hiking group different points of view. This allowed each user to see three different types of extra information on their private display, with information localized on top of the public display information as follows:
- Wildlife: with pictures of wildlife sighted at that position. The pictures show what types of animals are commonly found there.
- Landscapes: with pictures of the view from that position.
- Notes: with extra information of that particular spot, mimicking comments other hikers could leave on the public display.
The prototype also allowed users to select flags from the public display and transfer them to the virtual layer, using a select and translate movement. When this happens, a 3D trail appears on the virtual layer, which has figures of hikers to help users to define where the up position is located and signs showing the elevation of the trail. The trail appears for all users viewing the public display through a mobile device, and as it is 3D content, the information is different depending on the spot where they are looking at it from. In this way they can move around the virtual 3D trail and see the shape of the trail and the elevation, thus being able to plan a better hiking trip. In binding to this, the user that brought the trail out of the screen would also see extra information for that trail on their private screen as shown in Figure 5. This extra information includes: the trail name and number, distance, elevation, and the average time to talk the trail. Additionally, there is mock-up weather information shown for the day.
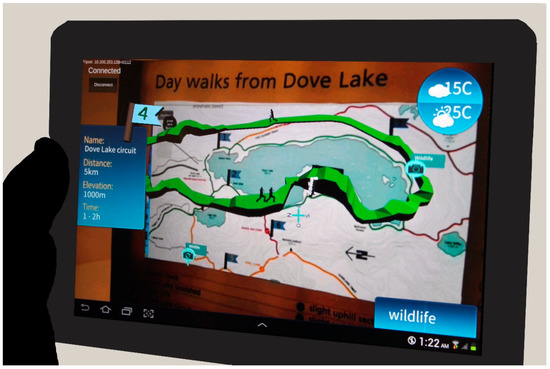
Figure 5.
Extra information when a trail is selected.
The user’s evaluation was run at the HIT Lab AU in the University of Tasmania during September 2014. The workshop was adapted to emulate a real world location of the public display within a controlled setting. A 27′′ iMac computer was used as the public display, and to complement the information on the screen a real size print of the information was pasted around the map.
4.2. Theoretical Framework
Our usability test tries to answer our two research questions. To accomplish this, we divide our theoretical framework into two areas for testing:
Collaboration
There has been considerable work where the collaboration level of groups around public displays has been analyzed [24]. This includes work by Müller, et al. [3], Tang [25], and Reid, et al. [18]. For this experiment, we defined collaboration as being “when working in groups, participants often conduct face-to-face meetings to accelerate the exchange of ideas or opinions, or to complete a cooperative task” (Kitamura et al. [26], p. 167).
To find if collaboration occurred, we used an approach similar to that described by Jakobsen and HornbÆk [27], in which they analyzed the conversation patterns of a group’s conversations around wall-sized public displays. In this approach, the group conversation of each session is divided into subconversations according to the topic spoken about. Each time participants changed topics, a new subconversation started. This means the number of conversations is equal to the number of main topics spoken about. These subconversations are classified into three levels of verbal communication between group participants [27]: the first level is silence, where no one is talking; the second level of conversation is when one participant is talking; and the third level is when both are talking.
Engagement
The importance of engagement in public displays as a way to increase the time spent interacting with them has been explored before (e.g., [28,29]). To identify if engagement occurs during the experiment, we used the total task completion time as our main variable. We decided to use total time as our main variable because the usability test meets the characteristics of what O’Brien and Toms [30] described as the period of engagement in an activity. This period starts when users have already been attracted to the user interface and have started an interaction. With this in mind, we designed the experiment scenarios to test the presentation of feedback and information on the user interface. Putting attention to those details was to put users in charge of the interaction and make them more likely to stay in the engagement period [30].
Besides using the total task completion time to measure engagement, we also investigate if collaboration encourages engagement between participants. To do this, we used the following indicators identified by Bryan-Kinns et al. [6] to measure mutual engagement:
- (1)
- Proximal interaction measure: measures how close participants work to each other.
- (2)
- Mutual modification measure: indicates each participant’s contribution to the final results.
- (3)
- Contribution to joint production measure: indicates the increased contribution to final results.
4.3. Design
This section describes a set of scenarios we created to encourage participants to collaborate with each other in order to reach a group decision. We decided to base our scenarios on the needs of tourists visiting national parks in Tasmania, for example casual hikers that need accessible information to better plan their hikes. At this moment, there are onsite public displays with maps containing general information related to the trails nearby, including representations of the hiking trails, the level of difficulty of each trail, and the average time it takes to walk the trail. These maps do not however provide enough information to help a beginner choose between two similar trails. For this reason, the goal of our scenarios was to give each member of the group the tools to sustain their opinion in a discussion after individually exploring the public display in order to create mutual engagement. Therefore, each scenario was designed to make participants consider different information in order to reach the most suitable answer. All three scenarios were based on a public display already present in Cradle Mountain National Park in Tasmania. At the beginning of each scenario, participants were told about the localization of the public display in the map including where they were in relation to it (i.e., “you are here”), and then told one of the following scenarios:
Scenario 1: In this scenario, participants were asked to compare two trails (Marion’s Lookout via Wombat Pool and Marion’s Lookout via Lake Dove) that reach Marion’s Lookout, and to choose the trail that presents the most challenge but is the shortest (less than 2 h). This scenario was determined to be a way to test the use of the 3D models to create engagement, as the participants could use them to explore each trail in depth and spend time comparing both trails. The right answer was easy to spot, as Marion’s Lookout via Lake Dove’s trail is steeper. This information was easy to find if the participants read the topographic lines. Other information that participants could take into consideration, and as shown in the private display for each user, was the total time needed to complete each trail (traditional group participants were informed verbally of the duration of each trail, as this information was not available on the real public display), and the difficulty of the trail. In order to equalize the role-playing of all groups, other constraints were given to each group. In particular, they were told that they were a couple of fit hikers, the starting time was 10am, and the weather was cloudy.
Scenario 2: Participants in this scenario needed to compare three fixed positions on the same trail (Dove Lake Circuit) in order to take the best picture of Dove Lake without getting into a dangerous situation. The common information for all groups to role play during the scenario was that they were two older people, the starting time was 1 pm, and the weather was hot. This scenario was designed as a way to test the content augmentation interaction technique, as participants needed to explore each geolocalized information on the trail, like pictures and notes in order to choose the right answer, point 2. Participants in the traditional display condition used other types of information, like the shape and inclination of the trail to decide the location. Although different information was used, the answer could be the same, as all participants had the same starting conditions. For example, participants were indicated the walking direction (clockwise), and they were given the choice to return the same way or complete the circuit, which if the correct answer was chosen would mean avoiding the steepest part of the trail.
Scenario 3: The final scenario was determined to test the relationship between the augmented information and the content manipulation interaction techniques, as participants needed to compare three fixed points on the same trail (Hanson’s Peak trail) taking into consideration the view and the inclination of each point. The role playing information was that participants were looking for a flat place to sit and have lunch, but at the same time the place needed to be high enough to get a good view of Cradle Mountain. The information to standardize all groups was that participants were two young casual hikers, the starting time was 9 am, and the weather was windy. In this scenario, the right answer was point 2 and participants not only needed to take into consideration the inclination of the trail (using the 3D model or topographic lines), but also the available geolocalized information and the private information they would get, i.e. the amount of time it would take to reach the summit.
In each scenario, the final goal was to see if the use of three layers of information creates a fluid interaction. Special attention was given to the ability of the participant to individually explore the map, either by seeing augmented information, or by moving around the 3D content, as this ability gives them multiple views of the same content, thus enabling them to sustain their opinion of what the best answer was. Figure 6 shows two users of the 3D mobile interaction group partaking in the experiment.
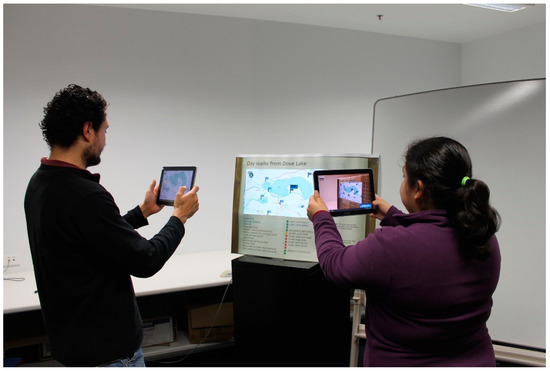
Figure 6.
Experiment in progress.
To gather data of each group session in the proposed 3D mobile interaction prototype, we implemented functionalities to automatically capture the user inputs (touch gestures, position, rotation, and pointing to the public display). These inputs were sent to the server, where a synchronized log for the two mobile devices was created. This log also included the start and end time of each scenario. Beside this, an audio log, also synchronized with the server time, was taken in order to record the group’s conversation patterns needed to evaluate collaboration. In addition, we manually captured data for the start and end times of each group, and data based on the observed number of times each participant (i) pointed to the screen; (ii) talked to their group member; (iii) put their mobile device down; and (iv) shared their mobile device with their teammate. Finally, each participant received a questionnaire that let us see their answer to the scenario individually. This questionnaire was given to the participants at the beginning to know statistical data (age, gender, hiking experience) and after each scenario to know their answer to the question and what type of tools they used.
All data obtained was transformed to quantitative data. In particular, the conversation patterns of each group were analyzed in the following way. First we separated each group audio log into silence and talking. Then we identified which group member was the one that was talking. If both group members were having a discussion (less than one second of silence between the next answer) we classified this as a “both talking” event. If a longer silence existed, that conversation was classified as “one talking”. After we finished with this classification, we counted the number of seconds spent in each category and the number of topics for each category. It is important to note that other considerations were taken into account in order to be able to measure mutual engagement using these subconversations:
- Proximal interaction measure: To identify this characteristic, we limit the time between the instance that one group member finishes talking and the time that the other members starts talking (one second or less). If the silence time between each participant exceeded this limitation, the subconversation was finished and a new one was started. This precaution was especially important in identifying “both” subconversations.
- Mutual modification measure: To identify this characteristic, we counted a subconversation as “both” when participants where incorporating different opinions to the discussion. When one participant agrees on the other participant’s opinion, even with words, that conversation was labelled as “one”.
- Contribution to joint production measure: To identify this characteristic, we only counted towards the subconversation analysis the topics related to the content of the public display.
Once we analyzed all of the groups’ conversations, each of their total topics, one, both and silence time were added together to get the mean and other statistical data for that information. Finally, the data collected was analyzed using descriptive statistics (means and standard deviation for each group) and inferential statistics (two-way ANOVA with repeated measures).
To measure engagement, we count the seconds between starting time and ending time for each scenario. Additionally, we take into consideration the following activities during and after the experiment in order to fulfil the broader scope of engagement we mentioned previously:
- Novelty: the used elements in the user interface were analyzed to see the browsing pattern of each user. We theorize that if users find the elements interesting or unusual they will seek them out, clicking them multiple times and looking at all the information available.
- Engagement: our interface has three information levels and we take participants’ sustained interest in the information if they explore all information levels. The three levels of information available are:
- ○
- Level 1: geolocalized information on the map and accessible with one click.
- ○
- Level 2: more information (pictures, comments) on top of that geolocalized information and accessible with two clicks.
- ○
- Level 3: 3D models only visible in the cooperative space and that enhance the information already available on the public display. This information is accessible using touch gestures like translation.
The software used to do the statistical analysis was IBM SPSS Version 22.
5. Results and Discussion
Before being able to compare how having different points of view enables collaboration around public displays, we first analyzed the data to see if the knowledge acquirement between groups was the same. We found that scenarios 1 and 3 had no statistical significant difference between them, which means that the knowledge acquirement on these scenarios was similar, as both groups had statistically the same number of right and wrong answers. However, in scenario 2, there was a statistical significant difference between groups (Table 1).

Table 1.
Scenarios two-way ANOVA results.
A further analysis of scenario 2 shows that the mobile group had specific information about the scenario and that the traditional group had general information that could be used in any case. Analyzing the written answers, some groups in the traditional display condition focused more on taking a good picture than on the fact that two older people may have difficulty arriving at that spot. For example, one traditional participant wrote “at point 3 there is elevated land which blocks the view from 1 and 2; 3 has the best view because it is highest”. In opposition one mobile participant wrote “Includes sitting bench and not too steep incline, good view of lake” (of point 1). Therefore, the basic information on the map (distance, elevation, and shape of trail) was equally acquired in each group. However extra information like landscape pictures and notes about the trail that the proposed 3D mobile interaction provides to the user are not available on the map and they can help users to make a better decision. These results are not foreign to the proposed 3D mobile interaction as one of the interaction techniques proposed is augmenting extra content on the public display that can be personalized for each user.
5.1. Collaboration
Analysis showed no statistically significant difference between the time talking in each groups and either conversation type (p > 0.05), however there is a statistical significant difference in topics between conversation types and groups. Due to the nature of the data, from an audio log, we cannot say that “one talking” conversation type means or does not mean collaboration, as it would need to compare it to other data like the visual attention of the participants during that conversation as done by Jakobsen and HornbÆk [27] or the participant gestures as done by Tang [25]. However, with the “both talking” conversation category, it is certain that there is collaboration and with the precautions taken to divide the conversations we can use this category to determine if mutual engagement occurred. The statistical significant difference between groups in that category (Table 2) means that the mobile group discussed more topics in the third level conversation type:

Table 2.
Group conversation patterns two-way ANOVA.
In the three scenarios, mobile interaction groups talked about more topics than the traditional group interactions (Figure 7).
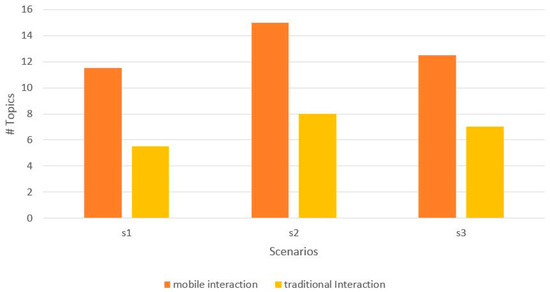
Figure 7.
Groups topics discussed via talking.
A topic can be related to the scenario (weather, time), the information (inclination, distance) and the group (giving tasks, asking opinions). By using the mobile device screen to augment information on top of the public display, users were given multiple views that resulted in users discussing more topics and more within a topic. Written answers from participants to the question about how the mobile app allowed them to collaborate, verified this point. For example, one participant wrote “giving me a basic information to discuss”, another participant also wrote “it allowed for greater communication and clarification”. In conclusion, by analyzing the topics by talking, the results show that the mobile group participants talked more and used more information while solving the scenarios.
5.2. Engagement
To measure engagement, the time spent doing each scenario for each group was analyzed. In scenario 1, the mean between mobile groups and traditional groups is 2.65 with a standard deviation of 1.531. In scenario 2, the mean between mobile groups and traditional groups is 3.10 with a standard deviation of 1.861. In scenario 3, the mean between mobile groups and traditional groups is 2.10 with a standard deviation of 1.252 (Figure 8).
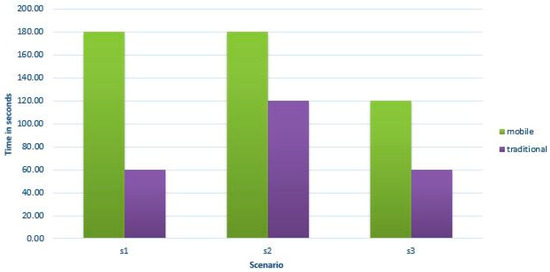
Figure 8.
Task completion time (median).
Analysis shows no statistically significant difference between the scenarios in either groups (p > 0.05), however there is a statistical significant difference between interaction types and between interaction types * scenarios (p > 0.05). The statistical difference presented between interaction types (Table 3) is important in this study because it shows that creating a collaborative ambient environment has an impact on the time spent using the public display. On the other hand, the statistical difference between scenario * interactions means that depending on the task, users will spend different time working on the scenarios.

Table 3.
Task completion time.
The results of task completion time show a trend that the subjects in the mobile group spent more time doing the task. However, as stated in the previous section, total time is not enough to know if engagement happened and other information needs to be taken into account. Therefore, we analyzed the mobile group usage of the prototype to find if the interface achieved novelty and engagement.
To find if engagement with the user interface occurred, we analyzed the exploration pattern of each user regarding the number of tools in each level used in each scenario. For Level 1 (content augmentation buttons, four options available—wildlife, notes, landscapes, trail flag), participants used on average for the three scenarios (75% of the tools). For Level 2 (3D interaction objects, four options available—camera, comment, warning, highpoint), participants used on average 50% of the tools. For Level 3 (7 trails), participants used on average 24% of the trails. Figure 9 shows the tools usage divided in scenarios and in tools levels.
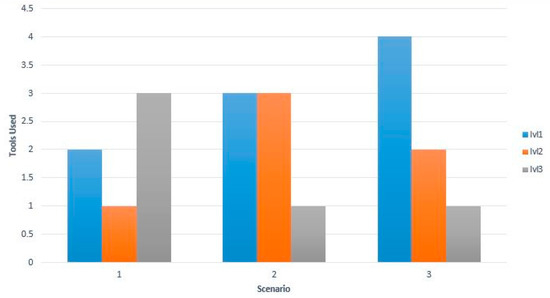
Figure 9.
Tools used (median).
Based on the data showed earlier, we can say that participants used all the information levels of the interface. Taking into consideration the questionnaire responses, we found that mobile group participants rely on the tools that help them augment information on top of the map, such is the case of Level 2 tools landscapes and notes. We also found that they complemented that information with the Level 3 tools—3D models that showed the slope of the trail and brought the extra information. In opposition to this traditional group, participants heavily relied on the topographic lines to make a decision in all three scenarios. However, they complemented that information with the text around the map that described the difficulty level of the trail and a description of the inclination. An interesting result found is that in scenario 1, the same number of traditional group participants used the text around the map and the topographic lines to answer the question. More importantly, depending on the scenario one level of information was more used than other, regardless of the difficulty to access it. For example, scenario 1 needed to compare two trails and the data shows that more tools of that level were used than of the two previous levels. However, in scenario 2, participants needed to differentiate two spots on the same trail and participants found the augmented information useful so they equally used Level 1 and Level 2 tools.
We used the correlation of the previous results with the participant’s repetition pattern for the tools in each level to show us the novelty of the user interface. The tool repetition pattern is illustrated in Figure 10. On average for the three scenarios, participants used Level 1 tools 35.5 times, and for tools in Level 2, participants used them 5.3 times on average (Figure 10).
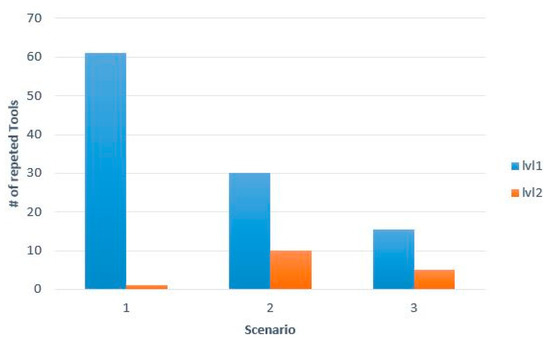
Figure 10.
Tools repetition pattern (median).
For level 3, we used the amount of time the 3D model spent on the collaborative space instead of the number of trails sent to this space, because the 3D model could stay on the collaborative space for the time the participant wanted, so they didn’t need to be sending it to the collaborative space in order to be using it. On average, participants had 1 min 22 seconds the 3D model on the collaborative space (Figure 11).
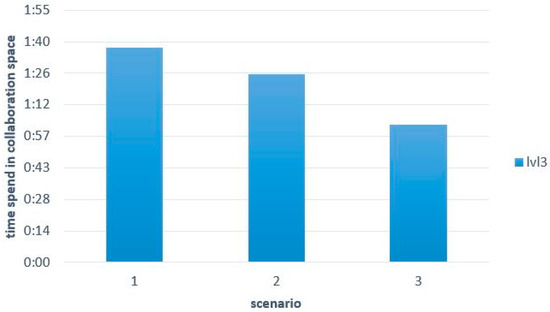
Figure 11.
Time (mean) in collaborative space.
The data shown earlier shows us the interface novelty, measured in terms of the number of times each tool level was repeatedly used. Each tool level repetition times decreased in each scenario, proven by the statistical difference between the scenarios in each tool level. For tools level 1, the p-value is 2.797 × 10⁻⁹, for tools level 2, the p-value is 3.517 × 10⁻⁷ and for tools level 3, the p-value is 3.038 × 10⁻¹⁸. This result shows us that participants still used the available tools multiple times during the experiment, however that usage decreased in each scenario. The wear-off of the novelty is not an unexpected result, as the participants had the same content to explore during each scenario and they solved these scenarios subsequently.
To create engagement, both interface usage and time should go hand on hand. Therefore, we can base our answer to this question on the time participants spent solving the scenario and if the usage and repetition times of the tools available for them. In the last section, the statistical significant difference of time between interaction types (p > 0.05), plus a comprehensive analysis of the interface exploration shows that participants not only used the tools available but also used them repeatedly, which mean that engagement occurred when the mobile groups solved the scenarios.
At the beginning when discussing collaboration, the statistically significant difference in topics between interactions (p > 0.05) was shown, which means that participants collaborate more between them. In conclusion, the proposed 3D mobile interaction improves a user’s engagement by creating a collaborative ambient environment where users can explore different information, while at the same time interacting together and talking about their findings. Written answers from participants to the question about how the mobile app allowed them to collaborate, state this point. For example, one participant wrote, “We could both find information separately and compare and use extra information like wildlife and tools”, Another participant wrote, “It allowed us to compare and discuss the options together”.
6. Conclusions
In this article, a 3D mobile interaction technique was described and the results of its usability study were presented. The proposed 3D mobile interaction using AR technologies merges the mobile device’s private screen with the natural skills a 3D user interfaces uses in order to give users different points of view of the 2D and 3D content on the public display. The usability study investigated if these interaction techniques help users engage with public display more by creating a collaborative ambience.
The usability study was based on a real world scenario, i.e., planning a hiking trip to Cradle Mountain in Tasmania. It used a prototype developed using Unity 3D and C#. There were 20 groups in total, with 10 groups using the proposed 3D mobile information (n = 20) and 10 groups using a traditional interaction (n = 20). The groups were evaluated while planning three different scenarios using the information available in the public display and the mobile device. Statistical data analysis showed that having different views creates collaboration, by giving users the ability to explore the public display content together, but at the same time being able to maintain their own investigation speed (f = 6.790, sig. 0.012). Data analysis also showed that the proposed 3D mobile interaction statistically increased the time spent on the public display by creating a collaborative ambience where users can have different points of view of the same content at the same time (f = 5.861, sig. = 0.018).
The importance of this conclusion relies on the challenges that public displays face. One of them is to get the users’ attention and to motivate users to start an interaction. Once the interactions start, the challenge is to maintain their engagement regardless of the events around the public display. Collaboration has already been found to be a way to motivate users to use public displays, and our usability study results demonstrate that having different points of view enables collaboration among users of public displays. Additionally, our results show that creating a collaborative ambient environment can link to higher levels of engagement with public displays.
For future work, 3D mobile interactions with public displays can be explored in more depth, especially their relationship to users. Our proposed 3D mobile interaction can also be extended in the following respects:
- The usability test scenario, bushwalking, was tested in a controlled environment inside the HIT Lab AU. To evaluate the proposed 3D mobile interaction in a real setting, future analysis could be done in a field study. This could lead to other types of collaboration this usability study did not explore.
- The proposed 3D mobile interaction was tested in one of the many scenarios where public displays can be used. Future research can conduct other usability tests to evaluate the proposed 3D mobile interaction in one of those scenarios.
- An off-location scenario of the interaction is interesting and worth exploring as a follow-up activity after the initial on-location scenario engagement, which is the focus of this paper. This could further increase the level of user engagement.
Author Contributions
M.D.B.M. and W.C. conceived the design of the proposed collaborative 3D mobile interaction. M.D.B.M., W.C., W.H. and H.D. designed the experiments. M.D.B.M. performed the experiments and preliminarily analyzed the data. R.W., W.H. and M.D.B.M. did the in-depth analysis of the data. M.D.B.M. wrote the first draft of the paper, which was subsequently reviewed and edited by W.C., W.H., and R.W.
Conflicts of Interest
The authors declare no conflicts of interest.
References
- Hosio, S.; Kukka, H.; Goncalves, J.; Kostakos, V.; Ojala, T. Toward Meaningful Engagement with Pervasive Displays. IEEE Pervasive Comput. 2016, 15, 24–31. [Google Scholar] [CrossRef]
- Parra, G.; Klerkx, J.; Duva, E. Understanding Engagement with Interactive Public Displays: An Awareness Campaign in the Wild. In Proceedings of the International Symposium on Pervasive Displays (PerDis ’14), Copenhagen, Denmark, 3–4 June 2014; ACM: New York, NY, USA, 2014. [Google Scholar]
- Müller, J.; Alt, F.; Schmidt, A.; Michelis, D. Requirements and Design Space for Interactive Public Displays. In Proceedings of the 18th ACM International Conference on Multimedia, Firenze, Italy, 25–29 October 2010; ACM: New York, NY, USA, 2010; pp. 1285–1294. [Google Scholar]
- Machuca, M.D.B.; Chinthammit, W.; Yang, Y.; Duh, H. 3D mobile interactions for public displays. In Proceedings of the SIGGRAPH Asia 2014 Mobile Graphics and Interactive Applications (SA ’14), Shenzhen, China, 3–6 December 2014; ACM: New York, NY, USA, 2014. Article 8. [Google Scholar]
- Azuma, R.T. A survey of augmented reality. Presence Teleoper. Virtual Environ. 1997, 6, 355–385. [Google Scholar] [CrossRef]
- Bryan-Kinns, N.; Healey, P.; Leach, J. Exploring mutual engagement in creative collaborations. In Proceedings of the 6th ACM SIGCHI Conference on Creativity & Cognition (C&C ’07), Washington, DC, USA, 13–15 June 2007; ACM: New York, NY, USA, 2007; pp. 223–232. [Google Scholar]
- Kurdyukova, E.; Obaid, M.; André, E. Direct, Bodily or Mobile Interaction? Comparing Interaction Techniques for Personalized Public Displays. In Proceedings of the 11th International Conference on Mobile and Ubiquitous Multimedia, Ulm, Germany, 4–6 December 2012; ACM: New York, NY, USA, 2012. [Google Scholar]
- Huang, W.; Kaminski, B.; Luo, J.; Huang, X.; Li, J.; Ross, A.; Wright, J.; An, D.H. SMART: Design and evaluation of a collaborative museum visiting application. In Proceedings of the 12th International Conference on Cooperative Design, Visualization, and Engineering, Mallorca, Spain, 20–23 September 2015; pp. 57–64. [Google Scholar]
- Huang, W.; Alem, L.; Tecchia, F. HandsIn3D: Supporting remote guidance with immersive virtual environments. In Proceedings of the IFIP Conference on Human-Computer Interaction, Cape Town, South Africa, 2–6 September 2013; pp. 70–79. [Google Scholar]
- Vogel, D.; Balakrishnan, R. Distant freehand pointing and clicking on very large, high resolution displays. In Proceedings of the 18th Annual ACM Symposium on User Interface Software and Technology (UIST ’05), Seattle, WA, USA, 23–26 October 2005; ACM: New York, NY, USA, 2005; pp. 33–42. [Google Scholar]
- Schmidt, D.; Seifert, J.; Rukzio, E.; Gellersen, H. A Cross-Device Interaction Style for Mobiles and Surfaces. In Proceedings of the Designing Interactive Systems Conference, Newcastle Upon Tyne, UK, 11–15 June 2012; ACM: New York, NY, USA, 2012; pp. 318–327. [Google Scholar]
- Hyakutake, A.; Ozaki, K.; Kitani, K.; Koike, H. 3-D Interaction with a Large Wall Display using Transparent Markers. In Proceedings of the International Conference on Advanced Visual Interfaces, Roma, Italy, 26–28 May 2010; ACM: New York, NY, USA, 2010; pp. 97–100. [Google Scholar]
- Baldauf, M.; Lasinger, K.; Fröhlich, P. Private Public Screens—Detached Multi-User Interaction with Large Displays through Mobile Augmented Reality. In Proceedings of the 11th International Conference on Mobile and Ubiquitous Multimedia, Ulm, Germany, 4–6 December 2012; ACM: New York, NY, USA, 2012; p. 27. [Google Scholar]
- Brignull, H.; Rogers, Y. Enticing people to interact with large public displays in public spaces. In Proceedings of the IFIP TC13 International Conference on Human-Computer Interaction (Human-Computer Interaction INTERACT ’03), Zurich, Switzerland, 1–5 September 2003; IOS Press: Amsterdam, The Netherlands, 2003; pp. 17–24. [Google Scholar]
- Hinrichs, U.; Carpendale, S.; Valkanova, N.; Kuikkaniemi, K.; Jacucci, G.; Vande Moere, A. Interactive Public Displays. IEEE Comput. Graph. Appl. 2013, 33, 25–27. [Google Scholar] [CrossRef] [PubMed]
- Matsushita, N.; Rekimoto, J. HoloWall: Designing a Finger, Hand, Body, and Object Sensitive Wall. In Proceedings of the ACM Symposium on User Interface Software and Technology (UIST), Banff, AB, Canada, 14–17 October 1997; pp. 209–210. [Google Scholar]
- Clayphan, A.; Martinez-Maldonado, R.; Ackad, C.; Kay, J. An approach for designing and evaluating a plug-in vision-based tabletop touch identification system. In Proceedings of the 25th Australian Computer-Human Interaction Conference on Augmentation, Application, Innovation, Collaboration (OzCHI ’13), Adelaide, Australia, 25–29 November 2013; ACM: New York, NY, USA, 2013; pp. 373–382. [Google Scholar]
- Reid, J.; Hyams, J.; Shaw, K.; Lipson, M. “Fancy a Schmink?”: A novel networked game in a café. In Proceedings of the 2004 ACM SIGCHI International Conference on Advances in Computer Entertainment Technology, Singapore, 3–5 June 2004; ACM: New York, NY, USA, 2004; pp. 18–23. [Google Scholar]
- Scheible, J.; Ojala, T. MobiLenin combining a multitrack music video, personal mobile phones and a public display into multi-user interactive entertainment. In Proceedings of the 13th Annual ACM International Conference on Multimedia (MULTIMEDIA ’05), Singapore, 6–11 November 2005; ACM: New York, NY, USA, 2005; pp. 199–208. [Google Scholar]
- Lucero, A.; Holopainen, J.; Jokela, T. MobiComics: Collaborative use of mobile phones and large displays for public expression. In Proceedings of the 14th International Conference on Human-Computer Interaction with Mobile Devices and Services (MobileHCI ’12), San Francisco, CA, USA, 21–24 September 2012; ACM: New York, NY, USA, 2012; pp. 383–392. [Google Scholar]
- Lee, G.; Yang, U.; Son, W. Layered multiple displays for immersive and interactive digital contents. In Proceedings of the International Conference on Electronic Commerce (ICEC ’06), Cambridge, UK, 20–22 September 2006; Springer: Berlin/Heidelberg, Germany, 2006; pp. 123–134. [Google Scholar]
- Bier, E.A.; Stone, M.C.; Pier, K.; Buxton, W.; DeRose, T.D. Toolglass and Magic Lenses: The See-Through Interface. In Proceedings of the 20th Annual Conference on Computer Graphics and Interactive Techniques (SIGGRAPH ’93), Anaheim, CA, USA, 2–6 August 1993; pp. 73–80. [Google Scholar]
- Bachl, S.; Tomitsch, M.; Kappel, K.; Grechenig, T. The effects of personal displays and transfer techniques on collaboration strategies in multi-touch based multi-display environments. In Proceedings of the 13th IFIP TC 13 International Conference on Human-Computer Interaction (INTERACT ’11), Lisbon, Portugal, 5–9 September 2011; Springer: Berlin/Heidelberg, Germany, 2011; Volume Part III, pp. 373–390. [Google Scholar]
- Huang, W.; Alem, L.; Livingston, M.A. Human Factors in Augmented Reality Environments; Springer: New York, NY, USA, 2013. [Google Scholar]
- Tang, J. Findings from observational studies of collaborative work. Int. J. Man-Mach. Stud. 1991, 34, 143–160. [Google Scholar] [CrossRef]
- Kitamura, Y.; Osawa, W.; Yamaguchi, T.; Takemura, H.; Kishino, F. A display table for strategic collaboration preserving private and public information. In Proceedings of the 4th International Conference on Entertainment Computing (ICEC ’05), Sanda, Japan, 19–21 September 2005; Springer: Berlin/Heidelberg, Germany, 2005; pp. 167–179. [Google Scholar]
- Jakobsen, M.; HornbÆk, K. Up close and personal: Collaborative work on a high-resolution multitouch wall display. ACM Trans. Comput.-Hum. Interact. 2014, 21, 11. [Google Scholar] [CrossRef]
- Ballagas, R.; Dugan, T.; Revelle, G.; Mori, K.; Sandberg, M.; Go, J.; Reardon, E.; Spasojevic, M. Electric Agents: Fostering Sibling Joint Media Engagement through Interactive Television and Augmented Reality. In Proceedings of the 2013 Conference on Computer Supported Cooperative Work Companion (CSCW ’13), San Antonio, TX, USA, 23–27 February 2013; ACM: New York, NY, USA, 2013; pp. 225–235. [Google Scholar]
- Hornecker, E. Interactions around a contextually embedded system. In Proceedings of the Fourth International Conference on Tangible, Embedded, and Embodied Interaction (TEI ’10), Cambridge, MA, USA, 24–27 January 2010; ACM: New York, NY, USA, 2010; pp. 169–176. [Google Scholar]
- O’Brien, H.L.; Toms, E.G. Measuring engagement with search systems using the User Engagement Scale. Inf. Process. Manag. 2013, 49, 1092–1107. [Google Scholar] [CrossRef]
© 2018 by the authors. Licensee MDPI, Basel, Switzerland. This article is an open access article distributed under the terms and conditions of the Creative Commons Attribution (CC BY) license (http://creativecommons.org/licenses/by/4.0/).