Abstract
The intangible accessibility of real estate markets via platforms like Airbnb profoundly influences the urban development industry, propelled by the dynamics of short- to medium-term rentals for tourists. The suggested study aims to examine the association between the prices of listed properties and the influence of proximity to tourist attractions on location-driven pricing. The city of Rome acts as a case study from which to derive pertinent conclusions and proof on the phenomena intended for exploration. The methodological approach relies on a comprehensive classification of locations recognized as tourist attractions, drawn from public resources, travel guides, search engines, and online trends. The identified attractionswere subsequently classified to analyze how spatial proximity influences price formation. Data on short-term rental listings were obtained from the Inside Airbnb platform. The results enable the characterization of Rome as a polycentric urban system, composed of multiple tourism hubs whose spatial interactions are closely associated with prevailing hotel pricing patterns. This study emphasizes the influence of tourist demand on land values, a phenomenon intricately connected to urban gentrification and the capitalization of the real estate market. These findings enhance comprehension of tourism’s impact on the geographical and economic structure of cities.
1. Introduction
The emergence of digital platforms such as Airbnb has triggered a profound paradigm shift in the accommodation sector, positioning the Short-Term Rental (STR) market as a major segment of global tourism [1]. Originally framed as a cornerstone of the sharing economy, these platforms have enabled temporary access to underutilized housing assets while simultaneously generating vast amounts of granular digital data. Over time, STR platforms have evolved into professionalized market structures and have increasingly competed with traditional accommodation providers, becoming a preferred option particularly among younger and experience-oriented travelers [2]. Importantly, the rapid expansion of STRs has also produced significant spillover effects on local housing systems, contributing to changes in residential housing supply, rental prices, and tenure stability in urban areas with high tourist demand [2].
A substantial body of scholarly research has examined the determinants of Airbnb pricing, a key strategic variable for hosts seeking to optimize profitability and attract potential guests. This literature identifies a wide range of drivers, including locational attributes, property characteristics, host reputation and experience, seasonal demand fluctuations, and platform-based signals such as ratings, reviews, and Superhost status [3]. Existing studies consistently emphasize the multifaceted nature of STR price formation, which reflects the interaction of dwelling-specific features, neighborhood amenities, and host-related reputation indicators [4,5]. Beyond pricing dynamics within the STR market, recent contributions have highlighted how STR profitability may incentivize the reallocation of housing units from the long-term rental market to short-term use, thereby reducing the supply of stable residential housing and exerting upward pressure on long-term rents, particularly in central and amenity-rich neighborhoods.
The rapid expansion of short-term rentals (STRs) has increasingly been recognized not only as a tourism-related phenomenon but also as a mechanism of functional transformation within urban land-use systems. By converting residential dwellings into market-oriented accommodation units, STR activity contributes to the reallocation of urban space from housing provision toward commercial and tourism-related uses. In this context, prices and spatial concentration patterns of STRs can be interpreted as observable indicators of underlying land-use dynamics rather than as outcomes of isolated pricing decisions. Understanding how locational factors (e.g., proximity to cultural and heritage-related attractions) shape these patterns is therefore of direct relevance for urban planning, land-use policy, and the governance of tourism-intensive cities [4].
Despite these advances, the current literature presents several notable gaps that limit a comprehensive understanding of STR dynamics and their broader housing market implications. A first limitation concerns the frequent reliance on overly simplified analytical frameworks or single-feature approaches, which fail to capture the intrinsic multidimensionality of STR pricing and housing market interactions. Although Airbnb listings provide rich, high-resolution information, many studies employ feature sets that are insufficiently detailed, especially with respect to the semantic content of listing descriptions and guest reviews. A further limitation relates to the limited integration of Point-of-Interest (POI) data, which is crucial for capturing neighborhood-level amenities, accessibility, and the spatial context that jointly influence STR attractiveness and residential desirability [6]. Collectively, these shortcomings constrain the ability of existing models to reflect the complex and spatially interdependent structure of STR markets and their interaction with stable residential housing markets, which are characterized by heterogeneous dwellings, segmented demand, and locally bounded spillover effects. Addressing these issues calls for more sophisticated methodological approaches and the systematic integration of multiple data sources [7].
Recent research has begun to address these challenges by adopting advanced analytical techniques capable of combining heterogeneous sources of information. This includes, in some contributions, the development of machine learning models that integrate statistical features (e.g., host attributes and housing structural characteristics), textual features extracted from listing descriptions and review sentiment, and spatial features derived from network-based representations of surrounding POI distributions [8]. In parallel, growing attention has been devoted to the intrinsic sensitivity of STR markets to external regulatory shocks, which has motivated the use of quasi-experimental research designs to identify causal effects. Notably, major exogenous disruptions such as the introduction and enforcement of Home Sharing Ordinances (HSOs)—local regulatory frameworks governing short-term rental activities through instruments such as mandatory host registration, caps on the number of rentable days, primary-residence requirements, zoning and density restrictions, and varying levels of enforcement intensity—have generated valuable quasi-natural experiments. These interventions enable researchers to examine how regulatory constraints influence STR prices, supply adjustments, host entry and exit behavior, and platform competitiveness, while also assessing indirect effects on the stable residential housing market, including long-term rental availability and rent dynamics [4,9,10].
Despite these advances, existing studies have tended to emphasize either regulatory shocks or platform-level competition with traditional hotels, while devoting comparatively less attention to the spatial mechanisms through which cultural and heritage-related attractions structure STR price formation and concentration within the urban fabric. In particular, evidence remains limited on how these locational dynamics operate from a land-use perspective in heritage-rich, multicentric cities.
Against this background, the present study examines Airbnb pricing as a strategic outcome of hosts’ locational choices and market positioning within the urban space. Using the city of Rome as a demonstration case, the analysis investigates how spatial proximity to cultural attractors, together with accommodation and host-related characteristics, shapes both price formation and the spatial concentration of short-term rentals, as observed through spatial and market-based patterns within the urban fabric. By doing so, the study provides spatially explicit evidence on tourism-driven market dynamics that is relevant for land-use policy and urban governance in heritage-rich cities.
The remainder of the article is structured as follows. Section 2 reviews the literature on STR price determinants, regulatory impacts, and housing market interactions. Section 3 describes the empirical strategy and data sources. Section 4 presents the estimation results, and Section 5 concludes by discussing the main policy implications and directions for future research.
2. Materials
According to Guttentag [11] and Dolnicar [12], the short-term rental (STR) sector has become a structural component of global tourism systems, propelled by the proliferation of peer-to-peer digital platforms such as Airbnb. This technological and market transformation has spurred an extensive and still-growing body of literature examining the operational dynamics, pricing strategies, and the wider socioeconomic implications of the sharing economy [13]. Within this scholarship, several categories of determinants have been identified as key to explaining STR pricing and performance—typically measured through listing price, occupancy rate, or Revenue Per Available Room (RevPAR)—including locational, structural, host-related, reputational, and managerial attributes [14,15]. Among these, spatial and locational factors are consistently recognized as particularly influential. Properties situated closer to city centers, major tourist attractions, cultural landmarks, and transportation nodes generally command higher prices and occupancy levels [16,17]. However, recent research highlights that spatial effects are not universally linear: evidence from Mediterranean and Southern European cities indicates that, in some contexts, properties located slightly further from crowded historical cores can achieve premium prices, possibly due to perceived tranquility, accessibility, or lower density externalities [18,19]. Structural characteristics such as property type (entire home versus private room), dwelling size, number of bedrooms and bathrooms, and the presence of amenities like Wi-Fi, air conditioning, or terraces, remain strong predictors of price and booking likelihood [20,21]. Host-related variables also contribute significantly to pricing out-comes: reputation indicators including Superhost status (a platform-assigned badge reflecting sustained high performance in terms of ratings, responsiveness, and booking reliability), response rate, and average rating tend to exert a positive and often statistically significant influence on both price and revenue [22,23], though the marginal effect of review quantity remains debated [24]. Recent advances in data science have further enriched this literature by developing hybrid or multimodal analytical frameworks that integrate structural, textual, and spatial dimensions of listings. These approaches leverage natural language processing (NLP) to extract sentiment and semantic cues from host descriptions and guest reviews, while incorporating spatial embeddings derived from Points of Interest (POI) networks to capture neighborhood attractiveness [25,26]. Traditional hedonic price models and linear or semilogarithmic regressions continue to serve as a foundational approach to quantify attribute-price relationships [15], yet machine learning (ML) methods—including random forest, gradient boosting, support vector regression, and deep neural networks—are increasingly employed to capture non-linearities, variable interactions, and contextual dependencies [27,28]. Complementary studies employing spatial econometric techniques have confirmed the existence of spatial auto-correlation and spillover effects, demonstrating that nearby listings influence each other’s pricing through competitive or mimetic behaviors [29,30]. In addition, quasi-experimental designs such as Difference-in-Differences (DiD) and Two-Stage Least Squares (2SLS) have been adopted to assess causal effects of exogenous shocks, including municipal home-sharing regulations, zoning restrictions, and the COVID-19 pandemic [31,32]. Despite substantial progress, recent reviews emphasize persistent research gaps—particularly the need for multi-city, European-focused analyses that combine advanced machine learning methods with richer, multi-source datasets integrating textual and spatial information [15,33,34]. Within this context, the city of Rome represents a particularly salient case study [27], given its dense network of historical monuments, religious sites, and cultural institutions that attract heterogeneous tourist segments. As Arias-Sans and Quaglieri, proximity to key tourist attractions exerts a significant and heterogeneous influence on short-term rental pricing [35]. The methodological framework builds on the multivariate analytical approach developed in Guarini et al. (2025) for the analysis of Airbnb prices and accommodation patterns in Rome [36]. The magnitude and direction of this relationship depend on the nature of the attraction—heritage, cultural, or religious—and areas with a high concentration of such sites tend to experience agglomeration effects that amplify local price dynamics and contribute to broader urban housing pressures [37,38]. The next section outlines the broad structure underlying the suggested methodological approach aimed at elucidating the reciprocal impact of cultural spatial distribution on Airbnb pricing. The paper will be adjusted concerning the demonstration case of Rome city in Italy.
3. Methods
3.1. Methodological Framework
In order to investigate Airbnb pricing as the result of both pricing decisions and locational choices, the analysis relies on multiple sources of information. As illustrated in Figure 1, the methodological framework is structured around two primary data inputs—short-term rental listings and tourist attractions—which are subsequently integrated through a common spatial processing stage and analyzed using complementary analytical techniques. On the one hand, it was necessary to obtain data on short-term tourist accommodations in the city of Rome, information available on different platforms that provide transparency on the functioning of the tourism sector. Among these platforms are InsideAirbnb, an independent project from the Airbnb website that collects and openly shares information on rentals, as well as other companies such as AirDNA, dedicated to metrics of occupancy, rates, and revenues that can assist both investors and managers; Airbtics, which stands out for its analysis of local market trends; and AllTheRooms, an aggregator of data from different platforms that enables comparisons. Among the different alternatives, InsideAirbnb was selected because it provides open-access, high-granularity spatial data for recent periods, which are particularly suitable for spatial analysis and can be consistently combined across quarters when needed.
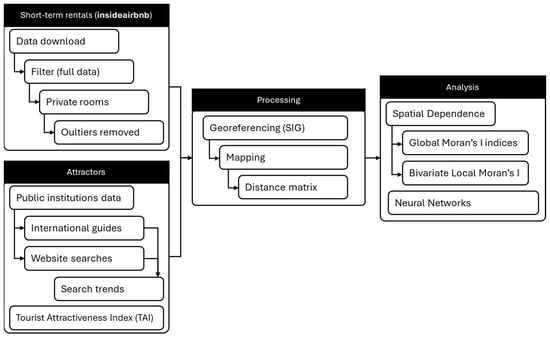
Figure 1.
Research process. Source: own elaboration.
In parallel with the collection of short-term rental data, information on places of tourist interest (attractions) was also gathered. To this end, a methodology based on the collection of various sources was applied, which had to be weighted and unified to create a table of all attractions ranked according to their relative importance. The process began by defining the points of interest from official sources and then broadening the results through different data sources. The first expansion was carried out by using information from a selection of leading international travel guides (Lonely Planet, Michelin, UGH Guides, and National Geographic) [38,39,40]. Subsequently, data were collected on attractions available online from the websites best positioned in search engines under the query “things to see in Rome”. Finally, the relative popularity of each monument was analyzed using Google Trends. The combination of these four sources made it possible to build a classification of the different attractions that reflect their importance at the tourism level.
Once all the study data were obtained, both datasets were integrated through a common spatial processing stage, beginning with georeferencing. A distance matrix was then created between all dwellings and all monuments, followed by their graphical representation. This spatial framework also enabled the computation of global and local measures of spatial dependence, allowing the identification of clustering patterns and spatial autocorrelation in both prices and the distribution of short-term rentals. In this study, the transport variable refers to railway infrastructure (stations and lines) and is used exclusively within the spatial dependence analyses (Moran’s I and LISA).
After creating the working dataset, different analyses were carried out. First, a univariate analysis was performed to obtain the individual impact of each monument and, consequently, the aggregated value of the different impacts, an approach that allows the identification of general spatial trends. Second, spatial dependence was explicitly examined through global indicators, such as Moran’s I, and local indicators of spatial association (LISA), in order to detect statistically significant clusters and spatial regimes within the urban fabric. Finally, a neural network–based modeling approach was applied to capture non-linear relationships and complex interactions between locational, structural, and host-related variables in the price formation process, complementing the insights derived from traditional spatial and econometric analyses. Figure 1 provides an overview of the complete process.
3.2. Short-Term Rental Supply Data
The analysis relies on information on short-term tourist accommodations listed on Airbnb, as made available through the website insideairbnb.com, which provides historical data from the platform. The site offers open access to the most recent four quarters of data, while earlier periods are available only upon request and subject to a fee. Each record includes information on the type of accommodation classified by InsideAirbnb into four categories: entire home, hotel room, private room, and shared room, geographical coordinates, nightly rental price, as well as host and guest review data.
To ensure a homogeneous database, the following filtering criteria were applied to the downloadable dataset: (i) accommodations with incomplete information for key study variables were excluded; (ii) only listings classified as private rooms were retained, as this category provides the greatest homogeneity among the available records; (iii) listings with atypical prices above the 95th percentile (306.3 €/night) were removed.
The study incorporates not only location-based variables and information related to the physical characteristics of the accommodation, but also management and performance variables, including aspects such as availability and the number of reviews associated with each listing. All variables used in the analysis are summarized in Table 1. This integrated approach allows the analysis to capture the heterogeneity in pricing strategies across listings. The results from the neural network models reveal, for instance, differences in the importance of customer reviews depending on the type of host (e.g., private hosts, hotel-type operators, or professional hosts), highlighting structural variations in reputation dependence across market segments.

Table 1.
Description of Main Variables from the Inside Airbnb Dataset.
The selection of explanatory variables is guided by their empirical observability, spatial stability over short time horizons, and relevance for capturing locational and managerial aspects of short-term rental activity. The analysis deliberately focuses on variables that can be directly linked to spatial patterns and land-use dynamics, while acknowledging that broader neighborhood characteristics and social impacts fall outside the scope of the present study.
The use of descriptive data from a single quarter is motivated by the study’s strong emphasis on spatial representation and spatial dependence. Location-related variables and structural accommodation characteristics can be considered relatively rigid over short time horizons, while review-related variables are cumulative by nature. In contrast, variables such as minimum nights and availability are directly influenced by hosts’ managerial decisions and may vary across time. Under these conditions, price is the only variable expected to exhibit substantial inter-quarter variation. To mitigate this limitation, the neural network analysis incorporates data from the four most recent quarters available in Inside Airbnb, thereby partially accounting for temporal dynamics while preserving spatial consistency.
The resulting database is considered representative of the short-term rental supply in Rome, as it reflects the activity of one of the leading operators in the tourist accommodation sector while offering high spatial granularity, with listings distributed in proximity to all major tourist attractions.
3.3. Tourist Attractions
3.3.1. Initial Definition of Tourist Points of Interest
To categorize the different points of tourist attraction, the analysis began with the Mappa Turismo Roma 2024, downloaded from https://www.turismoroma.it/ (last accessed on 12 November 2025). This document lists a total of 34 points of interest, comprising 19 attractions of diverse typologies—such as archaeological sites (Colosseo, Foro Romano, Palatino), basilicas (Basilica di San Pietro, San Giovanni in Laterano), squares (Navona, Popolo, Spagna), fountains (Trevi), and 15 museums. In addition to these sites, the map highlights but does not explicitly list other relevant attractions, including Sant’Ivo alla Sapienza, Palazzo Massimo, and the Mausoleum of Augustus.
The map illustrates the depth and complexity of Rome’s tourism offer, while also revealing the inherent subjectivity in the importance assigned to each monument, which depends on the criteria adopted by its authors. It should also be noted that, in order to access certain tourist attractions, visitors are required to purchase an entrance ticket, while in other cases these attractions are part of the urban environment and/or freely accessible. Furthermore, it is worth highlighting that most museums and archaeological sites are managed by the Ministry of Cultural Heritage (MiC), the Municipality of Rome, and the Vatican State, with only a small portion under private management.
To build an aggregated measure of tourist interest for this study, four complementary sources of data were employed: (i) official information published by the Comune di Roma; (ii) references in leading international tourist guides; (iii) recommendations appearing on top-ranked web pages in Google search results; and (iv) measures of popularity derived from Google Trends. By integrating these sources, it was possible to construct a comparative table of monuments, weighted according to their relative tourist attractiveness.
3.3.2. Publicly Owned Attractions
As a starting point for official sources, data were obtained from the Annuario Statistico del Comune di Roma 2024 (published in June 2025). This report provides information on the number of visitors to monuments of public ownership (at Italian, municipal, and Vatican State levels), as well as revenues generated from ticket sales. From these data, it is possible to compile a list of attractions managed by public administrations, ranked according to the number of visitors and their annual ticket revenues.
The year 2023 stands out as the period with the highest visitor numbers overall and for the vast majority of monuments, marking the full recovery from the effects of the COVID-19 pandemic. The evolution of visitors is presented in Table 2.
Table 2.
Main monuments in Rome managed by public administrations, ranked by number of visitors in 2023.
Although this information is of great value for the present study, it presents important limitations. First, it only includes sites of public ownership for which an admission ticket is required. Second, the results are conditioned by the criteria under which tickets are sold, as several monuments are grouped under combined tickets. Examples include the Colosseo, Palatine Hill, and Roman Forum; the Gallerie Nazionali d’Arte Antica, which covers both Palazzo Barberini and Palazzo Corsini; and the joint admission to the Vittoriano and Palazzo Venezia.
Table 3 summarizes the aggregate impact of tourism interest across attractions of different ownership and management levels, including Italian state institutions, the Vatican, and the municipality of Rome.
Table 3.
Museum Systems and Categories: Visitors (2021–2023) and Gross Revenue (2023).
3.3.3. Internationally Renowned Tourist Guides
In order to assess the relevance of both public and private attractions in Rome, information available online from internationally prestigious tourist guides was collected. Specifically, data were obtained from Lonely Planet, Michelin, and UGH Guides. These guides are assumed to be used by visitors seeking a more informed and in-depth understanding of the city of Rome’s cultural landmarks. On the Lonely Planet [39] website, 198 tourist attractions are listed, while the Rough Guides [40] and Michelin Guide [41] websites, respectively, highlight 38 and 33 must-see sites. These guides provide detailed information on the city’s attractions, which makes it possible to differentiate between general mentions and highlighted references presented as independent pages or featured sections. This distinction was incorporated into the weighting scheme of the Tourist Guide Scoring, assigning a score of one to general mentions and a score of 2.5 to highlighted attractions. Likely, attractions highlighted as “top choice” in Lonely Planet receive a weight of 2.5, while those only listed are assigned a value of 1. In the Michelin Guide, sites presented as “sites to see” with an initial description or a link are also weighted 2.5, while other listed attractions are given a value of 1. Similarly, in Rough Guides, attractions with a dedicated link or extended description are weighted 2.5, and those that simply appear in the list receive a value of 1. Furthermore, some of the listed attractions can be grouped together based on their location or because they are often experienced jointly, and can therefore be considered under a single designation (for example, Villa Borghese, Museo Borghese, and subsequently Piazza di Siena and Giardino del Lago). The total score assigned to each, and the attractions that can be grouped. Table 4 indicates the total score for grouped attractions that have a score equal to or higher than 3.5—that is, those mentioned in at least two of the examined guides, with individual scores of 2.5 and 1, respectively.
Table 4.
Tourist guide results: attractions (merged) scoring 3.5 or higher.
From this analysis, it emerges that the Pantheon, Piazza di Spagna, Colosseo, Palatino, Foro Romano, Villa Borghese and the Galleria Borghese, Museo Nazionale Etrusco di Villa Giulia, and Musei vaticani (including the Capella Sistina) can be identified as the most significant sites. These are followed by Basilica di San Pietro (Piazza di San Pietro), the Fontana di Trevi, Piazza Navona, MAXXI—Museo Nazionale delle arti del 21°secolo, Piazza Campo de’ Fiori, and Castel Sant’Angelo (including Ponte Sant’Angelo). It should be noted that many of these attractions are squares or elements that face, define, or enhance urban spaces.
3.3.4. Search Engine–Ranked Web Pages
To complement the information obtained from tourist guides, data were also collected from web pages appearing in the top positions of Google search results. Three sets of queries were performed: in English, using the term “what to see in Rome” (yielding six results); in Italian, with “cosa vedere a Roma” (two results); and in Spanish, with “qué ver en Roma” (two results). The highest-ranking websites included Tripadvisor, Rome.net, Fodors, Romesite, Conde Nast, Lonely Planet, Cosavederearoma, Italia.it, EnRoma, and National Geographic [42,43,44,45,46,47,48,49,50,51]. Based on these sources, a consolidated list of monuments was compiled. Table 5 presents the twenty attractions that were mentioned in at least four out of the ten sources analyzed.
Table 5.
Tourist points of interest ranked according to the number of mentions across top-ranked web pages in search engines.
3.3.5. Online Search Popularity
To cross-check the data and broaden the available information, the Google Trends platform was consulted, which reports on the popularity of search terms. For the purposes of this study, the platform provides relative information that makes it possible to compare the popularity of different tourist attractions, thereby identifying potentially missing sites and refining the weighting criteria used.
Google Trends offers the number of searches related to each element under study over the course of a year, all normalized according to the day with the highest level of interest. The information is displayed considering the day of maximum interest within the last year, which is assigned a value of 100%. From this point, the average interest value over the course of a full year is calculated. The option to simultaneously select multiple monuments also makes it possible to obtain a weighted value, based on the monument that generates the highest level of interest in the search engine.
After testing the main search terms identified in the previous measurements, the Colosseo was confirmed as the most popular attraction and was therefore adopted as the reference point against which the relative popularity of the other attractions was measured. The manual data download was carried out on 6 June 2025.
This method provides a measure of general interest; however, such interest may arise for different reasons. It may reflect the intended interest here, such as the desire to visit the monument, but it can also be influenced by other factors, such as temporary interest driven by events like news coverage related to those places.
3.3.6. Final Attractions Database
Once the final list of monuments was established and the results of each of the indicated methodologies were obtained, a final Table 6 was constructed reporting the relative weighting of each monument with respect to the Colosseo, which consistently exhibited the highest relevance across all evaluation criteria and was therefore used as the reference benchmark. For each monument, the expected importance was defined as the average of its normalized scores across the available dimensions, and this value was subsequently used both to classify tourist attractions and to assess their spatial impact on short-term rental price formation.
Table 6.
Relative Weighting of Main Monuments in Rome by Tourist Attractiveness Index (TAI).
Specifically, four distinct components—visitor numbers, presence in international travel guides, online visibility from web sources, and relative popularity derived from Google Trends—were each normalized by dividing their observed value for a given monument by the corresponding maximum value recorded for the Colosseo.
Formally, for monument i, the normalized importance score was computed as:
where denotes the value of monument i under criterion k (visitors, guides, web, or trends), represents the corresponding maximum value observed for the Colosseo, and is the number of criteria for which data are available for monument i.
3.4. Processing
Once the complete database with information on both tourist accommodations and attractions was available, all points were processed in order to build a joint dataset for analysis. This processing phase commenced with the georeferencing of all spatial entities on the map of Rome, including short-term rental accommodations, tourist attractions, and public transport infrastructure. Geographic coordinates for accommodations were obtained directly from the listings, while the locations of monuments and metro stations were derived from official and open geographic sources. Following georeferencing, a comprehensive distance matrix was generated, relating each accommodation to all identified monuments, with all real distances calculated in meters. This distance-based structure constitutes a core component of the empirical framework, as it allows accessibility to cultural attractions to be operationalized in a continuous manner and provides the foundation for subsequent spatial and statistical analyses. In a subsequent step, a series of thematic maps and distance-based visualizations were produced to explore spatial price patterns and the spatial distribution of short-term rentals in relation to major tourist attractions. These visual tools serve an exploratory and diagnostic function, enabling the identification of spatial heterogeneity and potential clustering effects, and informing the subsequent application of formal measures of spatial dependence, such as global and local indicators of spatial association.
3.5. Analysis
Once the spatial processing stage was completed, the next step involved the statistical analysis and modeling of the data, leading to an integrated methodological assessment. First, a univariate analysis was conducted as an exploratory step, examining the relationship between average nightly prices and distance-based measures of accessibility to nearby cultural attractions. This initial analysis made it possible to identify general trends, potential breakpoints, and heterogeneous behaviors across the dataset. Building on these findings, a multivariate analysis was then performed to assess the joint influence of multiple locational, accommodation-related, and host-related variables on price formation. This approach provided a more robust perspective by accounting for the combined effects of spatial relationships and listing characteristics. Finally, a neural network–based modeling framework was applied to capture non-linear relationships and complex interactions among variables, with the objective of identifying latent patterns and enhancing predictive performance. The results from these complementary analytical stages were subsequently integrated into a methodological synthesis, allowing the consistency and coherence of the findings to be jointly assessed. Different exploratory spatial analysis tools have been used to study the behavior of the Airbnb supply in Rome. First, a univariate Moran’s I analysis was applied to determine the spatial dependence of each element. Likewise, the univariate cluster analysis using the Local Moran’s I (LISA) methodology allows detecting areas of high concentration (High–High) and low concentration (Low–Low), as well as identifying areas with differentiated behavior in the form of Low–High or High–Low, making it possible to map the results and study the spatial factors influencing agents’ decision-making.
This same analysis can be carried out in a bifactorial way, thus obtaining the spatial relationship between variables. The bifactorial analysis was used to examine the relationship between the supply of tourist accommodations and the location of cultural attractions, providing insights into their spatial coincidence and mutual dependence. For this analysis, different values of R (distance radius) and K (number of neighbors) were considered, which determine the scale of analysis and allow the observation of variations in the spatial structure of the phenomenon as the neighborhood size changes. Low values of R and K reflect micro or local patterns associated with specific areas and monumental nuclei, whereas higher values reveal aggregated trends, helping to understand the spatial organization and the processes of concentration and expansion of the short-term rental supply.
The spatial dependence analysis is not intended solely as a statistical diagnostic, but as a tool to identify structured spatial regimes within the urban fabric. Detected clusters of short-term rental density and their co-location with cultural attractions are interpreted as manifestations of functional specialization processes, whereby specific urban areas increasingly accommodate tourism-oriented uses.
A multilayer perceptron (MLP) trained in SPSS (version 26) was evaluated to model tourist rental prices. The target variable was transformed into the logarithm of the price in order to reduce asymmetries and mitigate the impact of extreme values, which are common in price distributions. The predictors used were the following covariates: Room type, number_of_reviews_ltm, minimum_nights, availability_365, Distance to the Pantheon, Distance to the Colosseo, and Distance to the Vaticano (eight variables in total). All variables were standardized (mean = 0, SD = 1).
The data analysis was carried out using the models previously defined for this study:
- Model 1: Evaluates the price of tourist accommodations in relation to the aforementioned influencing or predictor variables, obtaining variants a, b, and c of the model, each incorporating a different distance to a point of interest.
- Model 2: Assesses the prices of tourist accommodations of type EH/APT in the city of Rome using the same predictor variables, obtaining variants a, b, and c of Model 2, each based on a different distance to a point of interest.
- Model 3: Examines the prices of tourist accommodations of type PR in the city of Rome with the predictor variables, generating variants a, b, and c of Model 3, each including a different distance to a point of interest.
- Model 4: Analyzes the prices of tourist accommodations of type HR in the city of Rome with the predictor variables, obtaining variants a, b, and c of Model 4, each corresponding to a different distance to a point of interest.
- Model 5: Evaluates the prices of tourist accommodations of type SR in the city of Rome using the predictor variables, resulting in variants a, b, and c of Model 5, each considering a different distance to a point of interest.
These fifteen models (five types of models with three distance variants each) were designed to achieve a differentiated assessment. The first objective was to evaluate the impact of the variables on aggregate supply (Models 1a, 1b, 1c). The second and main objective was to measure the differentiated impact by type of accommodation (Entire Apartment, Private Room, Hotel Room, and Shared Room) (Models 2 to 5). Finally, this approach allowed for the comparative influence of proximity on price according to each of the three main monuments selected (Pantheon, Colosseo, Vaticano), incorporating a different distance variable in each submodel (a, b, c). These models are essential because the relationship between price and independent variables is rarely linear. Furthermore, price is influenced by complex interactions between variables; that is, the impact of one factor often depends on the state of another factor. Therefore, the use of neural networks (MLP) allows these non-linearities and contextual dependencies to be detected and captured, an aspect that is difficult to model adequately using traditional linear approaches.
Before training the networks for the 15 models, data cleaning and variable transformation were performed, along with the calculation of distances to the points of interest (Pantheon, Colosseo, and Vaticano). Three networks were trained using the full dataset, with the main difference among them being the inclusion of a different distance variable corresponding to each point of interest (Pantheon, Colosseo, or Vaticano). The remaining twelve networks were trained using subsets of data corresponding to each accommodation type, combined with each of the three distance variables.
The data were partitioned as follows: 60% for training, 20% for testing, and 20% for holdout validation. This scheme allows for the estimation of out-of-sample error and the assessment of model generalization on an entirely reserved dataset. The network architectures are summarized in Table 7.
Table 7.
Configuration of Artificial Neural Network (ANN) Models Used for the Analysis of Short-Term Rental Prices in Relation to Proximity to Main Monuments in Rome.
4. Results
4.1. Spatial Dependence Analysis Through Global and Local Moran’s I
The Moran analyses shown in Table 8 display a positive spatial correlation that is highly significant (p-value < 0.001), indicating that there are clustering patterns in the different variables. The result for Airbnb density indicates a very high spatial clustering of Airbnb listings, revealing that areas of high density are surrounded by other high-density zones; their distribution corresponds to the historic city as well as to the main tourist districts. In the case of monuments, the Moran analysis provides a positive and significant value, although smaller than that obtained for tourist dwellings; monuments are concentrated in cultural areas. The individualized analysis shows the case of rail transport, for which the positive association is related to the linear spatial dependence typical of this type of transport. In the fourth case, the relationship between Airbnb supply and attractions was obtained, returning a high spatial correlation that reveals the dependence of accommodations on the distribution of cultural assets. The results should therefore be interpreted as spatial expressions of tourism-driven market dynamics, revealing how cultural assets act as anchors around which short-term rental activity concentrates within the city.
Table 8.
Global Moran’s I indices. Univariate and bivariate spatial autocorrelation (R = 500 m, queen contiguity, 999 Monte Carlo permutations).
Figure 2 presents the results of the Local Indicators of Spatial Association (LISA) analysis at different spatial scales. Panel A provides a metropolitan-scale overview, included for contextual purposes to illustrate the broader spatial extent of short-term rental activity. Panels B and C progressively zoom into the consolidated urban area and the historic city center, which constitute the primary focus of the analysis.
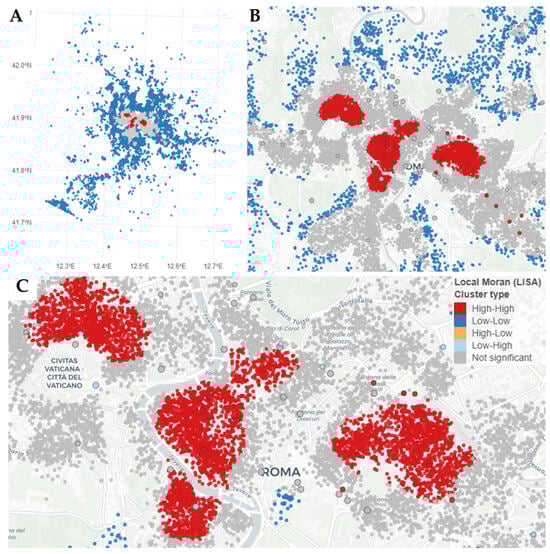
Figure 2.
Spatial distribution and clustering of short-term rentals in Rome based on Local Moran’s I (LISA) analysis. (A) Overall spatial distribution of listings; (B) identification of statistically significant spatial clusters; (C) detail of High–High clusters concentrated around major tourist areas (Vatican City, historic center, and Colosseo–Palatino area). Source: own elaboration.
The interpretation of the results therefore concentrates on Panels B and C, where the spatial distribution and clustering of short-term rental dwellings, cultural attractions, and railway stops become clearly identifiable. In these maps, statistically significant local clusters reveal strong spatial co-location patterns between accommodation supply and cultural assets within the central urban fabric.
In Figure 2C, the concentration of three clusters marked in red stands out. The first corresponds to the area of the Vatican Museums, located in the upper left part, with a circular area extending between 600 and 800 m around the museums. A second area, which could be considered the center of Rome, covers practically the entire Campo Marzio, also including the Trastevere area in the lower part, as well as the upper right branch articulated along Via dei Condotti towards Piazza di Spagna and the Scalinata della Trinità dei Monti, an area that also functions as the commercial district of central Rome. Finally, in the lower right red zone, one can observe the Esquilino Hill area, delimited to the southwest by the Domus Aurea Park, which leads to the Colosseo, and to the northeast by the Roma Termini central railway station.
Table 9 shows the dominant spatial behavior. For the BiLISA I and II cases, a high density of Airbnb tourist accommodation supply is observed around the attractions, with a strong spatial dependence. The High–High clusters, calculated with short distances of 300 and 500 m, indicate a strong linkage in the historical areas. Meanwhile, in the case of BiLISA III, when increasing the distance R to 800 m, a greater spatial dispersion appears, with peripheral effects visible in the Low–Low and High–Low clusters.
Table 9.
Bivariate Local Moran’s I (BiLISA). Results for different neighborhood parameters (R and k). Percentages indicate the share of significant cells belonging to each cluster type: High–High (HH), Low–Low (LL), High–Low (HL), and Low–High (LH).
Figure 3 allows the visualization of the change in the spatial pattern of the short-term Airbnb supply when varying the scale of analysis through the bifactorial BiLISA analysis. Figure 3A corresponds to the micro scale (R = 300, k = 6), Figure 3B to an intermediate scale (R = 500, k = 8), and Figure 3C to the meso scale (R = 800, k = 10). These maps are associated with the results shown in the upper Table 9. As a common feature across the three maps, the central High–High zone around Campo Marzio stands out as the core area of tourism in Rome; however, its composition differs depending on the scale of analysis performed. At the micro scale, concentration can be observed around the different individual monuments, while at the mid scale, an aggregated behavior becomes evident, implying that proximity to a single monument is not, by itself, a determinant for its high representation within the monumental field. At the meso scale, it is worth noting the appearance of High–Low zones, both on the perimeter of the Vaticano (upper left) and in the lower right area, corresponding to the Cathedral of San Giovanni in Laterano, which, although not included among the most representative monuments in the compiled list, shows a high concentration of short-term rental dwellings in its surroundings.
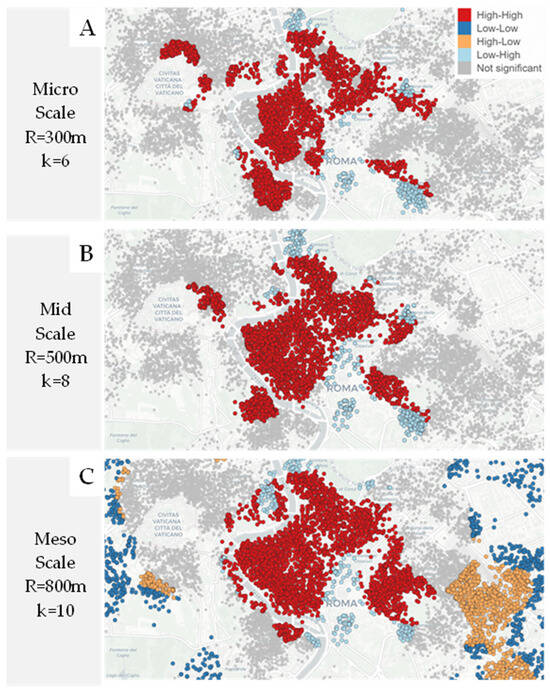
Figure 3.
Bivariate LISA cluster maps (Airbnb x Attractions) at three neighborhood scales: (A) R = 300 m, k = 6; (B) R = 500 m, k = 8; (C) R = 800 m, k = 10. High–High (red) and Low–Low (blue) clusters highlight spatial coupling and dispersion patterns between Airbnb density and tourist attractions across Rome. Source: own elaboration.
4.2. Comparative Results of MLP Models by Accommodation Type and Distance to Points of Interest
The performance metrics are presented in Table 10. The table summarizes the performance of the fifteen artificial neural network (ANN) models previously defined. The values of Training Sum of Squares and Test Sum of Squares show a decreasing trend from Models 1 (aggregated) to Models 5 (associated with shared rooms, which include fewer data), indicating a progressive improvement in model fit. The Holdout Relative Error values range between 0.48 and 0.71, revealing some limitations in the predictive capacity of the models; however, they still allow for the classification of the relative importance of the analyzed variables. The lowest errors are observed in Model 5 (shared rooms), suggesting that this type of accommodation offers better predictive performance. Table 11 presents the normalized importance of independent variables in artificial neural network (ANN) models.
Table 10.
Performance Metrics (Training, Testing, and Holdout Errors) of Artificial Neural Network (ANN) Models for Short-Term Rental Price Estimation.
Table 11.
Normalized Importance of Independent Variables in Artificial Neural Network (ANN) Models.
Table 11 shows the validation of the 15 models using performance metrics. The metric values confirm the suitability of each model for predicting the logarithmic price. Although the Holdout Relative Error values range from 0.48 to 0.71, suggesting certain limitations in absolute predictive capacity, these errors are acceptable for classifying the relative importance of the variables analyzed. It is noteworthy that Model 5 (associated with shared rooms) consistently exhibited the lowest error, indicating that this type of accommodation showed the best fit.
The results show that location and proximity to points of interest emerge as the most determining factors of the log-price, supporting the hypothesis that spatial positioning and accessibility significantly influence price levels. The variable minimum_nights reflects a highly elastic supply policy: restrictions on minimum stay are correlated with substantial differences in price. Other temporal activity indicators, such as number_of_reviews_ltm and availability_365, provide additional information, although with lower relative importance.
It is worth noting that the results show how the influence of each variable depends on the type of accommodation. Likewise, differences are observed in the effect of proximity to different monuments on price, with stronger impacts for the Pantheon and the Vaticano compared to the Colosseo, which displays a relatively lower importance across models.
Management-related variables—such as availability_365, number_of_reviews_ltm (reviews received over the last year), and minimum_nights—exhibit distinct effects, both among themselves and depending on the accommodation type. For instance, the high importance of reviews in hotel-type accommodations reflects their greater dependence on reputation and customer feedback.
Overall, these findings highlight the clear predominance of the spatial dimension in determining tourist rental prices in Rome. In summary, the MLP models achieve a satisfactory improvement in modeling the log-transformed price, revealing a marked spatial dependence—where distance to points of interest emerges as the main predictor, followed by minimum stay policies and the number of reviews. This also underscores the importance of analyzing the heterogeneous short-term rental market using machine learning approaches, as the specific characteristics of each accommodation type are difficult to capture through traditional linear models.
5. Discussion
From an urban perspective, the identified spatial patterns suggest a progressive functional differentiation of central neighborhoods, where residential uses increasingly coexist or compete with market-oriented accommodation activities. The strong spatial association between cultural attractions and short-term rental prices highlights the role of heritage assets as structuring elements in the reorganization of urban land use, rather than merely as passive amenities influencing individual pricing decisions.
The results show a high concentration of short-term rental housing supply in the central area of the city, which accounts for 46.66% of the total supply, with more than 12,000 dwellings. This translates into an average density of 613 tourist rental units per square kilometer in the city center, a figure that drops to 95 in Rome’s Municipality II, and decreases even further to 52 and 51 in Municipalities V and VII, respectively.
Considering that Rome is divided into a total of 15 municipalities, the concentration of nearly 50% of the total supply within a single municipality—which contains most of the city’s monumental and cultural attractions and is simultaneously the second smallest in area—reveals the extremely high spatial concentration of tourist accommodation and the impact this situation has on the city’s population dynamics. The findings show that areas under pressure in the urban core are heavily clustered within the monumental-historic zone, whereas those attractions located outside the city center exert a much weaker influence on the distribution of tourist housing supply. These spatial configurations point to differentiated market dynamics across the city, with certain areas exhibiting higher concentrations of short-term rental activity in proximity to cultural attractions.
The results obtained first show the existence of a significant spatial autocorrelation, with notable spatial clustering patterns of dwellings around monumental areas. The LISA maps confirm the presence of three main High–High concentration nuclei, which can be identified as: the Vaticano and Musei Vaticani area; the Campo Marzio area, extending southwest toward Trastevere and northeast toward Piazza di Spagna; and finally, the Esquilino Hill, located between the Colosseo and the Termini train station. At larger scales, Low–Low and High–Low areas emerge, showing peripheral dispersion patterns.
These patterns are closely related to the results of the analysis of Rome’s monuments, particularly highlighting the roles of the Vaticano, Campo Marzio (centered around the Pantheon and Piazza Navona), and the Colosseo as the city’s main attractions. However, the results also show that their behavior as attractions differs, as does their influence on the formation of short-term accommodation prices compared with their general value as tourist attractions. The role of the Colosseo of Rome as the primary attraction according to all the analysis criteria used (visitors, travel guides, websites, and trends) contrasts with its more limited role as a generator of tourist accommodation clusters and as a driver of price increases in nearby rentals.
An example of the difference between the importance of attractions and their effect on tourist accommodation supply is the case of the Galleria Borghese, located in Villa Borghese and classified as a major tourist attraction, mainly according to travel guides and websites. However, this site does not show the formation of tourist attraction clusters in its surroundings. Similar situations are found for the Terme di Caracalla, the Museo Nazionale delle arti del 21°secolo, and the Museo Nazionale Etrusco di Villa Giulia —all points of high tourist interest that, nonetheless, do not display a comparable accommodation supply to that found in other areas.
It is also important to highlight the role of urban barriers, which in the case of Rome are numerous and diverse in type. Even the monuments themselves act as barriers, creating a differentiated urban behavior in the short-term rental market around their perimeters, where the accessibility routes to these monuments become elements of great significance.
An example of this is the Vaticano and the Musei Vaticani, which form one of the three primary clusters of top-level tourist attractions. The fact that access points are located at Piazza di San Pietro (for the basilica) and along Viale Vaticano (for the museums) generates a concentration of short-term rental supply in their immediate surroundings. This concentration gradually decreases as one moves away from these access points, leading to a notable reduction in both the availability of tourist housing and prices in the western part of the Vaticano area.
A similar pattern is observed in the monumental zone of the Colosseo and the Foro Romano, where large architectural barriers arise from the extensive area they occupy—from the Terme di Caracalla in the south to the Foro Romano and Colonna Traiana at the northernmost point—encompassing the Circo Massimo, the Palatino, the Colosseo, and the Domus Aurea. This vast expanse results in a spatial differentiation in housing availability, with concentrations found in the northern area closer to Campo Marzio, as well as in the Esquilino district. There is also a price differentiation, with higher prices in the more central area of Campo Marzio compared to the lower prices in Esquilino.
An additional factor is the differentiation in the types of accommodation offered, mainly divided between entire apartments and individual rooms. A greater proportion of entire apartments is found in the central area of Campo Marzio, where prices are higher than in the rest of Rome, while individual rooms are more concentrated around Termini Station and in the northern area near the Musei Vaticani.
6. Conclusions and Future Work
This study examines the spatial patterns associated with tourist housing supply in the city of Rome, a multicentric urban system characterized by a dense and geographically dispersed set of high-profile cultural attractions. By analyzing the distribution and pricing of short-term rentals across the urban fabric, the results highlight how tourism-oriented accommodation activity is structured in relation to the city’s cultural assets, revealing differentiated market dynamics across central neighborhoods.
Despite its multicentric nature, Rome exhibits a particularly strong concentration of activity in the Campo Marzio area, which can be regarded as the city’s main tourist center. This area presents both the highest number of rental listings and the highest prices, associated with the greatest density of monumental attractions. This situation contrasts with the prominence typically assigned to Rome’s major monuments, since three of the four principal monuments—ranked according to visitor numbers, importance in travel guides, websites, and trends—are located southeast of Campo Marzio, in the area encompassing the Foro Romano, the Palatino, and the Colosseo.
The study’s findings reveal that the tendency to cluster short-term rental supply is extremely concentrated within the city’s historic center, resulting in varying levels of attractiveness for other monumental and cultural sites. Consequently, both the availability and prices of short-term rentals remain comparatively low even in the vicinity of significant attractions such as the Museo e Galleria Borghese, the Museo Nazionale Etrusco di Villa Giulia, and the MAXXI—Museo Nationale delle arti del 21°secolo. These three notable institutions, despite their cultural relevance, do not appear to stimulate a comparable concentration of short-term rental offerings in their surroundings.
Another notable case concerns neighborhoods with fewer major attractions but with a strong cultural identity that provides its own form of appeal. Trastevere stands out in this regard, centered around the Church of Santa Maria in Trastevere. Although it also includes important sites such as Villa Farnesina and the Galleria Corsini, its main attraction lies in the cultural character and atmosphere of the neighborhood itself. This distinctive identity translates into a high concentration of tourist accommodation, as evidenced both by the spatial distribution of listings and by the area’s classification as a zone of high aggregation.
By providing spatially explicit evidence on the relationship between cultural attractions and short-term rental market dynamics, this study offers insights relevant for urban governance and land-use policy. The results can support the identification of areas subject to high tourism-related market pressure and inform differentiated regulatory approaches, such as zoning measures or location-specific restrictions, aimed at balancing residential and commercial uses in heritage-intensive urban contexts.
The study presents limitations related both to the nature of the data employed and to the scope of the variables included in the empirical models. The data are sourced from the Inside Airbnb website, an open-access dataset that has been widely used in the literature to analyze the short-term rental (STR) market. Although this source is representative of activity within the Airbnb platform, it does not capture the full spectrum of tourist accommodation supply, particularly traditional hotels and other short-term rental platforms. Similarly, the qualitative character of neighborhoods is not directly modeled through quantitative variables. Intangible factors such as neighborhood identity, atmosphere, and the broader urban experience fall outside the scope of the present analysis. These elements, however, are likely to influence the spatial distribution and concentration of tourist accommodation and therefore represent a relevant avenue for future research.
The analysis does not aim to quantify social impacts such as residential displacement, changes in neighborhood composition, or housing affordability outcomes, but focuses on spatial and price-based indicators derived from short-term rental market activity.
The results obtained in this study open the door to future analyses in several directions. On one hand, the temporal scope could be expanded, allowing not only for an examination of the seasonality of the short-term rental supply, but also for a study of urban dynamics and structural changes within the city—observing how the evolution of short-term rentals shapes the urban territory over time. Analyses focusing on neighborhood saturation or the increasing density of listings could provide valuable insights into the changing value of urban land under conditions of shifting land use.
It would also be relevant to investigate the evolution of peripheral areas and their growing share of tourist housing, framing them as zones of diversification within a mature stage of short-term rental platforms, once cultural and central urban cores have reached consolidation.
Similarly, it would be beneficial to complement Airbnb data with information related to actual occupancy rates or the supply offered by other platforms, in order to obtain a more comprehensive view of the market.
Another promising line of research concerns comparative multi-city analyses. The case of Rome presents specific features as a multicentric city, a pilgrimage destination, and an urban space characterized by overlapping tourist attractions from very different historical periods. This configuration means that its dynamics may not respond in the same way as those of other cities—either within Italy or internationally. Such comparative research could also be of great interest from a regulatory perspective, examining how different policy approaches and urban management strategies affect the operation and impact of short-term rentals. The results would thus provide useful evidence for urban policy and tourism governance.
Finally, all these lines of research hold significant added value in relation to the study of land value transformation driven by changing land uses—an aspect that implies modifications in the concept and function of urban environments, with a notable impact on residents’ quality of life.
Author Contributions
Conceptualization, M.R.G. and A.S.-d.-l.-C.; methodology, M.R.G. and A.S.-d.-l.-C.; software, A.S.-d.-l.-C. and Y.N.-G.; data curation, A.S.-d.-l.-C. and Y.N.-G.; formal analysis, A.S.-d.-l.-C. and Y.N.-G.; investigation, M.R.G., A.S.-d.-l.-C., F.S. and Y.N.-G.; project administration, M.R.G. and A.S.-d.-l.-C.; resources, M.R.G., A.S.-d.-l.-C. and F.S.; supervision, M.R.G. and F.S.; validation, M.R.G. and F.S.; visualization, A.S.-d.-l.-C. and F.S.; writing—original draft, M.R.G. and A.S.-d.-l.-C.; writing—review and editing, M.R.G. and F.S. All authors have read and agreed to the published version of the manuscript.
Funding
This research received no external funding.
Data Availability Statement
The dataset is available upon request from the authors. The raw data supporting the conclusions of this article will be made available by the authors on request.
Conflicts of Interest
The authors declare no conflicts of interest.
Abbreviations
The following abbreviations are used in this manuscript:
| BiLISA | Bivariate Local Indicators of Spatial Association |
| GIS | Geographic Information System |
| HSO | Home Sharing Ordinance |
| LISA | Local Indicators of Spatial Association |
| MLP | Multilayer Perceptron |
| NN | Neural Network |
| STR | Short-Term Rental |
| TAI | Tourist Attractiveness Index |
References
- Guttentag, D. Airbnb: Disruptive innovation and the rise of an informal tourism accommodation sector. Curr. Issues Tour. 2015, 18, 1192–1217. [Google Scholar] [CrossRef]
- Zervas, G.; Proserpio, D.; Byers, J.W. The Rise of the Sharing Economy: Estimating the Impact of Airbnb on the Hotel Industry. J. Mark. Res. 2017, 54, 687–705. [Google Scholar] [CrossRef]
- Wang, D.; Nicolau, J.L. Price determinants of sharing economy-based accommodation rental: A study of listings from 33 cities on Airbnb.com. Int. J. Hosp. Manag. 2017, 62, 120–131. [Google Scholar] [CrossRef]
- Ayouba, K.; Breuillé, M.L.; Grivault, C.; Le Gallo, J. Does Airbnb Disrupt the Private Rental Market? An Empirical Analysis for French Cities. Int. Reg. Sci. Rev. 2020, 43, 518–550. [Google Scholar] [CrossRef]
- Kelly, N.; Kelliher, F.; Power, J.; Lynch, P. Unlocking the niche potential of senior tourism through micro-firm owner-manager adaptive capability development. Tour. Manag. 2020, 79, 104081. [Google Scholar] [CrossRef]
- Li, J.; Moreno, A.; Zhang, D. Pros vs Joes: Agent Pricing Behavior in the Sharing Economy. Ross School of Business Paper No. 1298. 2016. Available online: https://deepblue.lib.umich.edu/items/808104b5-8fdf-45a5-9273-4c8e934c86de (accessed on 12 November 2025).
- Lončarić, D.; Popović, P.; Kapeš, J. Impact of the COVID-19 pandemic on tourism: A systematic literature review. Tour. Int. Interdiscip. J. 2022, 70, 512–526. [Google Scholar] [CrossRef]
- Zhang, Z.; Xu, Z.; Yu, W. Tourism demand forecasting with multi-source data: A hybrid model incorporating seasonal-trend decomposition. Ann. Oper. Res. 2025. [Google Scholar] [CrossRef]
- Qiu, R.T.R.; Park, J.; Li, S.N.; Song, H. Social costs of tourism during the COVID-19 pandemic. Ann. Tour. Res. 2020, 84, 102994. [Google Scholar] [CrossRef]
- Pourebrahim, N.; Sultana, S.; Niakanlahiji, A.; Thill, J.C. Trip distribution modeling with Twitter data. Comput. Environ. Urban Syst. 2019, 77, 101354. [Google Scholar] [CrossRef]
- Guttentag, D. Progress on Airbnb: A literature review. J. Hosp. Tour. Technol. 2019, 10, 814–844. [Google Scholar] [CrossRef]
- Dolnicar, S. A review of research into paid online peer-to-peer accommodation: Launching the annals of tourism research curated collection on peer-to-peer accommodation. Ann. Tour. Res. 2019, 75, 248–264. [Google Scholar] [CrossRef]
- Awli, O.; Lau, E. Digital and sharing economy for sustainable development: A bibliometric and systematic review. Economies 2023, 11, 105. [Google Scholar] [CrossRef]
- Wachsmuth, D.; Weisler, A. Airbnb and the rent gap: Gentrification through the sharing economy. Environ. Plan. A 2018, 50, 1147–1170. [Google Scholar] [CrossRef]
- Dogru, T.; Mody, M.; Suess, C. Adding evidence to the debate: Quantifying Airbnb’s disruptive impact on ten key hotel markets. Tour. Manag. 2019, 72, 27–38. [Google Scholar] [CrossRef]
- Negi, G.; Tripathi, S. Airbnb phenomenon: A review of literature and future research directions. J. Hosp. Tour. Insights 2023, 6, 1909–1925. [Google Scholar] [CrossRef]
- Gibbs, C.; Guttentag, D.; Gretzel, U.; Morton, J.; Goodwill, A. Pricing in the sharing economy: A hedonic pricing model applied to Airbnb listings. J. Travel Tour. Mark. 2018, 35, 46–56. [Google Scholar] [CrossRef]
- Lagonigro, R.; Martori, J.C.; Apparicio, P. Understanding Airbnb spatial distribution in a southern European city: The case of Barcelona. Appl. Geogr. 2020, 115, 102136. [Google Scholar] [CrossRef]
- Gyódi, K.; Nawaro, Ł. Determinants of Airbnb prices in European cities: A spatial econometrics approach. Tour. Manag. 2021, 86, 104319. [Google Scholar] [CrossRef]
- Eugenio-Martin, J.L.; Cazorla-Artiles, J.M.; González-Martel, C. On the determinants of Airbnb location and its spatial distribution. Tour. Econ. 2019, 25, 1224–1244. [Google Scholar] [CrossRef]
- Teubner, T.; Hawlitschek, F.; Dann, D. Price determinants on Airbnb: How reputation pays off in the sharing economy. J. Self-Gov. Manag. Econ. 2017, 5, 53–80. [Google Scholar]
- Bommer, W.H.; Roy, S.; Milevoj, E.; Rana, S. Factors influencing consumers’ Airbnb use intention: A meta-analytic analysis using the UTAUT2. Ind. Manag. Data Syst. 2024, 124, 2069–2090. [Google Scholar] [CrossRef]
- Ert, E.; Fleischer, A.; Magen, N. Trust and reputation in the sharing economy: The role of personal photos in Airbnb. Tour. Manag. 2016, 55, 62–73. [Google Scholar] [CrossRef]
- Xie, K.L.; Kwok, L. The effects of Airbnb’s price positioning on hotel performance. Int. J. Hosp. Manag. 2017, 67, 174–184. [Google Scholar] [CrossRef]
- Alharbi, Z.H. A sustainable price prediction model for airbnb listings using machine learning and sentiment analysis. Sustainability 2023, 15, 13159. [Google Scholar] [CrossRef]
- Tan, H.; Su, T.; Wu, X.; Cheng, P.; Zheng, T. A Sustainable Rental Price Prediction Model Based on Multimodal Input and Deep Learning—Evidence from Airbnb. Sustainability 2024, 16, 6384. [Google Scholar] [CrossRef]
- Ghosh, I.; Jana, R.K.; Abedin, M.Z. An ensemble machine learning framework for Airbnb rental price modeling without using amenity-driven features. Int. J. Contemp. Hosp. Manag. 2023, 35, 3592–3611. [Google Scholar] [CrossRef]
- Yang, Y. Predicting US Airbnb Listing Prices by Machine Learning Models. Highlights Bus. Econ. Manag. 2024, 24, 1408–1417. [Google Scholar] [CrossRef]
- Binesh, N.; Pasham, K.V.R.; Jakar, G.; Syah, A.M. Predicting Airbnb occupancy rate: A hybrid deep learning and game-theoretic approach. Int. J. Contemp. Hosp. Manag. 2025, 37, 3983–4004. [Google Scholar] [CrossRef]
- Almeida, J.; Oliveira, F.; Baptista e Silva, J. Understanding short-term rental regulation: A case study of Lisbon (Portugal). Crit. Hous. Anal. 2021, 8, 171–185. [Google Scholar] [CrossRef]
- Cocola-Gant, A.; Hof, A.; Smigiel, C.; Yrigoy, I. Short-term rentals as a new urban frontier–evidence from European cities. Environ. Plan. A Econ. Space 2021, 53, 1601–1608. [Google Scholar] [CrossRef]
- Barron, K.; Kung, E.; Proserpio, D. The effect of home-sharing on house prices and rents: Evidence from Airbnb. Mark. Sci. 2021, 40, 23–47. [Google Scholar] [CrossRef]
- Duca, J.V.; Hoesli, M.; Montezuma, J. The resilience and realignment of house prices in the era of COVID-19. J. Eur. Real Estate Res. 2021, 14, 421–431. [Google Scholar] [CrossRef]
- Núñez, J.C.S.; Gómez-Pulido, J.A.; Ramírez, R.R. Machine learning applied to tourism: A systematic review. Wiley Interdiscip. Rev. Data Min. Knowl. Discov. 2024, 14, e1549. [Google Scholar] [CrossRef]
- Arias-Sans, A.; Quaglieri-Domínguez, A. Unravelling Airbnb: Urban perspectives from Barcelona. In Reinventing the Local in Tourism: Travel Communities and Peer-Produced Place Experiences; Russo, P., Richards, Eds.; Channel View Publications: Bristol, UK, 2016; pp. 209–228. [Google Scholar]
- Guarini, M.R.; Sica, F.; Segura-de-la-Cal, A.; Guerrero, Y.N.-G. Understanding Airbnb supply in Rome: Multivariate analysis of prices and accommodation patterns. In Computational Science and Its Applications–ICCSA 2025 Workshops; Gervasi, O., Murgante, B., Garau, C., Karaca, Y., Lago, M.N.F., Scorza, F., Braga, A.C., Eds.; ICCSA 2025; Lecture Notes in Computer Science; Springer: Cham, Switzerland, 2025; p. 15896. [Google Scholar] [CrossRef]
- Albuquerque, H.; Quintela, J.A.; Marques, J. The Impact of Short-Term Rental Accommodation in Urban Tourism: A Comparative Analysis of Tourists’ and Residents’ Perspectives. Urban Sci. 2024, 8, 83. [Google Scholar] [CrossRef]
- Bei, G.; Celata, F. Challenges and effects of short-term rentals regulation: A counterfactual assessment of European cities. Ann. Tour. Res. 2023, 101, 103605. [Google Scholar] [CrossRef]
- Lonely Planet. Rome Attractions. Available online: https://www.lonelyplanet.com/italy/rome/attractions (accessed on 12 November 2025).
- Michelin Guide. A Guide to Rome’s Neighborhoods. Available online: https://guide.michelin.com/en/article/travel/a-guide-to-rome-s-neighborhoods (accessed on 12 November 2025).
- Rough Guides. The Best Travel Tips for Visiting Rome. Available online: https://www.roughguides.com/italy/rome-lazio/#the-best-travel-tips-for-visiting-rome (accessed on 12 November 2025).
- Tripadvisor. Available online: https://www.tripadvisor.com/ (accessed on 12 November 2025).
- Rome.net. Available online: https://www.rome.net/ (accessed on 12 November 2025).
- Fodor’s. Available online: https://www.fodors.com/ (accessed on 12 November 2025).
- Romesite. Available online: https://www.romesite.com/ (accessed on 12 November 2025).
- Condé Nast. Available online: https://www.condenast.com/ (accessed on 12 November 2025).
- Lonely Planet. Available online: https://www.lonelyplanet.com/ (accessed on 12 November 2025).
- Cosa Vedere a Roma. Available online: https://www.cosavederearoma.it/ (accessed on 12 November 2025).
- Italia.it. Available online: https://www.italia.it/ (accessed on 12 November 2025).
- EnRome. Available online: https://www.enroma.info/ (accessed on 12 November 2025).
- National Geographic. Available online: https://www.nationalgeographic.com/ (accessed on 12 November 2025).
Disclaimer/Publisher’s Note: The statements, opinions and data contained in all publications are solely those of the individual author(s) and contributor(s) and not of MDPI and/or the editor(s). MDPI and/or the editor(s) disclaim responsibility for any injury to people or property resulting from any ideas, methods, instructions or products referred to in the content. |
© 2025 by the authors. Licensee MDPI, Basel, Switzerland. This article is an open access article distributed under the terms and conditions of the Creative Commons Attribution (CC BY) license.