Abstract
Rapid urbanization has brought severe threats to regional ecological security. Most research regards ecological security pattern (ESP) focuses on the current situation and ignores future land use and land cover (LULC) impacts. Therefore, this study proposed an ESP construction framework that integrates multi-scenario patch-generating land use simulation (PLUS) with ecosystem service value (ESV) evaluation based on the Integrated Valuation of Ecosystem Services and Tradeoffs (InVEST) model. Taking Hefei City as a case study, this study predicts land use types under the natural development scenario (NDS), ecological protection scenario (EPS), and economic development scenario (EDS) in 2030. Afterwards, ecological sources are identified by selecting four types of ecosystem services. Ecological corridors and nodes are identified by combining circuit theory and ecological resistance surfaces. The ESP is constructed based on a generic, landscape-scale connectivity-oriented perspective. The results showed that: (1) the LULC in Hefei City underwent significant changes between 2000 and 2020. The main manifestations are the reduction in cropland and increase in construction land. The expansion of construction land under EDS is the most significant. (2) The spatial distribution patterns of ESV for 2020 and three scenarios in 2030 exhibit marked heterogeneity. (3) According to the simulated scenarios in 2030, ecological corridors form a structure that is sparser in the central region and denser in the southern region; ecological pinch points are predominantly located within the Zipeng Mountain and the region situated to the south of Chaohu; ecological barrier points are mainly distributed at the edge of the built-up area and in the middle of long-distance ecological corridors. The ecological network structure under EPS has been expanded and reinforced. (4) Hefei City exhibits an ESP of “Four zones, Three screens, One network, Multiple nodes” as a whole, indicating an ecological security pattern with relatively higher potential ecological connectivity at the city scale. This study aims to provide scientific support for the development of Hefei City in society, economy and ecological security.
1. Introduction
Cities serve as the primary aggregation sites for human productive and living activities [1]. They are also the locations where ecological resource elements and economic and social activities are most intensively concentrated [2]. The United Nations Human Settlements Program report indicates that approximately two-thirds of the global population will live in cities, and urbanization is projected to intensify further by 2050 [3]. Frequent anthropogenic activities and excessive land development have weakened the resilience of urban ecological environments to withstand disasters, posing a formidable challenge to the sustainable development of regional ecosystems. In addition, the “15th Five-Year Plan” proposes that it is necessary to continuously prevent and defuse all kinds of ecological and environmental risks and strengthen the ecological security line by 2030. To achieve this goal, appropriate land use and land cover (LULC) management and ecological security are required. Therefore, constructing an ecological security pattern (ESP) from a dynamic adjustment perspective is urgently required to optimize LULC and alleviate regional ecological security issues [4].
LULC simulation is crucial for safeguarding ecological security and achieving sustainable development [5]. Commonly used LULC simulation models include the Markov chain model, system dynamics model [6], cellular automata model [7] and future land use simulation model [8], among others. However, these models often fail to adequately account for spatiotemporal variations, which limits their ability to accurately simulate transition processes of LULC patch [9]. The patch-generating land use simulation (PLUS) model has shown significant advantages in enhancing the accuracy of regional LULC simulation [10,11]. Recent advances in big data and artificial intelligence technologies have promoted a shift in land simulation research toward multidisciplinary approaches and multi-model integration [12]. The research includes simulation evaluations of carbon emissions [13,14], ecosystem service value (ESV) [15], heat island effect [16], etc. Recent studies indicate growing scholarly attention to the correlations between the PLUS model and ESP [17,18]. The research scale mainly focuses on urban agglomerations [19], provincial regions [20] or cities [1,21], and the research areas are mainly distributed in the eastern coastal areas [22] or ecologically fragile regions [23]. By setting the driving parameters of land use change under the expected scenario conditions, managers can assess and formulate more reasonable territorial space planning policies in advance.
ESP provides sustainable guidance for land use and conservation of ecological spaces [24]. The construction of ESP has established a fundamental framework that includes ecological sources, ecological resistance surfaces, and ecological corridors [25]. Currently, a growing number of scholars are comprehensively identifying ecological sources from perspectives such as ecosystem services evaluation [26,27], ecological sensitivity [28], and morphological spatial pattern analysis [29,30]. This integrated approach fully considers ecological functional integrity and landscape connectivity, providing a more holistic perspective for the extraction of ecological resources. The ecological resistance surface represents an evaluation and simulation of the difficulty of spatial migration for various species. The resistance surface setting directly affects the accuracy of the corridor simulation. Most studies only use a single LULC factor to construct the resistance surface, which lack the ability to distinguish the internal changes within the same LULC category. Scholars have begun to consider the influence of natural factors [29], human disturbances [31], and ecological security [32] on the resistance surface. An ecological corridor is defined as a linear landscape feature facilitating the diffusion and migration of species as well as the transmission of information. The identification of ecological corridors predominantly utilizes methodologies such as gravity models, minimum cumulative resistance (MCR) models [33], and circuit theory [34]. Compared with the MCR model, circuit theory [35], grounded in random walk theory, integrates circuit principles with ecological research, thereby enhancing the dynamic simulation of complex ecosystems. This theory can represent migratory resistance by connecting ecological sources and generating cumulative current paths, thereby simulating the migration and diffusion of species across landscapes [36]. Potential ecological corridors and nodes can be identified based on the extracted effective value of the cumulative current. In recent years, some scholars have begun to attempt to measure the spatial connectivity of real-world ecological networks and have made a large number of discoveries [37]. A commonly used approach is to use indicators such as the landscape pattern index and the landscape connectivity index [38].
However, ESP research still faces several challenges. First, although previous studies have extensively examined ESP construction based on the integration of land use simulation and ecosystem service assessment and have demonstrated the advantages of combining the PLUS model with the InVEST model, there remains a need to understand how such frameworks perform under different urbanization processes and policy contexts. Second, existing research has largely focused on comparing the spatial patterns of ESP under various planning scenarios, while relatively little attention has been paid to assessing how ecological network connectivity responds to alternative development pathways, particularly in rapidly urbanizing areas where landscape structures are highly dynamic [39]. Therefore, developing a connectivity-oriented multi-scenario ESP simulation framework is of considerable importance for supporting high-quality urban development.
Thus, this study proposes a connectivity-oriented ESP construction framework based on a multi-scenario simulation approach. Taking Hefei City as a case study, the main purposes of this study are as follows: (1) how LULC in Hefei will change by 2030 under the NDS, EPS and EDS scenarios; (2) how the ESP will change under different scenarios, and which scenario is most favorable for maintaining or improving ecological network connectivity; (3) which parts of the 2030 ESP should be prioritized for ecological protection, ecological restoration and corridor construction. The results are expected to provide scientific support for optimizing land resource allocation and ecological environment management in Hefei City, and to offer a reference for other rapidly urbanizing cities with similar development backgrounds.
2. Study Area and Data Sources
2.1. Overview of the Study Area
Hefei City is located in the central part of Anhui Province, between 31°30′ N and 32°38′ N, and 116°41′ E and 117°53′ E, with a total area of 11445.10 km2 (Figure 1). The vast water area of Chaohu and the wetlands around it jointly form an important ecological core and landscape resource in this region. Under the dual strategic backdrop of the “Belt and Road Initiative” and the Yangtze River Economic Belt, Hefei has undergone rapid urbanization, reaching a permanent resident population of 9.37 million, an urbanization rate of 82.28%, and GDP exceeding one trillion yuan in 2020. This rapid growth has resulted in increasing demand for urban construction land and sustained pressure on the ecological environment [31]. Consequently, this study aims to provide a scientific basis for promoting its sustainable development.
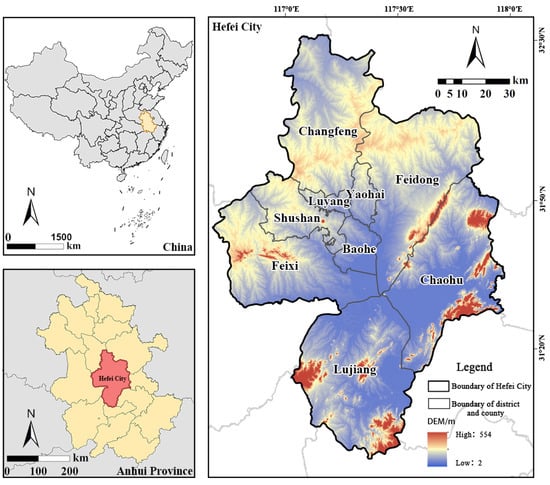
Figure 1.
Geographic location map of Hefei City.
2.2. Data Sources
The data required for this research primarily include multiple sources, such as meteorological data, land use information, and statistical data spanning 2000 to 2020 (Table 1). ArcGIS 10.2 is used to analyze and process the obtained data. Non-spatial statistical yearbook data were spatialized by matching socio-economic attributes to corresponding administrative units. To ensure data consistency, all spatial datasets were standardized by rasterizing vector layers, resampling raster data to 1 km resolution and unifying the projection.

Table 1.
Data source information.
3. Research Methods
This study proposes an ESP construction framework that couples the PLUS model with ecosystem services evaluation (PLUS-InVEST). First, LULC types in 2030 under the NDS, EPS and EDS scenarios are simulated using the PLUS model. Second, four types of ecosystem services are evaluated with the InVEST model and used to extract ecological sources. Circuit theory is then applied to identify ecological corridors, pinch points and barrier points. The connectivity of ecological networks is subsequently compared across various scenarios through the α, β and γ indexes. Then the ESP for Hefei City is refined from the connectivity-oriented perspective. Finally, corresponding ecological protection and restoration policies are proposed. This comprehensive framework is replicable and applicable to other rapidly urbanizing areas facing similar ecological pressures. The specific technical route is shown in Figure 2.
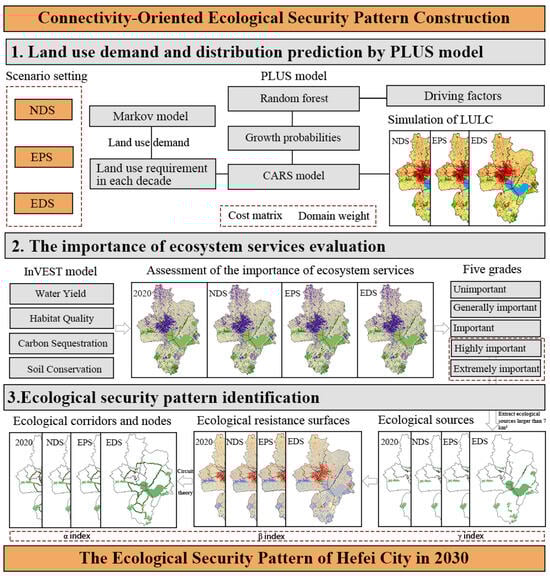
Figure 2.
Technical route of this study.
3.1. LULC Simulation
The PLUS model is a raster-based simulation framework for LULC that generates patches by integrating the LEAS and CARS modules [40]. LEAS based on the Random Forest (RF) algorithm can capture patch-level LULC evolution [41]. By elucidating the intricate relationship between land expansion and underlying driving factors, the accuracy of LULC simulation can be improved. The CARS module integrates random seed generation with threshold-decrement mechanisms to effectively simulate the spontaneous formation of plaques while adhering to constraints on developmental probability. Compared with other models, the PLUS model is able to capture patch-level urban expansion processes and explicitly simulate the spatial effects of alternative policy scenarios on future land use patterns in a rapidly urbanizing city such as Hefei.
3.1.1. The Selection of Driving Factors
The contribution of each driving factor to land use change was quantified through the random forest algorithm embedded in the LEAS module of the PLUS model (v1.4), which can provide the basis for interpreting the dominant drivers of LULC change [10]. Based on the current development status of Hefei City and research implications in related studies [42,43], a total of 14 driving factors for LULC simulation were identified. These include:
- (1)
- Six natural factors [12]: elevation, slope, NDVI, annual average temperature, annual average precipitation, and soil type.
- (2)
- Three socio-economic factors [44]: GDP, night light data, and population.
- (3)
- Five accessibility factors [45]: including distance from highways, distance from roads, distance from railways, distance from settlements, and distance from water.
3.1.2. Prediction of Land Use Demand
Markov model is widely used to model various stochastic processes [46]. This study uses transition probability matrices of land use change over two periods to predict future LULC. Refer to the relevant literature and adjust the conversion probability based on the characteristics of different scenarios [47]. The adaptation model is as follows:
Among them, indicates that the LULC type will change from the current state to another land type in the future period. represents the specific form of LULC type observed at a specific time . represents the possibility of mutual conversion between two different types of LULC.
3.1.3. Accuracy Verification
The Kappa coefficient emphasizes the overall classification performance of the model, while the FOM coefficient focuses on the model’s performance across different thresholds [15,48]. Therefore, the results of both indicators should be considered comprehensively. Simulation results are generally considered reliable when the Kappa coefficient exceeds 0.8 and the FOM coefficient ranges from 0.1 to 0.3 [49].
3.1.4. Multi-Scenario Setting
Given the characteristics and developmental realities of the research area, this study examines the natural development, ecological protection, and economic development associated with three potential LULC types [50,51].
(1) Natural Development Scenario (NDS): This scenario assumes that the trends in land use types in Hefei from 2020 to 2030 remain consistent with those of previous years, without considering the restrictions imposed by various policies, regulations, urban development plans, and other factors.
(2) Ecological Protection Scenario (EPS): The main objective of this scenario is to enhance the protection of ecological land while ensuring the city’s steady development. To achieve the goal of having an ecological conservation red line area of no less than 1228.40 km2 by 2035 and improving the quality of the ecosystem. The probability of converting forest, grassland, and water to construction land was reduced by 50%. The probability of converting cropland to construction land was reduced by 30% [18]. The probability of converting cropland and grassland to forest was increased by 20% [15]. Meanwhile, vector data, including the ecological protection red line, nature reserves, 2020 ecological sources, and 2020 ecological pinch points, served as constraints on the conversions.
(3) Economic Development Scenario (EDS): This scenario emphasizes giving priority to the development of construction land to meet the demands of economic development and promote urbanization. To meet the demands of the mixed utilization policy of Hefei encourages the renewal of inefficient construction land through functional replacement rather than land use restoration. The probability of converting cropland, forest, and grassland to construction land was raised by 20%, while the probability of converting construction land to cropland, forest, grassland, or water was decreased by 30% [44].
3.2. ESV Evaluation
Ecosystem services are natural environmental conditions which are crucial for human survival (Table 2). Water conservation refers to an ecosystem’s ability to intercept or store water from precipitation [52]. Habitat quality serves as a crucial indicator for assessing biodiversity and the ecological environment [53]. Carbon sequestration is an important component of the carbon cycle in an ecosystem [46]. Soil conservation highlights the role of surface vegetation in alleviating soil erosion. Its function is comprehensively influenced by natural ecological factors, such as vegetation type, soil type, topography, rainfall and temperature [30]. These ecosystem services capture key hydrological, habitat and regulating functions that underpin ecological security in Hefei. An assessment of the importance of ecosystem service in Hefei City was conducted using ArcGIS 10.2 and the InVEST model. The evaluation results were normalized and superimposed with equal weights [30]. Using the reclassification tool and the natural breakpoint method, the results are superimposed and classified into five grades: extremely important, highly important, important, generally important, and unimportant.
Table 2.
The formula for ecosystem services.
3.3. ESP Construction
ESP evaluates regional ecological security by integrating ecosystem structure, landscape pattern and ecological processes [4]. In this study, constructing a connectivity-oriented ESP under multiple LULC scenarios allows an assessment of how alternative development and protection pathways reshape ecological connectivity and supports the identification of spatial priorities for land use control, ecological restoration and corridor planning.
3.3.1. Ecological Sources
Ecological source areas represent key landscape patches that sustain essential ecological functions and support the maintenance of landscape-scale connectivity [50]. The composite ecosystem service evaluation provides an integrated indication of ecological importance by aggregating multiple ecological attributes into a single spatial index. Areas with higher composite ecosystem service values generally exhibit stronger ecological functions, greater ecological stability, and a higher capacity to support ecological processes. Therefore, regions identified as extremely or highly important in the composite index were regarded as potential ecological source areas in Hefei, as they are more likely to contribute to the structural configuration of ecological connectivity at the municipal scale. Ecological sources that are too small in area will lack the function of inter-source connectivity. The minimum area threshold of 7 km2 was determined by referring to relevant studies and by taking into account the current situation of Hefei, in order to remove scattered small patches and ensure the effectiveness of ecological sources [1,54,55].
3.3.2. Ecological Resistance Surfaces
The ecological resistance surface can quantify the degree of obstacles caused to the spread and migration of species during the ecological flow process. Based on existing research [56,57], NDVI, elevation, slope, land use type, distance from main roads, distance from water, and distance from construction land are selected as resistance factors [58,59] (Table 3). Among them, distances from main roads and construction land can reflect the urban development level of the area and quantify the extent to which the surrounding ecosystem is affected by human activities. Elevation and slope represent the ecosystem function level of the area, as measured by water source conservation and soil and water conservation. Lower altitude and flatter terrain are assigned lower ecological resistance values. NDVI and distance from water can reflect the level of radiation from ecosystem functions within a certain range of the area. The research area features an extensive water body, and areas near it are more conducive to biological activity. The types of land use reveal the distribution of different ecological functions and the supply level of products in this area. The resistance values and weights are determined by combining the expert scoring method with the Analytic Hierarchy Process (AHP) [60,61], a commonly adopted and methodologically robust approach in regional ESP studies that provides a structured and transparent means of incorporating expert judgment when synthesizing multiple ecological resistance variables.
Table 3.
Ecological resistance surface evaluation system.
3.3.3. Ecological Corridors and Ecological Nodes
Circuit theory is capable of simulating the complex network characteristics of ecosystems [62]. Ecological corridors are direct pathways for the exchange of matter and energy among ecological resources. The Linkage Mapper tool (2.0.0) is used to extract ecological corridors [63]. Ecological nodes comprise both pinch points and barrier points. Ecological pinch points are defined as irreplaceable key areas with a high probability of species migration [64]. They were delineated using the Pinchpoint Mapper module under the “all-to-one” mode. A cost-weighted distance of 1000 m is defined as the ecological corridor width, from which the top 20% of high-value areas are extracted as pinch points. Ecological barrier points are features whose removal significantly improves landscape connectivity and reduces human disturbance [29]. This study employs the Barrier Mapper module for their identification, with a search radius ranging from 100 m to 300 m (in 100 m steps). The top 20% of areas, based on the percentage improvement in the least-cost distance (LCD), are ultimately designated as barrier points.
3.4. Assessment of Ecological Network Connectivity
During the construction and maintenance process of ESP, the efficiency of ESP restoration is evaluated by calculating ecological network connectivity indices to maximize conservation benefits [58]. Graph-theoretical indices provide an effective way to quantify the structural characteristics and overall connectivity of ecological networks. They are widely used in landscape ecology and are suitable for comparing connectivity differences among multiple LULC scenarios at the municipal scale [65]. In this study, the network closure index (α), the line point ratio index (β), and the network connectivity index (γ) are selected to conduct a comparative analysis of ESP connectivity under different scenarios [54]. A higher α value indicates a greater number of alternative pathways for species migration and diffusion [65]. Thereby enhancing landscape permeability. The β index reflects the average number of links per node, with values typically ranging between 0 and 3. A β value less than 1 suggests an incomplete network structure, while a value equal to 1 indicates a single-loop configuration [66]. A β value greater than or equal to 2 signifies a more developed and structurally robust network. The γ index represents the connectivity of all nodes, and a larger value corresponds to a higher level of connectivity [67]. Its calculation formula is:
Among them, represents the number of ecological corridors; represents the number of nodes.
4. Research Results
4.1. LULC and Multi-Scenario Simulation Results
The analysis results indicate that LULC in Hefei City underwent significant changes between 2000 and 2020 (Figure 3). The main types of LULC are construction land and cropland, accounting for over 80% of the total area. Cropland area exhibits a downward trend, with a cumulative reduction of 659.06 km2 and a decrease of 5.74 percentage points in its areal proportion. Construction land area increased cumulatively by 640.12 km2, with its areal proportion rising by 5.60 percentage points. The spatial development pattern, characterized by a circular-radial expansion of construction land centered on the central built-up area, is becoming increasingly prominent. The fluctuation range of forest and grassland areas is relatively small, mainly distributed in southern regions such as Wuding Mountain and Niuwangzhai, as well as in western regions such as Daqian Mountain and Zipeng Mountain. The water areas are mainly concentrated in Chaohu and Huangpi Lake. The growth of unutilized land is mainly concentrated in the Baohe District, reflecting the focused implementation of Hefei City’s land acquisition and demolition plan during this period.
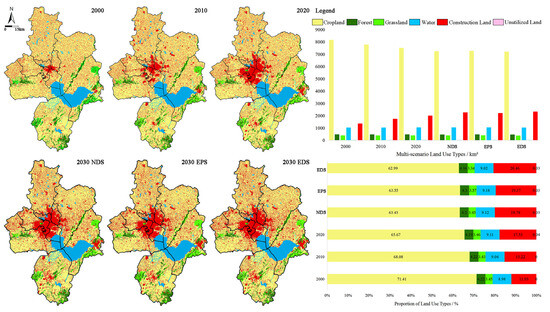
Figure 3.
Spatial distribution of LULC from 2000 to 2030 in Hefei City.
Based on LULC data from 2000 and 2010, the 2020 LULC pattern is simulated and compared with the observed LULC in 2020. The Kappa coefficient obtained from the analysis is 0.9012, while the FOM coefficient is 0.23, indicating that the model is highly reliable and stable, and is suitable for subsequent 2030 scenario simulations. Under different scenarios, the LULC pattern of Hefei City in 2030 is projected to remain largely consistent. Cropland and construction land will continue to dominate the landscape. The main urban area will continue to face high demand for construction land, with its area expanding to 2263.41 km2, 2216.46 km2, and 2342.02 km2 under the respective scenarios. Under all scenarios, urban construction land is expected to expand eastward toward the eastern part of the new city, which aligns with Hefei’s long-term development strategy outline in its territorial spatial plan. Under EDS, the increase in construction land area will be the largest, and ecological land dominated by forest and grassland will be reduced to 858.38 km2. This indicates that urbanization will continue to exert pressure on natural resources. Cropland is expected to decrease across all scenarios. The most significant reduction is under EDS, where cropland declines to 304.99 km2. Conversely, under EPS, cropland loss and construction land growth are moderated. Forest and grassland areas will increase by 11.04 km2 and 13.3 km2, respectively, reflecting the implementation of ecological protection policies. Overall, these projections suggest urban expansion will continue, especially toward the east. Policy interventions can mitigate some negative impacts on ecological and agricultural lands.
The main land use conversions in Hefei from 2000 to 2020 involved the transition between construction land and cropland. From the perspective of spatial distribution, the areas with intense LULC transition in each period are mainly concentrated in the center of Hefei City and the built-up area of Chaohu City in the east, while other counties are scattered. Among them, 766.45 km2 of cropland are converted into construction land, accounting for 90.92% of the total renovation area. A total of 119.57 km2 of construction land is transferred to cropland, accounting for 71.37% of the total area transferred is converted to cropland. However, the amount of construction land transferred in is much greater than that transferred out, indicating that construction land growth during this period is relatively intense. The areas where water is transformed into cropland are mainly distributed in the western towns of Changfeng County, and the conversion volume is relatively small. The main incoming and outgoing land types of forest are both cropland and grassland, while the main outgoing land type of grassland is cropland. These patterns suggest the need to strengthen controls over urban expansion and reinforce cropland protection in key transition zones.
Compared with 2020, the transition of land use types under NGS, EPS, and UDS in 2030 is projected to exhibit distinct differences (Figure 4). The main manifestation is the mutual conversion of construction land and cropland. The proportion of ecological land, such as forests, water bodies and grasslands, which is converted into construction land will always remain relatively low. Under the NDS, construction land will mainly be transferred from cropland and forest. In this scenario, the area transferred into construction land is 93.54 km2 more than the area of construction land transferred out to other land types. Under EPS, the area of cropland transferred to ecological land will be larger than in the other two scenarios, accounting for 77.67% of the total area transferred. Under EDS, the demand for construction land will be the highest, and the amount of cropland and ecological land converted to construction land will be greater than in the other two scenarios.
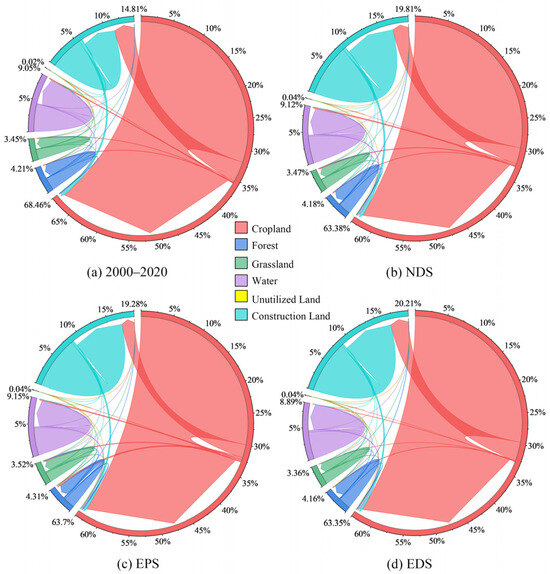
Figure 4.
String map of land use transfer in Hefei City from 2000 to 2030.
4.2. Multi-Scenario Simulation Results of Ecological Source
4.2.1. Assessment of the ESV
The areas with high water conservation, soil conservation, habitat quality and carbon storage are concentrated in the southern mountainous belt and around Chaohu (Figure 5). The water conservation capacity of Hefei City is relatively low. The low-value areas are all concentrated in the built-up areas of the main urban area, Lujiang County and Chaohu City. The high-value areas are mainly concentrated in Chaohu. Low-value areas of soil conservation capacity are widely distributed in the study area. The high-value areas are distributed in Lujiang County and Chaohu City, with relatively high altitudes and limited human intervention. Habitat quality is highest in Chaohu and hilly areas. The habitat quality in the city center is the worst. Low-value areas of carbon storage are widely distributed. The high-value area is mainly distributed in the south. Compared with 2020, the capabilities of the four types of ecosystem services in Hefei under different scenarios will all show a downward trend. The decline in ecosystem service capacity under ecological protection scenarios is relatively slow. The future ecological protection and restoration efforts should prioritize the southern mountainous belt and the Chaohu region while strengthening ecosystem service capacity in the densely urbanized central areas.
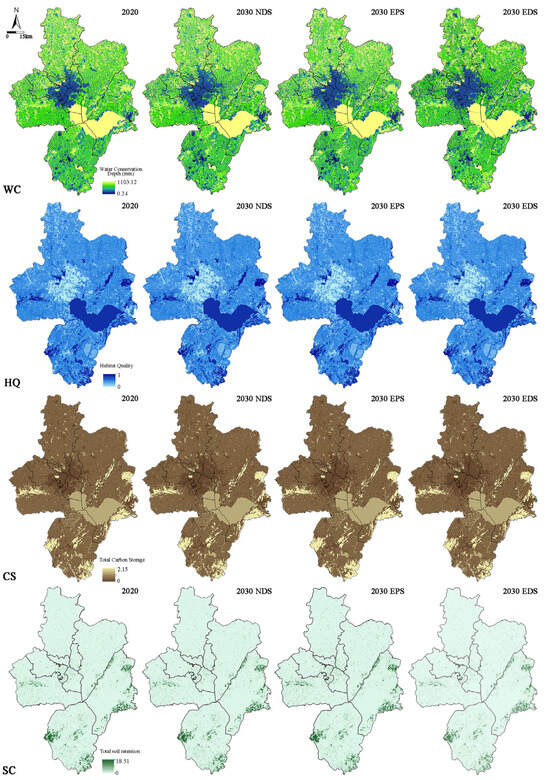
Figure 5.
Spatial distribution of ecosystem services from 2020 to 2030 for water conservation (WC), habitat quality (HQ), carbon sequestration (CS) and soil conservation (SC), respectively.
The assessment of ESV of 2020 and the three 2030 simulation scenarios shows significant spatial heterogeneity. From a spatial distribution perspective, all scenarios exhibit a pattern of lower values in the northwest and higher values in the southeast (Figure 6). The extremely important and highly important areas are relatively concentrated, with areas of 2338.52 km2, 2543.92 km2, 2584.13 km2, and 2465.80 km2, accounting for 20.43%, 22.23%, 22.58%, and 21.54%. These areas mainly distribute in the southern mountainous areas and Chaohu, which serves as an important ecological protection object for Hefei City. This indicates that the assessment of ESV has a good consistency with the biodiversity and conservation priority areas identified in Hefei City and provides a reasonable basis for the identification of ecological sources. The extremely important and highly important areas under EPS will see the largest increase, mainly in forest, water and grassland. Important areas and generally important areas show the widest distribution range. The main LULC type in this area is cropland, with small amounts of forest, grassland, and construction land (Table 4). Under NDS and EDS, there will be a phenomenon in which extremely important and highly important areas transform into generally important areas, with the transition areas being 32.25 km2 and 53.91 km2. Generally, important areas are mainly composed of cropland. Compared with highly developed construction land, cropland still retains some natural ecological conditions. It is vulnerable to encroachment by construction and development activities in urban development. The unimportant areas will mainly be distributed in the main urban area of Hefei and Chaohu, where human activity intensity is relatively high. The unimportant areas under all three scenarios will decrease to varying degrees, but the proportion of unimportant areas under EDS still reaches 11.18%. Accordingly, future spatial planning should prioritize the prevention of degradation in cropland-based transition zones that are experiencing heightened development pressures.
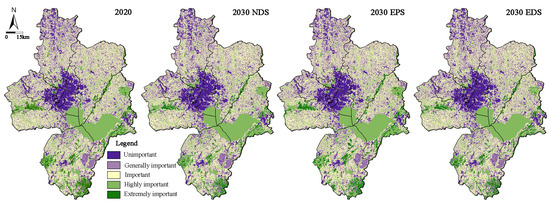
Figure 6.
Spatial distribution of ecosystem service importance under different scenarios.
Table 4.
Area and proportion of ecosystem service importance rating classification in 2030 under different scenarios.
4.2.2. Extraction of Ecological Sources
The ecological source areas all show obvious spatial differentiation between the north and the south. The number of ecological sources in 2020 and the three simulated scenarios for 2030 is 17, 16, 16, and 16, with areas of 1352.60 km2, 1346.48 km2, 1363.08 km2, and 1334.29 km2 (Figure 7). Spatially, ecological sources consistently exhibit a south–north gradient, with larger and more contiguous patches in the southern mountainous–lake region and fewer in the north. Under the NDS and EDS, ecological sources are projected to decrease by 6.12 km2 and 18.31 km2, representing reductions of 0.45% and 1.35%. In contrast, the EPS will see new ecological sources mainly located in southern Feixi County and the Fuding Mountain area of Lujiang County. The increase in ecological sources under EPS will enhance ecosystem connectivity and regional ecological security. This indicates that ecological protection policies could effectively maintain source integrity and support regional ecological stability.
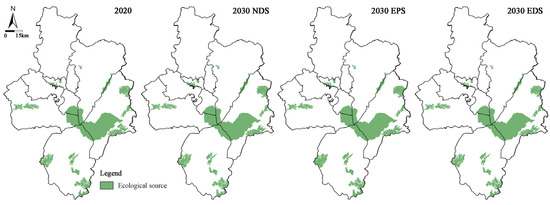
Figure 7.
Spatial distribution of ecological sources under different scenarios.
From the perspective of LULC composition, ecological sources are mainly composed of water and forest, with areas of 842.01 km2, 841.87 km2, 844.65 km2, and 837.57 km2, accounting for 62.25%, 62.52%, 63.08%, and 62.77%. Comprehensive governance and restoration should be implemented for river basins to ensure regional ecological security and continuously provide ecosystem services. The proportions of forest and grassland in the ecological sources are approximately 37.66%, 37.37%, 37.84%, and 37.09%, respectively. Under EPS, the proportions of forest, grassland, and water in the ecological source will be higher than in the other two scenarios. The future planning should prioritize basin-level ecological restoration and strengthen the protection of forest and grassland.
4.3. Multi-Scenario Simulation Results of Ecological Resistance Surfaces
The ecological resistance surface demonstrates a consistent spatial pattern across both the 2020 and 2030 scenarios. The resistance surface exhibits a patchy pattern, with high central and low peripheral values, and notable variations in resistance (Figure 8). Compared with 2020, the average comprehensive resistance values will increase across all three scenarios, with the smallest increase occurring under EPS. The increase in the average comprehensive resistance value significantly affects regional species migration and the flow of ecological services. The high-resistance areas are consistently concentrated in urban built-up zones, such as Hefei’s main urban area and Chaohu City. The high-value ecological resistance area under EDS will be significantly larger than in the other two scenarios, indicating that the magnitude of ecological resistance is affected by urban expansion. Conversely, low-resistance areas closely align with the distribution of ecological sources, primarily situated in southern mountainous regions including Chaohu and its surrounding mountains. The transitional areas between high-resistance areas and low-resistance areas are relatively few, mainly located in the marginal areas of construction land and ecological land.
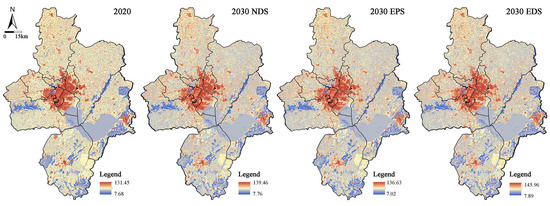
Figure 8.
Spatial distribution of ecological resistance surfaces under different scenarios.
4.4. Multi-Scenario Simulation Results of Ecological Corridors and Ecological Nodes
4.4.1. Identification of Ecological Corridors and Ecological Nodes
The ecological corridors form a spatial structure characterized by a dense network in the southern ecological conservation zone and relatively sparse linkages across the central urbanized region (Figure 9). The number of ecological corridors is 23, 21, 21, and 19, with corresponding lengths of 487.09 km, 393.26 km, 434.66 km, and 377.45 km. The EPS scenario produces the highest corridor continuity and connectivity, with several newly formed pathways reinforcing linkages between the southern mountainous sources and the Chaohu region. The EDS scenario has the fewest corridors but the longest average length, a consequence of fewer source areas with greater intervals and a heterogeneous resistance surface.
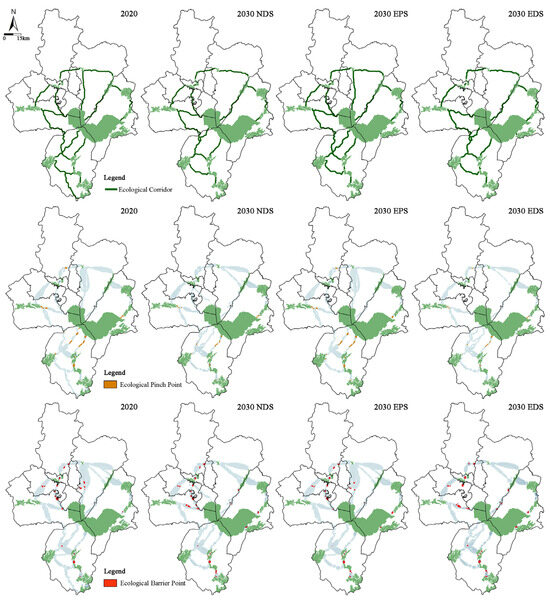
Figure 9.
Spatial distribution of ecological corridors and nodes under different scenarios.
Ecological pinch points are predominantly located in Zifeng mountain and south of Chaohu, with a few at the junctions of ecological sources along the periphery of the study area (Figure 9). The counts for these pinch points are 18, 15, 17, and 12, covering areas of 19.16 km2, 12.46 km2, 17.32 km2, and 10.66 km2. These pinch points coincide with ecological corridors where resistance sharply increases, indicating regions highly sensitive to landscape fragmentation. Ecological barrier points number 22, 27, 24, and 30, with areas of 38.09 km2, 45.27 km2, 43.71 km2, and 50.75 km2. These are mainly distributed along the edges of the central built-up area and at the midpoints of long-distance corridors, typically consisting of construction and cropland. Urban expansion in the central region has created areas of high current density. Under NDS and EDS, the barrier points expand or intensify due to continuous urban development, highlighting the central urban zone as the primary obstruction to east–west and north–south ecological connectivity.
Compared with 2020, the ecological network density in all three scenarios has decreased to varying degrees. However, the EPS shows a relatively dense distribution of corridors and nodes. The newly added corridors and ecological pinch points are mainly distributed on the north and south sides of Chaohu, furthering regional connectivity. EDS shows a relatively scattered distribution of corridors and nodes. Some important corridors have disappeared due to changes in LULC types. The vanished corridors are mainly distributed in the built-up area in the central part of Hefei City and the eastern part of Chaohu. The degradation of ecological resources in the northern region has contributed to the deterioration of ecological corridors, resulting in fewer and smaller ecological barriers and increased resistance to species migration. It is evident that ecological protection measures can slow ecosystem degradation to some extent. During the later planning process, it is crucial to prioritize protective actions for Chaohu and its surrounding environment.
4.4.2. Evaluation of Ecological Network Connectivity
Compared with 2020, the connectivity levels of ecological networks in different scenarios in 2030 all show varying degrees of decline (Table 5). The α indices under the three scenarios are 0.25, 0.23 and 0.28, respectively, all higher than the 2020 value of 0.21. The α -index growth rates of the three scenarios are 19.0%, 9.5% and 33.3%, respectively. The β indices are 0.58, 0.50, 0.54 and 0.45, respectively, all less than 1. The decline rates of the β index in the three scenarios are 13.8%, 6.9% and 22.4%, respectively. It indicates that the ecological network structure is single. The plaque connectivity under EDS is the poorest. The γ indices are 0.20, 0.18, 0.19 and 0.16, respectively, indicating that the spatial distribution of ecological network connections is uneven. The decline rates of the γ index in the three scenarios are 10.0%, 5.0% and 20.0%, respectively. Among them, the density of ecological corridors and the number of ecological intersections in the EPS scenario are the highest. Compared with NDS and EDS, the EPS scenario helps maintain a higher level of ecological network connectivity and to some extent slows down its downward trend.
Table 5.
Evaluation of network characterization of ecological security patterns.
4.5. Construction of Connectivity-Oriented ESP
Based on the ESP of 2020 and supplemented by the ESP under EPS, the ESP of 2030 in Hefei City is constructed. The optimized ESP consists of 16 ecological sources, 24 ecological corridors, 17 ecological pinch points, and 24 ecological barrier points (Figure 10). The area of ecological source areas is 1407.89 km2, the length of ecological corridors is 512.73 km2, the area of ecological pinch points is 22.57 km2, and the area of ecological barrier points is 49.62 km2. The optimized α index remains unchanged, while the β index increases from 0.58 to 0.59, and the γ index increases from 0.20 to 0.21. These changes indicate that the overall integrity and anti-interference ability of the optimized ESP are enhanced, and the ecosystem service functions are improved.
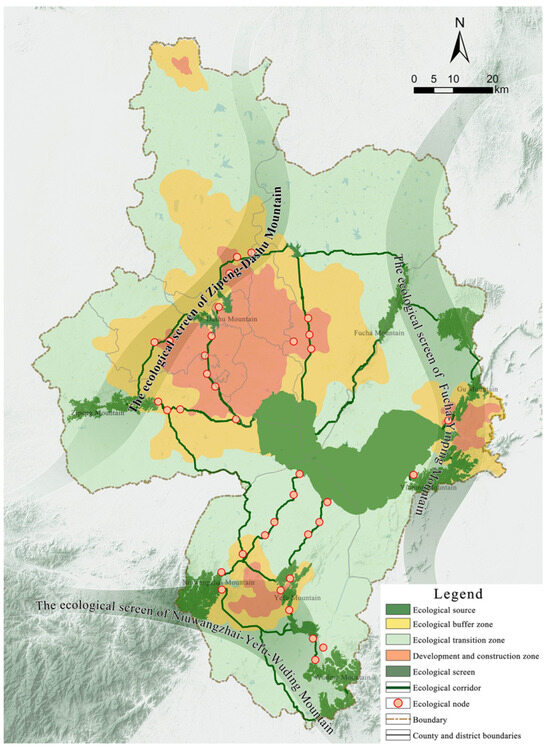
Figure 10.
The construction of connectivity-oriented ecological security patterns.
The ESP in Hefei is conceptualized as “Four Zones, Three Screens, One Network, and Multiple Nodes”. The “Four Zones” refer to the ecological source protection zone, the development and construction zone, the ecological buffer zone, and the ecological transition zone. With the development and construction zone as the central area, the eastward expansion of Hefei’s built-up area can be furthered. The “Three Screens” refer to the ecological screens of Zipeng-Dashu Mountain, Fucha-Yinping Mountain, and Niuwangzhai-Yefu-Wuding Mountain. The habitat quality in these barrier areas is relatively high. The “One network” refers to the web-like structure composed of ecological corridors that ensures the region’s ecological connectivity. The “ Multiple Nodes “ refer to the points that play a crucial role in the circulation between source areas and should be given priority for ecological protection and restoration.
5. Discussion
5.1. Comparison with Existing Research
The evolution of ESP in Hefei City is influenced by urbanization. The original ecological-network structure, characterized by a relatively simple corridor layout and a single source type, has been gradually replaced by a more intricate configuration. This transition has led to increasing landscape fragmentation and shrinking patch areas. Restoring damaged ecological resources and establishing corridors are crucial for addressing ecosystem degradation and promoting sustainability. However, the decision-making applications of different ESPs across scenarios still require further exploration [68]. Based on the major challenges and development goals for the research area, this study proposes three different scenarios. Under the NDS, regional development will continue the current policy orientation and LULC trend, but the potential pressures on the natural ecology cannot be ignored. Under EDS, urban expansion will occupy agricultural and ecological spaces. Under EPS, ecological protection will be the most effective, consistent with results from other published studies [15,46]. Bin Xu et al. [69] compare changes in ESP in the suburbs and rural areas of big cities across different scenarios. Their research indicates that EPS can effectively safeguard high-quality ecological spaces from encroachment to a significant extent. Zhou Yan et al. [54] evaluate various ecosystem services in the Tongcheng County and provide valuable insights for regional ecological prioritization. Chao Wu et al. [70] adopt the Markov-PLUS model to achieve multi-scenario simulation of future LULC and ESV in Guizhou Province. Their study finds that ecological restoration measures have a restraining effect on ESV degradation [70,71]. These findings suggest that ecological protection measures and policies should be prioritized in future development planning.
5.2. Implications for Ecological Protection and Management
This study integrates LULC scenario prediction and the ESV evaluation analysis into the ESP model. It clarifies the impacts of LULC on ecosystem connectivity. The results show that EPS is the best scenario for enhancing ESP in Hefei City [53]. Therefore, by combining spatial optimization with policy guidance, several suggestions for enhancing the stability and refined management of the ecosystem in Hefei City are put forward. These suggestions are closely tailored to the spatial configuration of ecological sources, corridors, pinch points, and barrier points identified in this study.
Ecological sources are critical regions for biodiversity and landscape functions. Most of these areas are located far from urban centers and primarily consist of water and forest areas, playing a core role in the ecological environment and structural connectivity. First, spatial control should be strengthened in the southern mountainous source areas by establishing core conservation zones and ecological buffer strips to limit construction encroachment and preserve the continuity of forest-water ecosystems [4]. Second, integrated ecological conservation and restoration of mountains, rivers, forests, cropland, lakes, and grasslands should be enhanced in areas identified as ecological sources. In Hefei, this is particularly relevant for the southern mountain-lake system, where coordinated watershed management and vegetation restoration can improve soil retention, water conservation, and carbon sequestration functions [72]. As a high-value area for ESV, Chaohu represents an important ecological patch within Hefei City. It is also the core area of ongoing ecological civilization and lake restoration projects. In the future, ecological restoration measures should be continuously implemented. Ecological investment and the capacity of ecosystem services should be furthered [64], achieving effective connections among major source areas and strengthening the planning and construction of species habitats.
Ecological corridors serve as the primary channels for the flow of energy and materials [73]. In provincial capital cities such as Hefei, the challenges in constructing ecological corridors are particularly pronounced. In pursuit of economic benefits, urban areas often adopt high-intensity land development models. Meanwhile, high land prices in provincial capital cities further increase the construction costs for ecological corridors [74]. In addition, the later maintenance of ecological corridors also requires more human and material resources than general greening projects and imposes higher requirements on urban management. Based on the results of identifying ecological corridors in Hefei City and regional ecological issues, priority should be given to safeguarding the key corridors that connect the Chaohu source areas, and emphasis is placed on restoration and control measures that combine natural recovery with assisted regeneration. Construction standards for green corridors should be strictly implemented to build a high-quality, multi-level, multi-system ecological corridor system [75]. For ecological corridors spanning construction land, this requires collaboration among multiple departments, which entails demarcating ecological buffer zones to reduce ecological resistance.
Most of the newly added pinch points are located in Lujiang County and Chaohu City, driven by urban development policies that promote eastward and southward expansion. These pinch points are mainly distributed along the urban expansion fronts and near major transportation corridors and should be incorporated into zoning control and ecological red-line management. Strict protective measures are needed in these areas to prevent human activities from damaging the ecological environment [76]. Measures for the prevention and control of natural disasters should be effectively implemented. Ecological barrier points are vulnerable to external disturbances yet crucial for maintaining regional landscape ecological connectivity. In areas prone to soil erosion and geological disasters, the project of cropland-to-forest conversion should be implemented gradually and in an orderly manner [1]. To reduce the obstruction to the ecological environment caused by existing roads, effective connections between ecological spaces can be achieved by building ecological channels such as culverts, tunnels and bridges. Warning signs can be installed to reduce conflicts between biological migration and human activities, thereby maintaining ecosystem connectivity and security.
5.3. Restrictions and Development
Against the background of rapid urbanization, clarifying the relationship between LULC and ecological changes represents a significant research direction that warrants consideration in future studies. Previous studies have mainly focused on the description of the spatial pattern of multi-scenario ESP. In contrast, the research proposes an ESP comprehensive framework oriented towards enhancing connectivity, which provides a means to explore how different development pathways may influence ecological functions through the PLUS-InVEST model [39]. By integrating LULC simulation and the ESV evaluation into the ESP evaluation model, the framework helps examine the evolution and degradation of the ecosystem in Hefei under different future development scenarios [15]. Multi-scenario simulation offers useful reference information for understanding the impacts of various natural and human factors on urban ecosystems and has significant reference value for local measures to prevent ecological deterioration [53]. In ESP construction, the network analysis index quantitatively evaluates the structural characteristics of the optimized ecological network, enhancing the interpretability of ESP outputs for planning applications [72].
However, this study has certain limitations. First, LULC simulation is influenced by multiple factors and inherently involves uncertainty [77]. Therefore, driving factors must be selected carefully and in accordance with scientific principles to reduce simulation error. Although the Kappa and FOM statistics for the 2020 hindcast indicate acceptable simulation performance, this study does not conduct a sensitivity analysis on the adjustment of transition-probability matrices across scenarios [78]. Future research should strengthen the robustness of land-simulation parameter settings [79]. Second, the width of corridors significantly impacts ecological functioning [80]. Due to spatial heterogeneity and species-specific movement characteristics, determining an appropriate corridor width remains a persistent challenge in ESP construction [81]. Future work can determine optimal corridor widths based on spatial heterogeneity, focal species, management objectives, and expected ecological outcomes [82]. Finally, due to data-availability constraints, this study considers only four ecosystem services when identifying ecological sources [2,37]. The assessment of functional connectivity in this research is conducted at a generic landscape scale. However, recent multitaxa studies have demonstrated that incorporating species-specific habitat suitability and movement characteristics significantly enhances the ecological realism and decision-making relevance of connectivity modeling [83,84]. Integrating multi-species occurrence and behavioral data remains an important direction for future ESP refinement in Hefei.
6. Conclusions
This study proposes a connectivity-oriented ESP construction framework that integrates multi-scenario LULC changes with ESV evaluation under three scenarios of NDS, EPS and EDS. The research conclusions are as follows:
(1) From 2000 to 2020, Hefei experienced substantial land use restructuring, characterized by the expansion of construction land and the reduction in cropland. Two-way conversions between cropland and construction land were prominent. Scenario simulations suggest that the EDS pathway results in the most pronounced growth of construction land, increasing from 17.53% in 2020 to 20.46% in 2030.
(2) The ESV patterns for 2020 and the 2030 scenarios exhibit significant spatial heterogeneity. Areas identified as extremely or relatively important align with major ecological background elements such as Chaohu and Yinping Mountain. The total ecological source areas under the four conditions are 1352.60 km2, 1346.48 km2, 1363.08 km2, and 1334.29 km2, respectively. These sources are mainly concentrated in water- and forest-dominated regions.
(3) The ecological network displays consistent structural patterns across scenarios, with denser connections in the south and sparser ones near the central built-up area. Ecological pinch points are primarily located in Zipeng Mountain and the southern Chaohu region. Barrier points are mainly found along the edges of the central urban area and midpoints of long-distance corridors. Among the scenarios, EPS presents the most coherent network structure and highest connectivity.
(4) Hefei’s 2030 ESP consists of 16 ecological source areas, 24 ecological corridors, 17 ecological pinch points, and 24 ecological barrier points. The configuration reflects an integrated ecological network that supports landscape-scale connectivity and provides a spatial basis for ecological conservation and coordinated urban development.
Author Contributions
Conceptualization, Y.H. and S.L.; methodology, F.W. and S.L.; software, F.W.; validation, J.Z. and R.L.; formal analysis, J.Z.; investigation, R.L.; resources, Y.H.; data curation, F.W.; writing—original draft preparation, F.W.; writing—review and editing, Y.H. and S.L.; visualization, F.W.; supervision, Y.H.; project administration, S.L.; funding acquisition, Y.H. All authors have read and agreed to the published version of the manuscript.
Funding
This research and APC were funded by the National Key R&D Program of China (2022YFC3800103), National Natural Science Foundation of China (52278063), the Major projects of the National Social Science Foundation (23&ZD100), and the Fundamental Research Funds for the Central Universities (2025103).
Data Availability Statement
The data supporting this study’s findings are available from the corresponding authors upon reasonable request.
Conflicts of Interest
The authors declare no conflicts of interest.
Abbreviations
The following abbreviations are used in this manuscript:
| LULC | Land use and land cover |
| PLUS | Patch-generating land-use simulation |
| ESV | Ecosystem service value |
| NDS | Natural development scenario |
| EPS | Ecological protection scenario |
| EDS | Economic development scenario |
| MCR | Minimum cumulative resistance |
| WC | Water conservation |
| HQ | Habitat quality |
| CS | Carbon sequestration |
| SC | Soil conservation |
| NDV | Normalized vegetation index |
| α | Network closure index |
| β | Line point ratio index |
| γ | Network connectivity index |
References
- Zhao, Y.; He, L.; Bai, W.; He, Z.; Luo, F.; Wang, Z. Prediction of ecological security patterns based on urban expansion: A case study of Chengdu. Ecol. Indic. 2024, 158, 111467. [Google Scholar] [CrossRef]
- Zhou, L.; Qin, Y.; Cheng, J.; Zhu, H.; Li, M.; Zhang, J.; LeBleu, C.; Shen, G.; Chen, T.; Liu, Y. Urban ecosystem services, ecological security patterns and ecological resilience in coastal cities: The impact of land reclamation in Macao SAR. J. Environ. Manag. 2025, 373, 123750. [Google Scholar] [CrossRef] [PubMed]
- Han, W.; Tao, Z.; Li, Z.; Cheng, M.; Fan, H.; Cribb, M.; Wang, Q. Effect of Urban Built-Up Area Expansion on the Urban Heat Islands in Different Seasons in 34 Metropolitan Regions across China. Remote Sensing 2023, 15, 248. [Google Scholar] [CrossRef]
- Zhang, L.; Wan, Y.; Sun, Y.; He, G.; Lei, X.; Wei, X.; Jin, G. Optimizing ecological security patterns in a megacity by enhancing urban-rural connectivity: Insights from Wuhan, China. Appl. Geogr. 2025, 176, 103535. [Google Scholar] [CrossRef]
- Chen, Y.; Yang, P. New advances in international research on land use/land cover change. Econ. Geogr. 2001, 21, 95–100. [Google Scholar]
- Li, Q.; Wang, H. Prediction of Land Use Change in the Zhangdu Lake Basin Based on Markov Model. Resour. Sci. 2008, 30, 1541–1546. [Google Scholar]
- Wickramasuriya, R.C.; Bregt, A.K.; van Delden, H.; Hagen-Zanker, A. The dynamics of shifting cultivation captured in an extended Constrained Cellular Automata land use model. Ecol. Model. 2009, 220, 2302–2309. [Google Scholar] [CrossRef]
- Liu, X.; Liang, X.; Li, X.; Xu, X.; Ou, J.; Chen, Y.; Li, S.; Wang, S.; Pei, F. A future land use simulation model (FLUS) for simulating multiple land use scenarios by coupling human and natural effects. Landsc. Urban Plan. 2017, 168, 94–116. [Google Scholar] [CrossRef]
- Xiu, N.; Hu, Y.; Fan, W. Fine Simulation Analysis of the Evolution of Land Use Types in Heilongjiang Province. Environ. Sci. 2025, 1–22. [Google Scholar] [CrossRef]
- Xu, L.; Liu, X.; Tong, D.; Liu, Z.; Yin, L.; Zheng, W. Forecasting Urban Land Use Change Based on Cellular Automata and the PLUS Model. Land 2022, 11, 652. [Google Scholar] [CrossRef]
- Liang, X.; Guan, Q.; Clarke, K.C.; Liu, S.; Wang, B.; Yao, Y. Understanding the drivers of sustainable land expansion using a patch-generating land use simulation (PLUS) model: A case study in Wuhan, China. Comput. Environ. Urban Syst. 2021, 85, 101569. [Google Scholar] [CrossRef]
- Li, X.; Fu, J.; Jiang, D.; Lin, G.; Cao, C. Land use optimization in Ningbo City with a coupled GA and PLUS model. J. Clean. Prod. 2022, 375, 134004. [Google Scholar] [CrossRef]
- Zheng, Y.; Su, L.; Zeng, Q.; Zhou, S.; Li, S.; Hong, H.; Deng, H.; Li, W. Spatiotemporal assessment of land use carbon emission in the Guangdong-Hong Kong-Macao Greater Bay Area:A hybrid static-dynamic model integrated with PLUS. Urban Clim. 2025, 63, 102574. [Google Scholar] [CrossRef]
- Feng, X.; Li, Y.; Yu, E.; Yang, J.; Wang, S.; Yuan, W. Spatiotemporal evolution pattern and simulation of the coupling of carbon productivity and land development in the Yangtze River Delta, China. Ecol. Inform. 2023, 77, 102186. [Google Scholar] [CrossRef]
- Zhang, Z.; Li, X.; Du, S.; Liu, C.; Shi, Z.; Yan, C. Spatial-temporal evolution analysis of multi-scenario land use and ecosystem services base on PLUS-Invest model: A case study in Beijing-Tianjin-Hebei region, China. Sustain. Futures 2025, 10, 101154. [Google Scholar] [CrossRef]
- Gao, Y.; Wang, Z. Future urban heat island effect and heat risk in mountainous megacity: Multi-scenario simulations using machine learning model and the SD-PLUS model. Sustain. Cities Soc. 2025, 134, 106915. [Google Scholar] [CrossRef]
- Wu, Q.; Cao, Y.; Zhang, Y.; Su, D.; Fang, X. Linking ecosystem services trade-offs, human preferences and future scenario simulations to ecological security patterns: A novel methodology for reconciling conflicting ecological functions. Appl. Geogr. 2025, 176, 103534. [Google Scholar] [CrossRef]
- Cen, X.; Zhang, H. Impacts of multi-scenario land use change on ecosystem services and ecological security pattern: A case study of the Yellow River Delta. Res. Cold Arid Reg. 2024, 16, 30–44. [Google Scholar] [CrossRef]
- Xin, S.; Li, Z.; Chen, N.; Zhang, Z.; Zhang, X.; Chen, H.; Ma, X.; Kang, L. The contribution of multi-objective land use optimization to reducing ecological risk: A case study of the Lanzhou-Xining urban agglomeration. Ecol. Indic. 2024, 168, 112604. [Google Scholar] [CrossRef]
- Liu, J.; Kong, X.; Zhu, Y.; Zhang, B. A study on land use change simulation based on PLUS model and the U-net structure: A case study of Jilin Province. Ecol. Indic. 2025, 176, 113619. [Google Scholar] [CrossRef]
- Xu, X.; Wang, S.; Rong, W. Construction of ecological network in Suzhou based on the PLUS and MSPA models. Ecol. Indic. 2023, 154, 110740. [Google Scholar] [CrossRef]
- Guo, H.; Cai, Y.; Li, B.; Tang, Y.; Qi, Z.; Huang, Y.; Yang, Z. An integrated modeling approach for ecological risks assessment under multiple scenarios in Guangzhou, China. Ecol. Indic. 2022, 142, 109270. [Google Scholar] [CrossRef]
- Luo, X.; Le, F.; Zhang, Y.; Zhang, H.; Zhai, J.; Luo, Y. Multi-scenario analysis and optimization strategy of ecological security pattern in the Weihe river basin. J. Environ. Manag. 2024, 366, 121813. [Google Scholar] [CrossRef]
- Ma, K.; Fu, B.; Li, X.; Guan, W. Regional Ecological Security Patterns: Concepts and Theoretical Basis. Acta Ecol. Sin. 2004, 24, 761–768. [Google Scholar]
- Shi, X.; Zhao, J.; Zhiyun, O. Assessment of eco-security in the Knowledge Grid e-science environment. J. Syst. Softw. 2006, 79, 246–252. [Google Scholar] [CrossRef]
- Ying, B.; Liu, T.; Ke, L.; Xiong, K.; Li, S.; Sun, R.; Zhu, F. Identifying the Landscape Security Pattern in Karst Rocky Desertification Area Based on Ecosystem Services and Ecological Sensitivity: A Case Study of Guanling County, Guizhou Province. Forests 2023, 14, 613. [Google Scholar] [CrossRef]
- Wang, B.; Zhang, Y.; Gu, H.; Bian, Z. Ecological Security Patterns Based on Ecosystem Service Assessment and Circuit Theory: A Case Study of Liaoning Province, China. Land 2025, 14, 1257. [Google Scholar] [CrossRef]
- Wang, Y.; Thornton, D.H.; Ge, D.; Wang, S.; Ding, P. Ecological correlates of vulnerability to fragmentation in forest birds on inundated subtropical land-bridge islands. Biol. Conserv. 2015, 191, 251–257. [Google Scholar] [CrossRef]
- Abulaiti, H.; Mamat, A.; Mijiti, M. Construction and Optimization of Ecological Network in Kuqa, China. Land 2025, 14, 323. [Google Scholar] [CrossRef]
- Li, X.; Tao, H.; Wang, J.; Zhang, B.; Liu, Z.; Liu, Z.; Li, J. Integrated Evaluation of the Ecological Security Pattern in Central Beijing Using InVEST, MSPA, and Multifactor Indices. Land 2025, 14, 205. [Google Scholar] [CrossRef]
- Su, Y.; Chen, X.; Liao, J.; Zhang, H.; Wang, C.; Ye, Y.; Wang, Y. Modeling the optimal ecological security pattern for guiding the urban constructed land expansions. Urban For. Urban Green. 2016, 19, 35–46. [Google Scholar] [CrossRef]
- Wu, T.; Lu, S.; Ding, Y. Ecological Security Evaluation System Integrated with Circuit Theory for Regional Ecological Security Pattern Construction: A Coordinated Study of Chang-Zhu-Tan Metropolitan Area in China. Land 2025, 14, 257. [Google Scholar] [CrossRef]
- Knaapen, J.P.; Scheffer, M.; Harms, B. Estimating habitat isolation in landscape planning. Landsc. Urban Plan. 1992, 23, 1–16. [Google Scholar] [CrossRef]
- Li, T.; Yiyin, L.; Gaigai, L.; Jun, L.; Qinchu, L.; Jinzhao, L. Landscape Pattern Optimization of Dongfang City, Hainan Province Based on Granularity Reverse Deduction Method and MCR Model. J. Ecol. 2016, 35, 3393–3403. [Google Scholar]
- Doyle, P.G.; Snell, J.L. Random Walks and Electric Networks, 1st ed.; Mathematical Association of America: Washington, DC, USA, 1984; Volume 22. [Google Scholar]
- Dang, Z.; Hu, B.; Gao, C.; Wen, S.; Ren, J.; Liang, Y. Construction and Optimization of the Ecological Security Pattern of Pinglu Canal Economic Zone Based on the InVEST-Circuit Theory Model. Land 2025, 14, 1103. [Google Scholar] [CrossRef]
- Guan, D.; Chang, Q.; Zhou, L.; Zhu, K.; Peng, G. Construction and Optimization of Ecological Security Pattern Network Based on the Supply–Demand Ratio of Ecosystem Services: A Study from Chengdu–Chongqing Economic Circle, China. Land 2024, 13, 844. [Google Scholar] [CrossRef]
- Liu, X.; Zhang, F.; Gao, Q.; Li, T.; Zhang, R.; Jia, Y. Optimizing the Ecological Network to Construct an Ecological Security Pattern in a Metropolitan Area: A Case Study of the Jinan Metropolitan Area, China. Sustainability 2025, 17, 7342. [Google Scholar] [CrossRef]
- Dai, X.; Li, D.; Zheng, Y.; Liu, C.; Li, N.; Lu, H. Analysis of spatiotemporal changes and driving factors of green and blue carbon stocks in Zhangzhou City based on PLUS and InVEST models. J. Clean. Prod. 2025, 528, 146743. [Google Scholar] [CrossRef]
- Koko, A.F.; Han, Z.; Wu, Y.; Zhang, S.; Ding, N.; Luo, J. Spatiotemporal Analysis and Prediction of Urban Land Use/Land Cover Changes Using a Cellular Automata and Novel Patch-Generating Land Use Simulation Model: A Study of Zhejiang Province, China. Land 2023, 12, 1525. [Google Scholar] [CrossRef]
- Wu, A.; Wang, Z. Multi-scenario simulation and carbon storage assessment of land use in a multi-mountainous city. Land Use Policy 2025, 153, 107529. [Google Scholar] [CrossRef]
- Xu, X.; Kong, W.; Wang, L.; Wang, T.; Luo, P.; Cui, J. A novel and dynamic land use/cover change research framework based on an improved PLUS model and a fuzzy multiobjective programming model. Ecol. Inform. 2024, 80, 102460. [Google Scholar] [CrossRef]
- Huang, C.; Zhou, Y.; Wu, T.; Zhang, M.; Qiu, Y. A cellular automata model coupled with partitioning CNN-LSTM and PLUS models for urban land change simulation. J. Environ. Manag. 2024, 351, 119828. [Google Scholar] [CrossRef] [PubMed]
- Zeng, J.; Wu, J.; Chen, W. Coupling analysis of land use change with landscape ecological risk in China: A multi-scenario simulation perspective. J. Clean. Prod. 2024, 435, 140518. [Google Scholar] [CrossRef]
- Li, L.; Huang, X.; Yang, H. Scenario-based urban growth simulation by incorporating ecological-agricultural-urban suitability into a Future Land Use Simulation model. Cities 2023, 137, 104334. [Google Scholar] [CrossRef]
- Li, H.; Zhang, K.; Liu, Y.; Qin, Y.; Wang, W.; Wang, M.; Liu, Y.; Li, Y. Spatiotemporal evolution of land use and carbon storage in China: Multi-Scenario simulation and driving factor analysis based on the PLUS-InVEST model and SHAP. Environ. Res. 2025, 279, 121860. [Google Scholar] [CrossRef] [PubMed]
- Ma, J.; Mei, Z.; Wang, X.; Li, S.; Liang, J. Ecological Security Pattern Construction and Multi-Scenario Risk Early Warning (2020–2035) in the Guangdong–Hong Kong–Macao Greater Bay Area, China. Land 2024, 13, 1267. [Google Scholar] [CrossRef]
- Zitao, Y.; Li, T. Sustainable Development Assessment Based on PLUS Simulation of Future Land Use Changes: A Case Study of Jiangxi Province. Geogr. Sci. 2024, 44, 1826–1836. [Google Scholar]
- Ma, G.; Li, Q.; Zhang, J.; Zhang, L.; Cheng, H.; Ju, Z.; Sun, G. Simulation and Analysis of Land-Use Change Based on the PLUS Model in the Fuxian Lake Basin (Yunnan–Guizhou Plateau, China). Land 2023, 12, 120. [Google Scholar] [CrossRef]
- Fan, F.; Wen, X.; Feng, Z.; Gao, Y.; Li, W. Optimizing urban ecological space based on the scenario of ecological security patterns: The case of central Wuhan, China. Appl. Geogr. 2022, 138, 102619. [Google Scholar] [CrossRef]
- Wang, Y.; Liang, D.; Wang, J.; Zhang, Y.; Chen, F.; Ma, X. An analysis of regional carbon stock response under land use structure change and multi-scenario prediction, a case study of Hefei, China. Ecol. Indic. 2023, 151, 110293. [Google Scholar] [CrossRef]
- Zhang, J.; Cao, P.; Roosli, R. Assessing land use and carbon storage changes using PLUS and InVEST models: A multi-scenario simulation in Hohhot. Environ. Sustain. Indic. 2025, 26, 100655. [Google Scholar] [CrossRef]
- Luan, C.; Liu, R.; Li, Y.; Zhang, Q. Comparison of various models for multi-scenario simulation of land use/land cover to predict ecosystem service value: A case study of Harbin-Changchun Urban Agglomeration, China. J. Clean. Prod. 2024, 478, 144012. [Google Scholar] [CrossRef]
- Yan, Z.; Mengyao, L.; Lina, W.; Jianing, Y.; Qiaoling, L. Research on Ecological Restoration Strategies for Territorial Space Based on Ecological Network Optimization Comparison. Chin. Gard. 2024, 40, 43–49. [Google Scholar]
- Liu, P.-X.; Liu, Y.; Li, T.-N.; Guo, W.-W.; Yang, A.-L.; Yang, X.; Li, E.-Z.; Wang, Z.-J. Identification and Trend Analysis of Ecological Security Pattern in Mudanjiang City Based on MSPA-MCR-PLUS Model. Sustainability 2024, 16, 9690. [Google Scholar] [CrossRef]
- Li, T.; Li, L.; Tang, M.; Deng, H. Heterogeneous Impacts of Human Activity Intensity on Regional Ecological Security Patterns: The Case of Southwest China. Land 2024, 13, 2172. [Google Scholar] [CrossRef]
- Jia, D.; Qiu, W.; Guo, R.; Wu, M.; Wang, Z.; Hu, X. Prioritizing Protection and Restoration Areas Based on Ecological Security Pattern with Different Resistance Assignments. Land 2025, 14, 349. [Google Scholar] [CrossRef]
- Tong, A.; Zhou, Y.; Chen, T.; Qu, Z. Constructing an Ecological Spatial Network Optimization Framework from the Pattern–Process–Function Perspective: A Case Study in Wuhan. Remote Sens. 2025, 17, 2548. [Google Scholar]
- Lai, X.; Yu, H.; Liu, G.; Zhang, X.; Feng, Y.; Ji, Y.; Zhao, Q.; Jiang, J.; Gu, X. Construction and Analysis of Ecological Security Patterns in the Southern Anhui Region of China from a Circuit Theory Perspective. Remote Sens. 2023, 15, 1385. [Google Scholar] [CrossRef]
- Lai, J.; Qi, S. Construction of ecological security pattern based on ecological protection red line, machine learning algorithms, and circuit theory: A case study of Kunming city, China. J. Clean. Prod. 2025, 520, 146117. [Google Scholar] [CrossRef]
- Yuan, M.; Xian, Q.; Huang, Q.; Yang, C.; Shu, J.; Yao, C.; Pan, H. Research on ecological security pattern based on the paradigm of “portray-assessment-construction-validation”—Minjiang River Basin as an example. J. Environ. Manag. 2025, 394, 127553. [Google Scholar] [CrossRef]
- Liu, Y.; Jing, Y.; Zhao, S.; Lu, P.; Han, S. Ecological security pattern and simulation prediction based on circuit theory: A case study of the Nansi Lake Basin in China. J. Nat. Conserv. 2026, 89, 127137. [Google Scholar] [CrossRef]
- Xie, P.; Yang, J.; Wang, H.; Liu, Y.; Liu, Y. A New method of simulating urban ventilation corridors using circuit theory. Sustain. Cities Soc. 2020, 59, 102162. [Google Scholar] [CrossRef]
- Zhang, F.; Liu, X.; Jia, Y. Construction and evolution of river basin ecological network based on circuit theory and MSPA: A case study of Dawen River Basin. Ecol. Model. 2025, 510, 111364. [Google Scholar] [CrossRef]
- Li, Z.; Chenxu, W.; Jianying, X.; Xin, L.; Xiaojin, W. The Scenario of Optimizing the Ecological Network of Arid Cities for Enhanced Connectivity: A Case Study of Bayannur City and Its Surrounding Areas. Acta Ecol. Sin. 2022, 42, 8675–8689. [Google Scholar]
- Xiuping, L.; Xinyu, L.; Yanming, L.; Songting, Z.; Ziyun, D.; Minjie, D. Construction and Optimization of Ecological Network in Rapidly Urbanizing Areas: A Case Study of Daxing District, Beijing. Acta Ecol. Sin. 2023, 43, 8321–8331. [Google Scholar]
- Xiaolu, X.; Xiaolong, Z.; Junqiang, M.; Xinwen, W. Research on Ecological Network Identification and Optimization in the Hilly Area of Central Sichuan: A Case Study of Suining City. Environ. Ecol. 2025, 7, 81–88. [Google Scholar]
- Zhang, Y.; Yin, X.; Li, Y.; Wei, J.; Wang, H.; Yu, P.; Chen, Y. Evaluating ecological redline policies: Integrating multi-scenario land use simulation with ecological network analysis. Ecol. Model. 2025, 510, 111357. [Google Scholar] [CrossRef]
- Xu, B.; Xu, T.; Nie, W.; Fan, C.; Wu, Y.; Wang, Z. Simulation and planning regulation of rural landscape patterns in suburbs of large cities: Based on the ESP-GMOP-PLUS coupled model. Ecol. Front. 2025, 45, 1689–1703. [Google Scholar] [CrossRef]
- Wu, C.; Wang, Z. Multi-scenario simulation and evaluation of the impacts of land use change on ecosystem service values in the Chishui River Basin of Guizhou Province, China. Ecol. Indic. 2024, 163, 112078. [Google Scholar] [CrossRef]
- Niu, X.; Zhang, J.; Wang, S.; Zong, L.; Zhou, M.; Zhang, M. Identification of priority areas for ecological restoration based on ecological security patterns and ecological risks: A case study of the Hefei Metropolitan Area. Ecol. Indic. 2025, 175, 113590. [Google Scholar] [CrossRef]
- Zhang, Z.; Wang, C.; Qian, Y.; Zhang, Q.; Song, C.; Li, Q.; Wu, Y.; Dong, B. Habitat networks simulation and sustainable optimization policies for sectional functional impairments based on “land—Species” coupling. J. Clean. Prod. 2025, 486, 144513. [Google Scholar] [CrossRef]
- Wang, Y.; Qu, Z.; Zhong, Q.; Zhang, Q.; Zhang, L.; Zhang, R.; Yi, Y.; Zhang, G.; Li, X.; Liu, J. Delimitation of ecological corridors in a highly urbanizing region based on circuit theory and MSPA. Ecol. Indic. 2022, 142, 109258. [Google Scholar] [CrossRef]
- Fang, Y.; Zhao, L. Assessing the environmental benefits of urban ventilation corridors: A case study in Hefei, China. Build. Environ. 2022, 212, 108810. [Google Scholar] [CrossRef]
- Rotem-Mindali, O.; Katzir, N.; Perez, O. Identifying Regulatory Barriers in the Management of Ecological Corridors in an Increasingly Congested Space. Land 2024, 13, 1552. [Google Scholar] [CrossRef]
- Li, Y.; Zhao, J.; Yuan, J.; Ji, P.; Deng, X.; Yang, Y. Constructing the Ecological Security Pattern of Nujiang Prefecture Based on the Framework of “Importance–Sensitivity–Connectivity”. Int. J. Environ. Res. Public Health 2022, 19, 10869. [Google Scholar] [CrossRef] [PubMed]
- An, H.; Yan, W.; Li, T.; Jing, X.; Yinlong, L.; Minxuan, S.; Yuan, Z. Research Progress and Prospect of Carbon Effects in Land Use Systems: Mechanism, Simulation and Optimization. J. Nat. Resour. 2024, 39, 2450–2470. [Google Scholar]
- Du, Z.; Niu, J.; Fan, D.; Zhang, Z.; Yang, Z. Simulation of Land Use Change and Driving Force Analysis in the Sandy and Coarse Sand Area of the Middle reaches of the Yellow River Based on the PLUS model. Res. Soil Water Conserv. 2024, 31, 309–318. [Google Scholar]
- Laliberté, J.; St-Laurent, M.-H. Validation of functional connectivity modeling: The Achilles’ heel of landscape connectivity mapping. Landsc. Urban Plan. 2020, 202, 103878. [Google Scholar] [CrossRef]
- Wei, W.; Wang, S.; Li, X.; Zhou, J.; Zhong, Y.; Li, P.; Zhang, Z. Identification and Analysis of Ecological Corridors in the Central Urban Area of Xuchang Based on Multi-Source Geospatial Data. ISPRS Int. J. Geo-Inf. 2024, 13, 322. [Google Scholar] [CrossRef]
- Dang, H.; Lü, Y.; Guo, J.; Wu, X. Multi-scenario simulation can contribute to identify priorities for regional ecological corridors conservation. Ecol. Indic. 2024, 165, 112166. [Google Scholar] [CrossRef]
- Chen, R.; Carruthers-Jones, J.; Carver, S.; Wu, J. Constructing urban ecological corridors to reflect local species diversity and conservation objectives. Sci. Total Environ. 2024, 907, 167987. [Google Scholar] [CrossRef] [PubMed]
- Mimet, A.; Houet, T.; Julliard, R.; Simon, L. Assessing functional connectivity: A landscape approach for handling multiple ecological requirements. Methods Ecol. Evol. 2013, 4, 453–463. [Google Scholar] [CrossRef]
- Valerio, F.; Godinho, S.; Salgueiro, P.; Medinas, D.; Manghi, G.; Mira, A.; Pedroso, N.M.; Ferreira, E.M.; Craveiro, J.; Costa, P.; et al. Integrating remote sensing data on habitat suitability and functional connectivity to inform multitaxa roadkill mitigation plans. Landsc. Ecol. 2023, 38, 3335–3352. [Google Scholar] [CrossRef]
Disclaimer/Publisher’s Note: The statements, opinions and data contained in all publications are solely those of the individual author(s) and contributor(s) and not of MDPI and/or the editor(s). MDPI and/or the editor(s) disclaim responsibility for any injury to people or property resulting from any ideas, methods, instructions or products referred to in the content. |
© 2025 by the authors. Licensee MDPI, Basel, Switzerland. This article is an open access article distributed under the terms and conditions of the Creative Commons Attribution (CC BY) license (https://creativecommons.org/licenses/by/4.0/).