Abstract
In 2005, the Fifth Plenary Session of the 16th Central Committee of the Communist Party of China introduced a strategic plan to advance the construction of a new socialist countryside, thereby providing a policy foundation for the robust development of rural tourism. Against this policy backdrop, the present study investigates the impact of rural tourism policies on the spatial evolution of ethnic minority villages in Yanbian Prefecture, utilizing data from the period 2004–2023. As a representative region in China where ethnic minorities coexist, Yanbian Prefecture exhibits distinctive cultural and spatial features in its Korean villages, making it a key pilot area for rural tourism development. This study utilizes the PMC index model, the coupled coordination degree model, and the vector autoregressive model to analyze the implementation effects of rural tourism policies and to establish an index system for rural spatial construction. By examining the spatial evolution of representative ethnic minority villages in Yanbian Prefecture, the research explores the dynamic interactions between tourism policies and rural construction, as well as the underlying causal mechanisms. The findings indicate that: (1) in ethnic minority villages, geographic characteristics and various constraints contribute to delayed initial policy effects, with negative fluctuations observed, highlighting a distinct lag effect in the policy implementation process; and (2) a significant Granger causality exists between tourism policies and rural spatial construction, with varying effects observed across different dimensions. The study centers on ethnic minority settlements, systematically analyzing the dynamic effects of tourism policies in the context of their spatial evolution characteristics. It offers sustainable development policy recommendations tailored to the unique attributes of ethnic minority villages. lt is suggested that the actual needs of village construction and long-term development goals should be fully considered when formulating and implementing policies to promote the sustainable development of ethnic minority areas.
1. Introduction
In recent years, rural areas have undergone profound transformations driven by modernization, globalization, and urbanization [1]. Since the mid-20th century, significant changes in rural spaces first emerged in developed countries in Europe and North America, characterized by large-scale rural-to-urban migration [2], the decline of agricultural economies, and the rise of manufacturing, tourism, and service industries [3], which collectively spurred global rural spatial transformations. Kohl [4] was among the early scholars to propose that the formation and spatial distribution of rural settlements are influenced by a combination of geographical factors and human activities. Demangeon [5] and Brunhes [6] empirically analyzed the characteristics of rural spatial evolution in France and Germany, summarizing the patterns of settlement change under varying environmental conditions. Cater [7] and Palmer [8] explored the sociological aspects of rural settlement distribution and its implications for social structures. In contrast, research on rural spatial construction in China started relatively late, gaining scholarly attention since the 1990s, with topics ranging from early studies on rural settlements [9,10] and agricultural regionalization [11,12] to comprehensive explorations of spatial morphology [13] and evolutionary mechanisms [14]. These studies have provided valuable insights for planners and policymakers to better understand the evolution of rural spaces.
Research on the evolution of rural spaces has gradually shifted its focus from general rural areas to specific types of rural spaces. At present, scholars mainly focus on the typical rural spatial evolution characteristics and patterns of highly urbanized villages [15], peri-urban villages [16], urban villages [17], hollow villages [18], traditional villages [19], tourist villages [20], and other similar rural spaces. However, they rarely explore ethnic minority villages with shared cultural characteristics. There is a particular lack of in-depth analysis of the interaction between policy orientation and rural space. Furthermore, studies often overlook the challenges of spatial reconstruction and cultural adaptation faced by ethnic minority villages in the context of globalization and tourism. This study selects minority villages in Yanbian Prefecture as the research focus, examining the impact of tourism policies on the spatial evolution of this unique type of rural area. It aims to address the existing gap in research on the spatial characteristics of ethnic villages and provide theoretical support for the formulation of rural tourism policies and the distinctive development of ethnic villages.
The influencing mechanisms of rural spatial evolution currently encompass economic factors, population dynamics, resource environments, socio-cultural influences, and policy, among others. Teka [21] identified policy as a primary driver of land use changes and agricultural development. Munteanu [22] et al. asserted that shifts in policy regimes influence future land use decisions. Wang Juan [23] et al. demonstrated that land use changes in China are strongly correlated with government policies and socio-economic development. However, these studies primarily treat policy as a contributing factor, offering limited analysis of its central role and specific mechanisms. Investigating the role of policy in rural spatial evolution and identifying how effective policy formulation and implementation can advance rural tourism development while achieving economic and cultural goals remains a critical policy challenge. Rural tourism policy, as a pivotal instrument for transforming the rural economy, has garnered increasing attention regarding its influence on rural spatial evolution. Most existing studies emphasize policy content analysis, evaluations of policy effectiveness, and mechanisms of policy implementation, as well as the driving forces behind spatial transfer [24,25], circulation, and spatial patterns [26,27]. In this context, the Policy Modeling Consistency model, as proposed by Ruiz Estrada [28], offers a systematic approach for the quantitative assessment of policy texts. Compared to traditional comprehensive evaluation methods, the PMC index model exhibits greater flexibility in indicator selection and facilitates the inclusion of multiple variables for a holistic policy assessment [29]. Furthermore, the PMC index model highlights both the strengths and weaknesses of individual policies and visualizes the composition of scores for their key variables, thereby enabling targeted recommendations for policy optimization [30]. This model has been extensively applied across various public policy evaluation domains, including land resource protection policies [31], environmental protection policies [32], and rural tourism policies [33]. Kuang et al. [31] developed a cropland protection policy evaluation framework incorporating 10 key variables and validated the practical utility of the PMC index model through quantitative analysis. Zhang et al. [34] utilized the PMC index model in policy research within the construction industry to evaluate the effectiveness and efficiency of strategic approaches. These studies demonstrate that the PMC index model is suitable for the quantitative evaluation of rural tourism development policies. Nevertheless, limited research exists regarding the dynamic impacts of tourism policy changes on rural spatial development. Building on this, the study integrates the PMC index model to systematically investigate the mechanisms through which rural tourism policies influence the evolution of rural spatial dynamics. Such an approach not only aids in optimizing policy design and implementation pathways but also holds significant theoretical and practical value in fostering the systematic and orderly development of rural spaces.
Rural tourism policies offer a multidimensional perspective on the development and optimization of rural settlement spaces, encompassing the dynamic interplay between socio-cultural factors, geographic characteristics of settlements, economic development, and rural construction. In light of this, the study examines ethnic minority settlement villages in Yanbian Prefecture, addressing two research questions: first, investigating the spatial evolution characteristics of minority villages; and, second, analyzing the impact mechanisms of policies on rural spatial evolution using long-term data series. To address these issues, the study adopts a multilevel analytical framework. First, the study quantifies the implementation effects of policies using the Policy Modeling Consistency (PMC) model [28]. Second, the Technique for Order Preference by Similarity to Ideal Solution (TOPSIS) model [35] is applied to construct a rural construction index system, ensuring the scientific rigor and rationality of the indices while comprehensively reflecting rural spatial evolution characteristics. This is further integrated with the Coupling Coordination Analysis (CCDM) mode [36] to evaluate the degree of coupling and coordination between policies and rural spatial construction demands, thereby uncovering the dynamic relationship between policy alignment and spatial requirements. Finally, the Vector Autoregression (VAR) model [37] is employed to analyze the dynamic interactions between rural tourism policies and rural construction indices, exploring the specific mechanisms of policy influence on rural spaces across different stages. This study aims to contribute to rural space research in China by providing theoretical insights and empirical evidence to support the local development of rural areas in the country.
2. Materials and Methods
2.1. Overview of the Study Area
Yanbian Prefecture, located in eastern Jilin Province at the border of China, Russia, and North Korea, has been developing its tourism industry since the 1990s. The region features specialized tourism projects, such as bed-and-breakfast accommodation and rural cultural experiences. However, challenges such as suboptimal spatial planning, irrational land use, adverse impacts of extensive new and renovated buildings on the rural landscape, and mismatches between tourism investments and actual outcomes have become increasingly evident. This study utilizes the Geographic Information System (GIS) to analyze the spatial distribution of villages within the region (Figure 1). Based on the screening of national and provincial key rural tourism villages, villages with minority characteristics, and other representative model villages, Guangdong Village, Bailong Village, Shuinan Village, Mingdong Village, and Jindalai Village were identified as research samples (Table 1) The selection criteria were as follows: (1) the villages are located in Yanbian Prefecture and are predominantly inhabited by ethnic Koreans, with the Korean population exceeding 90%; (2) the villages are designated as key support areas at national or local levels, receiving significant honors and policy backing; and (3) the villages exhibit distinct spatial evolution characteristics, alongside diversity in geographic location, natural resources, and rural tourism resource types.
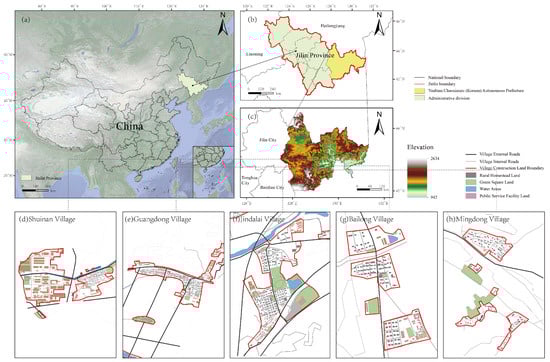
Figure 1.
Location map of the study area. (a) is a map of China, (b) is an enlarged map of Jilin Province, (c) is a map of Yanji, (d) Shuinan Village, (e) Guangdong Village, (f) Jindalai Village, (g) Bailong Village, (h) Mingdong Village.

Table 1.
Basis for the selection of sample villages.
2.2. Data Sources and Processing
This study examines national-level rural tourism policies through an analysis of policy texts. To ensure the selected policies systematically and comprehensively capture the developmental trajectory of rural tourism policies, the following selection criteria were established. First, the policies must span the period from 2004 to 2023, capturing the dynamic evolution of rural tourism policies across various development stages. Second, the content of the policies must explicitly address rural tourism development, with a specific emphasis on those directly related to ethnic minority villages, tourism infrastructure construction, tourism resource development, and cultural preservation. Third, priority was assigned to national-level policy documents issued by authoritative bodies such as the State Council, the Ministry of Culture and Tourism, the Ministry of Agriculture and Rural Affairs, and the National Development and Reform Commission to ensure broad applicability and enforceability. Additionally, the policy texts were required to include explicit quantitative analysis elements, such as defined objectives, tools, and measures.
Based on the selection principles outlined above, the intelligent legal search database (http://www.pkulaw.com, accessed on 6 June 2024), developed by the Law Department of Peking University, was used. Additionally, the websites of the Chinese government, the Ministry of Agriculture and Rural Development, and the Ministry of Culture and Tourism were consulted to conduct a comprehensive search of relevant laws and regulations. A total of 193 tourism policies were identified by using the keywords “rural” or “countryside” in combination with “tourism”. Based on this, the policy texts were sorted and evaluated, and 20 policy texts with substantial policy content and specific action plans were selected, coded as P1–P20 (Table 2). Among these, policies P1, P12–14, and P20 primarily focus on the broader context of rural revitalization, emphasizing the multidimensional integration and long-term planning of rural development. These policies often involve the synergistic development of tourism alongside other socio-economic sectors, classifying them as comprehensive policies. In contrast, policies P2, P3–11, and P15–19 concentrate on the development of tourism resources and infrastructure, addressing specific issues within the tourism industry during its growth, and are thus categorized as tourism-specific policies.
Table 2.
Summary of the sample of 20 rural policy assessments to be evaluated.
To evaluate and analyze the policies systematically, the texts of the 20 selected rural policies underwent lexical processing and word-frequency analysis using the ROST Content Mining System Version 6.0 (ROST-CM6) software to extract high-frequency words. Words with ambiguous directionality, such as “development”, “construction”, and “advancement”, were removed, and words with similar meanings were consolidated. Following screening, organization, and counting, the top 10 high-frequency words, presented in Table 3, were identified.
Table 3.
High-frequency keywords and their frequency table of China’s rural tourism policy.
The rural construction evaluation data were sourced from the end of 2004–2023, with land use data provided by the China Land Cover Dataset (CLCD) at Wuhan University [38] and vegetation cover information obtained from the National Scientific Data Center for the Tibetan Plateau (https://data.tpdc.ac.cn/ (accessed on 6 June 2024)). Missing data were supplemented using citywide averages or adjusted proportions based on the development level of each district or county (Table 4). During data processing, ArcGIS 10.8 software was utilized to analyze the spatial distribution and evolution of rural construction indicators, with the aim of revealing the trends in spatial characteristics of rural areas. Additionally, Fragstats 4.2 software was employed for quantitative analysis of the landscape pattern, assessing indicators such as diversity, aggregation, and other landscape characteristics in rural areas.
Table 4.
Main symbols, names, and data processing.
2.3. Research Methodology
2.3.1. Analysis of Quantitative Evaluation of Policies
The PMC index model was employed to evaluate the influence of rural tourism policies on the spatial transformation of ethnic minority villages in Yanbian Prefecture during the period from 2004 to 2023. Drawing on the keywords presented in Table 3 and informed by the research findings of Estrada et al. [28,39,40], a total of 10 primary variables and 41 secondary variables were identified. The primary variables presented in Table 5 are numbered X1–X10 and encompass policy nature, policy area, policy timeliness, policy object, policy perspective, policy instrument, policy measure, incentive measure, policy evaluation, and policy disclosure.
Table 5.
Summary of the sample of 20 rural policy assessments to be evaluated.
Initially, the primary and secondary variables listed in Table 5 are input into the input–output table, as defined by Equations (1) and (2), with secondary variables assigned binary values: policies conforming to the variables receive a value of 1, while those not conforming are assigned a value of 0. Subsequently, Equation (3) is applied to calculate the value of each primary variable, which is constrained to the range [0, 1]. Thereafter, Equation (4) is employed to compute the score for each policy and classify the corresponding policy level based on the scoring criteria outlined in Table 6. Finally, the PMC surface diagram is generated using Equation (5).
where i is the ordinal number of the primary variable; j is the ordinal number of the secondary variable, is the i-th primary variable; is the score of the secondary variable; and is the number of the secondary variable under the corresponding primary variable.
Table 6.
Policy rating scale.
The calculated PMC index value is plotted as a PMC surface to depict trends in policy consistency across different time periods. This surface can illustrate the effects of policy implementation and its influence on rural spatial development.
To better emphasize specific deficiencies in rural tourism policies within the multi-coordinate system and to explore paths for policy optimization and adjustment, this paper introduces the policy concavity index, S, using Equation (6), following a collation of results from existing literature (Table 7).
Table 7.
Classification of policy depressions.
2.3.2. Entropy-Weighted Topsis Model
The entropy-weighted TOPSIS model is a multidimensional method for evaluating the overall level of village construction. Equation (7) standardizes multiple indicators affecting rural construction to harmonize disparities in indicator magnitudes (Table 8).
Table 8.
Evaluation system and weights of tourism policy and rural space indicators.
is the original value of an indicator, and are the maximum and minimum values of the indicator among the evaluation objects, and is the standardised value of the ith sample data of the secondary indicator.
The comprehensive evaluation index for rural construction serves as an aggregate measure of rural construction levels, providing a value derived by weighting and summing multiple evaluation indicators.
where S is the rural construction index (ranging from 0 to 1, with higher values indicating better rural construction), is the assigned weight for each indicator, and n is the number of indicators in the indicator system (with ).
2.3.3. Coupled Coordination Evaluation Model
The coupling coordination degree evaluation model assesses the interaction and coordination among elements within a system, reflecting the system’s overall health and stability. In this study, Equation (9) is applied to establish the binary system coupling degree model between rural spatial construction and tourism policy evaluation. To evaluate the degree of coordinated development between rural spatial construction and tourism policy evaluation, Equations (10) and (11) are employed for quantitative analysis of their interaction and coordination levels.
where C represents the coupling degree, with ; denotes the evaluation index of the rural spatial construction subsystem, and denotes the evaluation index of the tourism policy evaluation subsystem. T signifies the integrated development level of tourism policy and rural spatial construction, and D represents the degree of coupling coordination. The coefficients and are undetermined parameters, typically set to ensure equal weighting for the rural spatial construction subsystem and the tourism policy evaluation subsystem, with = = 0.50.
Following prior studies [41], the “ten-level classification method” is applied to categorize the coupling coordination degree between rural policy implementation effects and the rural spatial construction index (Table 9).
Table 9.
Classification of the degree of coordination between tourism policy and rural spatial construction.
2.3.4. Vector Autoregressive Models
The VAR model is a widely recognized statistical method for analyzing dynamic relationships in multivariate time series data. It is employed to examine dynamic relationships among endogenous variables under unconstrained conditions, evaluate the effects of random perturbations on explanatory variables, and investigate the transmission paths through which policy changes impact rural spatial evolution. This paper employs the VAR model to analyze how the tourism policy evaluation index (PMC), as the explanatory variable, affects fluctuations in the road construction (RC), site plan (SP), landscape pattern (LP), public service facilities (PSF), and architectural style (AS) under the influence of policies. The structure of the model is outlined as follows:
Y characterizes the vector of endogenous variables; A is the coefficient matrix; x is the lag order; is the residual term; and T is the number of samples.
3. Results and Analyses
3.1. Evaluation of the Effects of Rural Policy Implementation
According to Table 2 and Equations (3) and (4), values were assigned to the 20 policies, the PMC index and the policy concavity index of the policies to be evaluated were calculated, and the policies were graded according to the criteria for grading policy scores (Table 10).
Table 10.
Summary of PMC index values for the 20 policies.
When Figure 2a and Table 10 are considered, the average PMC index of the 20 selected tourism policies is calculated as 8.93, while the mean value of the policy concavity index is 1.07, indicating an acceptable level and suggesting that most policies exhibit structural and consistency strengths. Of these, eight policies fall into the “perfect” grade (Figure 2b), thirteen into the “excellent” grade, and none into the “unacceptable” or “bad” categories. The lower scores of the X3 index (0.69) and the X4 index (0.86) can be attributed primarily to deficiencies in the policies’ relevance and temporal adaptability. Similarly, low scores for the X6 and X8 indices reflect potential shortcomings in the policies’ means and incentive mechanisms.
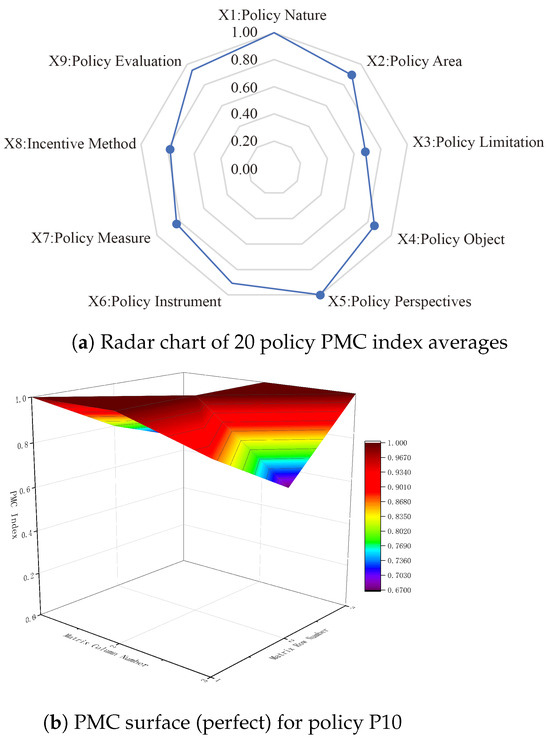
Figure 2.
Policy PMC index mean radar chart and policy PMC surface chart.
3.2. Analysis of the Degree of Coordination Between the Composite Index of Rural Construction and Tourism Policy
The coupling coordination degree between rural spatial construction and tourism policy was calculated using the aforementioned coupled coordination degree model (Table 11).
Table 11.
Scale of coupled coordination of rural spatial construction and tourism policies.
Table 11 illustrates that the coupling coordination degree between rural construction and tourism policy from 2004 to 2023 demonstrates a developmental trajectory from dissonance to coordination. The period from 2004 to 2009 represents the dissonance stage, during which the D-value rises from 0.118 to 0.546, highlighting a low level of alignment between policy effects and rural construction. In 2004, the construction of rural infrastructure commenced, but insufficient capital investment resulted in slow progress in construction levels, and the policy effects were not yet significantly apparent. The launch of the new socialist countryside construction strategy provided support for rural construction through initiatives such as agricultural tax exemptions, agricultural machinery subsidies, and new rural construction pilot programs. However, the weak foundation of rural development limited the full utilization of policy effects, resulting in a persistently low D-value and indicating a lag in policy impact. The period from 2010 to 2015 marks the coordinated transition stage, characterized by slight fluctuations in the D-value between 0.487 and 0.533, a C-value nearing 0.7, and a T-value rising to approximately 0.3. These trends indicate gradual stabilization in the policy–construction relationship and an acceleration in rural spatial development. During this stage, policy support remained robust, leading to improvements in rural infrastructure and public services. While alignment between policies and construction improved, a high degree of synergy was yet to be achieved. The period from 2016 to 2020 represents the coordinated development stage, during which C-values reached high levels (approximately 0.85–0.99), signifying substantial improvement in policy–construction alignment. The implementation of economic development and rural revitalization strategies prompted increased government focus on rural tourism resource development. Notably, the introduction of supportive policies such as the Seventeen Policies and Measures to Vigorously Promote the Development of Rural Tourism in Jilin Province (2019) significantly enhanced rural infrastructure and landscape patterns. The period from 2021 to 2023 marks the highly coordinated stage, characterized by a sharp increase in the D-value from 0.727 to 0.901 and a C-value approaching 1, demonstrating a high level of synergy between policy and construction. Policy effects on infrastructure, public services, and landscape construction were fully realized, significantly enhancing the attractiveness and sustainability of rural areas. Rural construction matured under consistent policy promotion, leading to substantial improvements in development outcomes and establishing a robust, policy-driven rural spatial development framework.
3.3. Dynamic Relationship Between Tourism Policy and Rural Development
3.3.1. ADF Stationarity Test
In the process of constructing the VAR model, due to the large difference in magnitude between different variables, we need to avoid the pseudo-regression problem caused by the original series of non-stationary variables. Firstly, the site plan, landscape pattern, road construction, architectural style, public service facilities and policy implementation effects needed to be logarithmically transformed, and log LNSP for the site plan, log LNLP for the landscape pattern, log LNRC for road construction, log LNAS for architectural style, log LNPSF for public service facilities, and log LNPMC for policy were first-order differenced before performing the ADF unit root test (Table 12). The results of the ADF test show that the statistics of the first-order differenced series of each variable are less than the critical value of 5%, indicating that these variables are smooth time series, which meets the requirements of the cointegration test.
Table 12.
Smoothness test for first-order difference variables.
3.3.2. Granger Causality Test
The causal relationship between tourism policies and the spatial evolution of rural settlements is analyzed through the use of Granger causality tests on land use planning, landscape patterns, road construction, architectural styles, and public service facilities (Table 13).
Table 13.
Granger causality test.
The results reveal that LNPMC exerts significant Granger causality over all major dimensions of rural construction. These findings suggest that policy effects serve as critical external drivers influencing the development of key elements in rural spatial construction. Furthermore, the implementation of policy measures directly impacts rural economic enhancement, infrastructure development, and public service optimization. In this context, the effective execution of policies not only facilitates multidimensional rural development but also enhances the overall attractiveness and sustainability of rural areas, contributing to a rational spatial structure.
3.3.3. Impulse Response
In studying the dynamic impact of rural tourism policies on rural space construction, the impulse response analysis reveals the time lag and stage effects in different areas of the policy implementation process (Figure 3). These results indicate that the policy has a relatively weak or negative fluctuation in the initial stage, while gradually showing a positive driving effect in the later stage, reflecting the lag and complexity of the policy effect. After a one standard deviation shock to the site plan (LNSP), the policy produces a positive impact in the initial period, but shows a slight negative fluctuation in the 2nd period due to the lag in resource allocation. This phenomenon suggests that the allocation of resources and funds at the initial stage of policy implementation is not timely, thus affecting the rationalization of land use. However, with the deepening of the policy and the improvement in the implementation efficiency, the positive impact of the policy on land use planning gradually appears from the 5th period onwards and stabilizes after the 10th period, indicating that the policy possesses a long-term facilitating effect on land use and planning. After a one standard deviation shock to the landscape pattern (LNLP), the policy initially (period 1 to 3) has a weak negative impact on the landscape pattern, mainly due to the high demand and long period of transformation of the landscape structure, which makes it difficult to show the policy effect in the short term. This is related to the cycle of landscape planning and implementation in practice. The policy shifts to a positive effect from period 4, peaks in period 5, and then stabilizes in period 8, indicating that the policy’s guidance on the landscape pattern prompted the gradual maturation of its structure to achieve sustainable optimization. After a one standard deviation shock to road construction (LNRC), the policy has a small positive push in the initial period but fluctuates negatively from period 3 to 5 due to delays in funding and infrastructure support. However, with the deepening of the policy and the acceleration of resource inflows, road construction gradually turns into a positive push after period 6, and the optimized road network significantly improves the accessibility of villages and the accessibility of tourists. This result suggests that the continuous investment of policy in road construction plays an important role in the enhancement of rural space. After a one-standard deviation shock on the aspect of architectural style (LNAS), the policy effect is more limited in the initial period, but gradually turns to negative fluctuation after the second period, which is mainly due to the fact that architectural improvement involves high cost and complex technical requirements, and the progress of the improvement is slower in the initial period. Therefore, the policy effect is not significant in the initial period. Since period 4, the positive effect of the policy on architectural landscape has increased and stabilized by period 10, indicating that rural architectural features have gradually been formed, enhancing the attractiveness of rural tourism. After a one standard deviation shock to public service facilities (LNPSF), the policy is driven by significant positivity at the beginning of policy implementation, but the policy effect fluctuates in period 2 due to the instability of resource allocation. From period 4 to 6 the policy effect stabilizes, showing the gradual improvement of public service facilities and the formation of a high-quality service system that can continuously meet the needs of tourists and residents.
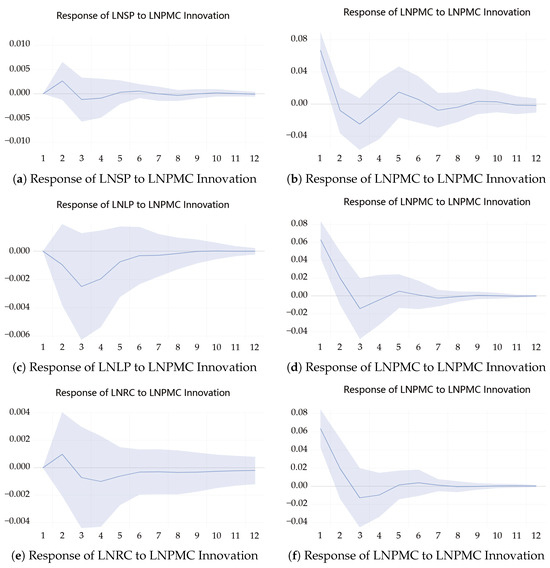
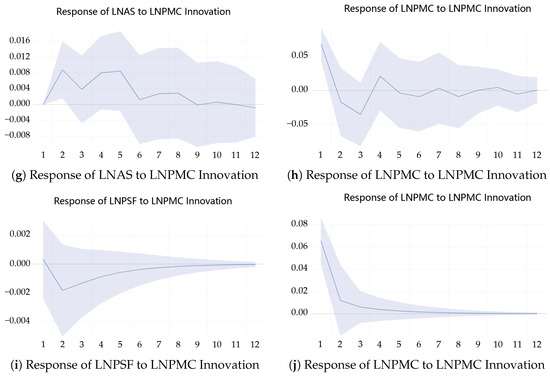
Figure 3.
(a–f): Impulse response analysis (part 1). (g–j): Impulse response analysis (part 2).
3.3.4. Variance Decomposition Analysis
Variance decomposition is used to determine the contribution of each random perturbation to the variance of the variable, enabling the assessment of tourism policies’ contributions to rural land use planning, landscape patterns, road construction, architectural styles, and public service facilities.
Table 14 demonstrates that, in terms of site planning, the initial changes are driven entirely by internal factors, with the impact of policy not yet evident. This reflects the fact that rural site planning in the early stages of policy implementation is largely influenced by the existing planning framework and infrastructure conditions, with minimal intervention from the policy. The impact of the policy begins to emerge in the second period, with its contribution to site planning reaching 7.24% by the sixth period. However, the internal driving factors of site planning remain dominant, accounting for 92.76%. After the tenth period, the impact of the policies on site planning stabilizes, maintaining at approximately 92.66%. This suggests that the cumulative effect of the policies is gradually being realized, resource allocation efficiency is continuously improving, and site planning is progressively adapting to the needs of rural tourism development. Regarding the landscape pattern, during the first period, the influence of the policy is minimal, with fluctuations in the landscape pattern entirely explained by internal factors, contributing 100% to the variance. As the lagged effects of policy implementation gradually emerge, the contribution of internal factors to the landscape pattern diminishes, stabilizing at approximately 87.63%. The policy’s effect gradually becomes evident and steadily increases, ultimately stabilizing and reaching equilibrium by the sixth period. From the seventh to the twelfth period, the policy’s influence on the landscape pattern stabilizes at approximately 12.37%. This suggests that the evolution of the landscape pattern is no longer solely driven by internal factors but is now continuously guided by the policy. The policy’s effect matures during this period. Regarding road construction, fluctuations in the early stages are solely determined by internal factors. However, as the policy is implemented, its influence gradually increases. By the sixth period, the policy’s contribution to road construction reaches 3.01%, while the contribution of internal factors remains around 96.99%. This indicates that the policy’s influence is minimal in the early stages but gradually increases and stabilizes in the middle and later stages. Despite this, the primary driving factor for road construction remains its own development. Regarding architectural landscape, the policy’s contribution rate is 0% in the initial period, indicating that, at this early stage, changes in the architectural landscape are primarily driven by established village characteristics and construction inertia, with no direct impact from the policy. In the second period, the policy’s contribution to the architectural landscape increases to 37.17%, reflecting the initial intervention of rural tourism policies in shaping the architectural landscape by promoting the renovation of characteristic buildings and offering financial support. From the third to the sixth period, the policy’s contribution to the architectural landscape steadily increases from 39.36% to 60.26%, indicating that policies gradually become the primary driving force behind changes in the architectural landscape. From the seventh to the twelfth period, the influence of policies stabilizes, and the changes in the architectural landscape enter a phase of steady development, guided primarily by policy. In terms of public service facilities, during the initial stage, changes are primarily driven by internal factors, relying on the original distribution of resources and infrastructure, with minimal impact from policies. By the second period, the policy’s contribution increases to 7.07%, indicating that the policies have begun to promote facility planning, provide financial support, and influence the construction of public service facilities. By the sixth period, the policy’s contribution increases further to 10.98%, though at a slower rate, indicating that the intervention of policies is gradually reshaping the power dynamics in facility development. By the seventh period, the policy’s contribution to public service facilities stabilizes, suggesting that the construction of these facilities has reached a stable framework.
Table 14.
Variance decomposition of LNSP, LNLP, LNRC, LNAS, and LNPSF.
To summarize, the influence of policies in the dimensions of construction within rural space has gradually increased. Figure 4 illustrates that land use planning, landscape pattern, road construction, and architectural style are predominantly influenced by intrinsic changes during the initial stage, but the regulatory influence of policies progressively increases over time. The varying degrees of policy intervention, from low to high, reflect a gradual adjustment in the prioritization of different aspects of rural development. Initial focus is placed on land-use planning, which is subsequently expanded to include landscape patterns, architectural styles, and other areas. Regarding public service facilities, the influence of tourism policies on variance reaches higher values earlier and stabilizes in later stages, indicating that policies play a pivotal role in enhancing public service infrastructure and providing foundational support for rural tourism. Overall, the impact of policies across various aspects of rural spatial construction has steadily grown. These policies have evolved from focusing on infrastructure improvement to fostering the development of intangible spatial elements, such as aesthetics and functionality. Ultimately, this systematic policy intervention fosters a rural landscape that reflects regional identity while enhancing the overall attractiveness of rural tourism. The gradual amplification of policy effects also highlights the “lagging” and “phasing” characteristics of policy implementation, underscoring the need to prioritize long-term perspectives and sustainability in rural spatial policy design to ensure the consistent realization of policy benefits.
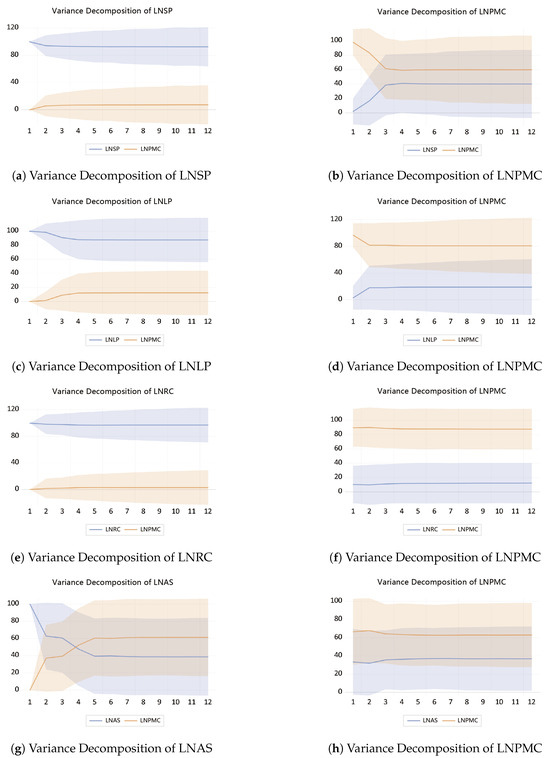
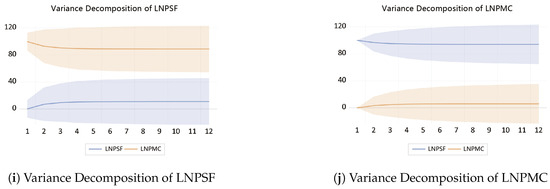
Figure 4.
(a–h): Graph of variance decomposition analysis (part 1). (i,j): Graph of variance decomposition analysis (part 2).
4. Discussion
This paper focuses on the minority villages in Yanbian Prefecture, examining the characteristics of their rural spatial evolution and the mechanisms through which policies influence this evolution. This study significantly contributes to the existing body of research on the spatial development and optimization of minority rural settlements, addressing some of the gaps in the current literature, and providing valuable insights for the development of rural tourism in China’s minority villages. The findings of this study primarily reveal two key points. Firstly, there are distinct differences in the evolution of spatial characteristics among ethnic minority settlements. Secondly, there are significant variations in the impact of policies on different dimensions of rural space at various stages. This also necessitates the promotion of rural tourism in a manner that optimizes rural space while respecting and protecting national culture.
4.1. Characteristics of Spatial Evolution of Ethnic Minority Villages
Existing studies have primarily focused on exploring the evolution of policies regarding the spatial and temporal patterns of typical villages, such as urban and traditional villages, and describing their development processes in a comprehensive and systematic manner [15,16,17,18,19,20]. However, most of these studies focus on plain areas with convenient transportation and stronger economic foundations, where the impact of policies on spatial construction tends to be more direct and rapid [42]. In contrast, the exploration of the policy lag and time delay of its effects remains insufficient. Based on existing research on ethnic minority space [43], this paper explores, in depth, the evolutionary characteristics of rural space in ethnic minority areas. The results of the study show that, first, Yanbian minority villages are predominantly located in mountainous areas with limited transportation accessibility. This geographical limitation may have exacerbated the policy lag effect during the early stages of policy implementation. Compared with villages in the plains, minority villages require greater infrastructure investment to fully realize their tourism potential. Second, ethnic minority villages serve as significant attractions for rural tourism due to their unique ethnic cultures and traditions. The development of such cultural resources requires striking a balance between preservation and utilization, and the relevance and sustainability of the policy are crucial. Finally, ethnic minority villages possess relatively weak economic foundations and low-income levels, making them more reliant on policy support than the autonomous development capabilities of villages in the plains. These factors collectively contribute to the more pronounced stage and lag effects of policies in Yanbian’s minority villages. This finding aligns with Ding’s [44] research on the factors influencing tourism development in minority villages, further emphasizing the profound impact of geographic, economic, and policy factors on the spatial evolution of these villages. A complex interaction mechanism exists between tourism policy and the construction of ethnic minority village spaces, where the role of policy is not only directly influential but also characterized by its lag effects and stage-dependent characteristics. This paper constructs a dual evaluation index system for tourism policy and rural space construction, revealing the ‘lagging’ effect of policy on the development of ethnic minority rural spaces and highlighting the chronological and regional adaptability of policy implementation. It provides a theoretical foundation and decision-making guidance for future policy design and planning in ethnic minority rural construction.
4.2. Multidimensional Influence Mechanism of Tourism Policies on Ethnic Minority Rural Spaces
This paper systematically investigates the dynamic role of tourism-based policies in the construction of rural spaces through a combination of theoretical frameworks and empirical analysis. The study reveals that policies have had varying degrees of influence on rural areas, particularly in land use planning, landscape patterns, road construction, architectural styles, and public service facilities. These findings align with those of Duan Jin et al. [45], suggesting that policies play a crucial role in the evolution of rural spatial patterns. However, in comparison with general rural development policies, rural tourism policies exhibit a more significant focus on landscape patterns, architectural styles, and public service facilities, while general policies exert a stronger influence on land use planning and road construction.
First, rural tourism policies have a more significant impact on landscape patterns. Through policy guidance and financial support, the natural and cultural landscapes of rural areas have been effectively developed, thereby promoting the optimization of the landscape pattern and enhancing the rural environment. The aim of policy guidance is to integrate the development of tourism resources with ecological and environmental protection to foster the sustainable development of rural areas. Second, rural tourism policies have a greater impact on architectural style, particularly in tourism-oriented villages. These policies encourage the integration of architecture with local cultural characteristics, enhancing the tourist experience and the cultural appeal of rural areas through architectural renovations and upgrades. Third, the impact of rural tourism policies on public service facilities exhibits a stable and progressive effect. As rural tourism develops, these policies have facilitated the construction and improvement of public facilities through financial subsidies, program support, and other means. In the early stages of policy implementation, particularly in infrastructure construction, government support is more substantial, thereby laying the foundation for the continued development of rural space. Compared with rural tourism policies, general rural development measures focus more on addressing land use changes [46,47], road construction, and other aspects of spatial planning. These policies primarily aim to optimize the allocation of rural land resources, plan land use rationally, and address the issue of the efficient layout of productive land. Simultaneously, the focus on landscape patterns is primarily on ecological and environmental protection [48], with less emphasis on the development of cultural landscapes. Regarding architectural landscapes, general rural development measures prioritize the standardization, livability, and environmental protection of residential houses [49], with less guidance on architectural design. Additionally, regarding public service facilities, general rural development measures emphasize the expansion and improvement of infrastructure, particularly in remote villages, focusing more on the provision of basic services and less on the construction of cultural and tourism-related facilities.
4.3. Limitations of the Application of the Research Model
As a quantitative evaluation tool, the PMC index model effectively analyzes the consistency and implementation impacts of measures in policy documents. However, despite the model’s clear advantages in quantitatively assessing the scores of variables in policy texts and identifying the strengths and weaknesses of policy implementation, it has certain limitations. These limitations stem from the fact that some assumptions and operational methods may fail to fully capture the actual impacts of policies when measuring their effects. First, the core of PMC model quantification does not directly assess the physical impact of policy measures (such as specific support, financial input, project implementation), but instead evaluates the potential impact of policies by analyzing key terms, frequency of expression, and the policy framework in the documents. This approach emphasizes the structure of the policy text, including its consistency, comprehensiveness, and systematic presentation, thereby quantifying the theoretical impact of the policy. However, this quantitative approach does not reflect the specific strength of support or the actual effects of policy measures during implementation. As a result, the quantitative results of the PMC index may deviate from the actual policy implementation effects, particularly in complex contexts where there is a significant discrepancy between the intentions expressed in the policy text and the results of implementation. Second, the PMC model may fail to fully account for the time-lag effect of policy implementation in its quantitative analysis at various stages. The effects of policies are often not immediately apparent, particularly in comprehensive policies such as rural tourism, which encompass multiple fields and exhibit delayed impacts. Therefore, the PMC model primarily quantifies potential impacts based on the policy text but fails to fully capture the time-lag effects encountered during implementation and their actual impact on the spatial evolution of rural areas. This limitation results in the model’s inadequacy in reflecting the long-term effects of policies post-implementation, especially in regions such as ethnic minority villages, where the lag effect may be more pronounced and the persistence and far-reaching impacts are difficult to capture through a single textual quantification method.
5. Conclusions
This study employs the PMC and VAR models to thoroughly explore the impact of tourism policies on the spatial evolution of ethnic minority villages, revealing the dynamic mechanisms of policy implementation on rural space construction. The results indicate that, initially, in ethnic minority villages, the spatial geographic characteristics and various constraints cause the policy to be delayed or even result in negative fluctuations, highlighting a significant lag effect in the implementation of rural policies. Secondly, a significant Granger causality exists between tourism policy and rural spatial construction, with differentiated impacts across various dimensions. Tourism policy initially exerts a negative impact on rural spatial construction, but transitions to a positive driving effect as infrastructure improves. In terms of landscape pattern, architectural style, and the construction of public service facilities, tourism policy has a more significant driving effect on these aspects. Conversely, its impact on land use planning and road construction is more limited, likely due to the policy’s initial focus on improving the overall appearance of villages and developing tourism functions. Overall, factors such as the lag in policy implementation and spatial heterogeneity play a crucial role in the process of rural spatial evolution.
Although this paper effectively analyzes the dynamic effects of rural tourism policies using the PMC index model and VAR model, the study does have some limitations. The time span and precision limitations of the research data may affect the accuracy of the model analysis, particularly because local adjustment strategies during the policy implementation process were not fully included in the analysis. To address these limitations, future research should prioritize improving data precision by incorporating longer time spans and high-resolution spatial data, which will enable a more comprehensive assessment of the long-term impact of tourism policies on rural space. Furthermore, further exploration of how different types of tourism policies function at various stages—particularly the micro-behavioral dynamics of these policies—will be an important area for future research. Future research should also place greater emphasis on the localization and precision of policy design. An in-depth understanding of the specific needs of rural areas, combined with detailed micro-level analysis, can provide a scientific basis for developing more targeted rural tourism policies, thus promoting the sustainable development of rural spaces. This study not only provides empirical support for the formulation and implementation of rural tourism policies but also offers theoretical insights for future research directions and policy optimization. By further exploring the time lag, complexity, and local adaptability of policy effects, this research can provide more precise policy recommendations for the high-quality development of rural tourism.
Author Contributions
Conceptualization, Y.Z. and W.X.; methodology, L.D.; software, W.X.; validation, W.X., L.D. and Y.Z.; formal analysis, W.X.; investigation, W.X.; resources, W.X.; data curation, W.X.; writing—original draft preparation, W.X.; writing—review and editing, Y.Z.; visualization, W.X.; supervision, L.D.; project administration, Y.Z.; funding acquisition, Y.Z. All authors have read and agreed to the published version of the manuscript.
Funding
This research was funded by National Natural Science Foundation of China [grant number: 52078094], and Humanities and Social Science Fund of Ministry of Education [grant number: 21YJCZH021].
Data Availability Statement
Data are contained within the article.
Conflicts of Interest
The authors declare no conflicts of interest.
References
- Woods, M. Rural Geography: Processes, Responses and Experiences in Rural Restructuring; SAGE Publications: Thousand Oaks, CA, USA, 2004; 352p. [Google Scholar]
- Hedlund, M.; Lundholm, E. Restructuring of rural Sweden—Employment transition and out-migration of three cohorts born 1945–1980. J. Rural Stud. 2015, 42, 123–132. [Google Scholar] [CrossRef]
- Paniagua, Á. Urban-rural migration, tourism entrepreneurs and rural restructuring in Spain. Tour. Geogr. 2002, 4, 349–371. [Google Scholar] [CrossRef]
- Kohl, J.G. Der Verkehr und die Ansiedlungen der Menschen in ihrer Abhängigkeit von der Gestaltung der Erdoberfläche; Arnoldische Buchhandlung: Dresden, Germany, 1841. [Google Scholar]
- Demangeon, A. Human Geography Problems; Ge, Y., Translator; Commercial Press: Beijing, China, 1993. [Google Scholar]
- Brunhes, J. Humanistic Geography; Zhongshan Bookstore: Taipei City, Taiwan, 1935; pp. 3–32. [Google Scholar]
- Cater, J.; Jones, T. Social Geography: An Introduction to Contemporary Issues; Wiley: Hoboken, NJ, USA, 1989. [Google Scholar]
- Palmer, E. Planned relocation of severely depopulated rural settlements: A case study from Japan. J. Rural Stud. 1988, 4, 21–34. [Google Scholar] [CrossRef]
- Song, W.; Li, H. Spatial pattern evolution of rural settlements from 1961 to 2030 in Tongzhou District, China. Land Use Policy 2020, 99, 105044. [Google Scholar] [CrossRef]
- Zhou, G.; He, Y.; Tang, C.; Yu, T.; Xiao, G.; Zhong, T. Dynamic mechanism and present situation of rural settlement evolution in China. J. Geogr. Sci. 2013, 23, 513–524. [Google Scholar] [CrossRef]
- Li, H.; Song, W. Pattern of spatial evolution of rural settlements in the Jizhou District of China during 1962–2030. Appl. Geogr. 2020, 122, 102247. [Google Scholar] [CrossRef]
- Liu, Y.; Ye, Q.; Li, J.; Kong, X.; Jiao, L. Suitability evaluation of rural settlements based on accessibility of production and living: A case study of Tingzu Town in Hubei Province of China. Chin. Geogr. Sci. 2016, 26, 550–565. [Google Scholar] [CrossRef]
- Song, X.Y.; Li, R.J.; Fu, X.Q.; Zhang, J.H. The spatial pattern evolution and driving mechanism analysis of Yuxian rural settlements based on GIS. Hum. Geogr. 2015, 30, 79–84. [Google Scholar]
- Yanbo, Q.; Guanghui, J.; Wenqiu, M.; Zitong, L. How does the rural settlement transition contribute to shaping sustainable rural development? Evidence from Shandong, China. J. Rural Stud. 2021, 82, 279–293. [Google Scholar] [CrossRef]
- Wang, Y.; Li, G.B. Functional transformation and spatial restructuring of rural settlements in southern Jiangsu: A case study of Suzhou. City Plan. Rev. 2011, 35, 54–60. [Google Scholar]
- Tu, S.; Long, H.; Zhang, Y.; Ge, D.; Qu, Y. Rural restructuring at village level under rapid urbanization in metropolitan suburbs of China and its implications for innovations in land use policy. Habitat Int. 2018, 77, 143–152. [Google Scholar] [CrossRef]
- Gao, H.; Zhang, J.; Luo, Z. Renaissance or alienation? Spatial transformation of rural space of metropolis fringe area driven by consumer culture: Empirical observation on Dashan Village of Gaochun International Slow City. Urban Plan. Int. 2014, 29, 68–73. [Google Scholar]
- Liu, Y.; Liu, Y.; Chen, Y.; Long, H. The process and driving forces of rural hollowing in China under rapid urbanization. J. Geogr. Sci. 2010, 20, 876–888. [Google Scholar] [CrossRef]
- Zhang, M.; Shen, C.; Gu, W.; Chen, Q. Identification of Traditional Village Aggregation Areas from the Perspective of Historic Layering: Evidence from Hilly Regions in Zhejiang Province, China. Land 2023, 12, 2088. [Google Scholar] [CrossRef]
- Xi, J.-C.; Wang, S.-K.; Zhang, R.-Y. Restructuring and Optimizing Production-Living-Ecology Space in Rural Settlements–A Case Study of Gougezhuang Village at Yesanpo Tourism Attraction in Hebei Province. J. Nat. Resour. 2016, 31, 425–435. [Google Scholar]
- Teka, K.; Van Rompaey, A.; Poesen, J. Assessing the role of policies on land use change and agricultural development since 1960s in northern Ethiopia. Land Use Policy 2013, 30, 944–951. [Google Scholar] [CrossRef]
- Munteanu, C.; Kuemmerle, T.; Boltiziar, M.; Lieskovskỳ, J.; Mojses, M.; Kaim, D.; Konkoly-Gyuró, É.; Mackovčin, P.; Muller, D.; Ostapowicz, K.; et al. Nineteenth-century land-use legacies affect contemporary land abandonment in the Carpathians. Reg. Environ. Chang. 2017, 17, 2209–2222. [Google Scholar] [CrossRef]
- Wang, J.; Lin, Y.; Glendinning, A.; Xu, Y. Land-use changes and land policies evolution in China’s urbanization processes. Land Use Policy 2018, 75, 375–387. [Google Scholar] [CrossRef]
- Yin, Z.; Xia, Z.; Tang, Y.; Liu, H. Spatial Pattern Evolution and Optimal Regulation of Rural Tourist Spots in Urban Agglomerations-A Case Study of Chang-Zhu-Tan Urban Agglomeration. Econ. Geogr. 2021, 41, 214–224. [Google Scholar]
- Qin, X.; Du, X.; Wang, Y.; Liu, L. Spatial Evolution Analysis and Spatial Optimization Strategy of Rural Tourism Based on Spatial Syntax Model—A Case Study of Matao Village in Shandong Province, China. Land 2023, 12, 317. [Google Scholar] [CrossRef]
- Zinda, J.A. China’s Disappearing Countryside: Towards Sustainable Land Governance for the Poor; Taylor & Francis: Abingdon, UK, 2014. [Google Scholar]
- Huang, Z.-F.; Zhang, Y.-G.; Jia, W.-T.; Hong, X.-T.; Yu, R.-Z. The research process and trend of development in the New Era of rural tourism in China. J. Nat. Resour. 2021, 36, 2615–2633. [Google Scholar] [CrossRef]
- Estrada, M.A.R. Policy modeling: Definition, classification and evaluation. J. Policy Model. 2011, 33, 523–536. [Google Scholar] [CrossRef]
- Zhang, Y.A.; Geng, Z. The quantitative evaluation of regional science and technology innovation policy: Based on the index of PMC model. Sci. Technol. Manag. Res. 2015, 14, 26–31. [Google Scholar]
- Zhang, Y.; Qie, H. Quantitative evaluation innovation policies of the state council—Based on the PMC-index model. Sci. Technol. Prog. Policy 2017, 34, 127–136. [Google Scholar]
- Kuang, B.; Han, J.; Lu, X.; Zhang, X.; Fan, X. Quantitative evaluation of China’s cultivated land protection policies based on the PMC-Index model. Land Use Policy 2020, 99, 105062. [Google Scholar] [CrossRef]
- Dai, S.; Zhang, W.; Lan, L. Quantitative evaluation of China’s ecological protection compensation policy based on PMC index model. Int. J. Environ. Res. Public Health 2022, 19, 10227. [Google Scholar] [CrossRef] [PubMed]
- Shi, P.F.; Ming, Q.Z.; Han, J.L.; Luo, D.S. A comprehensive quantitative evaluation and comparative study of border tourism policies based on the PMC index model—A case study of Guangxi and Inner Mongolia Autonomous Regions. Areal Res. Dev. 2020, 9, 91–97. [Google Scholar]
- Zheng, S.; Lam, C.-M.; Hsu, S.-C.; Ren, J. Evaluating efficiency of energy conservation measures in energy service companies in China. Energy Policy 2018, 122, 580–591. [Google Scholar] [CrossRef]
- Pavić, Z.; Novoselac, V. Notes on TOPSIS method. Int. J. Res. Eng. Sci. 2013, 1, 5–12. [Google Scholar]
- Wang, S.-J.; Kong, W.; Ren, L.; Zhi, D. Research on misuses and modification of coupling coordination degree model in China. J. Nat. Resour. 2021, 36, 793–810. [Google Scholar] [CrossRef]
- Stock, J.H.; Watson, M.W. Vector autoregressions. J. Econ. Perspect. 2001, 15, 101–115. [Google Scholar] [CrossRef]
- Yang, J.; Huang, X. 30 m annual land cover and its dynamics in China from 1990 to 2019. Earth Syst. Sci. Data Discuss. 2021, 2021, 1–29. [Google Scholar]
- Dai, S.; Zhang, W.; Zong, J.; Wang, Y.; Wang, G. How effective is the green development policy of China’s Yangtze River Economic Belt? A quantitative evaluation based on the PMC-index model. Int. J. Environ. Res. Public Health 2021, 18, 7676. [Google Scholar] [CrossRef] [PubMed]
- Wang, B.; Xing, Q. Evaluation of the wind power industry policy in China (2010–2021): A quantitative analysis based on the PMC Index Model. Energies 2022, 15, 8176. [Google Scholar] [CrossRef]
- Dong, W.; Wang, C.; Zhang, Z. The space-time coupling between rural revitalization strategy and rural tourism development in Shandong Province. Sci. Geogr. Sin. 2020, 40, 628–636. [Google Scholar]
- Lu, Y.; Song, W.; Lyu, Q. Assessing the effects of the new-type urbanization policy on rural settlement evolution using a multi-agent model. Habitat Int. 2022, 127, 102622. [Google Scholar] [CrossRef]
- Zhang, X.; Zhou, L.; Zhou, T. Quantitative analysis of spatial gene in traditional villages: A case study of Korean traditional villages in Northeast China. J. Asian Archit. Build. Eng. 2024, 1, 1–12. [Google Scholar] [CrossRef]
- Ding, J.; Peng, H. An analysis of the influential factors to the exploitation of national tourism. Econ. Geogr. 2002, 1, 101–105. [Google Scholar]
- Duan, J.; Zhang, G. The Evolution of Contemporary Village Spatial Patterns under Policy Orientation: A Report on the Field Survey of Wuxi Countryside. J. Urban Plan. 2015, 02, 65–71. [Google Scholar]
- Deng, J.S.; Wang, K.; Hong, Y.; Qi, J.G. Spatio-temporal dynamics and evolution of land use change and landscape pattern in response to rapid urbanization. Landsc. Urban Plan. 2009, 92, 187–198. [Google Scholar] [CrossRef]
- Long, H.L.; Li, Y.R.; Liu, Y.S. Analysis of evolutive characteristics and their driving mechanism of hollowing villages in China. Acta Geogr. Sin. 2009, 64, 1203–1213. [Google Scholar]
- Gao, P.; Yang, C.; Liu, Y.; Xin, G.; Chen, R. Evaluating the effect of comprehensive land consolidation on spatial reconstruction of rural production, living, and ecological spaces. Ecol. Indic. 2024, 168, 112785. [Google Scholar] [CrossRef]
- Fan, B. The Connotation and Practical Characteristics of the Intensive Use of Construction Land under the Policy Influence in China. Shanghai Urban Plan. Rev. 2015, 4, 81–86. [Google Scholar]
Disclaimer/Publisher’s Note: The statements, opinions and data contained in all publications are solely those of the individual author(s) and contributor(s) and not of MDPI and/or the editor(s). MDPI and/or the editor(s) disclaim responsibility for any injury to people or property resulting from any ideas, methods, instructions or products referred to in the content. |
© 2024 by the authors. Licensee MDPI, Basel, Switzerland. This article is an open access article distributed under the terms and conditions of the Creative Commons Attribution (CC BY) license (https://creativecommons.org/licenses/by/4.0/).