Abstract
Sustainable soil management is increasingly recognized as essential for crop health, productivity, and resilience, especially in vineyard ecosystems. Within the B-Wine project, biochar was evaluated as a soil amendment to improve physicochemical properties, water availability, plant eco-physiological functions, and yield. The trial was carried out in one growing season, one year after biochar application (16 t ha−1 fresh weight ≈ 10.4 t ha−1 dry weight) on three organically managed vineyards in the Chianti Classico region (Tuscany, Italy), integrating soil parameters (e.g., organic carbon content, soil moisture, saturated hydraulic conductivity, bulk density) and eco-physiological measurement (e.g., leaf water content, photosynthetic performance) with remote-sensing analysis of multispectral Sentinel-2 level-2A imagery from the Copernicus program and soil spectral measurements. Results indicated that biochar significantly improved key soil properties, although the magnitude of these improvements varied according to soil characteristics. Bulk density decreased by 5–16%, while soil organic carbon increase differed in the three sites, being nearly 50% in the medium-to-fine textured soils and exceeding 200% in the coarse-textured soil. The impact of biochar on saturated hydraulic conductivity varied depending on the soil, the type of biochar, and the moisture conditions. However, it improved the water balance of the vines and yield. Considering all three vineyard sites, the average yield increase was approximately 42%. However, this result was largely driven by pronounced responses at two sites, while the third showed no measurable increase, likely due to site-specific differences in soil properties and climatic conditions. Overall, biochar proved to be an effective, soil-dependent strategy for enhancing vineyard resilience, plant performance, and productivity under challenging conditions.
1. Introduction
Climate change represents one of the main environmental threats of the 21st century, with both direct and indirect impacts on numerous productive sectors, including agriculture and viticulture [1]. The increase in global temperatures, changes in rainfall patterns, and rise in the frequency of extreme weather events have profoundly transformed the ecological and productive dynamics of vineyards worldwide [2,3]. Grapevines, which are perennial crops that are closely tied to local climatic conditions, are particularly sensitive to these changes. Numerous studies have shown that global warming has already led to phenological shifts, changes in grape composition (sugar content, acidity, and aromatic compounds), and variations in the final quality of wine. At the same time, viticultural areas are shifting toward higher latitudes and altitudes, challenging the stability of regions historically dedicated to wine production [2,4,5].
In Italy, one of the world’s leading wine producers, the effects of climate change are already tangible [6]. Major Italian wine regions, such as Tuscany, are facing new challenges related to water stress, heatwaves, and extreme weather events, all of which affect productivity and the typicity of wines [7]. Chianti DOCG (Denomination of Controlled and Guaranteed Origin) wine is one of the most important high-quality wines produced in Tuscany. The area encompasses the districts from Siena to Florence near 43.5° N of latitude to 10–12° E of longitude. The main grape variety is Sangiovese, which represents 80 to 100% of grape varieties in Chianti wine. Therefore, it is important to understand how this grape variety responds to climate changes to understand future conditions and to be able to apply new strategies for wine production [8]. In recent years, this region has shown an increasing commitment to sustainable farming practices, with a growing number of wineries adopting organic methods [9].
The production regulations for Chianti Classico DOCG set precise rules for viticulture in the area. Specifically, Article 4 prohibits any form of forcing, but allows for emergency irrigation—that is, irrigation is limited to emergency situations to safeguard production. This restriction is particularly relevant for organic farms, which must face the challenges of climate change, such as rising temperatures and decreasing rainfall, without resorting to intensive irrigation practices.
Soil plays a pivotal role in mediating vineyard resilience to climatic stresses. Its physical, chemical, and biological properties strongly affect vine physiology, productivity, and grape quality. In Mediterranean viticultural regions, where summer droughts are becoming increasingly frequent and intense, improving soil structure and water-holding capacity has become a priority for sustaining vine performance. In this context, biochar has emerged as a promising soil amendment. When incorporated into the root zone, it enhances soil porosity and aggregation, increases water retention and infiltration, and buffers fluctuations in moisture dynamics. These effects are particularly relevant under conditions of limited water availability, typical of the Chianti Classico area, where biochar has been shown to mitigate water stress by extending the availability of soil water reserves and supporting vine physiological functions during critical phenological stages [10,11,12].
Biochar application can enhance soil water retention, but its effectiveness is strongly soil-dependent, varying with texture and structure. For instance, biochar tends to reduce hydraulic conductivity in sandy soils, while it may increase it in fine-textured soils, reflecting the soil-specific nature of its effects [13]. In medium-textured soils, biochar promotes the formation of larger aggregates from microaggregates, reducing micropore fractions and increasing mesopore content, thereby improving water availability for plant roots and delaying wilting [14,15].
In addition, biochar contributes to long-term carbon sequestration [16], enhances nutrient availability, and supports soil microbial activity [17]. However, evaluating biochar across diverse soil types is essential to inform target soil management practices, and for this purpose, affordable, reliable and timely monitoring approaches are crucial to assess its impact, optimize site-specific applications, and support carbon credit strategies by quantifying carbon sequestration [18]. In this framework, NIR soil spectroscopy has proven effective in predicting various soil properties both by proximal and remote sensing approaches. However, the addition of biochar in the soil leads to strong changes in the soil spectral response and shape, making the exploitation of the NIR soil spectroscopy hard for implementing soil properties prediction models, unless specific models calibrated on soil-biochar mixtures are used [19].
Recent developments in satellite-based and proximal monitoring further expand opportunities for sustainable vineyard management. High- and very-high-resolution imagery, combined with UAV platforms, allows accurate detection of spatial and temporal variability in vegetation vigor, water status, and vine health. In Italy, Sentinel-2 data have proven effective for long-term vineyard monitoring, capturing spectral variability influenced by latitude, topography, and vineyard structure [20].
This study, conducted as part of the B-Wine project (biochar for increasing soil fertility and improving wine production), (2022–2024), funded by the Rural Development Program (PSR project sub-measure 16.2), of the Tuscany Region, investigates the effects of biochar on soils with distinct physicochemical properties, within a coherent viticultural and cropping context. The research combines remote sensing techniques to assess intrinsic vineyard variability to build a robust experimental design. Conventional soil analyses with plant eco-physiological measurements were used to evaluate the effects of biochar and to explore the potential of proximal sensing techniques as rapid and efficient tools to evaluate soil carbon sequestration.
The evaluation was carried out over one growing season, one year after biochar application, in three organically managed vineyards in Chianti Classico. The study combined Sentinel-2 Level-2A multispectral imagery from the Copernicus Programme to delineate control and biochar-treated parcels, along with soil characterization, soil spectral measurements, and vine eco-physiological assessments. The study aims to provide a comprehensive understanding of biochar’s influence on soil-plant interactions and vineyard performance under Mediterranean conditions, while exploring innovative approaches for monitoring its effects in the viticultural context.
2. Materials and Methods
2.1. Study Area and Experimental Sites
The study began in 2023 with the application of biochar (April 2023) in three vineyards located in the Chianti Classico region of Tuscany, Italy (Figure 1), and the measurements were conducted in 2024, one year after biochar incorporation. The Chianti Classico has an area of 71,800 ha, of which 15,500 is vineyards and 45,000 is woodlands.
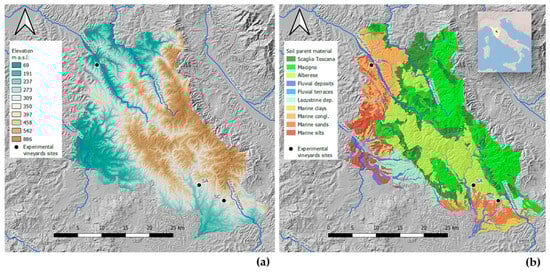
Figure 1.
Study area: location of the three experimental vineyard sites in the Chianti Classico area in Tuscany with (a) elevation and (b) soil parent materials.
Monti del Chianti is a NW–SE oriented hill and mountain chain in Tuscany parallel to the Apennines. Elevations typically range between 400 and 600 m (Figure 1), with the peak at Monte San Michele (893 m). This ridge tectonically divides two major Plio-Pleistocene sedimentary basins: Valdelsa-Siena to the west and Valdarno-Valdichiana to the east. The area formed during the Alpine–Apennine orogeny due to convergence between the African and European Plates and consists of superimposed tectonic units derived from the ancient Ligurian–Piedmontese Sea. The most relevant are (a) the Ligurian Unit, composed of oceanic mafic to ultramafic rocks overlain by clayey-carbonate turbidites; and (b) the Tuscan Unit, mainly consisting of carbonates, evaporites, marls, and sandstones (including the Macigno del Chianti sandstone). Later extensional tectonics during the Miocene led to the formation of basins and uplifts, followed by marine and continental sedimentation during the Pliocene, and subsequent uplift and fluvial erosion.
Five main pedolandscapes with distinct soil types were identified based on the dominant parent material (Figure 1):
Calcareous Flysch (Alberese): Predominantly shallow, gravelly soils developed on clayey–calcareous substrates, covering about 35% of the area. Textures range from loam to clay loam, with high calcium carbonate content. According to WRB, soils are mainly Calcaric Cambisols, Leptosols, and Regosols.
Sandstone (Macigno del Chianti): Poorly developed, stony soils on feldspathic sandstone, extending over 25% of the area. They exhibit sandy or sandy loam textures and very low carbonate content. Dominant WRB classes are Eutric Regosols, Cambisols, and Cutanic Luvisols.
Pelagic Deposits (Scaglia Toscana): Shallow soils formed on clayey marls or calcareous sandstones, covering about 15% of the area. Textures vary from loam to clay, with moderate-to-high carbonate levels. Dominant WRB soil types are Calcaric Cambisols, Regosols, and Stagnic Cambisols.
Marine Deposits: Developed on Pliocene marine sands and gravelly sands, covering 18% of the area. These soils have sandy loam to clay loam textures and medium carbonate content. WRB classifications include Calcaric Regosols, Arenosols, Cambisols, and Luvisols.
Fluvial Terraces: Occurring on ancient Pliocene–Quaternary fluvial deposits, with loam to clay textures and generally medium-to-high carbonate content. Main WRB classifications are Calcaric Fluvisols, Cambisols, and Luvisols.
These soil types reflect the area’s complex geological evolution, with systematic variations in calcium carbonate, texture, and coarse fragment content, which strongly influence their agricultural suitability, particularly for viticulture in the Chianti Classico region. The three vineyards were selected for their contrasting pedological characteristics (Table 1), while maintaining comparable vineyard typology, grape variety (Sangiovese), and management practices—allowing for focused evaluation of soil-dependent responses to biochar under consistent viticultural conditions (Table 1).

Table 1.
Location and soil characteristics of the three experimental vineyards in the Chianti area. Soil textural data were derived from the Soil Catalogue of Tuscany [21].
At the Badia a Coltibuono (SA) site, soils formed on marly limestones, are deeper, strongly calcareous, and finer-textured (silty clay loam to clay) with high coarse fragment content, good drainage, and an estimated available water capacity (AWC) of 143.4 mm·m−1.
At the Corzano e Paterno (SB) site in northwestern Chianti, soils are moderately deep, developed on lacustrine conglomerates and polygenic pebbles, with loamy–skeletal texture, high stone content, medium-to-high calcium carbonate, and good drainage. The estimated AWC is 117.8 mm·m−1.
At the Fèlsina (SC) site, in the southernmost site, soils have sandy loam to loamy sand textures, derived from marine sands and polygenic conglomerates, with medium-to-high calcium carbonate content, good drainage, and low estimated AWC (<60 mm·m−1).
According to data from the nearest meteorological station (Gaiole in Chianti) [23], the study area has a typical Mediterranean climate, with a mean annual temperature of 16.5 °C and total annual precipitation of 1019 mm yr−1. July and August are the hottest and driest months, with average temperatures of 24.2 °C and 25.6 °C and monthly precipitation of 4 mm and 34 mm, respectively.
The experimental design in each vineyard consisted of two parcels: one amended with biochar (B) and one unamended control (C). To ensure parcel comparability, preliminary remote sensing analysis was conducted to delineate B and C parcels. Sentinel-2 Level-2A multispectral imagery from the Copernicus Programme was processed to assess within-field vegetation variability. Images from the pre-harvest period of the previous growing season (early September 2022) were selected, identified by vineyard managers as the most representative of canopy vigor patterns. Image processing was conducted using QGIS [24]. The Normalized Difference Vegetation Index (NDVI) was calculated using the standard formula NDVI = (NIR − Red)/(NIR + Red). NIR and red bands are, respectively, Sentinel-2 B8 (central wavelength ~842 nm) and B4 (central wavelength ~665 nm) bands, both at 10 m resolution. NDVI values were then classified into two quantile-based classes (low and high vigor). These maps at 10 m resolution provided an objective basis for selecting experimental parcels, ensuring that both treatment and C areas, one close to the other, contained comparable vigor classes. This approach enabled the identification of “twin” parcel, reducing the influence of geomorphological and pedological constraints, soil water availability, nutrient gradients, and microclimatic variability. Parcel sizes were approximately 0.5 ha in the SA and SB vineyards, and 1 ha at SC. Parcel boundaries were exported as polygon shapefiles and georeferenced in the field before treatment application.
Biochar was applied in April 2023 at a rate of 16 t ha−1 (fresh weight) to inter-row areas using a spreader and mechanically incorporated into the soil to a depth of 30 cm using a chisel plow tiller. This application rate was selected in accordance with the Guidelines on Practical Aspects of Biochar Application to Field Soil in Various Soil Management Systems [25], which identify this rate as a moderate, field-realistic application level within the range commonly tested in previous studies and well below excessively high rates reported to negatively affect crop performance. This rate is also consistent with agronomic recommendations for soil improvement in Mediterranean viticulture [26]. With a biochar moisture content of 35%, the dry matter application rate was approximately 10.4 t ha−1. During the biochar incorporation phase, all parcels—regardless of whether biochar was applied—were tilled to a depth of 30 cm using the same chisel plow tiller. This experimental choice was intentionally made to minimize, as much as possible, the variability arising from soil disturbance and biochar incorporation processes, and to ensure comparable initial soil conditions between treatments.
The biochar used was a commercial product, supplied by Romagna Carbone (Ravenna, Italy), that had already been used in experiments in vineyards in Tuscany. It was obtained from orchard pruning biomass through a slow pyrolysis process at a temperature of 500 °C in a transportable ring kiln with a diameter of 2.2 m and a capacity of approximately 2 tons of raw material [12]. Most of the biochar applied to the soil consisted of particles smaller than 1 cm (≈70%). The product had a polycyclic aromatic hydrocarbon (PAH) content below 4 mg·kg−1, in compliance with Italian agricultural regulations. The chemical and physical characteristics of the biochar are summarized in Table 2.
Table 2.
Chemical and physical characteristics of the pure biochar applied in the field experiment. CEC: cation exchange capacity; BET: Brunauer–Emmett–Telle; PAHs: polycyclic aromatic hydrocarbons; EPA: Environmental Protection Agency; d.m: dry matter.
2.2. Soil Sampling and Analysis
Within each parcel for each vineyard, three sub-parcels were selected and used as internal replicates for every sampling and analysis, in order to capture spatial variability within the treated area. In July 2024, soil sampling was carried out in all vineyards, both in the control and biochar-treated parcels, to assess the impact of biochar on selected soil properties. A total of 18 soil cores (0-15 cm; 9 samples per treatment) were randomly collected and composited to obtain one representative sample per sub-parcel. This sampling depth corresponds to the soil layer most directly affected by biochar incorporation; however, this depth does not capture all the potential effects of biochar application, which take place in the deeper soil layers reached by vine roots during periods of high stress. Composite samples were transported to the laboratory, sieved to 2 mm, and prepared for chemical analysis. Soil pH was measured in water solution (1:2.5 ratio) using a pH meter. The total organic carbon (TOC) was measured using the method of Walkley and Black [27], whereas the total N and C were determined using a CHN-S Flash E1112 elemental analyzer (Thermo Finnigan, Waltham, MA, USA), according to the standard method ISO 10694 [28]. The calcium carbonate (CaCO3) content was determined using the volumetric (calcimetric) method according to UNI EN ISO 10693:2014 [29]. Soil samples were oven-dried at 105 °C and sieved to <2 mm. A known excess of 1 N hydrochloric acid (HCl) was added to each sample, and the carbon dioxide (CO2) released by the reaction with carbonates was measured volumetrically using a Bernard calcimeter (Gabbrielli Technology srl, Calenzano, Italy). Total carbonate content was expressed as equivalent CaCO3 (% w/w), calculated from the volume of CO2 evolved relative to that obtained from a pure CaCO3 standard. Soil bulk density (BD, Mg m−3) was determined in each treatment (B and C) in three locations per treatment in each vineyard at 0–15 cm depth using a cylindrical core of 100 cm3 volume (V) [30]. Samples were weighed at field conditions (FW), dried in oven at 105° C for 48 h, and reweighed (DW) for calculating the gravimetric soil moisture content (g g−1) as:
and bulk density (Mg m−3) as:
SMw = (FW − DW)/DW
BD = DW/V
Saturated hydraulic conductivity (Ksat, mm h−1) was measured in situ with a Guelph permeameter (Soil moisture Equipment Corp. 2012, Santa Barbara, CA, USA), in each treatment (B and C) in three locations per treatment in each vineyard, to assess water transmission capacity under saturated conditions. The Guelph permeameter was operated at two different heads, namely 5 and 10 cm. Different solutions were adopted to estimate the Ksat given the measured flow rates (cm min−1) at single heads [31,32] or using the two readings jointly [33]. Given the extreme field variability and the substantial violation of the theoretical assumptions of computational approaches, the average Ksat values obtained from using all the approaches are considered more representative and robust than a single value, in agreement with the so-called ensemble approaches used in climate and hydrological modelling [34,35].
Soil moisture (SM, %) was monitored concurrently with the eco-physiological measurements at two key phenological stages during the growing season. Measurements were conducted using a portable Time Domain Reflectometry (TDR) probe (Field Scout TDR 300 Soil Moisture Meter, Spectrum Technologies, Inc., Aurora, IL, USA). At each vineyard site, soil moisture was recorded in the inter-row at a depth of 0–15 cm, corresponding to the active root zone, and 15 replicates per treatment were measured to account for spatial variability. Specifically, measurements were carried out in the SA vineyard on 21 June and 19 July, in the SB vineyard on 4 July and 18 July, and in the SC vineyard on 29 June and 24 July in 2024. The location of the experimental parcels in the three vineyard sites is shown in Figure 2.
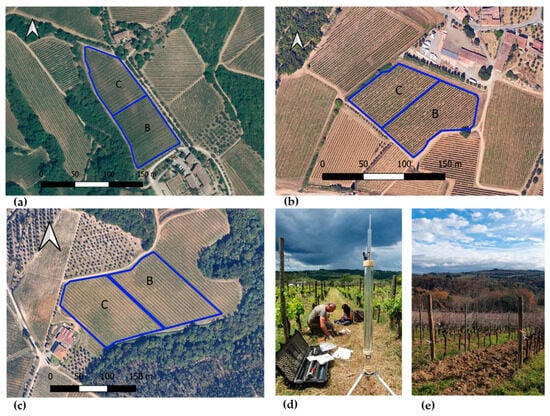
Figure 2.
Experimental parcels (outlined in blue) in the three vineyard sites: (a) SB site, (b) SA site, and (c) SC site. Saturated hydraulic conductivity measurement with the Guelph permeameter at SA (d), and vineyard at the SC site (e). SA: Badia a Coltibuono site; SB: Corzano e Paterno site; SC: Fèlsina site. C: control plot; B: biochar treatment plot.
2.3. NIR Soil Spectral Measurements
During the soil sampling survey, soil surface near-infrared (NIR) spectra were collected at the same locations after removing vegetation and debris (field spectral measurements). Measurements were taken using the NeoSpectra-Scanner Handheld Near-Infrared Reflectance Spectrometer (1350–2550 nm, 16 nm step; Si-Ware Systems Inc., Cairo, Egypt) for the SC and SB sites. A portion of the soil samples (≈100 g) gathered for chemical analyses was transported to the laboratory, where it was dried and sieved. The processed samples were then scanned under controlled laboratory conditions—inside a dark room with constant temperature and humidity—using the same spectrometer employed in the field (laboratory spectral measurements). For each sampling location or soil sample, three spectral replicates were collected, and the mean spectrum was subsequently computed.
Field and laboratory NIR spectral measurements were collected to evaluate how biochar influences spectral shape and features, and to assess whether proximal soil spectroscopy can be used to monitor biochar-induced changes in key soil properties. As an example, we report the determination of differences in soil moisture content between control soils and biochar-amended soils in two vineyard sites.
To measure the biochar effect (Beff) on soil spectra (Figure 3), the difference between control and biochar soil spectra acquired under laboratory conditions (sieved and dry) was computed for each site at each wavelength (λ). A scaling factor s was then estimated using a linear regression of the wet biochar spectrum against Beff, considering only the spectral regions outside the water absorption band at 1900 nm. The biochar-corrected spectrum Bfield,corrected(λ) was then calculated as:
Bfield,corrected(λ) = Bfield(λ) s × Beff
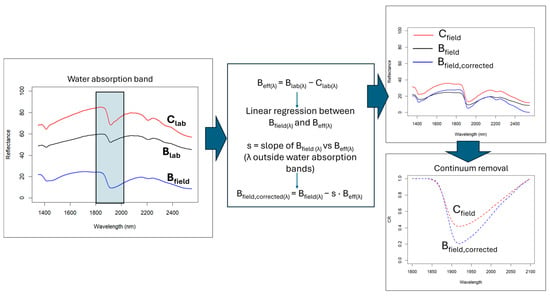
Figure 3.
Flowchart illustrating the NIR spectral correction method implemented to remove biochar’s confounding effect.
The scaling factor was applied in absolute value to ensure that the correction increased reflectance in the regions where biochar reduces it. Because the scaling factor was derived exclusively from spectral regions unaffected by water absorption, the correction does not impose constraints on the 1900 nm feature and therefore preserves its physical interpretability. To evaluate the water content effect around the 1900 nm absorption feature, the spectral depth (DP) and area (A) of this band were calculated on the continuum-removed spectra for both the Cfield and Bfield, corrected samples, allowing an assessment of which soil retained more water.
2.4. Eco-Physiological Measurements
Eco-physiological measurements were conducted to evaluate whether biochar application enhanced plant physiological performance under challenging environmental conditions, such as drought stress. During the 2024 growing season, leaf water potential (ψ) and chlorophyll-a fluorescence (used to assess photosystem II efficiency) were measured in each vineyard parcel on clear, representative days at two phenological stages, fruit development (≈60% fruit set) and fruit and seed maturity (berry ripening), between late June and late July 2024. These measurements were carried out on the same dates as the soil moisture assessments. ψ was measured according to the procedures of [36], using a pressure chamber (PMS, Instrumentation Co., Corvallis, OR, USA). In each vineyard, measurements were performed in both the control and biochar-treated parcels. Within each parcel, three sub-parcels were considered spatial replicates. For each sub-parcel, three leaves per vine were measured on three randomly selected vines (n = 9 per sub-parcel). The ψ were made at mid-day (ψmd) between 12.30 pm and 1.30 pm [37]. Measurements were carried out on fully expanded healthy leaves located in the median part of the canopy. The time between leaf excision and chamber pressurization was generally less than 15 s. Briefly, leaf petiole was excised and sealed in an aluminum-foil-lined bag to prevent transpiration. Measurements were expressed in megapascals (MPa).
Chlorophyll-a direct fluorescence is measured when a dark-adapted leaf is exposed to actinic light. Direct fluorescence is emitted along a polyphasic phase curve, from the initial (Fo) to the maximum value (Fm), called fluorescence transient. The analysis of the fluorescence transient is called JIP-test [38], and it serves to calculate specific biophysical parameters from the fluorescence values at different steps of the curve that quantify PSII behavior.
Chlorophyll-a fluorescence properties were assessed using a Plant Efficiency Analyzer (HandyPEA, Hansatech Instruments Limited, Norfolk, UK) at the time of fruit development and at berry ripening. The measurements were taken in the morning (10–11 a.m.) on 60 fully developed leaves per treatment (control vs. biochar), choosing 20 similar leaves from the median part of the canopy in each of the three grape lines. The leaves were dark-adapted for 30 min using leaf clips.
In the present study, we focused on the parameters describing the capacity of the reaction centers to absorb and transfer energy and to generate electron transport, parameters describing yield, flux ratio, and performance indexes. In particular, we considered the following:
- ABS/RC = light energy absorption (ABS) per reaction center (RC);
- TRo/RC = trapping phase of light energy (TRo) per reaction center (RC);
- DIo/RC = energy dissipation per reaction (DIo) center (RC);
- ETo/RC = electron transfer from the reduced plastoquinone QA− to cytochrome b6f (ETo) per reaction center (RC);
- REo/RC = electron transport up to the final acceptors of the PSI (REo) per reaction center (RC);
- ϕPo = maximum quantum yield of primary photochemistry ((Fm − Fo)/Fm = TRo/ABS) corresponding to the capacity of trapping exciton per absorbed energy;
- ψEo = probability of electron transfer beyond QA− ((1 − (FJ − Fo)/(Fm − Fo)) = ETo/TRo), corresponding to the probability than an electron reduces PQ;
- PIabs = potential performance index, based the density of active RCs, light conversion efficiency (ϕPo), and the probability of transferring electrons beyond QA (ψEo);
- PItot = total performance index for energy conservation, from photons absorbed by PSII to the reduction of PSI end acceptors, namely ferredoxin and NADP+.
2.5. Vineyard Production
At harvest (4 September SA; 6 September SB; and 28 August SC), yield per plant was determined in both the control and biochar-treated parcels within each vineyard. For each treatment, 15 plants were randomly selected and harvested individually. All vines selected for harvest measurements were healthy, productive plants representative of the vineyard average and located within the central area of the parcels to minimize border effects. All clusters from each selected vine were collected, counted, and weighed in the field using a portable electronic balance (precision ± 0.01 kg). The yield per vine (kg plant−1) was calculated as the total fresh weight of grapes per plant. The data were then averaged for each treatment within each vineyard.
2.6. Statistical Analysis
Statistical analyses of soil and eco-physiological data were performed using Statistica (StatSoft Southern Africa—Research (Pty) Ltd., Sandton, South Africa) and R software v4.4.2 [39]. Given the experimental design with one treated and one control parcel in each of the three vineyards, the grape lines were considered subsamples for the eco-physiological data. Therefore, differences between the control and biochar treatments were tested using a Linear Mixed Model (LMM) [40], considering the treatment as fixed effect and grape line as random factor, with statistical significance set at p < 0.05. Prior to analysis, data were checked for outliers. The normality of quantitative variables within each group (control and treatment) was assessed using the Shapiro–Wilk test, and the homogeneity of variances was evaluated with Levene’s test.
3. Results
3.1. Experimental Design Assessment Using Remote Sensing Approach
The spatial distribution of vine vigor, derived from the Sentinel-2 NDVI classification into two quantile-based classes, highlighted clear intra-parcel heterogeneity across all three study vineyards (Figure 4). Each experimental parcel (control and biochar-treated) systematically included both low-vigor (LV) and high-vigor (HV) zones, confirming the success of the parcel delineation procedure.
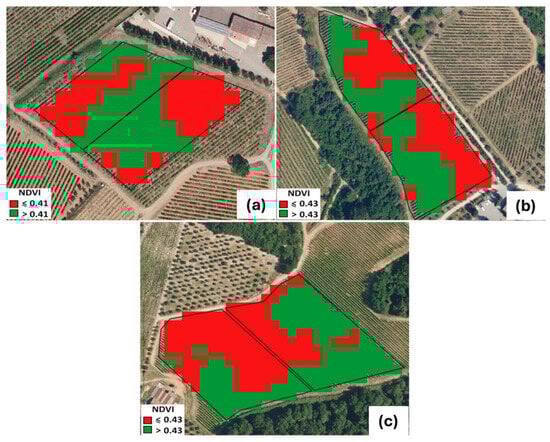
Figure 4.
Parcel (C- and B-treated) assessment based on NDVI values and two-quantile classification. (a) SA site; (b) SB site, and (c) SC site. SA: Badia a Coltibuono site; SB: Corzano e Paterno site; SC: Fèlsina site.
Mean NDVI values extracted for each vigor class (Table 3) further demonstrated the in-field variability and the internal consistency of this approach.
Table 3.
NDVI values extracted from each class within control (C) and biochar (B) treatment parcels for all study sites. Data are presented in the manner of means ± standard deviation. SA: Badia a Coltibuono site; SB: Corzano e Paterno site; SC: Fèlsina site; LV: low vigor; HV: high vigor; NDVI: Normalized Difference Vegetation Index.
In the SA vineyard, LV areas showed NDVI values of 0.37 ± 0.01 (control) and 0.38 ± 0.01 (biochar), whereas HV areas reached 0.45–0.46 ± 0.01. Similar patterns were observed at SB, where LV values ranged between 0.38 ± 0.03 and 0.39 ± 0.01 and HV values consistently around 0.45 ± 0.01–0.46 ± 0.02. In the SC vineyard, LV zones ranged between 0.33 ± 0.01 (C) and 0.36 ± 0.01 (B), while HV zones reached 0.49 ± 0.01 in both treatments. The narrow variability within LV and HV classes and the overlap between control and treatment indicate that the two parcels within each vineyard were genuinely “twin” units, sharing comparable vigor structures prior to the application of biochar. Across sites, the NDVI gradients were coherent with expected geomorphological, pedological, and micro-environmental drivers, yet the internal partitioning of vigor classes ensured that each parcel encompassed the full local vigor spectrum. This configuration is crucial because grapevine vegetative development is intrinsically affected by spatial drivers—soil texture and depth, water availability, and microclimate—as widely discussed in viticultural zoning literature [41,42]. The adopted remote-sensing workflow thus provided a reliable quantification of pre-existing vigor patterns and allowed us to verify that control and treatment parcels were not biased by initial vegetative differences. Overall, the results confirm that the Sentinel-2-based NDVI classification effectively supported the definition of homogeneous experimental units within heterogeneous vineyard contexts, providing a robust basis for the subsequent eco-physiological evaluation of treatment effects.
3.2. Soil Analysis
Significant differences in soil chemical properties emerged between the control and biochar treatments in all vineyard sites (Table 4). In SA, biochar increased TOC (13.73 → 20.22 g kg−1) and Ntot (1.47 → 1.81 g kg−1) and reduced CaCO3 (10.50 → 4.60 g kg−1), while Ctot remained unchanged. In SB, biochar increased TOC (14.55 → 21.71 g kg−1) and Ntot (1.67 → 2.06 g kg−1), raised the C/N ratio, and lowered CaCO3 (20.83 → 10.56 g kg−1), although Ctot decreased slightly (39.55 → 34.39 g kg−1). In SC, biochar markedly increased Ctot (6.56 → 11.01 g kg−1), TOC (2.90 → 9.09 g kg−1), and Ntot (0.40 → 0.65 g kg−1), resulting in a higher C/N ratio (7.51 → 13.84) and reduced CaCO3 (29.67 → 17.33 g kg−1).
Table 4.
Soil textural class, Ctot, TOC, Ntot, and CaCO3 in experimental vineyards. Data are presented in the manner of means ± SD, n = 3. Asterisks *, **, *** indicate significant differences at p < 0.05, 0.01, 0.001, respectively, from the T-test for independent samples (C vs. B). TOC: total organic carbon. SA: Badia a Coltibuono site; SB: Corzano e Paterno site; SC: Fèlsina site.
Across all vineyard sites, biochar demonstrated a consistent capacity to improve soil physical conditions, as evidenced by reductions in bulk density (BD) and increases in soil porosity (Table 5). The strongest response was observed in SA, where BD decreased from 1.53 to 1.39 Mg m−3 (−12.6%), indicating a substantial loosening of soil structure. In SB, BD declined from 1.45 to 1.31 Mg m−3 (−6.5%), while in SC the reduction was more moderate (−4.9%), with values of 1.43 and 1.39 Mg m−3 for C and B treatments, respectively. Although less pronounced and not statistically significant in SC, the trend was consistent, confirming the positive influence of biochar on soil structural conditions. Total porosity mirrored the BD trend, increasing under biochar treatment in all sites. The largest improvement occurred in SA (+17.1%), followed by SB (+7.3%) and SC (+5.8%), suggesting enhanced aeration, water retention, and root penetration. Ksat showed different site-specific responses. In SA (clay–loam texture), biochar increased Ksat compared to the control, although differences were not statistically significant. In SB (silty–clay–loam texture), no clear improvement was detected. Conversely, in SC (sandy–loam texture), Ksat decreased, although not significantly, from 56.56 ± 56.32 mm h−1 (C) to 38.66 ± 14.21 mm h−1 (B), indicating reduced water infiltration. It is worth noting, though, the high variability characterizing Ksat field measurements at the three sites, with coefficient of variation values between 48 and 103%. These results suggest that biochar can increase, though to quite a limited extent, soil hydraulic conductivity when soil texture and structure favor the development of conductive macropores. No significant differences in soil pH were observed between the biochar-treated and control parcels across all vineyards, suggesting that the intrinsic high buffering capacity of the soils may have moderated the short-term effects of the amendment.
Table 5.
BD, porosity, Ksat and pH in experimental vineyards. Data are presented in the manner of means ± standard deviation (n = 3). Asterisks *, ** indicate significant differences at p < 0.05, 0.01 respectively, from the T-test for independent samples (C vs. B). SA: Badia a Coltibuono site; SB: Corzano e Paterno site; SC: Fèlsina site.
Across all sites, B consistently showed higher soil moisture than C (Figure 5), particularly during the ripening of berries (at the end of July), when water availability is critical. In SA, B slightly increased soil moisture during the development of fruits (≈23% vs. 20%) and showed similar values at maturity of fruit and seed (≈10–12%). In SB, biochar maintained higher moisture at both stages, with a marked difference during the ripening of berries (≈22% vs. 10%), which was statistically significant. Finally, in the SC vineyard biochar had the highest values overall, especially during the ripening of berries (≈15% vs. 8%), which is also significant. Although most differences were not statistically significant, the trend strongly suggests that biochar improves soil water retention under Mediterranean conditions, particularly during later phenological stages.
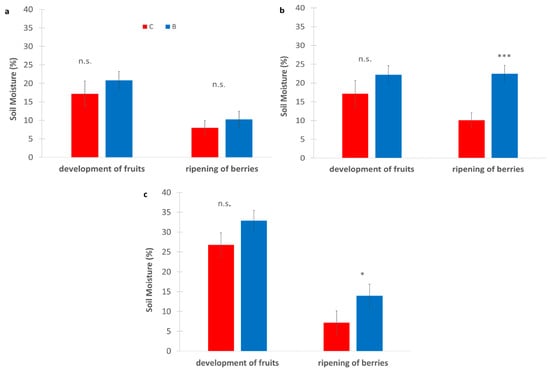
Figure 5.
Soil moisture measured (%) in experimental vineyards during two key phenological stages: development of fruits and ripening of berries, comparing biochar (B) treatments (blue bars) and control (C) (red bars). (a): SA site, (b): SB site, (c): SC site. Data are presented in the manner of means ± standard deviation (n = 9). Asterisks *, **, *** indicate significant differences at p < 0.05, 0.01, 0.001, respectively, from the t-test for independent samples (C vs. B); n.s.: not significant. SA: Badia a Coltibuono site; SB: Corzano e Paterno site; SC: Fèlsina site.
3.3. Monitoring Biochar-Induced Changes by NIR Spectroscopy
The addition of biochar to the soil had a strong impact on its spectral response, reducing albedo across the entire wavelength range and smoothing spectral features (Figure 6a). Although the same amount of biochar was applied in the SC and SB vineyards, the spectral biochar effect (Beff) differed in magnitude, with a stronger albedo reduction in SB compared to SC (Table 6). Given the non-homogeneous Beff, two different corrections were applied to the spectra collected on B under field conditions. The Bfield, corrected spectra should represent spectra primarily influenced by water, without the confounding effects of biochar, and indeed they appear very similar in shape to the Cfield spectra (Figure 6b). Consequently, the spectral differences between Cfield and Bfield can be mainly attributed to differences in water content. Examining the differences in continuum removal values at 1900 nm, both in terms of depth (DP) and area (A), we can observe that in both locations the biochar-amended soils exhibited higher water content compared to C, with a slightly larger difference in SC than in SB (Figure 5c). This observation agrees with the field measurements recorded with the TDR sensor (Figure 4).
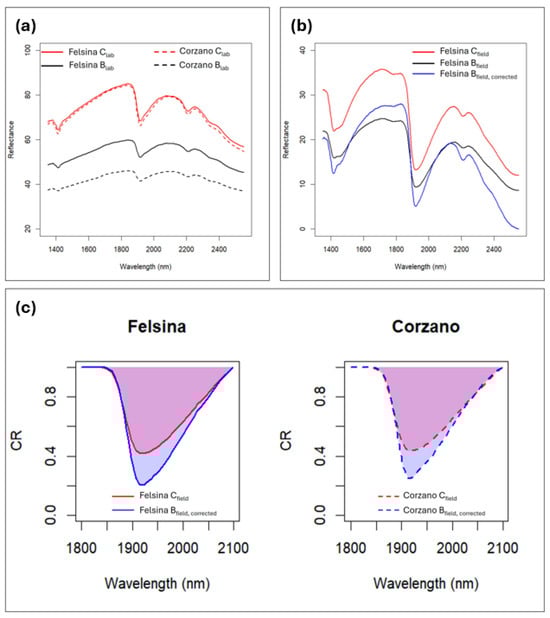
Figure 6.
Soil spectra from the experimental sites SB and SC: (a) laboratory-acquired soil spectra for the control (C) and biochar-amended (B) treatments across the full wavelength range; (b) field-acquired spectra for the SC site for (C and B), along with the corrected spectrum after removing the confounding effects of biochar at SC; (c) differences in continuum removal values at 1900 nm between C and the corrected B spectra for both sites. SB: Corzano e Paterno site; SC: Fèlsina site.
Table 6.
Mean spectral biochar effect (Beff) in SB and SC sites and differences in continuum removal values at 1900 nm, both in terms of depth (DP) and area (A). SB: Corzano e Paterno site; SC: Fèlsina site.
3.4. Eco-Physiological Measurements
Across all three vineyards, Ψmd showed minimal differences between treatments during the development of fruits, with B and C vines exhibiting similar moderate values (Figure 7). However, during the ripening of berries, a clear and consistent pattern emerged across sites. In all vineyards, biochar-treated vines maintained significantly higher (less negative) Ψmd values than the control, indicating a reduced level of water stress. In all vineyards, the improvement ranged between 0.3 and 0.4 MPa, suggesting that biochar enhanced soil water availability and supported vine water status during the period of peak seasonal stress.
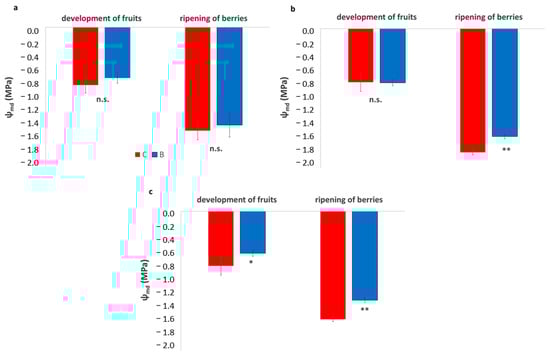
Figure 7.
Leaf water potential at mid-day (Ψmd) in experimental vineyards during two key phenological stages, development of fruits and ripening of berries, comparing biochar (B) treatments (blue bars) and control (C) (red bars). (a): SA site, (b): SB site, (c): SC site. Data are presented in the manner of means ± SD (n = 9). Asterisks *, ** indicate significant differences at p < 0.05, 0.01 respectively, from the t-test for independent samples (C vs. B); n.s.: not significant.
Chlorophyll a fluorescence analysis allows assessment of the efficiency of PSII and the electron transport chain up to PSI, which are essential for the ATP and NADPH production required for CO2 fixation. Only a few differences between the control and biochar treatments were observed, mainly during fruit development (Figure 8, Table 7). In the SA vineyard, no differences were observed between control and biochar treatments at either fruit stage, in any parameters. Additionally, the maximum quantum yield of PSII, φ(Po), was found to be within the range typical of healthy plants (0.80 ± 0.02).
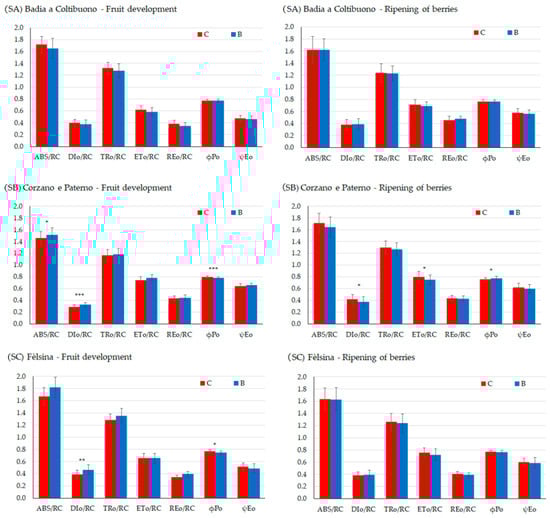
Figure 8.
Chlorophyll-a direct fluorescence parameters during two key phenological stages, development of fruits (left) and ripening of berries (right) in SA site, SB site, and SC site, ABS/RC = light energy absorption (ABS) per RC, TRo/RC = trapping phase of light energy per RC, DIo/RC = energy dissipation per RC, ETo/RC = electron transfer from the reduced plastoquinone QA− to cytochrome b6f per RC, REo/RC electron transport up to the final acceptors of the PSI per RC. ϕPo = the maximum quantum yield of primary photochemistry; ψEo = probability of electron transfer beyond QA−. Asterisks *, **, *** indicate significant differences at p < 0.05, 0.01, 0.001, respectively, from the t-test for independent samples (C vs. B).
Table 7.
Performance index based on absorption (PIabs) and performance index total (PItot) in SA site, SB site, and SC site. Data are presented in the manner of means ± SD. Asterisks *, **, *** indicate significant differences at p < 0.05, 0.01, 0.001, respectively, from the T-test for independent samples (C vs. B). SA: Badia a Coltibuono site; SB: Corzano e Paterno site; SC: Fèlsina site.
In the SB vineyard, most differences were observed during the fruit development, with biochar-treated plants showing higher DIo/RC, indicating energy dissipation, despite having higher ABS/RC, (p < 0.05) than the control plants, reflecting greater energy absorption capacity. The maximum quantum yield of the photosystem II, φ(Po), in control plants was typical of healthy plants, while it was lower in the biochar treatment (p < 0.001). In contrast, during fruit ripening, DIo/RC and φ(Po) were higher in the control (p < 0.05). No differences were observed for the performance indexes (PIabs and PItot).
In the SC vineyard, most significant differences were also found during fruit development, with biochar-treated vines showing a higher DIo/RC (p < 0.001), indicating energy dissipation due to a stress condition and lower φ(Po), although values indicated low quantum yield in both treatments (p < 0.05). As for PIabs and PItot, these were not statistically significant during fruit development or berry ripening (Table 7), indicating good linear electron transport occurred until PSI.
3.5. Vineyard Production
Production per plant at harvest (Figure 9) showed clear site-dependent responses to biochar application, but the overall trend was clear and consistent across the three sites. In SA, B-treated vines produced significantly higher yields, increasing from approximately 1.0 to 1.8 kg plant−1 (p < 0.01). A similar trend was observed at SB, where production increased from 1.6 to 2.2 kg plant−1 under biochar application (p < 0.05). Conversely, at the SC site, no significant differences were found between treatments, with yields remaining around 1.0–1.1 kg plant−1 (n.s.), and showing greater variability among plants, as indicated by wider error bars. These results highlight that the effectiveness of biochar in enhancing grape yield is site-specific and appears more pronounced in soils with higher responsiveness in terms of water retention and structural improvement.
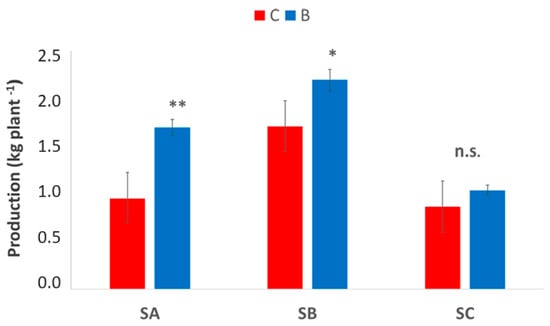
Figure 9.
Production per plant at harvest in the three vineyards, SA, SB, and SC, comparing treatments biochar (blue bars) and control (red bars). Data are presented in the manner of means ± standard deviation (n = 15). Asterisks *, ** indicate significant differences at p < 0.05, 0.01, respectively, from the t-test for independent samples (C vs. B); n.s.: not significant. SA: Badia a Coltibuono site; SB: Corzano e Paterno site; SC: Fèlsina site.
4. Discussion
The integrated GIS–remote sensing approach adopted in this study proved essential for establishing a rigorous experimental framework in vineyards characterized by pronounced spatial heterogeneity, as highlighted in recent earth-observation-based studies [43]. Satellite-derived indicators offer an objective means to quantify landscape variability and reduce subjectivity in field assessments. In this work, the delineation of vigor classes based on NDVI ensured that each parcel included comparable LV and HV zones, preventing confounding effects caused by spatially structured vigor patterns [44], a widely recognized challenge in spatial viticulture analyses [45,46]. This configuration was crucial to isolating the physiological response to biochar from underlying environmental gradients. The parcels were selected only in homogeneously high- or low-vigor areas; treatment effects might have been masked or overinterpreted due to the intrinsic dependence of vine behavior on local geomorphological and pedological constraints. Conversely, the “twin parcel” structure, validated through quantitative NDVI extraction, enabled a balanced comparison between treated and control vines across different vigor conditions. This design strengthened the interpretability of subsequent eco-physiological measurements, ensuring that observed differences could be confidently attributed to the treatment rather than intrinsic spatial variability. More broadly, our findings underscore the importance of integrating remote sensing into experimental design for precision viticulture, particularly when long-term treatment monitoring is required [47,48,49]. Nevertheless, NDVI cannot assess pre-existing sub-surface differences in soil properties, and observed differences could as well stem from site-specific responses rather than being entirely due to biochar application. The “twin parcel” approach, then, while useful to highlight spatial variability, limits the statistical inference at the parcel level.
The results of this study demonstrate that biochar application can significantly influence soil–plant interactions in vineyard systems, although the magnitude and nature of these effects strongly depend on soil type. One year after biochar incorporation, clear improvements in the soil physical–chemical properties were observed, especially in soils characterized by low fertility or poor structural stability. Although the magnitude of these changes varied among the sites, reflecting differences in soil texture classes and baseline characteristics, the overall response direction was consistent, confirming a clear biochar-induced transformation of soil properties.
The results reported in Table 4 indicate that biochar application increased soil carbon content, as evidenced by both Ctot and TOC measurements. TOC was measured using the Walkley–Black method, which generally reflects the oxidizable fraction of soil organic carbon and is more closely related to the labile and biologically active SOC pool. However, in the presence of biochar, this method may underestimate the contribution of chemically stable biochar-derived carbon [50,51]. In contrast, Ctot measured by CHN elemental analysis captures total carbon, including both native SOC and recalcitrant biochar carbon, as well as inorganic carbon, which accounts for a significant fraction in sites SA and SB. Considering the short experiment duration and identical management of both treatments, the observed increases in organic C are therefore likely primarily due to biochar addition, highlighting the potential of vineyards as long-term carbon sinks.
In 2023 biochar accounted for 94% of all long-term carbon removal credits issued globally [52], confirming its role as one of the most promising technologies for decarbonization and the achievement of net-zero targets [53], in alignment with the principles of the Science Based Targets initiative (SBTi). Global meta-analyses confirm our findings, highlighting more pronounced effects in nutrient-poor soils [54], as observed in the Fèlsina vineyard (site SC), where Corg increased from 2.90 to 9.09 g kg−1. In contrast, in clay-rich soils, where organic matter was already relatively abundant (as in Corzano, site SB), biochar mainly enhanced stabilization of existing carbon, resulting in more modest increases. These changes should be interpreted with caution, as they do not necessarily represent increased sequestration of native soil organic carbon, but rather the combined effects of biochar addition and site-specific pedological characteristics, which influence carbon dynamics and retention in viticultural soils. One of the most striking results reported in Table 4 is the significant reduction in CaCO3 in all vineyards. This was somewhat unexpected and counter intuitive, as the application of an alkaline amendment to calcareous soil usually does not affect soil pH and does not promote carbonate dissolution. At SC, CaCO3 decreased from 29.67 to 17.33 g kg−1; at SA, from 10.50 to 4.60 g kg−1; and at SB, from 20.83 to 10.56 g kg−1. This 40–55% reduction would suggest that biochar applications might have triggered chemical transformation processes, particularly microsite carbonate dissolution. This effect might be driven by increased microbial activity [55], promoted by the presence of labile carbon in low-temperature biochar (<500 °C), such as the one used in our vineyards, which acts as a substrate for soil microorganisms. Furthermore, as observed for the biochar used in our experiment (pH 9.8), the presence of oxygenated functional groups (phenolic and carboxylic) on its surface may induce localized micro-acidification, despite its overall alkaline nature promoting organo–mineral complex formation [56]. Microbial respiration increases CO2 and low-molecular-weight organic acids, leading to carbonic acid formation and CaCO3 dissolution via the reaction CaCO3 + H2CO3 → Ca2+ + 2HCO3− [57]. The resulting soluble ions are subject to leaching, especially under conditions of high rainfall—as in our case with 1019 mm of yearly cumulative rainfall—and increased porosity (11.2–15% increase) [58]. Nevertheless. the significant reduction in CaCO3 in biochar-amended plots at all sites (Table 4) must be interpreted cautiously. While biochar-induced microbial activity and acidification could promote carbonate dissolution, the observed differences may also reflect, at least in part, pre-existing spatial variability in calcium carbonates content between parcels. The small standard deviations within treatments but large differences between them suggest potential baseline heterogeneity. Another relevant aspect to carefully consider, though, is the possibility that the presence of biochar results in systematic artifacts in the calcimetric measurement of soil calcium carbonate (CaCO3). Biochar might affect results by introducing non-carbonate alkaline components that react with hydrochloric acid (HCl), leading to an overestimation of actual carbonate content. As the calcimetric method (e.g., using a Bernard calcimeter) measures the CO2 volume released upon HCl addition, the “acid-neutralizing capacity” of biochar components other than CaCO3 can significantly affect analytical results. High-temperature biochars often have high ash contents containing inorganic oxides and/or hydroxides of potassium (K), calcium (Ca), and magnesium (Mg) oxides, which consume (HCl) in titrimetric methods, potentially inflating “calcium carbonate equivalent” values. However, low-temperature biochars possess oxygen-containing functional groups (e.g., carboxyl, hydroxyl) that consume protons (H+) through protonation. While this may not produce CO2 gas for volumetric methods, it interferes with titrimetric versions of the CaCO3 analysis by consuming the standardized acid [59]. Additionally, and this might apply to our case, physical mechanisms interfere with the calcimetric measurement as biochar’s highly porous structure and large specific surface area can physically interfere with the measurement process trapping and adsorbing a portion of the CO2 produced during the reaction, which may lead to an underestimation of carbonate content in volumetric tests [60,61]. Furthermore, the presence of biochar can result in kinetic delays, as the internal pores may trap HCl or delay the release of CO2 gas, requiring longer reaction times to reach equilibrium compared to untreated soil.
Long-term monitoring and pre-treatment soil sampling would be needed to confirm a true treatment effect. If confirmed through long-term monitoring, which should consider measuring microbial respiration and analyzing soil solution chemistry to confirm the hypothesis, this reduction in CaCO3 could enhance the availability of micronutrients, particularly iron and manganese, in calcareous vineyard soils [62,63].
Biochar application also modified the physical properties of the soil. The results indicate significant improvements, particularly in bulk density, porosity, and water-holding capacity (WHC), although with site-specific intensities. Reductions in bulk density confirm the ability of biochar to alleviate soil compaction due to its low density and disruptive interactions with mineral particles [64,65]. Concurrent increases in soil porosity further indicate a more open pore system, with the strongest effects observed in soils that are more responsive to structural modifications, as the finer textured ones in our study. Regarding Ksat, the results show a clear texture-dependent response. In general, biochar application tends to decrease Ksat in coarse-textured soils and increase it in fine-textured soils [13]. In coarse-textured soils such as at Fèlsina (site SC), Ksat decreased, likely due to increased tortuosity and partial clogging of macropores by fine biochar particles [66,67]. Conversely, in fine-textured soils, such as the clay–loam at Badia a Coltibuono (site CA), biochar substantially improved Ksat by enhancing aggregate stability and promoting the formation of continuous water-conducting pores. These results emphasize the need for site-specific strategies when applying biochar to optimize hydraulic performance, considering baseline texture, biochar properties, and application rate. Overall, the evidence confirms that while biochar is broadly effective in reducing compaction and increasing pore volume, its hydrological impact strongly depends on soil texture and the ability to translate structural changes into hydraulic improvements.
The impact of biochar on soil water content varied among soil types but consistently resulted in increased soil moisture, particularly during warmer periods when plant water demand was highest. These findings are in line with numerous studies reporting enhanced soil water content following biochar application, both in field experiments [68,69] and laboratory investigations [67,70,71]. The improvement in soil water content is mainly driven by two mechanisms: (i) an increase in soil specific surface area and (ii) enhanced soil porosity. Eco-physiological measurements of Ψmd (Figure 7) showed no significant differences between biochar-treated and control vines during fruit development. This can be explained by the fact that in this phenological phase (late June–early July), soil water reserves were still sufficient to meet vine water requirements [72]. This was also confirmed by soil moisture data (Figure 5), which showed similarly high values in both treatments, indicating the absence of water limitation early in the season. Under such non-limiting conditions, the potential benefits of biochar on vine water status are not yet detectable, as the soil–plant system is not exposed to water stress. Nevertheless, a strong relationship was observed between soil moisture and Ψmd, highlighting the close coupling between soil water availability and vine water status under the studied conditions. The correlation analysis showed that increasing soil moisture was consistently associated with less negative Ψmd values, indicating an improvement in vine hydraulic status as soil water availability increased. This result confirms the sensitivity of Ψmd as an integrative eco-physiological indicator of vine response to soil water dynamics. The situation changed markedly during berry ripening (mid-late July), when soil water reserves declined due to reduced precipitation and increased evapotranspiration demand. During this period, soil moisture in biochar-treated plots remained higher than in the control, confirming the positive effect of biochar on soil water retention capacity, as previously reported by several authors [12,73]. As a consequence, biochar-treated vines maintained less negative Ψmd values, reflecting improved plant water status and reduced water stress. According to the classification proposed by van Leeuwen [74] and further developed at the eco-physiological level by Deloire [75], control vines fell within the severe-to-very-severe water stress classes (−1.6 to −1.8 MPa), whereas biochar-treated vines remained within moderate-to-severe stress conditions (−1.2 to −1.5 MPa). These results reinforce and extend previous evidence from vineyard experiments conducted in Tuscany (Italy) by the same authors [12,73], demonstrating that biochar application can induce a persistent shift in vine water status toward more favorable conditions. The observed strong correlation indicates that variations in soil moisture were effectively translated into measurable differences in vine water status, supporting a cause-and-effect relationship rather than a coincidental association. This interpretation is consistent with previous studies [76,77] identifying soil water availability as a primary driver of vine water status, especially under Mediterranean or semi-arid conditions typical of many wine-growing regions.
The agronomic implications of these physiological differences are reflected in production outcomes. Across all sites, yield increased in the B-treated parcels compared to the C, although differences in SC were not statistically significant. It is likely that substantial improvements in soil water availability and specific meteorological conditions are required to produce significant yield differences. Due to the high variability of vineyards and annual climatic conditions, a strong correlation between eco-physiological indicators, soil parameters, and yield is not always observed.
On one side, biochar seemed to increase water availability to plants, on the other side it induced some effects on the photosynthesis apparatus, mainly limited to the fruit development stage, when the water status (water potential measurements) resulted similar in the two treatments. For instance, chlorophyll fluorescence analysis in SA site resulted in similar behaviors in both treatments. The complexity of the plant-response is demonstrated by the results obtained in the other sites. In SB (Corzano e Paterno) the vines grown with biochar showed better energy absorption than control vines, similar energy transfer and trapping and electron transfer capacity, as found in another study [78], despite higher energy dissipation and lower maximum quantum yield. This finding is similar in the SC site (Fèlsina). Energy dissipation means that energy is not used for photosynthesis and indicates a protective response to a stress condition of the reaction centers [79,80]. As energy dissipation mainly occurs when plants face stress such as light intensity, CO2 limitation, water stress, or nutrient deficiency, and excluding the first three motivations which were similar for both treatments, we may speculate that nutrient availability may infer [81]. This effect can be linked to the direct influence on the photosynthetic apparatus during the plant growth, mainly through biosynthesis and the functioning of key photosynthetic components when leaves are fully developed, which depend on the ecological conditions and the availability of important macro and micro-nutrients such as nitrogen, magnesium, and iron [82,83,84,85]. A deeper understanding of biochar effect on the micro and macro-elements availability to plants would provide compelling discussion on the results. Indeed, biochar acts on elements availability by the increase in soil pH, although not supported by this study, as well as other characteristics like soil organic C and clay content. Biochar has been found effective for immobilizing heavy metals, among which important micro-elements such as Cu and Zn [86,87]. These elements are important in the functioning of the photosynthetic apparatus. Cu is a component of the plastocyanin, which rules electron transfer and it is required for the formation of chlorophyll [88]. Therefore, Cu deficiency may interfere with pigment and lipid biosynthesis and, consequently, with chloroplast ultrastructure, thus negatively influencing photosynthetic efficiency and decreasing variable fluorescence [88,89]. Zn also plays an important role in the proper PSII function [90]: at an initial stage of Zn deficiency chlorophyll content decreases, and the inhibition of PS II light-harvesting activity accounts for the photosynthesis reduction. However, the results at the ripening of fruits indicate that any limiting factor had a reversible effect on photosynthetic apparatus efficiency. Therefore, chlorophyll fluorescence measurements may have detected site-specific hidden stress signals which have not damaged the plant functioning or the whole grape yield.
By analyzing differences between Clab and Blab spectra—both collected under laboratory conditions on sieved and dry samples—we isolated the effect of biochar (Beff) on soil spectra in the NIR region. The comparison showed that biochar strongly influences soil spectral responses, acting similarly to other confounding factors such as water, flattening spectral curves with a progressive effect proportional to the relative amount of the confounding factor [91,92], in this case, biochar within the soil–biochar mixture. However, the biochar-induced spectral effect can vary depending on the soil type. As shown here, the average Beff was stronger at SB than at SC (Table 6). This can be attributed to differences in soil texture, particularly clay content. Clay minerals typically exhibit spectral features around 2200 nm, which are more pronounced in silty-clay–loam soils like those at SB than in sandy-loam soils like those at SC. Consequently, in soils with higher clay content, a greater reduction in albedo is expected due to the smoothing of absorption features induced by biochar.
This Beff on spectral shape and features hinders the estimation of soil properties using soil spectroscopy approaches when biochar is applied as an amendment. Therefore, an approach capable of isolating and removing Beff is necessary for effectively exploiting field spectroscopy or UAV-based hyperspectral data, enabling a suitable, timely, and cost-effective soil monitoring strategy within the framework of sustainable soil management and carbon credit market. The simplified method proposed here for comparing water content in C and B parcels at the vineyards experimental sites produced results consistent with instrumental measurements, suggesting that it could also be applied to estimate other soil properties characterized by clear spectral features in the NIR region, such as clay or calcium carbonate content. More complex algorithmic approaches (e.g., EPO—external parameter orthogonalization) may be tested for properties like organic carbon [92,93].
5. Conclusions
This study shows that biochar can be an effective soil amendment for improving soil quality, vine water status, and resilience to drought in vineyard systems. Its benefits were most evident in low-fertility or structurally weak soils, where biochar increased organic carbon, porosity, and water-holding capacity while reducing compaction. These improvements enhanced vine hydration during berry ripening and mitigated water stress, supporting more stable yields during the most critical summer stages. Overall, results confirmed the positive interactions between biochar, soil water retention, plant water status, and yield and reinforced the role of biochar as a soil amendment capable of enhancing resilience to increasing drought stress scenarios [94,95]. However, the magnitude of biochar’s effects differed across the three soil types, indicating that its application should be tailored to specific pedological conditions and to the properties of the biochar used. It is important to emphasize that the results reported in this study are based on only one year of experimentation. Consequently, the observed effects on yield and soil properties should be interpreted with caution, as they may be strongly influenced by short-term weather variability and other intrinsic environmental factors. Longer-term monitoring will be necessary to obtain more robust and reliable conclusions regarding the effects of biochar on vineyard productivity, as one year is likely insufficient to fully capture its potential benefits. From an agronomic perspective, applications in the order of 16 t ha−1 (fresh weight) have been shown to improve the water status of vines during periods of peak summer water demand, reducing stress from severe to moderate. Unlike traditional fertilizers, biochar does not require seasonal applications, thus representing a long-term investment [52]
Economically and environmentally, biochar is now the main source of long-term carbon credits, offering a possible additional economic return for farms [52,96].
As already highlighted, a key limitation of this study is its short duration, with observations made only one year after biochar application. Nevertheless, as grapevine is a perennial crop, these initial results provide a valuable baseline to evaluate whether the observed effects on soil and vine performance will persist, diminish, or change in subsequent years. Long-term monitoring will be essential to assess the persistence of biochar-derived carbon, its cumulative impacts on soil processes, and its potential contribution to climate mitigation and carbon-farming strategies. Emerging technologies for rapid and scalable soil carbon assessment, such as UAV-based imaging, proximal spectroscopy, satellite monitoring, and AI-driven models, will be essential to support long-term monitoring and carbon credit certification. Overall, biochar emerges as a valuable tool for regenerative and climate-smart viticulture, provided its use is guided by robust, site-specific knowledge.
Author Contributions
Conceptualization, S.B. and S.F.D.G.; Data curation, A.B. (Arianna Biancalani), S.B., G.M.L., F.U. (Francesca Ugolini), F.U. (Fabrizio Ungaro), S.F.D.G., R.D. and A.B. (Andrea Berton); Formal analysis, S.F.D.G., R.D., A.B. (Arianna Biancalani), F.U. (Fabrizio Ungaro), F.U. (Francesca Ugolini), F.C. and S.B.; Funding acquisition, S.F.D.G. and S.B.; Investigation, A.B. (Arianna Biancalani), S.B., G.M.L., F.U. (Francesca Ugolini), F.U. (Fabrizio Ungaro), S.F.D.G., R.D., F.C. and A.B. (Andrea Berton); Methodology, S.F.D.G. and S.B.; Project administration, S.B.; Resources, S.F.D.G., F.U. (Fabrizio Ungaro) and S.B.; Supervision, S.B.; Validation, S.F.D.G., R.D., A.B., F.U. (Fabrizio Ungaro), F.U. (Francesca Ugolini), F.C. and S.B.; Visualization, S.F.D.G., R.D., A.B. (Arianna Biancalani), F.U. (Fabrizio Ungaro), F.U. (Francesca Ugolini) and F.C.; Writing—original draft, A.B. (Arianna Biancalani), F.U. (Francesca Ugolini), F.U. (Fabrizio Ungaro), S.F.D.G., R.D. and S.B.; Writing—review and editing, A.B. (Arianna Biancalani), F.U. (Francesca Ugolini), F.U. (Fabrizio Ungaro), S.F.D.G., R.D. and S.B. All authors have read and agreed to the published version of the manuscript.
Funding
This work was funded by the PSR BWine “Biochar per aumentare la sostenibilità e la resilienza della viticoltura” (Biochar to increase the sustainability and resilience of viticulture), CUP ARTEA: 1073741. Bando attuativo della Sotto-misura 16.2 “Sostegno a progetti pilota e allo sviluppo di nuovi prodotti, pratiche, processi e tecnologie” (Call for proposals for Sub-measure 16.2 “Support for pilot projects and the development of new products, practices, processes, and technologies”).
Data Availability Statement
The datasets generated during and/or analyzed during the current study is available from the corresponding author on reasonable request.
Acknowledgments
The authors would like to thank the staff of Badia a Coltibuono, Corzano e Paterno, and Fèlsina S.p.A. Società Agricola for their technical support and for hosting the experiments. In particular, we acknowledge Roberto Stucchi Prinetti and Gianni Burini (Badia a Coltibuono); Arianna Gelpke and Aljoscha Goldschmidt (Corzano e Paterno); and Ellis Topini and Alessandro Chellini (Fèlsina) for their collaboration. The authors are also grateful to the Italian Biochar Association (ICHAR—www.ichar.org, accessed 9 December 2025). We sincerely thank Massimo Valagussa for performing all soil analyses and for his forward-looking insights, and Alessandro Pozzi (EnerionGlobal) for his valuable contribution to the field experimentation. Thanks go to Davide Cini (CNR-IGG) for his valuable technical assistance during the field experiments, and to Francesca Martelli (CNR-IBE) as well as Monica Coletta (Biodistretto del Chianti) for their appreciated administrative support during the B-Wine project. Special thanks to Francesco Primo Vaccari (CNR-IBE) for supporting the research and providing valuable insights that greatly contributed to its development. The authors wish to thank the four anonymous reviewers for their comments and suggestions, which contributed to improving the quality, readability, and completeness of the manuscript.
Conflicts of Interest
The authors declare no conflicts of interest.
Abbreviations
The following abbreviations are used in this manuscript:
| ABS/RC | Light energy absorption per reaction center |
| B | Biochar-amended parcels at vineyard sites |
| BD | Bulk density |
| BET | Brunauer–Emmett–Teller |
| C | Control parcels at vineyard sites |
| CEC | Cation exchange capacity |
| DIo/RC | Energy dissipation per reaction per reaction center |
| DOCG | Denomination of Controlled and Guaranteed Origin |
| ETo/RC | Electron transfer from the reduced plastoquinone QA− to cytochrome b6f per reaction center |
| ϕPo | Maximum quantum yield of primary photochemistry |
| HV | High-vigor vineyard |
| NDVI | Normalized Difference Vegetation Index |
| NIR | Near-infrared |
| Ksat | Saturated hydraulic conductivity |
| LV | Low-vigor vineyard |
| ψEo | Probability of electron transfer beyond QA− |
| PIabs | Potential performance index |
| PItot | Total performance index |
| PSR | Rural development program |
| REo/RC | Electron transport up to the final acceptors of the PSI per reaction center |
| SA | Badia a Coltibuono experimental vineyard site |
| SB | Corzano e Paterno experimental vineyard site |
| SC | Fèlsina experimental vineyard site |
| TOC | Total organic carbon |
| TRo/RC | Trapping phase of light energy per reaction center |
| UAV | Unmanned aerial vehicle |
References
- Intergovernmental Panel on Climate Change (IPCC). Climate Change 2021—The Physical Science Basis; Cambridge University Press: Cambridge, UK, 2023. [Google Scholar]
- Morales-Castilla, I.; de Cortázar-Atauri, I.G.; Cook, B.I.; Lacombe, T.; Parker, A.; Van Leeuwen, C.; Nicholas, K.A.; Wolkovich, E.M. Diversity buffers winegrowing regions from climate change losses. Proc. Natl. Acad. Sci. USA 2020, 117, 2864–2869. [Google Scholar] [CrossRef]
- Mozell, M.R.; Thach, L. The Impact of Climate Change on the Global Wine Industry: Challenges & Solutions. Wine Econ. Policy 2014, 3, 81–89. [Google Scholar] [CrossRef]
- Van Leeuwen, C.; Sgubin, G.; Bois, B.; Ollat, N.; Swingedouw, D.; Zito, S.; Gambetta, G.A. Climate Change Impacts and Adaptations of Wine Production. Nat. Rev. Earth Environ. 2024, 5, 258–275. [Google Scholar] [CrossRef]
- Van Leeuwen, C.; Destrac-Irvine, A.; Dubernet, M.; Duchêne, E.; Gowdy, M.; Marguerit, E.; Pieri, P.; Parker, A.; De Rességuier, L.; Ollat, N. An Update on the Impact of Climate Change in Viticulture and Potential Adaptations. Agronomy 2019, 9, 514. [Google Scholar] [CrossRef]
- Alba, V.; Russi, A.; Caputo, A.R.; Gentilesco, G. Climate Change and Viticulture in Italy: Historical Trends and Future Scenarios. Atmosphere 2024, 15, 885. [Google Scholar] [CrossRef]
- Alikadic, A.; Pertot, I.; Eccel, E.; Dolci, C.; Zarbo, C.; Caffarra, A.; De Filippi, R.; Furlanello, C. The Impact of Climate Change on Grapevine Phenology and the Influence of Altitude: A Regional Study. Agric. For. Meteorol. 2019, 271, 73–82. [Google Scholar] [CrossRef]
- Ewing-Mulligan, M.; McCarthy, E. Wine for Dummies, 2nd ed.; Hungry Minds, Inc., Ed.; Hungry Minds, Inc.: New York, NY, USA, 2001. [Google Scholar]
- Varia, F.; Macaluso, D.; Agosta, I.; Spatafora, F.; Guccione, G.D. Transitioning towards Organic Farming: Perspectives for the Future of the Italian Organic Wine Sector. Sustainability 2021, 13, 2815. [Google Scholar] [CrossRef]
- Baronti, S.; Magno, R.; Maienza, A.; Montagnoli, A.; Ungaro, F.; Vaccari, F.P. Long Term Effect of Biochar on Soil Plant Water Relation and Fine Roots: Results after 10 Years of Vineyard Experiment. Sci. Total Environ. 2022, 851, 158225. [Google Scholar] [CrossRef] [PubMed]
- García-Jaramillo, M.; Meyer, K.M.; Phillips, C.L.; Acosta-Martínez, V.; Osborne, J.; Levin, A.D.; Trippe, K.M. Biochar Addition to Vineyard Soils: Effects on Soil Functions, Grape Yield and Wine Quality. Biochar 2021, 3, 565–577. [Google Scholar] [CrossRef]
- Baronti, S.; Vaccari, F.P.; Miglietta, F.; Calzolari, C.; Lugato, E.; Orlandini, S.; Pini, R.; Zulian, C.; Genesio, L. Impact of Biochar Application on Plant Water Relations in Vitis vinifera (L.). Eur. J. Agron. 2014, 53, 38–44. [Google Scholar] [CrossRef]
- Blanco-Canqui, H. Biochar and Soil Physical Properties. Soil Sci. Soc. Am. J. 2017, 81, 687–711. [Google Scholar] [CrossRef]
- Phillips, C.L.; Light, S.E.; Gollany, H.T.; Chiu, S.; Wanzek, T.; Meyer, K.; Trippe, K.M. Can Biochar Conserve Water in Oregon Agricultural Soils? Soil Tillage Res. 2020, 198, 104525. [Google Scholar] [CrossRef]
- Wei, B.; Peng, Y.; Lin, L.; Zhang, D.; Ma, L.; Jiang, L.; Li, Y.; He, T.; Wang, Z. Drivers of Biochar-Mediated Improvement of Soil Water Retention Capacity Based on Soil Texture: A Meta-Analysis. Geoderma 2023, 437, 116591. [Google Scholar] [CrossRef]
- Han, L.; Lu, C.; Chen, L.; Wang, F.; Chen, Q.; Gao, K.; Yu, Y.; Xu, C. Carbon Sequestration Potential of Biochar in Soil from the Perspective of Organic Carbon Structural Modification. Appl. Soil Ecol. 2024, 198, 105389. [Google Scholar] [CrossRef]
- Enebe, M.C.; Ray, R.L.; Griffin, R.W. The Impacts of Biochar on Carbon Sequestration, Soil Processes, and Microbial Communities: A Review. Biochar 2025, 7, 107. [Google Scholar] [CrossRef]
- Tsolis, V.; Barouchas, P. Biochar as Soil Amendment: The Effect of Biochar on Soil Properties Using VIS-NIR Diffuse Reflectance Spectroscopy, Biochar Aging and Soil Microbiology—A Review. Land 2023, 12, 1580. [Google Scholar] [CrossRef]
- Allen, R.M.; Laird, D.A. Quantitative Prediction of Biochar Soil Amendments by Near-Infrared Reflectance Spectroscopy. Soil Sci. Soc. Am. J. 2013, 77, 1784–1794. [Google Scholar] [CrossRef]
- Zanchin, A.; Cogato, A.; Sozzi, M.; Tomasi, D.; Marinello, F. Satellite Monitoring of Italian Vineyards and Spatio-Temporal Variability Assessment. AgriEngineering 2024, 6, 4107–4134. [Google Scholar] [CrossRef]
- Regione Toscana DataBase Pedologico. Available online: https://www502.regione.toscana.it/geoscopio/pedologia.html (accessed on 10 December 2025).
- Soil Survey Staff. Keys to Soil Taxonomy, 13th ed.; USDA-Natural Resources Conservation Service: Washington, DC, USA, 2022.
- SIR Toscana. Sistema Informativo Regionale Della Toscana. Available online: https://www.sir.toscana.it/ (accessed on 10 December 2025).
- QGIS Development Team. QGIS Geographic Information System; QGIS Software. Available online: https://www.qgis.org (accessed on 10 December 2025).
- Major, J. Guidelines on Practical Aspects of Biochar Application to Field Soil in Various Soil Management Systems. Int. Biochar Initiat. 2010, 8, 5–7. [Google Scholar]
- Food and Agriculture Organization of the United Nations; Intergovernmental Technical Panel on Soils. Recarbonizing Global Soils: A Technical Manual of Recommended Sustainable Soil Management; Food and Agriculture Organization of the United Nations: Rome, Italy, 2021. [Google Scholar]
- Walkley, A.B.I.A. An Examination of the Degtjareff Method for Determining Soil Organic Matter, and a Proposed Modification of the Chromic Acid Titration Method. Soil Sci. 1934, 37, 29–38. [Google Scholar] [CrossRef]
- ISO Standard No 10694:1995; Soil quality—Determination of organic and total carbon after dry combustion (elementary analysis). International Organization for Standardization: Geneva, Switzerland, 1995.
- ISO Standard No 10693:2014; Soil quality—Determination of carbonate content — Volumetric method. International Organization for Standardization: Geneva, Switzerland, 2014.
- Grossman, R.B.; Reinsch, T.G. The Solid Phase: Bulk Density and Linear Extensibility. In Methods of Soil Analysis: Part 4 Physical Methods; Wiley: Hoboken, NJ, USA, 2018; pp. 201–228. [Google Scholar]
- Amoozegar, A.; Warrick, A.W. Hydraulic Conductivity of Saturated Soils: Field Methods. In Methods of Soil Analysis: Part 1 Physical and Mineralogical Methods; Wiley: Hoboken, NJ, USA, 2018; pp. 735–770. [Google Scholar]
- Reynolds, W.D.; Elrick, D.E. Ponded Infiltration From a Single Ring: I. Analysis of Steady Flow. Soil Sci. Soc. Am. J. 1990, 54, 1233–1241. [Google Scholar] [CrossRef]
- Reynolds, W.D.; Eldrick, D.E.; Topp, G.C. A Reexamination of the Constant Head Well Permeameter Method for Measuring Saturated Hydraulic Conductivity Above the Water Table. Soil Sci. 1983, 136, 250–260. [Google Scholar] [CrossRef]
- Cichota, R.; Vogeler, I.; Snow, V.O.; Webb, T.H. Ensemble Pedotransfer Functions to Derive Hydraulic Properties for New Zealand Soils. Soil Res. 2013, 51, 94–111. [Google Scholar] [CrossRef]
- Guber, A.K.; Pachepsky, Y.A.; van Genuchten, M.T.; Rawls, W.J.; Simunek, J.; Jacques, D.; Nicholson, T.J.; Cady, R.E. Field-Scale Water Flow Simulations Using Ensembles of Pedotransfer Functions for Soil Water Retention. Vadose Zone J. 2006, 5, 234–247. [Google Scholar] [CrossRef]
- Padgett-Johnson, M.; Williams, L.E.; Walker, M.A. The Influence of Vitis Riparia Rootstock on Water Relations and Gas Exchange of Vitis vinifera Cv. Carignane Scion Under Non-Irrigated Conditions. Am. J. Enol. Vitic. 2000, 51, 137–143. [Google Scholar] [CrossRef]
- Scholander, P.F.; Bradstreet, E.D.; Hemmingsen, E.A.; Hammel, H.T. Sap Pressure in Vascular Plants: Negative hydrostatic pressure can be measured in plants. Science 1965, 148, 339–346. [Google Scholar] [CrossRef]
- Strasser, R.J.; Tsimilli-Michael, M.; Srivastava, A. Analysis of the Chlorophyll a Fluorescence Transient. In Chlorophyll a Fluorescence: A Signature of Photosynthesis; Springer: Dordrecht, The Netherlands, 2004; pp. 321–362. [Google Scholar]
- R Core Team. R: A Language and Environment for Statistical Computing; R Foundation for Statistical Computing: Vienna, Austria, 2024. [Google Scholar]
- Snijders, T.A.B.; Bosker, R. Multilevel Analysis: An Introduction to Basic and Advanced Multilevel Modeling; Sage Publications: Thousand Oaks, CA, USA, 2011. [Google Scholar]
- Serrano, J.; Mau, V.; Rodrigues, R.; Paixão, L.; Shahidian, S.; da Silva, J.M.; Paniagua, L.L.; Moral, F.J. Definition and Validation of Vineyard Management Zones Based on Soil Apparent Electrical Conductivity and Altimetric Survey. Environments 2023, 10, 117. [Google Scholar] [CrossRef]
- Ortuani, B.; Mayer, A.; Bianchi, D.; Sona, G.; Crema, A.; Modina, D.; Bolognini, M.; Brancadoro, L.; Boschetti, M.; Facchi, A. Effectiveness of Management Zones Delineated from UAV and Sentinel-2 Data for Precision Viticulture Applications. Remote Sens. 2024, 16, 635. [Google Scholar] [CrossRef]
- Vallarino, G.; Genzano, N.; Gianinetto, M. The Potential of Deep Learning for Studying Wilderness with Copernicus Sentinel-2 Data: Some Critical Insights. Land 2025, 14, 2333. [Google Scholar] [CrossRef]
- Pascucci, S.; Carfora, M.F.; Palombo, A.; Pignatti, S.; Casa, R.; Pepe, M.; Castaldi, F. A Comparison between Standard and Functional Clustering Methodologies: Application to Agricultural Fields for Yield Pattern Assessment. Remote Sens. 2018, 10, 585. [Google Scholar] [CrossRef]
- Pastonchi, L.; Di Gennaro, S.F.; Toscano, P.; Matese, A. Comparison between Satellite and Ground Data with UAV-Based Information to Analyse Vineyard Spatio-Temporal Variability. OENO One 2020, 54, 919–934. [Google Scholar] [CrossRef]
- Ghilardi, F.; Virano, A.; Prandi, M.; Borgogno-Mondino, E. Zonation of a Viticultural Territorial Context in Piemonte (NW Italy) to Support Terroir Identification: The Role of Pedological, Topographical and Climatic Factors. Land 2023, 12, 647. [Google Scholar] [CrossRef]
- Mucalo, A.; Matić, D.; Morić-Španić, A.; Čagalj, M. Satellite Solutions for Precision Viticulture: Enhancing Sustainability and Efficiency in Vineyard Management. Agronomy 2024, 14, 1862. [Google Scholar] [CrossRef]
- Di Gennaro, S.; Dainelli, R.; Palliotti, A.; Toscano, P.; Matese, A. Sentinel-2 Validation for Spatial Variability Assessment in Overhead Trellis System Viticulture Versus UAV and Agronomic Data. Remote Sens. 2019, 11, 2573. [Google Scholar] [CrossRef]
- Vélez, S.; Rançon, F.; Barajas, E.; Brunel, G.; Rubio, J.A.; Tisseyre, B. Potential of Functional Analysis Applied to Sentinel-2 Time-Series to Assess Relevant Agronomic Parameters at the within-Field Level in Viticulture. Comput. Electron. Agric. 2022, 194, 106726. [Google Scholar] [CrossRef]
- Gross, A.; Bromm, T.; Glaser, B. Soil Organic Carbon Sequestration after Biochar Application: A Global Meta-Analysis. Agronomy 2021, 11, 2474. [Google Scholar] [CrossRef]
- Kingston, K.; Pratt, C.; Mackay, B.; Petrie, P.R.; Ellis, J.; Xu, Z. The Potential of Integrating Biochar and Stable Isotope Technologies for Regenerative Viticulture under Climate Change. J. Soils Sediments 2025, 25, 2916–2930. [Google Scholar] [CrossRef]
- Johnstone, I.; Fuss, S.; Walsh, N.; Höglund, R. Carbon Markets for Carbon Dioxide Removal. Clim. Policy 2025, 1–8. [Google Scholar] [CrossRef]
- Chiaramonti, D.; Lehmann, J.; Berruti, F.; Giudicianni, P.; Sanei, H.; Masek, O. Biochar Is a Long-Lived Form of Carbon Removal, Making Evidence-Based CDR Projects Possible. Biochar 2024, 6, 81. [Google Scholar] [CrossRef]
- Bolan, S.; Sharma, S.; Mukherjee, S.; Kumar, M.; Rao, C.S.; Nataraj, K.C.; Singh, G.; Vinu, A.; Bhowmik, A.; Sharma, H.; et al. Biochar Modulating Soil Biological Health: A Review. Sci. Total Environ. 2024, 914, 169585. [Google Scholar] [CrossRef]
- Farrag, H.M. Effect of Applying Banana Waste Biochar on Soil Properties and Growth of Cultivated Plants in Sandy Soil. SVU-Int. J. Agric. Sci. 2023, 5, 54–66. [Google Scholar] [CrossRef]
- Lippi, P.; Mattii, G.B.; Cataldo, E. Biochar, Properties and Skills with a Focus on Implications for Vineyard Land and Grapevine Performance. Phyton 2025, 94, 33–64. [Google Scholar] [CrossRef]
- Joseph, S.D.; Camps-Arbestain, M.; Lin, Y.; Munroe, P.; Chia, C.H.; Hook, J.; Van Zwieten, L.; Kimber, S.; Cowie, A.; Singh, B.P.; et al. An Investigation into the Reactions of Biochar in Soil. Aust. J. Soil Res. 2010, 48, 501–515. [Google Scholar] [CrossRef]
- Prayogo, C.; Jones, J.E.; Baeyens, J.; Bending, G.D. Impact of Biochar on Mineralisation of C and N from Soil and Willow Litter and Its Relationship with Microbial Community Biomass and Structure. Biol. Fertil. Soils 2014, 50, 695–702. [Google Scholar] [CrossRef]
- Tusar, H.M.; Uddin, M.K.; Mia, S.; Suhi, A.A.; Wahid, S.B.A.; Kasim, S.; Sairi, N.A.; Alam, Z.; Anwar, F. Biochar-Acid Soil Interactions—A Review. Sustainability 2023, 15, 13366. [Google Scholar] [CrossRef]
- Kabir, E.; Kim, K.-H.; Kwon, E.E. Biochar as a Tool for the Improvement of Soil and Environment. Front. Environ. Sci. 2023, 11, 1324533. [Google Scholar] [CrossRef]
- Zhou, W.; Xing, S.; Wu, Y.; Zou, R.; Li, S.; Sun, X.; Zhang, H. Exploring the Effects of Biochar and Compost on Ameliorating Coastal Saline Soil. Agronomy 2025, 15, 2093. [Google Scholar] [CrossRef]
- López-Pérez, M.C.; Juárez-Maldonado, A.; Benavides-Mendoza, A.; González-Morales, S.; Pérez-Labrada, F. Aqueous Extract of Coconut Shell Biochar as a Pre-Germination Treatment Increases Seed Germination and Early Seedling Growth in Chiltepín Pepper (Capsicum annuum var. glabriusculum). Not. Bot. Horti Agrobot. Cluj Napoca 2023, 51, 13097. [Google Scholar] [CrossRef]
- Cataldo, E.; Fucile, M.; Mattii, G.B. A Review: Soil Management, Sustainable Strategies and Approaches to Improve the Quality of Modern Viticulture. Agronomy 2021, 11, 2359. [Google Scholar] [CrossRef]
- Blanco-Canqui, H. Does Biochar Application Alleviate Soil Compaction? Review and Data Synthesis. Geoderma 2021, 404, 115317. [Google Scholar] [CrossRef]
- Acharya, B.S.; Dodla, S.; Wang, J.J.; Pavuluri, K.; Darapuneni, M.; Dattamudi, S.; Maharjan, B.; Kharel, G. Biochar Impacts on Soil Water Dynamics: Knowns, Unknowns, and Research Directions. Biochar 2024, 6, 34. [Google Scholar] [CrossRef]
- Esmaeelnejad, L.; Shorafa, M.; Gorji, M.; Hosseini, S. mossa Impacts of Woody Biochar Particle Size on Porosity and Hydraulic Conductivity of Biochar-Soil Mixtures: An Incubation Study. Commun. Soil Sci. Plant Anal. 2017, 48, 1710–1718. [Google Scholar] [CrossRef]
- Igalavithana, A.D.; Mandal, S.; Niazi, N.K.; Vithanage, M.; Parikh, S.J.; Mukome, F.N.D.; Rizwan, M.; Oleszczuk, P.; Al-Wabel, M.; Bolan, N.; et al. Advances and Future Directions of Biochar Characterization Methods and Applications. Crit. Rev. Environ. Sci. Technol. 2017, 47, 2275–2330. [Google Scholar] [CrossRef]
- Karhu, K.; Mattila, T.; Bergström, I.; Regina, K. Biochar Addition to Agricultural Soil Increased CH4 Uptake and Water Holding Capacity—Results from a Short-Term Pilot Field Study. Agric. Ecosyst. Environ. 2011, 140, 309–313. [Google Scholar] [CrossRef]
- Atkinson, C.J. How Good Is the Evidence That Soil-applied Biochar Improves Water-holding Capacity? Soil Use Manag. 2018, 34, 177–186. [Google Scholar] [CrossRef]
- Bohara, H.; Dodla, S.; Wang, J.J.; Darapuneni, M.; Acharya, B.S.; Magdi, S.; Pavuluri, K. Influence of Poultry Litter and Biochar on Soil Water Dynamics and Nutrient Leaching from a Very Fine Sandy Loam Soil. Soil Tillage Res. 2019, 189, 44–51. [Google Scholar] [CrossRef]
- Duong, V.T.; Khanh, N.M.; Nguyen, N.T.H.; Phi, N.N.; Duc, N.T.; Xo, D.H. Impact of biochar on the water holding capacity and moisture of basalt and grey soil. Ho Chi Minh City Open Univ. J. Sci.—Eng. Technol. 2017, 7, 36–43. [Google Scholar]
- Bongiovanni, M. 4.1 Fruit Trees and Vines. In Crop Yield Response to Water; FAO Irrigation and Drainage Paper 66; Food and Agriculture Organization of the United Nations: Rome, Italy, 2012; p. 297. [Google Scholar]
- Genesio, L.; Miglietta, F.; Baronti, S.; Vaccari, F.P. Biochar Increases Vineyard Productivity without Affecting Grape Quality: Results from a Four Years Field Experiment in Tuscany. Agric. Ecosyst. Environ. 2015, 201, 20–25. [Google Scholar] [CrossRef]
- Van Leeuwen, C.; Trégoat, O.; Choné, X.; Bois, B.; Pernet, D.; Gaudillère, J.-P. Vine Water Status Is a Key Factor in Grape Ripening and Vintage Quality for Red Bordeaux Wine. How Can It Be Assessed for Vineyard Management Purposes? OENO One 2009, 43, 121. [Google Scholar] [CrossRef]
- Deloire, A.; Carbonneau, A.; Wang, Z.; Ojeda, H. Vine and Water: A Short Review. OENO One 2004, 38, 1. [Google Scholar] [CrossRef]
- Damásio, M.; Barbosa, M.; Deus, J.; Fernandes, E.; Leitão, A.; Albino, L.; Fonseca, F.; Silvestre, J. Can Grapevine Leaf Water Potential Be Modelled from Physiological and Meteorological Variables? A Machine Learning Approach. Plants 2023, 12, 4142. [Google Scholar] [CrossRef]
- Pellegrino, A.; Lebon, E.; Voltz, M.; Wery, J. Relationships between Plant and Soil Water Status in Vine (Vitis vinifera L.). Plant Soil 2005, 266, 129–142. [Google Scholar] [CrossRef]
- Gu, B.W.; Yang, J.F.; Lu, X.L.; Wu, Y.H.; Li, N.; Liu, N.; An, N.; Han, X.R. Effects of Continuous Application of Biochar on Chlorophyll Fluorescence Characteristics of Peanut at Different Growth Stages. Sci. Agric. Sin. 2021, 54, 4552–4561. [Google Scholar] [CrossRef]
- Wilhelm, C.; Selmar, D. Energy Dissipation Is an Essential Mechanism to Sustain the Viability of Plants: The Physiological Limits of Improved Photosynthesis. J. Plant Physiol. 2011, 168, 79–87. [Google Scholar] [CrossRef] [PubMed]
- Demmig-Adams, B.; Adams, W.W. Photoprotection in an Ecological Context: The Remarkable Complexity of Thermal Energy Dissipation. New Phytol. 2006, 172, 11–21. [Google Scholar] [CrossRef]
- Zhu, Z.; Zhang, H.; Tian, H.; Chai, G.; Muhammad, R.; Wang, Q.; Liang, B.; Wu, X. Comprehensive Analysis of the Effects on Photosynthesis and Energy Balance in Tomato Leaves under Magnesium Deficiency. Plant Physiol. Biochem. 2025, 222, 109671. [Google Scholar] [CrossRef]
- Abadía, J. Leaf Responses to Fe Deficiency: A Review. J. Plant Nutr. 1992, 15, 1699–1713. [Google Scholar] [CrossRef]
- Ciompi, S.; Gentili, E.; Guidi, L.; Soldatini, G.F. The Effect of Nitrogen Deficiency on Leaf Gas Exchange and Chlorophyll Fluorescence Parameters in Sunflower. Plant Sci. 1996, 118, 177–184. [Google Scholar] [CrossRef]
- Laing, W.; Greer, D.; Sun, O.; Beets, P.; Lowe, A.; Payn, T. Physiological Impacts of Mg Deficiency in Pinus radiata: Growth and Photosynthesis. New Phytol. 2000, 146, 47–57. [Google Scholar] [CrossRef]
- Kalaji, H.M.; Oukarroum, A.; Alexandrov, V.; Kouzmanova, M.; Brestic, M.; Zivcak, M.; Samborska, I.A.; Cetner, M.D.; Allakhverdiev, S.I.; Goltsev, V. Identification of Nutrient Deficiency in Maize and Tomato Plants by in Vivo Chlorophyll a Fluorescence Measurements. Plant Physiol. Biochem. 2014, 81, 16–25. [Google Scholar] [CrossRef]
- Teng, X.; Huang, D.; Zhi, Y.; Li, Y.; Dong, D.; Wu, X.; Wang, Y.; Jiang, Z.; Huang, H.; Tang, Y.; et al. Effects of Biochar on Soil Properties as Well as Available and TCLP-Extractable Cu Contents: A Global Meta-Analysis. Sci. Rep. 2025, 15, 32853. [Google Scholar] [CrossRef]
- Chen, D.; Liu, X.; Bian, R.; Cheng, K.; Zhang, X.; Zheng, J.; Joseph, S.; Crowley, D.; Pan, G.; Li, L. Effects of Biochar on Availability and Plant Uptake of Heavy Metals—A Meta-Analysis. J. Environ. Manag. 2018, 222, 76–85. [Google Scholar] [CrossRef]
- Barón, M.; Arellano, J.B.; Gorgé, J.L. Copper and Photosystem II: A Controversial Relationship. Physiol. Plant. 1995, 94, 174–180. [Google Scholar] [CrossRef]
- Yruela, I.; Alfonso, M.; Barón, M.; Picorel, R. Copper Effect on the Protein Composition of Photosystem II. Physiol. Plant. 2000, 110, 551–557. [Google Scholar] [CrossRef]
- Fu, C.; Li, M.; Zhang, Y.; Zhang, Y.; Yan, Y.; Wang, Y. Morphology, Photosynthesis, and Internal Structure Alterations in Field Apple Leaves under hidden and acute zinc deficiency. Sci. Hortic. 2015, 193, 47–54. [Google Scholar] [CrossRef]
- Lobell, D.B.; Asner, G.P. Moisture Effects on Soil Reflectance. Soil Sci. Soc. Am. J. 2002, 66, 722–727. [Google Scholar] [CrossRef]
- Castaldi, F.; Stenberg, B.; Liebisch, F.; Metzger, K.; Ben-Dor, E.; Knadel, M.; Koganti, T.; Wetterlind, J.; Barbetti, R.; Debaene, G.; et al. Estimating Soil Organic Carbon Using Field VNIR-SWIR Spectroscopy and Existing Soil Spectral Libraries: Mitigating Heterogeneity, Roughness and Moisture Effects. Smart Agric. Technol. 2025, 12, 101353. [Google Scholar] [CrossRef]
- Knadel, M.; Castaldi, F.; Barbetti, R.; Ben-Dor, E.; Gholizadeh, A.; Lorenzetti, R. Mathematical Techniques to Remove Moisture Effects from Visible–near-Infrared–Shortwave-Infrared Soil Spectra—Review. Appl. Spectrosc. Rev. 2023, 58, 629–662. [Google Scholar] [CrossRef]
- Gholamahmadi, B.; Ferreira, C.S.S.; Gonzalez-Pelayo, O.; Bastos, A.C.; Verheijen, F.G.A. Soil Conservation Benefits of Biochar in Mediterranean Vineyards: Enhancing the Soil Sponge Function and Mitigating Water Erosion. Biochar 2025, 7, 106. [Google Scholar] [CrossRef]
- Li, B.; Guo, Y.; Liang, F.; Liu, W.; Wang, Y.; Cao, W.; Song, H.; Chen, J.; Guo, J. Global Integrative Meta-Analysis of the Responses in Soil Organic Carbon Stock to Biochar Amendment. J. Environ. Manag. 2024, 351, 119745. [Google Scholar] [CrossRef] [PubMed]
- Sun, W.; Li, Y.; Xu, Z.; Bai, Y.; Bai, S.H. Biochar Application for Enhancing Water and Nitrogen Use Efficiency of Understory Acacia Species in a Suburban Native Forest Subjected to Nitrogen Deposition in Southeast Queensland. Plant Soil 2024, 504, 607–624. [Google Scholar] [CrossRef]


Disclaimer/Publisher’s Note: The statements, opinions and data contained in all publications are solely those of the individual author(s) and contributor(s) and not of MDPI and/or the editor(s). MDPI and/or the editor(s) disclaim responsibility for any injury to people or property resulting from any ideas, methods, instructions or products referred to in the content. |
© 2026 by the authors. Licensee MDPI, Basel, Switzerland. This article is an open access article distributed under the terms and conditions of the Creative Commons Attribution (CC BY) license.