Article

A Comparison of Tree Segmentation Methods for Savanna Tree Extraction from TLS Point Clouds

1
Department for Earth Observation, Friedrich Schiller University Jena, Löbdergraben 32, 07743 Jena, Germany
2
Unit of Computing Sciences, Tampere University, Korkeakoulunkatu 1, 33720 Tampere, Finland
3
Department of Physical Geography, Friedrich Schiller University Jena, Löbdergraben 32, 07743 Jena, Germany
4
Savanna and Grassland Research Unit, Scientific Services, South African National Parks (SANParks), Skukuza 1350, South Africa
5
School of Natural Resource Management, Nelson Mandela University, George Campus, George 6530, South Africa
6
Department of Organismic and Evolutionary Biology, Harvard University, Cambridge, MA 02138, USA
*
Author to whom correspondence should be addressed.
Land 2025, 14(9), 1761; https://doi.org/10.3390/land14091761 (registering DOI)
Submission received: 17 April 2025 / Revised: 21 August 2025 / Accepted: 26 August 2025 / Published: 30 August 2025
(This article belongs to the Special Issue Observation, Monitoring and Analysis of Savannah Ecosystems)

Abstract

Detecting trees accurately from terrestrial laser scanning (TLS) point clouds is crucial for processing terrestrial LiDAR data in individual tree analyses. Due to the heterogeneity of savanna ecosystems, our understanding of how various segmentation methods perform on savanna trees remains limited. Therefore, we compared two segmentation algorithms based on the ecological theory of resource distribution, which enables the prediction of the branching geometry of plants. This approach suggests that the shortest path along the vegetation from a point on the tree to the ground remains within the same tree. The algorithms were tested on a 15.2 ha plot scanned at 0.025° resolution during the dry season, using a Riegl VZ1000 Terrestrial Laser Scanner (TLS) in October 2019 at the Skukuza Flux Tower in Kruger National Park, South Africa. Individual tree segmentation was performed on the cloud using the comparative shortest-path (CSP) algorithm, implemented in LiDAR 360 (v 5.4), and the shortest path-based tree isolation method (SPBTIM), implemented in MATLAB (R2022a). The accuracy of each segmentation method was validated using 125 trees that were segmented and manually edited. Results were evaluated using recall (r), precision (p), and the F-score (F). Both algorithms detected (recall) 90% of the trees. The SPBTIM achieved a precision of 91%, slightly higher than the CSP’s 90%. Overall, both methods demonstrated an F-score of 0.90, indicating equal segmentation accuracy. Our findings suggest that both techniques can reliably segment savanna trees, with no significant difference between them in practical application. These results provide valuable insights into the suitability of each method for savanna ecosystems, which is essential for ecological monitoring and efficient TLS data processing workflows.

1. Introduction

Savanna ecosystems are tree–grass communities with a herbaceous layer and an irregular woody cover [1]. Savannas are globally of ecological importance, covering approximately 20% of the Earth’s land surface, 50% of the African continent, and contributing around 30% of terrestrial net primary productivity [2,3,4]. Trees form the major structural component of savanna ecosystems, providing habitat and regulating biogeochemical processes, including atmospheric interactions and carbon and water fluxes [5]. Changes in tree cover and structure are important for savanna ecosystem management. Therefore, it is crucial to accurately monitor tree populations in these ecosystems. Tree population studies using field techniques in the savanna have been conducted [6,7], but they are limited in that they are expensive and often inadequate for large geographical areas [8]. Thus, remote sensing techniques, which are fast and cost-effective methods for mapping vegetation, are preferred [9]. Accurately mapping individual trees in savanna ecosystems provides numerous benefits for effective ecosystem management.
Several modern geomatics technologies exist for forest inventories and management and include terrestrial laser scanning (TLS), unmanned aerial vehicles (UAVs) technology, mobile laser scanning (MLS), and aerial laser scanning (ALS) [10]. Depending on the type of forest and tree densities, these technologies offer different advantages and disadvantages. Notably, airborne offers the advantage of covering large spatial extents [11] but can be expensive for smaller areas and is limited in understory detection [10]. Drone technology offers a fast approach but is limited in stem detection [12], while mobile devices are constrained in deriving accurate canopy and height attributes [13]. Terrestrial laser scanning (TLS) remote sensing offers detailed information on vegetation structure [9,14].
Terrestrial laser scanning (TLS) has emerged as a promising tool for measuring 3D vegetation structure with better resolution and precision [15,16]. TLS, combined with automatic data processing techniques, bridges the gap between field inventories and gives accurate information on individual trees [17,18]. More so in open savannas, where trees are sparsely distributed, TLS is an efficient tool for characterising vegetation [19], allowing for the creation and recording of dense point clouds with detailed branching structure [20]. However, quantifying tree-scale structure from TLS point clouds requires segmentation, a process whereby LiDAR points are classified into individual trees, which is a fundamental step in point cloud processing [21,22,23]. Savanna ecosystems present an additional challenge in that they are heterogeneous and characterised by irregular, multi-stemmed trees with variable canopy shapes and a complicated understory of shrubs and grasses [24], which pose a challenge in segmenting individual trees in these environments.
Several methods exist for segmenting trees from LiDAR data; however, they are limited, especially in complex forest environments with intersecting crowns, and often yield unsatisfactory results [25,26]. However, metabolic ecology principles have recently been integrated into remote sensing algorithms to enhance tree segmentation [25]. Liu et al. (2021) [26] employed a trunk-growth method based on morphological theory in a natural forest in China. The algorithm segments the tree by first identifying the trunk, and then uses the nearest branch and leaf points to segment the entire tree. High accuracies were achieved, with an overall F-score of 0.96, demonstrating the advantages of plant morphology theory for tree segmentation. Williams et al. (2020) [27] tested the multi-class graph cut (MCGC) algorithm, which integrates local three-dimensional geometry and density information with crown allometries to segment individual tree crowns from airborne LiDAR data. The algorithm identified trees in the upper and intermediate canopies but failed to segment small trees beneath the canopy [27]. Swetnam and Falk (2014) [28] developed a variable-area local maxima (VLM) algorithm that incorporates predictions from metabolic scaling theory to reduce the frequency of commission errors in airborne LiDAR point clouds. Variation in canopy size, height, age, and competition was accounted for by incorporating allometric relationships, thus increasing segmentation accuracy [28]. Xin et al. (2021) [25] developed a metabolic theory-based algorithm for detecting individual trees and segmenting their crowns from airborne LiDAR data. The method is based on the reasoning that plants minimise the distance from roots to leaves using unscaled and scaled transport distances [25]. The algorithm demonstrated high accuracy in detecting individual crowns in a complex forest, with a recall of 1.00, a precision of 0.96, and an F-score of 0.98 [25]. In this study, we test two algorithms, the comparative shortest path (CSP) algorithm developed by Tao et al. (2015) [20]. The algorithm detects tree crowns by identifying trunks and then applying the principle of shortest paths to delineate the crown structure. This method has shown high accuracy in segmenting trees from terrestrial and mobile LiDAR data. The CSP algorithm was also used as a comparison algorithm to the segmentation based on hierarchical strategy (SHS) on point clouds acquired using a backpack LiDAR in a mixed broadleaf forest [29]. It was observed that the CSP had overall segmentation accuracies (F-scores) of 0.96, 0.99, and 0.69 in tree plots with different tree densities [25]. The CSP algorithm is compared with the shortest path based tree isolation method (SPBTIM) developed by Raumonen et al. (2021) [30]. The method utilises shortest path computations constrained by height from the ground [30]. The method was tested on a 4-hectare tropical forest plot, with TLS data used for comparison [30]. Both methods were tested in more dense forest types and achieved reasonable results. In the case of this study, where the two methods are tested in an open savanna with less tree density, we would expect the algorithms to perform better, which is why these algorithms were selected for comparison.
Selecting a suitable method is crucial for achieving accurate and efficient results. The CSP and the SPBTIM were chosen for comparison because they are both algorithms based on the metabolic ecological theory, which facilitates accurate tree segmentation. They have been tested in various forest types and have demonstrated accuracy, revealing both advantages and disadvantages. Given the heterogeneity of savanna ecosystems, our understanding of how different segmentation methods perform on savanna trees remains inadequate. Therefore, this study’s findings will provide insights into the suitability of various segmentation methods for savanna ecosystems, which is essential for ecological monitoring and conservation efforts, as well as efficient TLS data processing workflows. In addition, the study quantifies how each method recovers the under- and over-segmented trees compared to the reference by using seven tree-level metrics derived from the quantitative structural models (QSMs). Lastly, plot-level metrics were quantified for the two methods, including the number of other segments in the plot, such as shrubs, felled trees, and branches, and dead and damaged trees.
This study aims to evaluate and compare the performance of the comparative shortest path (CSP) algorithm developed by Tao et al. (2015) [20] and implemented in LiDAR360 (v5.4) software and a shortest path based tree isolation method (SPBTIM) developed by Raumonen et al. (2021) [30] and implemented in MATLAB (R2022a) software for extracting individual trees from terrestrial LiDAR data in savanna ecosystems. The main objectives of the study were quantifying the accuracy of each method in correctly segmenting savanna trees, comparing the volume extent of the trees under and over-segmented by both segmentation methods using occupied voxel count, comparing the under- and over-segmented trees by both methods and quantify how much more the other method recovered the tree than the reference trees in terms of tree structural parameters derived with QSMs and finally comparing the methods in the plot-level metrics. The manuscript is organized as follows: Section 2 outlines the methods, while Section 3 details the study’s main results. Section 4 and Section 5 present the discussion points and conclusions derived from the research.

2. Materials and Methods

2.1. Study Area

The study was conducted in the Kruger National Park, South Africa (23°98′ S, 31°55′ E) (Figure 1) and focused on a 15.2 ha test site around the Skukuza flux tower (marked in grey-study area). The landscape on site is relatively flat at an altitude of 365 m a.s.l. It is dominated by Combretum, Sclerocarya, Vachellia, and Senegalia species [31,32], with heights ranging from 2 to 15 m [33]. The region is semi-arid, with rainfall occurring from late October to February, resulting in an annual mean rainfall of approximately 550 mm/year [34]. The study area’s soil is derived from granite geology and is characterized as nutrient-poor, coarse-textured, sandy soil [34]. Scanning was conducted after the drought of 2015 and 2016, and enhanced herbivory by elephants [33].

2.2. 3D Vegetation Point Cloud

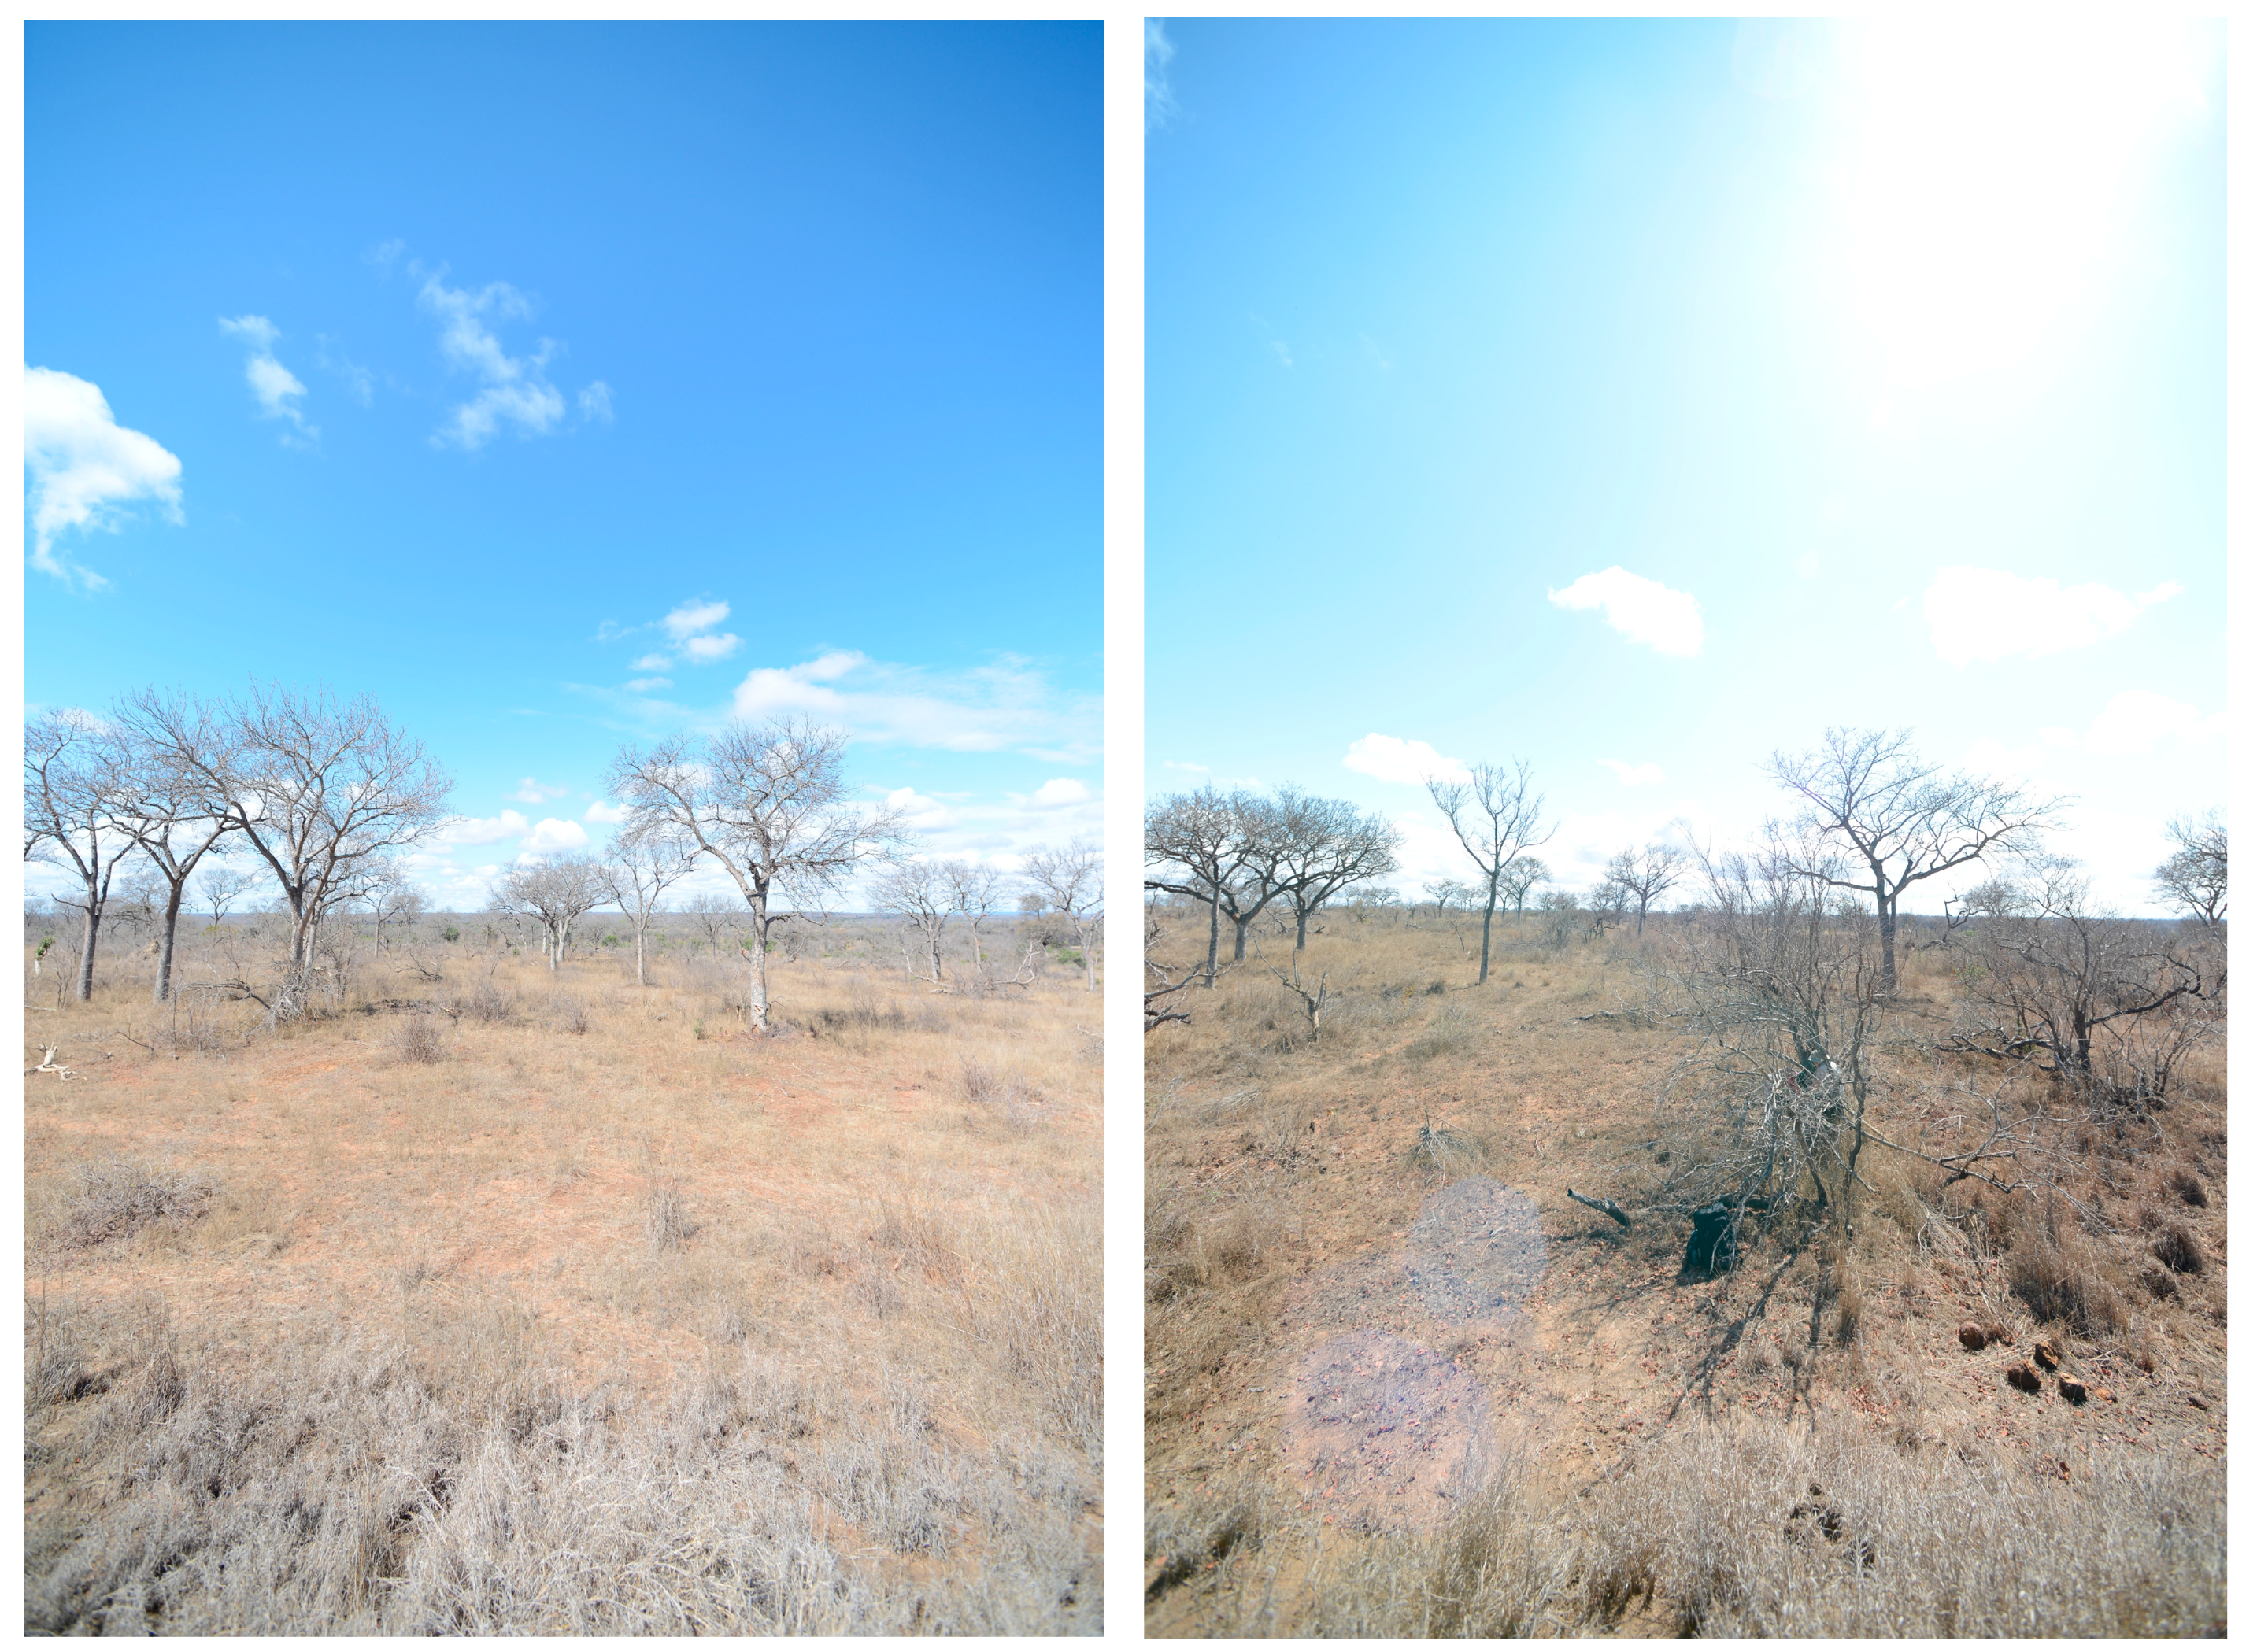
We mapped the study area using multiple-return terrestrial LiDAR in October 2019, during the dry season, when most vegetation had dropped its leaves (i.e., leaf-off conditions) (see Figure 2), with a Riegl VZ 1000 laser scanner [35] (RIEGL Laser Measurement Systems GmbH, Horn, Austria). Scanning was conducted on a clear day with minimal wind conditions. The TLS was placed on termite mounts, and then data was collected at 2 m above ground using an angular sampling of 0.025° and a pulse repetition rate of 300 kHz. TLS scans were obtained from 32 scan positions, arranged in a circular pattern around the flux tower, utilizing a total of 81 tie points for precise georeferencing of the scans based on a differential global navigation satellite system (dGNSS) linked to the South African Trignet of permanently receiving stations.

2.3. Pre-Processing of the TLS Point Cloud Data

The point clouds acquired at the 32 scan positions were co-registered using the RISCAN PRO package [36]. The final co-registration accuracy was 0.03 m. The registered point cloud was georeferenced to the WGS84/UTM 36S coordinate system and filtered to remove noise and isolated points. The co-registered point cloud was exported to LAS format for segmentation in LiDAR 360 (v 5.4) software (Green Valley International© 2022, Berkeley, CA, USA) and to TXT format for segmentation in MATLAB (R2022a). The two segmentation methods used for extracting savanna trees are described below.

2.4. Tree Segmentation- Comparative Shortest Path Algorithm

The Comparative Shortest-Path algorithm (CSP) was developed by Tao et al. (2015) [20] and was inspired by ecological basis and classical metabolic ecology theory. The process of individual tree segmentation using CSP comprises three significant parts: point cloud normalisation, trunk detection, and crown segmentation [20]. A comprehensive explanation of the comparative shortest path algorithm can be found in Tao et al. (2015) [20]. The advantages and disadvantages of the segmentation algorithm are shown in Table 1 below:
Individual tree segmentation was then applied to the 3D point cloud data using the CSP algorithm implemented in LiDAR 360 (v 5.4), with a minimum tree height of 2 m, a minimum diameter at breast height (DBH) of 2 cm, and a minimum cluster size of 500. Since the CSP is implemented using a graphical user interface (GUI) in LiDAR 360 software, a screenshot of the process is provided in the Supplementary Materials. The individual tree attributes are automatically calculated during the segmentation process. The individual trees are then extracted by Tree ID using the Extract by Tree ID tool. A total of 1845 segments were derived from the 15.2 ha scanned plot. Segmentation editing was not conducted, and the initial results of the automatic segmentation were used for comparison. A segment is a subset of points grouped together to represent a meaningful structural component of the tree [37], and it comprises complete trees, combinations of tree parts, or parts from different trees, shrubs, and branches. Therefore, segments were classified into trees and other segments, the latter comprising branches, fallen trees, shrubs, and standing trees (damaged, small, and dead).

2.5. Tree Segmentation—A Shortest Path-Based Tree Isolation Method

Raumonen et al. (2021) [30] developed the shortest path-based tree isolation method (SPBTIM), an algorithm that calculates the shortest paths along graphs. The algorithm is based on the reasoning that, despite overlapping canopies and touching branches of any given tree in a forest, the shortest path along the vegetation from a point on the tree to the ground remains on the same tree [30]. The method is designed to overcome the difficulty of occlusions that disconnect paths by imposing a simple restriction on path length based on the height of the starting point and reconnecting some of those disconnected paths [30]. A complete, comprehensive explanation of the tree isolation algorithm can be found in Raumonen et al. (2021) [30]. The advantages and disadvantages of the SPBTIM algorithm are summarised in Table 2 below:
Individual tree segmentation was then applied to the 3D point cloud data using the shortest path tree isolation-based algorithm implemented in MATLAB (v 2022a), using a PatchDiam of 0.15, BallRad of 0.20, BaseHeight of 1.5, and a Base expand of 4. The scripts and TLS data have been provided in the Supplementary Materials. The individual trees were extracted using their unique Tree ID. A total of 1438 segments were derived from the 15.2 ha scanned plot. As with the CSP algorithm, segmentation editing was not conducted, and the initial results of the automatic segmentation were used for comparison.

2.6. Accuracy Assessment

After running the two segmentation algorithms on the scanned point cloud, we utilised 125 reference trees, which were extracted semi-automatically and manually edited from the 15.2-hectare plot. The reference trees were automatically segmented and then manually edited to correct for any over- and under-segmentation in LiDAR 360 (v5.4) software. We overlaid the segments from the two segmentation methods with the reference trees in CloudCompare (v2.12.4) [38] to assess the segmentation quality of both algorithms. A tree was considered correctly segmented when all the points associated with that tree were assigned a unique tree ID, accurately distinguished and isolated from its surroundings, with a clearly defined trunk and crown structure, without any missing gaps in the major part of the tree [22], and perfectly overlaid with the reference tree. Three types of tree segments and accuracy are produced. When a tree is correctly segmented, it is called a true positive (TP); when a tree is not segmented and assigned to a neighbouring tree, it is called a false negative (FN); and finally, when a tree does not exist but is segmented, it is called a false positive (FP) [21,22,39,40]. The number of true positives, false negatives, and false positives is the parameters that govern perfect, under, and over-segmentation [39]. Undersegmentation means that a segment contains a significant part of more than one tree, and oversegmentation refers to the association of more than one segment with the reference tree [41,42]. After identifying the number of true positives, false negatives, and false positives from our segmentation algorithms, we then computed the completeness (recall) (Equation (1)), correctness (precision) (Equation (2)), and mean accuracy (F-score) (Equation (3)) following Li et al. (2012) [39] using the following equations below.
r = T P T P + F N  
where r is the recall, TP is the number of true positives, and FN is the number of false negatives.
p = T P T P + F P  
where p is the precision, TP is the number of true positives, and FP is the number of false positives.
F = 2 × r x p r + p  
where F is the F-score, r is the recall, and p is the precision.
Figure 3 below illustrates examples of a true positive, a false positive, and a false negative for each segmentation method.

2.7. Tree Reconstruction with Quantitative Structure Models

To quantify how each method recovers the under- and over-segmented trees compared to the reference trees, we used Quantitative Structure Models (TreeQSMS) (v 2.4.0), developed by Raumonen et al. (2013, 2015) [43,44] and implemented in MATLAB (v 2022a). The QSM method is extensively explained in Raumonen et al. (2013, 2015) [43,44]. The tree structural parameters derived were diameter at breast height (DBH), tree height, crown area, volume, and branch length of individual trees (correctly, over-, and under-segmented, and reference trees). We optimized the TreeQSM input parameters for each tree and generated ten QSMs per tree, as the TreeQSM contains randomness in the reconstruction process. The final estimated values for the tree parameters are the means of ten reconstructions with an estimated uncertainty denoted by the standard deviation. In previous studies, parameters were derived from TLS point clouds using QSMs; the estimated error for DBH was 3% compared to the reference trees in an open Eucalypt Forest [45], tree height was 5% [46], and crown area was 16% in a dense forest [46]. QSMs have been observed to overestimate the modelled volume in the crown [47,48].

2.8. Tree-to-Tree Matching

To compare the volume covered by the trees for the over- and under-segmented trees using both segmentation methods, we matched them to their corresponding reference trees. We estimated the volume covered by the trees by covering them with voxels and quantifying the number of occupied voxels per tree, comparing it to the corresponding reference tree. The size of each voxel was set to 10 cm, which was implemented in lidR in R Studio (R4.2.2) [49]. Using the parameters derived from each tree using the QSMs, we calculated the recovery ratio, which measures how much of the tree under-or over-segmented by the CSP or SPBTIM algorithm was recovered compared to the reference tree. The recovery ratio was computed by Equation (4). We also calculated the average recovery ratio for each segmentation method across all under- and over-segmented trees.
R e c o v e r y   R a t i o =   P a r a m e t e r ( C S P   o r   S P B T I M ) P a r a m e t e r ( R e f e r e n c e ) 100
where Parameter (CSP or SPBTIM) denotes the tree parameter derived with the QSM from the tree segmented by the CSP (Tao et al., 2015) [20] algorithm or the SPBTIM (Raumonen et al., 2021) [30], and Parameter (reference) denotes the parameter derived from the corresponding reference tree.

2.9. Statistical Analysis

All statistical analyses were conducted in R Studio (version 4.2.2) [49]. To assess whether there were any significant differences in the means of the occupied voxel counts, recovery ratios, and plot-level metrics between the segmentation methods and the reference trees, we employed a t-test at a 95% confidence level. To determine which t-test to use (with equal (pooled t-test) or unequal variance (Welch’s t-test)), we conducted an F-test for two samples to compare the variances.

3. Results

3.1. Segmentation Summary & Accuracy Assessment

Table 3 below summarizes the segmentation between the CSP and SPBTIM algorithms compared to the 125 reference trees. One hundred and three (103) trees were correctly segmented (true positives) using the CSP and SPBTIM algorithms, compared to 125 manually segmented reference trees. Eleven (11) trees were over-segmented (false positives) using the CSP, compared to 10 with the SPBTIM algorithm. Eleven (11) trees were under-segmented (false negatives) using the CSP, compared to 12 with the SPBTIM algorithm. One tree was not segmented using the CSP, whereas none were with the SPBTIM algorithm. Therefore, 124 trees were considered in the analysis using the CSP algorithm, whilst 125 trees were considered in the analysis for the SPBTIM algorithm. Both segmentation algorithms detected 90% of the trees. The SPBTIM had a precision of 91%, compared to the CSP algorithm, which had a precision of 90%. The overall segmentation accuracy was identical for both algorithms, with an F-score of 0.90.

3.2. Voxel Volume Covering the Over and Under-Segmented Trees

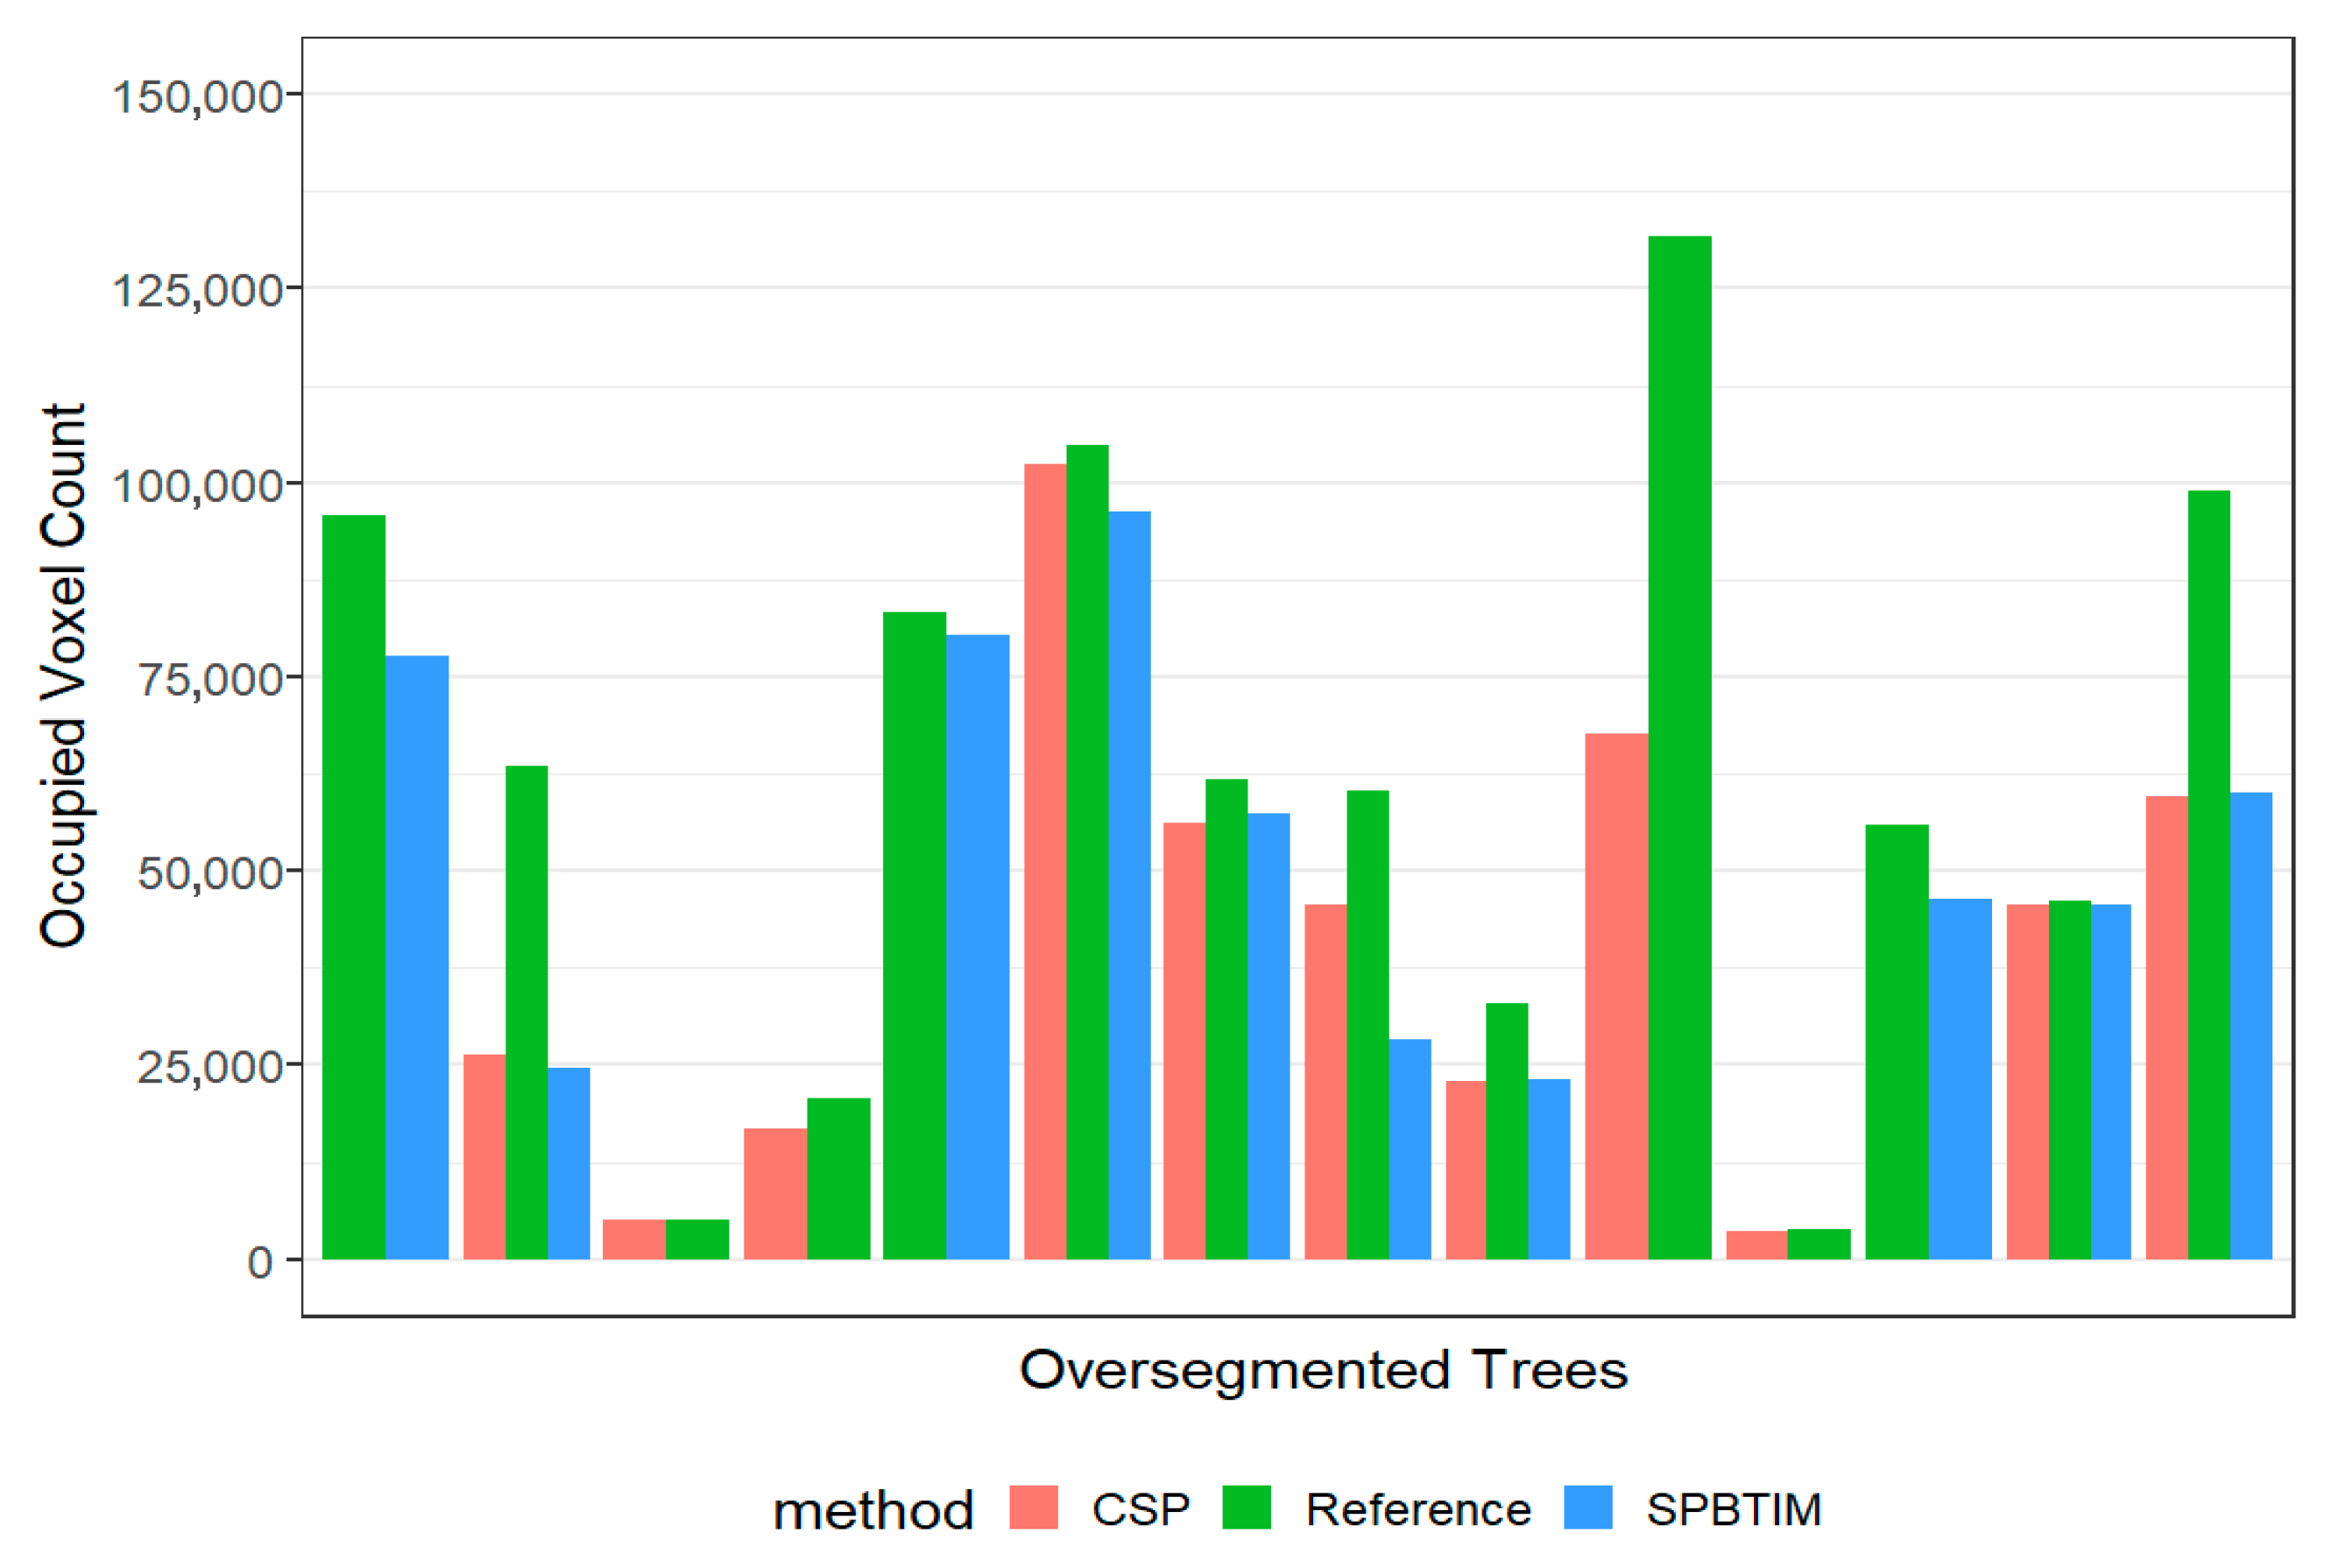
To compare the volume extent of the under- and over-segmented trees, the segmented tree point clouds were fitted with 10 cm voxels. We compared the number of occupied voxels per tree with the corresponding reference tree. Figure 4 below shows the occupied voxel count of over-segmented trees, segmented using the CSP and SPBTIM algorithm, compared to the reference trees. The bars indicate that the over-segmented trees have a lower occupied voxel count for both segmentation methods than the reference trees. This is because the tree was assigned two segments or lost part of its structure to a neighbouring tree. Three bars at each location indicate common trees that were over-segmented by both methods. In this case, a total of seven trees were common among the segmentation methods.
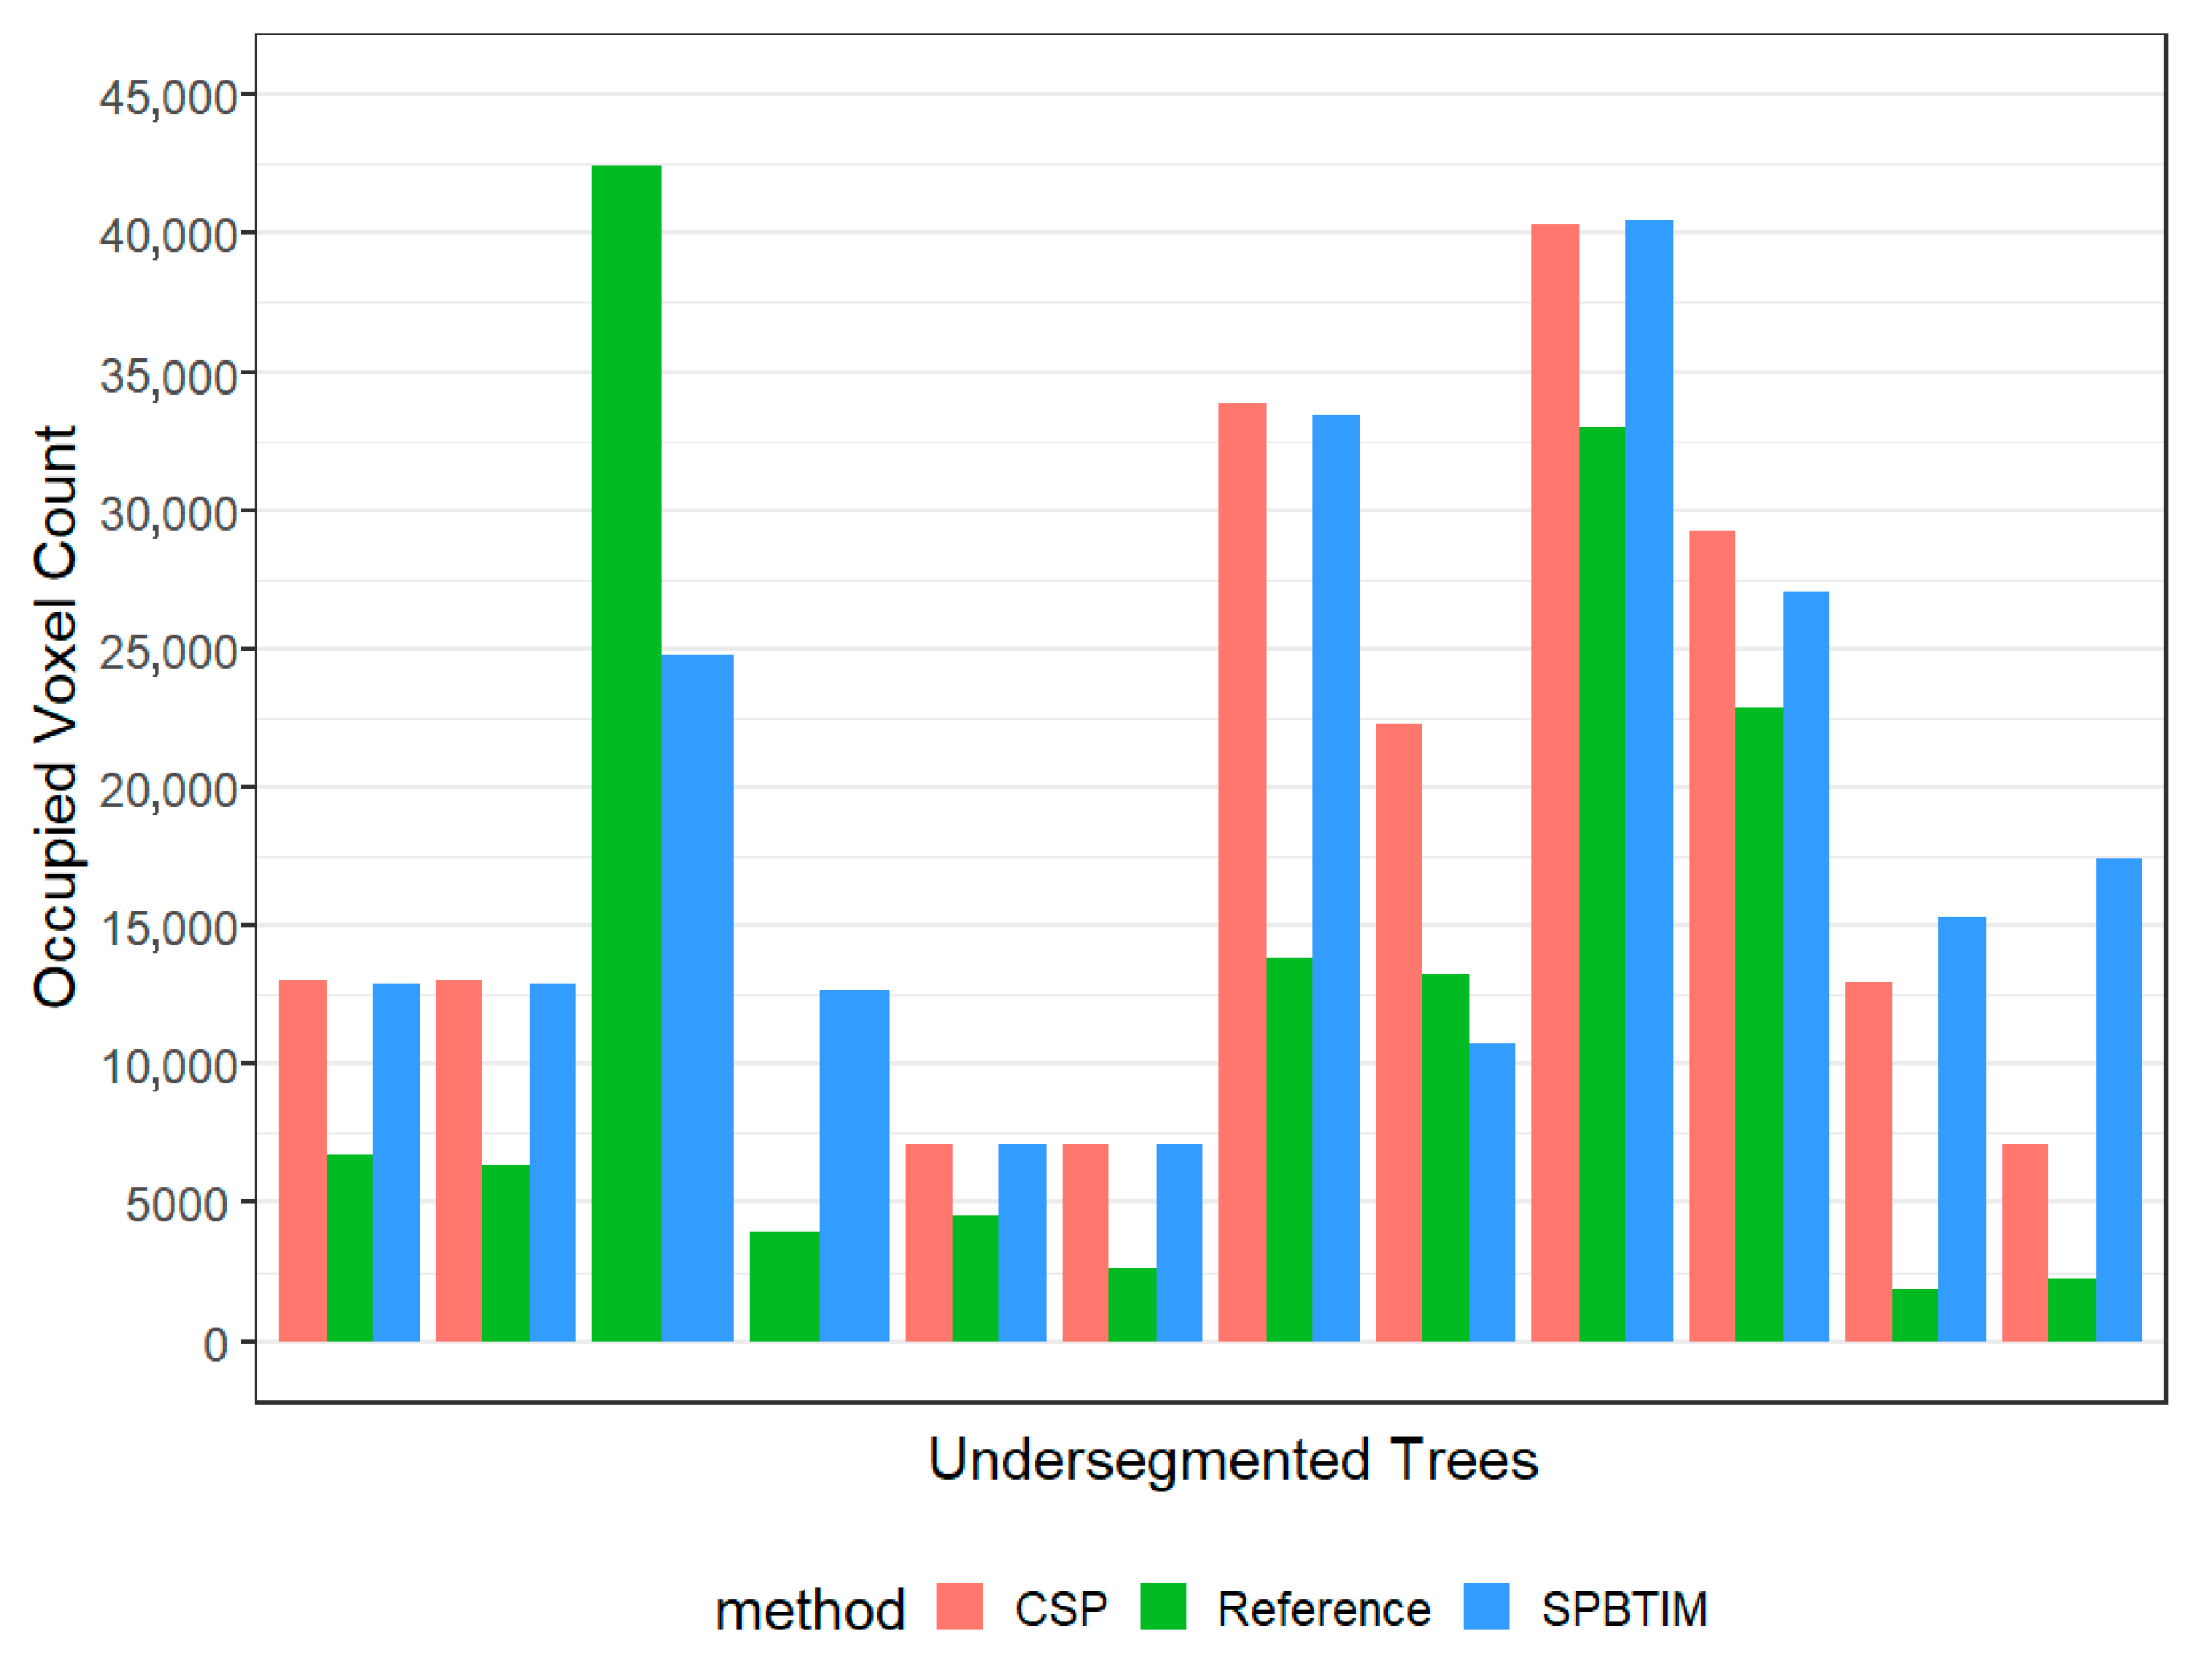
The opposite was observed for the under-segmented trees, as shown in Figure 5 below for both segmentation methods. The occupied voxel count is greater than the reference for the under-segmented trees segmented with the CSP algorithm. This is because the trees have part of the neighbouring tree assigned to them, or two separate trees assigned one tree ID. We observe that this was also true for the trees segmented using the SPBTIM algorithm for 10 of the trees, except in two scenarios. The expectations could be attributed to trees that are both over-segmented and under-segmented. This is because they have part of a neighbouring tree assigned to them and have also lost a significant part of themselves to neighbouring trees. Under- and over-segmentation was observed in clusters of trees, especially when using the SPBTIM algorithm. Three bars at each location indicate common trees that were under-segmented by both methods. In this case, a total of 10 trees were common among the segmentation methods.
We then used a t-test to compare the differences in the means of the occupied voxel counts between the under- and over-segmented trees for both segmentation methods. Table 4 shows that the difference in means is not statistically significant (p > 0.05) for the under-and over-segmented trees compared to the reference trees, using both segmentation methods.

3.3. Comparison of Tree Recovery by Segmentation Methods

We compared how each segmentation method recovered the under-segmented and over-segmented trees to the reference trees for seven tree parameters derived from the QSM reconstruction. The parameters compared were DBH, tree height, crown area, total volume (including trunk and branch volume), and branch length. Table 5 below shows 11 false positives (over-segmented trees) segmented using the CSP and 10 false positives segmented with the SPBTIM. The values indicate the recovery ratio (%) of how much each method has recovered the parameter compared to the reference tree. It can be observed that, on average, trees segmented with the CSP algorithm recovered the tree height (98.4% vs. 96.8%) and branch length (65.9% vs. 61.6%) more than the SPBTIM algorithm. However, parameters of total volume (87.5% vs. 80.4%), trunk volume (106.6% vs. 104.3%), branch volume (85.1% vs. 75.5%), DBH (96.3% vs. 95.2%), and crown area (80.7% vs. 78.5%) were recovered more with the SPBTIM as compared to the CSP algorithm, thus the SPBTIM performs better in this regard. The first seven corresponding trees in the table are common trees over-segmented by both methods. The differences in the means between the segmentation methods for common trees and all trees are not significant (p > 0.05) for all seven computed parameters for the over-segmented trees. The values of each computed parameter, derived from the QSM per tree and estimated standard deviation, compared to the reference trees, are presented in Excel S1 (Supplementary Materials) for both segmentation methods.
Table 6 below shows 10 false negatives (under-segmented trees) segmented using the CSP and 12 false negatives segmented with the SPBTIM. One tree was not segmented using the CSP algorithm, which explains the 10 trees used in the analysis. Ten (10) of the trees were under-segmented by both methods; thus, the first 10 corresponding trees in the table are common trees under-segmented by both methods. Trees with identical tree IDs were two trees that were assigned one tree ID. We observed that the SPBTIM algorithm tends to under-segment the trees more than the CSP, as seen by the large recovery ratios of the SPBTIM compared to the reference tree, considering the ten common trees. Total volume (371.2% vs. 284.1%), trunk volume (296.8% vs. 217.1%), branch length (241.0% vs. 211.0%), branch volume (339.8% vs. 308.8%), tree height (150.6% vs. 150.1%), and crown area (222.7% vs. 196.5%). Only tree DBH (138.9% vs. 136.1%) had a higher computed recovery ratio for the CSP algorithm. The large ratios indicate that the method diverged more from the reference and under-segmented the trees than the smaller ratios. The differences in the means between the segmentation methods for common trees and all trees are not significant (p > 0.05) for all seven computed parameters of the under-segmented trees.

3.4. Comparison of Plot Level Metrics Between the Segmentation Methods

Plot-level metrics were computed for the total number of trees per segmentation method, using all seven computed tree parameters derived from the QSM (see Table A1Appendix A). Since one tree was not segmented using the CSP algorithm, 124 trees were considered, whilst 125 trees were considered using the SPBTIM algorithm. The plot level mean of trunk volume (815 L vs. 812 L), tree height (10.9 m vs. 10.8 m), and crown area (80.7 m2 vs. 80.2 m2) were greater for the trees segmented using SPBTIM, whilst trees segmented with CSP had a greater mean total volume (3182 L vs. 3157 L), branch volume (2370 L vs. 2342 L), and branch length (701.0 m vs. 665.6 m). The plot averages for the parameter DBH were identical at 43 cm. Comparing the plot-level metrics between the two segmentation methods, the mean differences are insignificant (p > 0.05) for all seven computed parameters.

3.5. Quantifying the Other Segments in the Plot

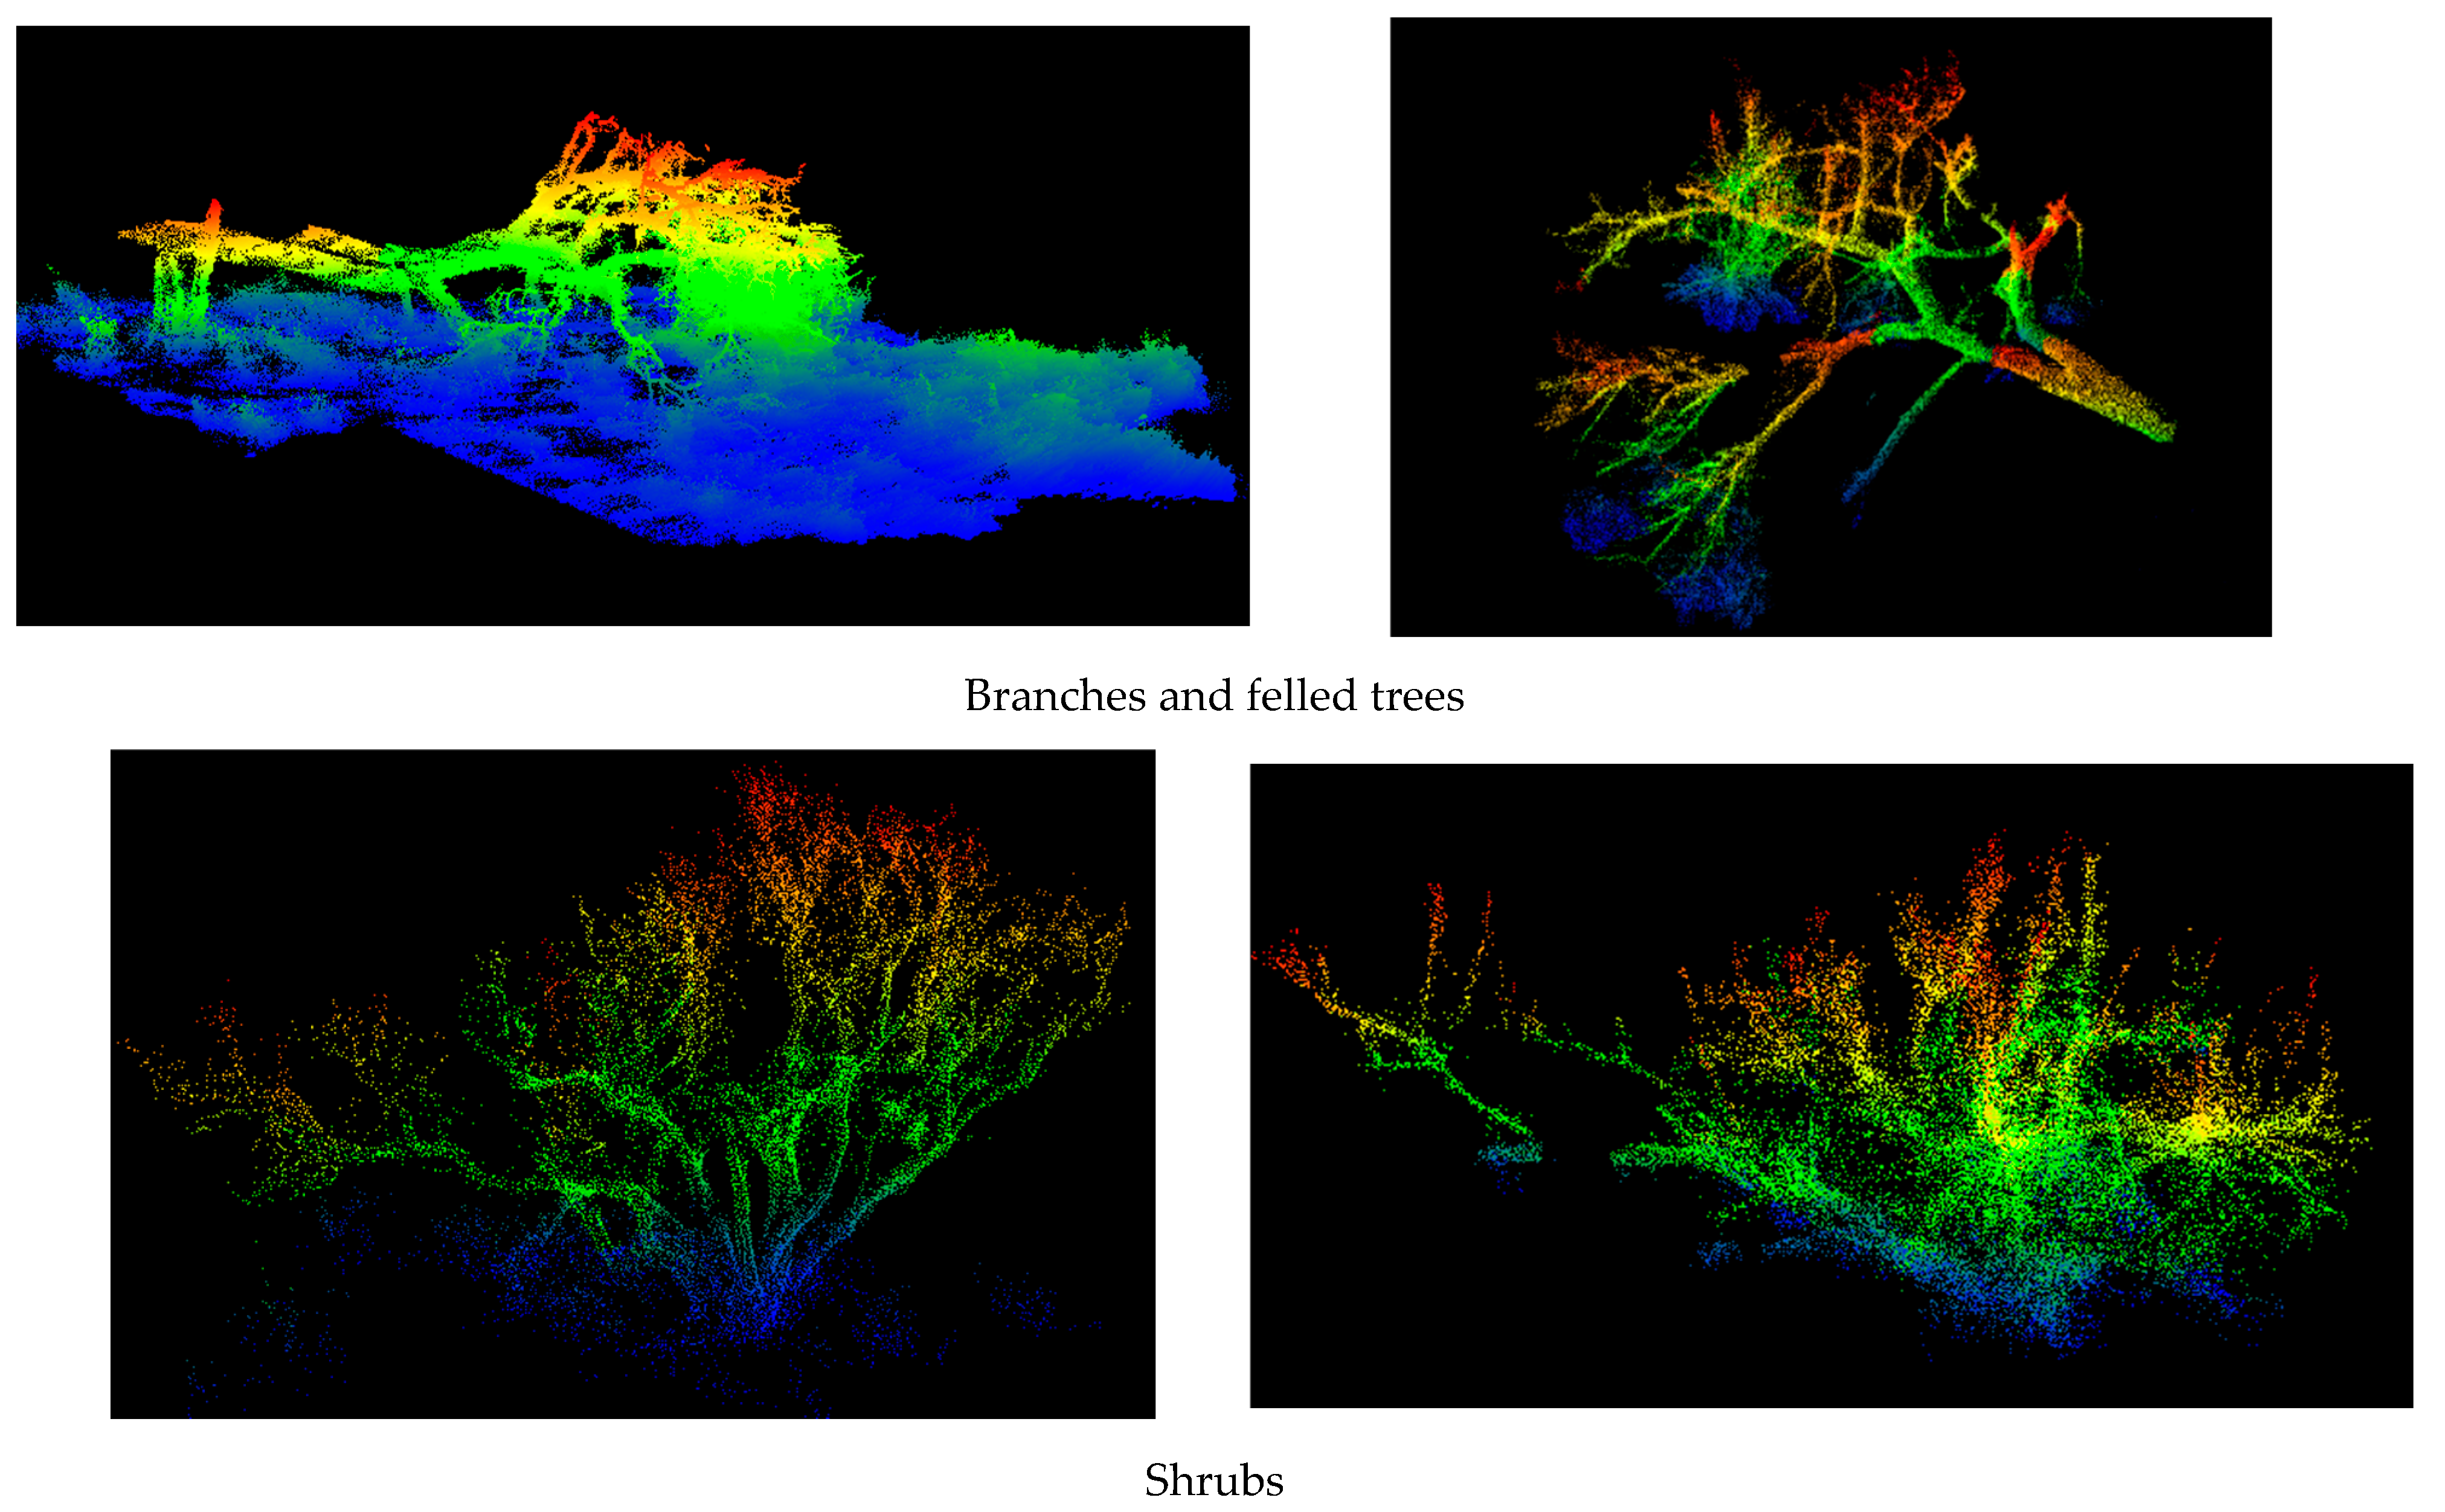
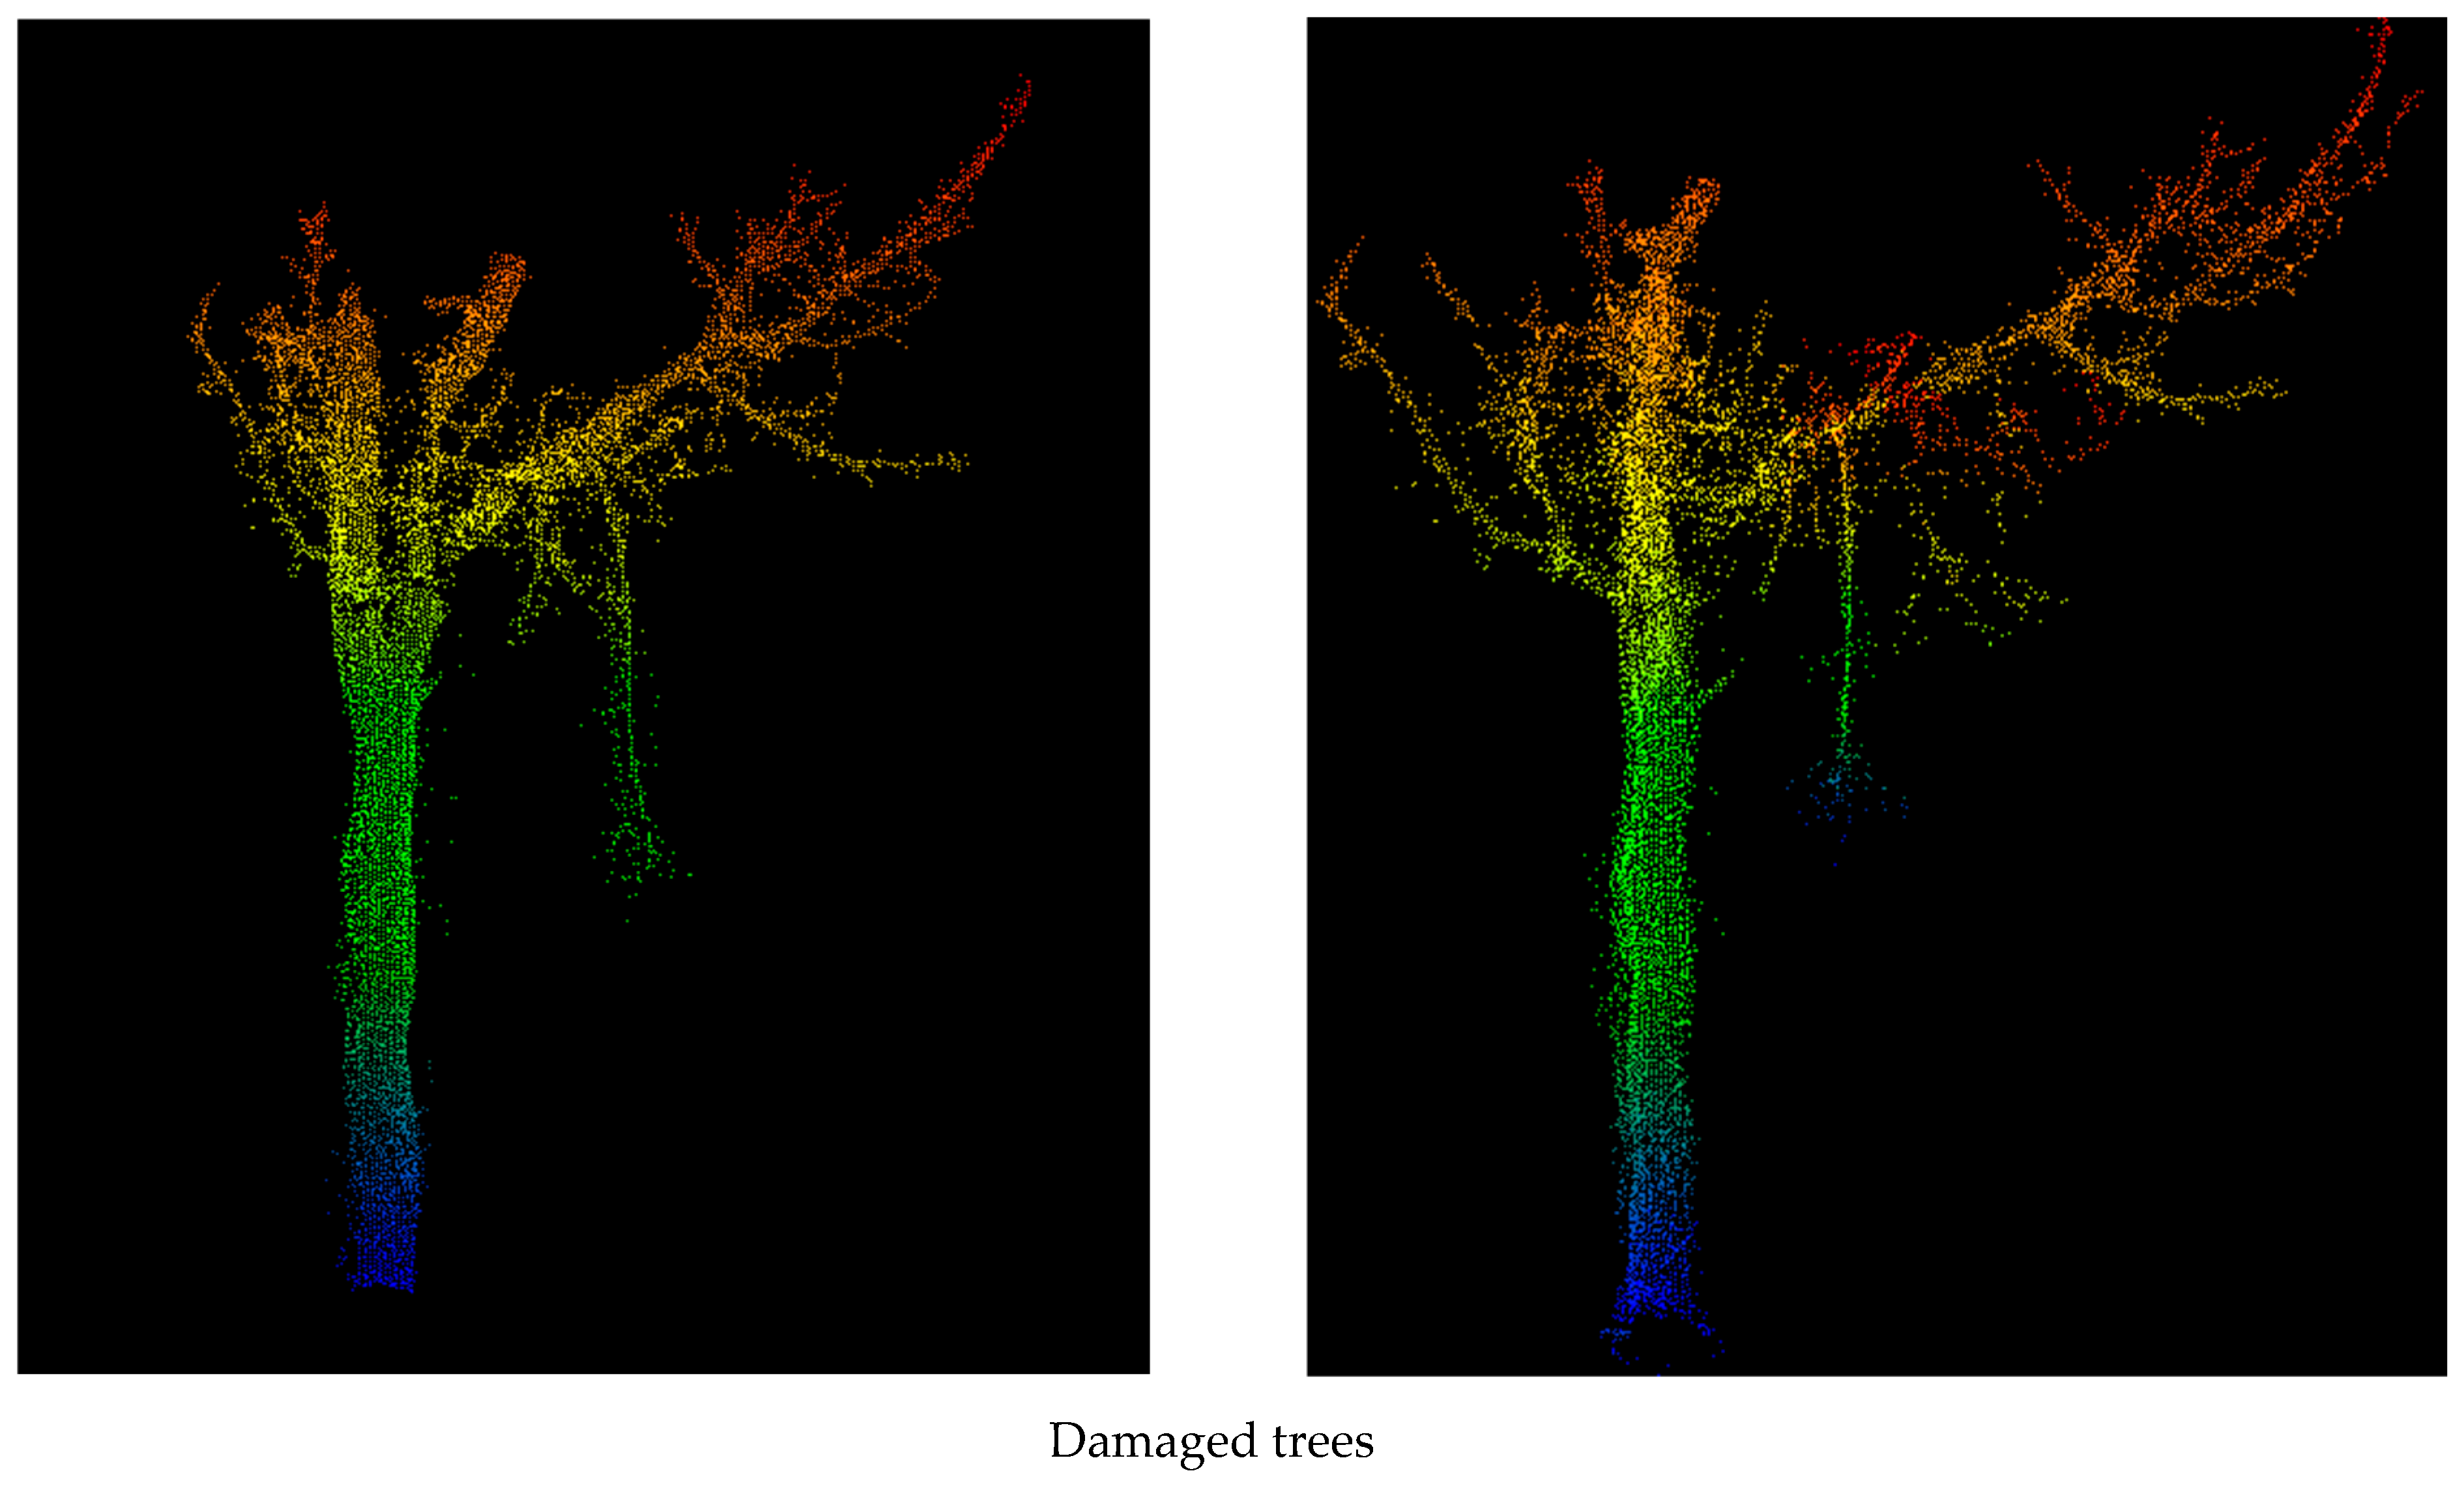
Other segments in the plot were classified into the following: branches and felled trees, shrubs, and standing trees (damaged, small, and dead). A total of 255 segments were classified as branches and felled trees segmented by the CSP, compared to 241 segmented by the SPBTIM. Shrubs were quantified to be 329 using the CSP algorithm, whilst 134 shrubs were segmented with the SPBTIM algorithm. Standing trees that were either dead, damaged, or small were quantified to be 137 using the CSP algorithm, compared to 114 with the SPBTIM algorithm. Figure 6 below shows an example of segmented branches, fallen trees, shrubs, and standing trees (damaged, dead, or small) by both segmentation methods. It should be noted that neither segmentation algorithm analyzes the segments in a sophisticated way to determine if a given segment is a dead or damaged tree or shrub. This is only possible after the automatic segmentation by the user, who then identifies which of the segments are trees, shrubs, or dead or damaged trees.

4. Discussion

4.1. Accuracy Between Segmentation Methods for Savanna Tree Extraction

The primary objective of this study was to quantify the accuracy of the CSP [20] and SPBTIM [30] algorithms in correctly segmenting trees within a typical savanna environment. We tested the algorithms on a 15.2 ha TLS-scanned plot with 32 scan positions from Skukuza, Kruger National Park, against 125 segmented and manually edited reference trees. We not only quantified the number of trees correctly and incorrectly segmented using both segmentation methods, but also, with the aid of QSMS and voxels, quantified how each segmentation method recovered the under- and over-segmented trees in comparison to the reference trees, using seven tree structural parameters and voxel volume. Our analysis revealed that both methods segment savanna trees with high accuracy, as indicated by 103 trees correctly segmented (True Positives) by both methods against 125 reference trees. Both algorithms detected 90% of the trees (r = 0.90). The SPBTIM had a precision of 91% compared to the CSP algorithm, which had a precision of 90%. The overall segmentation accuracy was identical for both algorithms (F = 0.90); see Table 3.
The CSP had 11 false positives (over-segmented trees) and 11 false negatives (under-segmented trees), while the SPBTIM had 10 false positives and 12 false negatives (see Table 3). Thus, CSP over-segmented slightly more trees than the SPBTIM. Seven of these trees were over-segmented by both methods. SPBTIM recovered over-segmented trees better than the CSP algorithm compared to the references. Of the seven tree parameters for the seven common trees, total volume, trunk volume, branch volume, and DBH had a higher recovery percentage for the SPBTIM, and tree height, branch length, and crown area had a higher recovery percentage for the CSP (see Table 5).
SPBTIM under-segmented slightly more trees (12) than the CSP (11); ten trees from the CSP algorithm were used in the analysis since one tree was not segmented. Ten of these were common trees in both methods. Our results show that, of the two algorithms, the SPBTIM tends to under-segment trees more than the CSP algorithm; this is observed in the larger recovery ratios for all parameters except DBH for the ten common trees (see Table 6).
Tao et al. (2015) [20] applied the CSP algorithm to three plots comprising broadleaved and coniferous trees in China, each with 14, 51, and 49 trees, respectively. The method was tested on mobile LiDAR-scanned roadside trees, and perfect segmentation was achieved in both Plot 1 and Plot 2, specifically for the broadleaved and coniferous forest leaf-off scans. Plot 3 of broadleaved trees achieved a recall of 0.92, a precision of 1, and an F-score of 0.96. In this study, the CSP algorithm achieved a recall of 0.90, a precision of 0.90, and an overall F-score of 0.90. This can be attributed to the heterogeneous data set used in this study, a larger plot size, and a more complex vegetation structure and composition than the data used in Tao et al. (2015) [20]. A previous study utilised SPBTIM to assess 422 trees from a 4-hectare tropical forest plot scanned with UAV-LiDAR [30]. The results were promising, but significant errors were visible in the small trees, which were less apparent in the UAV data. Our study also observed errors in the small trees, neighbouring and suppressed by large trees with large crowns.
The occupied voxel count was higher for the reference trees than for the over-segmented trees (see Figure 4). However, the opposite was observed for the under-segmented trees, which had a larger occupied voxel count than the reference trees for both methods, except in two scenarios with the SPBTIM (see Figure 5). This was expected because the over-segmented trees would have lost part of themselves to a neighbouring tree or been segmented into several segments, unlike the under-segmented trees, where the tree would have gained parts of a neighbouring tree or two trees given one ID. A comparison of the means (see Table 4) revealed that the differences in the means are not statistically significant (p > 0.05) for both over-segmented and under-segmented trees, regardless of the segmentation method used. For the over-segmented trees, this implies that even when over-segmentation occurs, both methods recover a significant portion of the tree compared to the reference. In the case of under-segmented trees, the difference in the means not being statistically significant can be attributed to the fact that multiple trees are combined or a tree has part of a neighbouring tree assigned to it, leading to a large voxel count; however, in reality, the actual tree morphology and architecture are not captured. Additional metrics may need to be considered to capture the errors of over- and under-segmentation, such as voxel spatial distribution or the number of intersecting voxels [50].
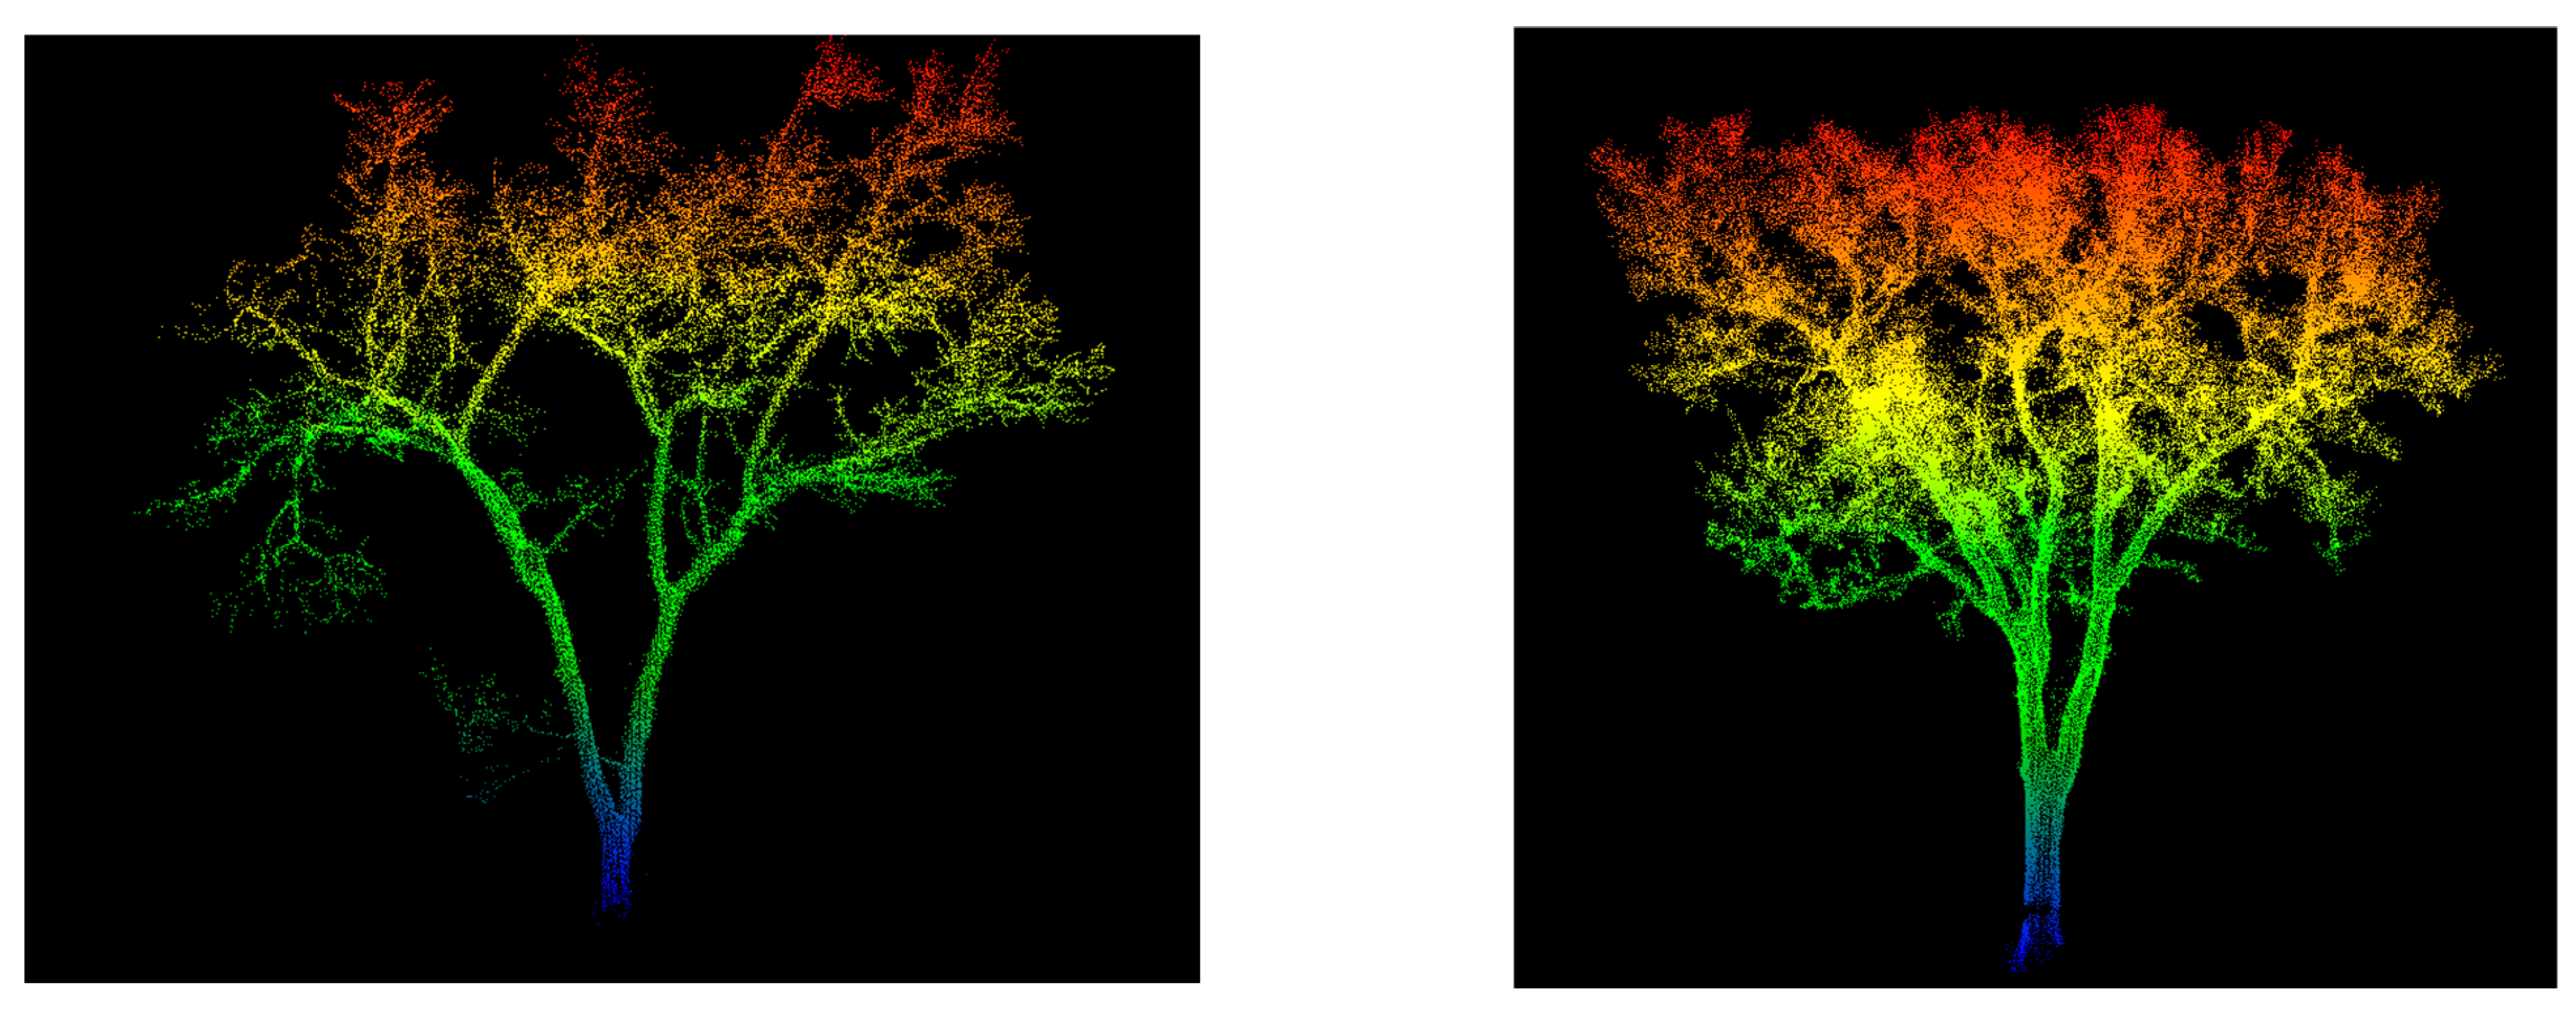
We also observed that with the current parameter settings for both segmentation algorithms, both successfully segmented multi-stemmed trees, a characteristic of savanna ecosystems. Figure 7 below shows an example of multi-stemmed trees segmented by both segmentation methods.

4.2. Segmentation Errors Shared by Both Segmentation Methods

The segmentation methods were also analysed for common errors, and the following errors were observed in the segmentation of savanna trees. Figure 8 below illustrates that both methods are limited in segmenting trees in clusters, and accurately segmenting the crowns of such trees remains challenging for both methods. It can be observed that the tree in the middle in both cases has been over-segmented, and part of its crown has been lost to the two adjacent trees. The two adjacent trees segmented by the SPBTIM (right figure) have been under- and over-segmented, whilst the adjacent tree segmented by the CSP (left figure) has been under- and over-segmented (maroon tree), whilst the other has been under-segmented (yellow tree). The SPBTIM tends to under- and over-segment trees in the clusters as compared to the CSP algorithm; in this regard, the CSP performs better than the SPBTIM.
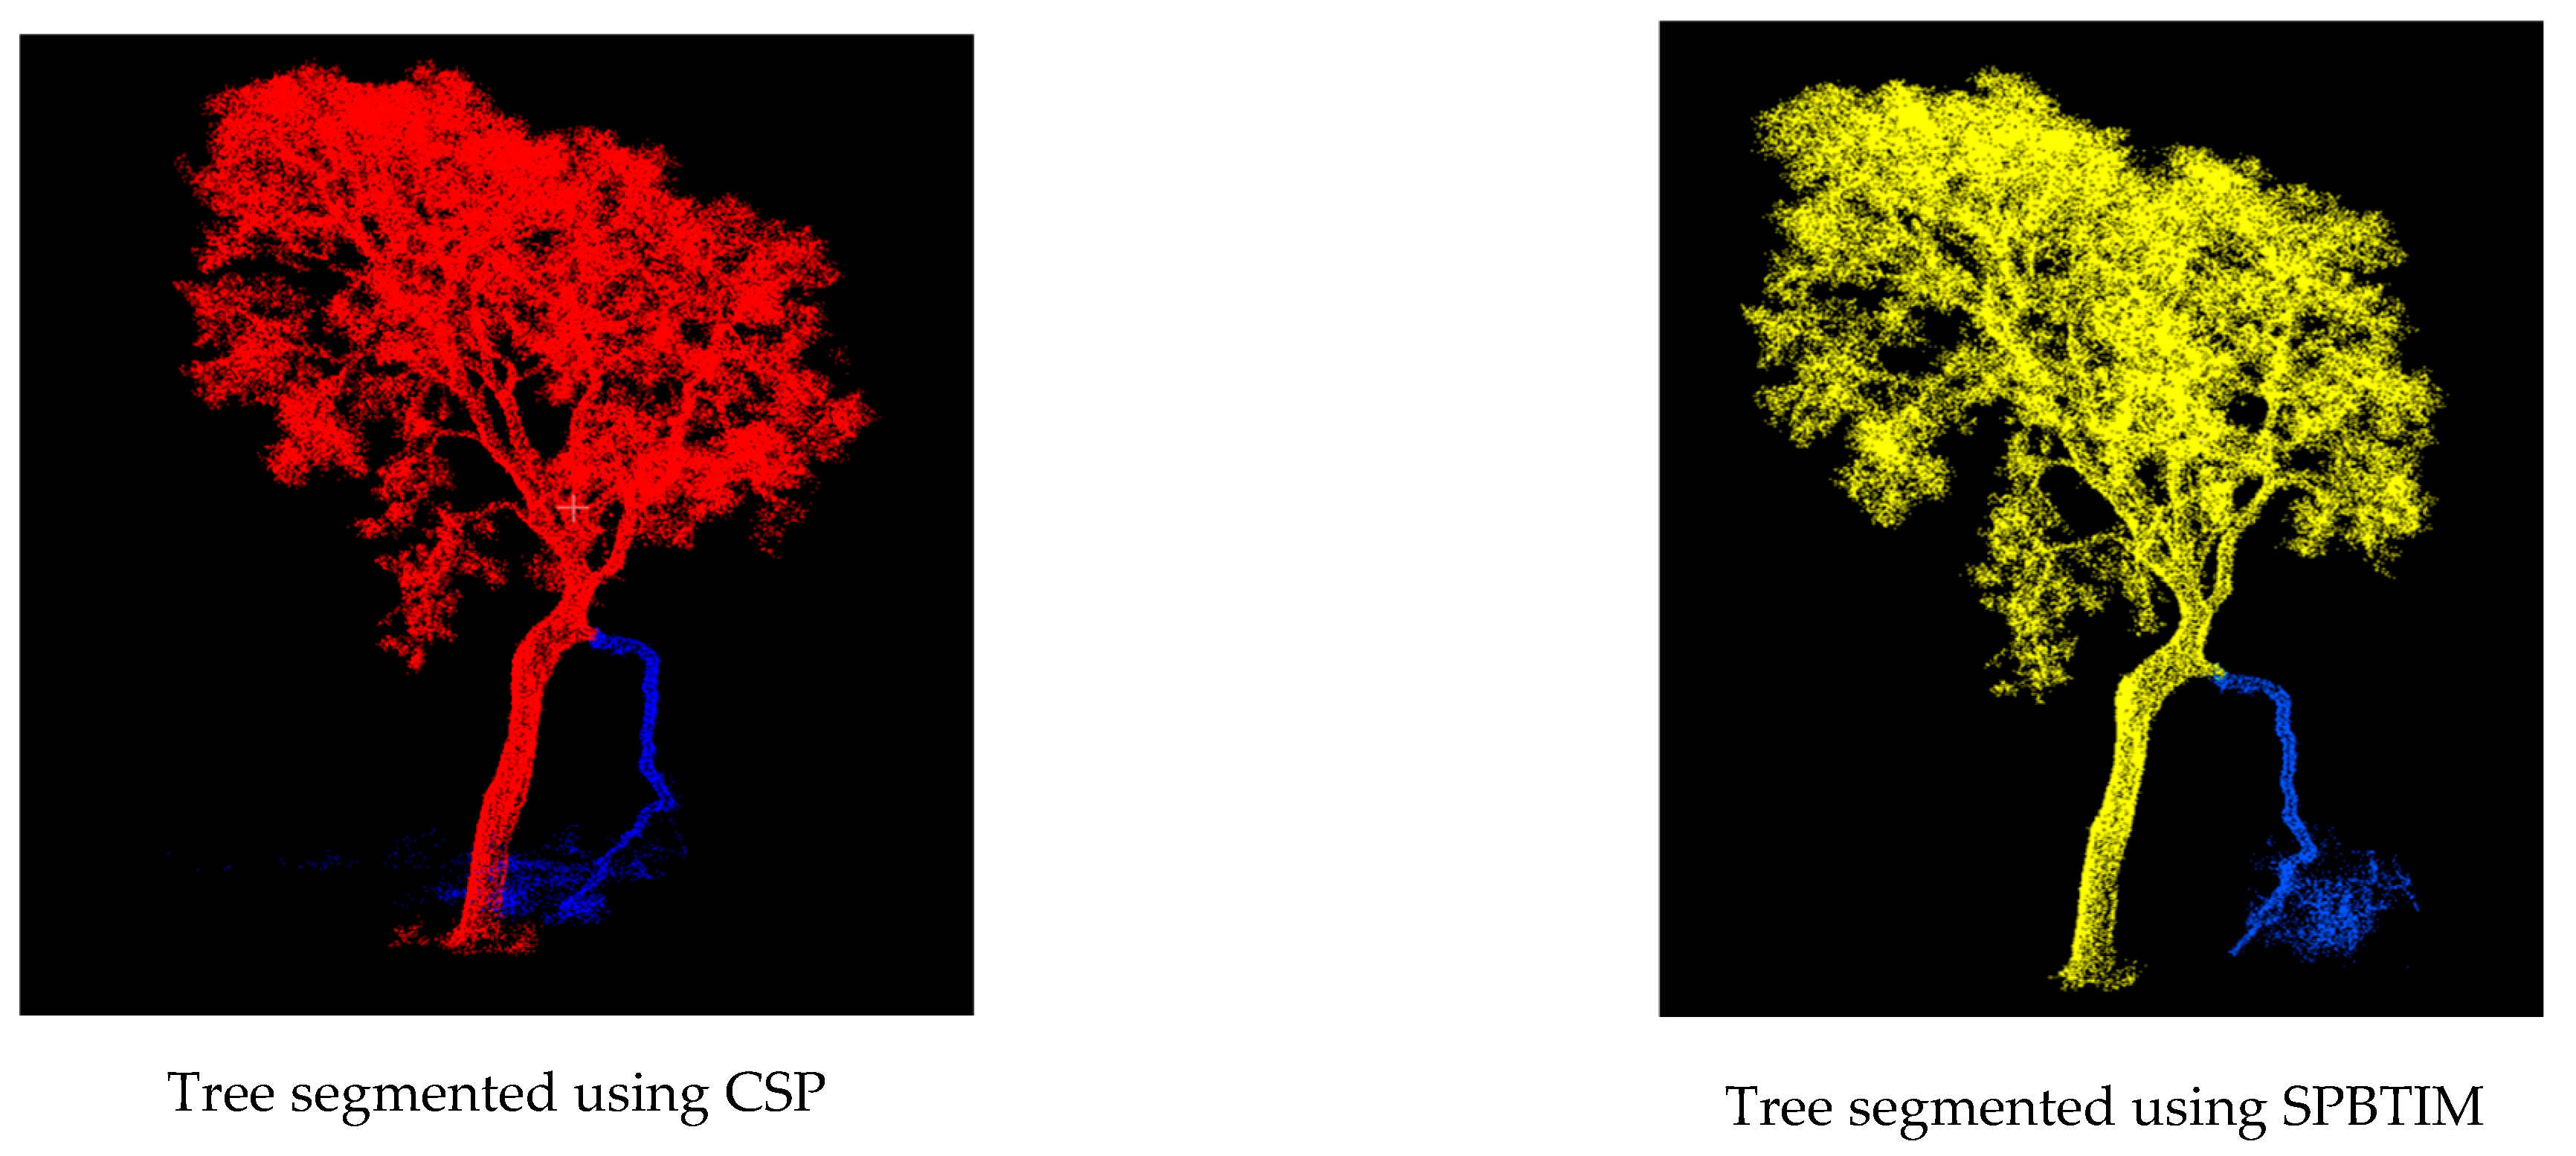
The other common error in both segmentation methods was trees with extended or protruding branches. Figure 9 below shows an example of a tree over-segmented by both segmentation methods. In the example tree below, the branch extends towards and touches the ground, and is selected as the trunk by both algorithms. Thus, both methods segmented the protruding branch separately from the main tree. In both cases, though, both methods recovered the main structure of the tree.
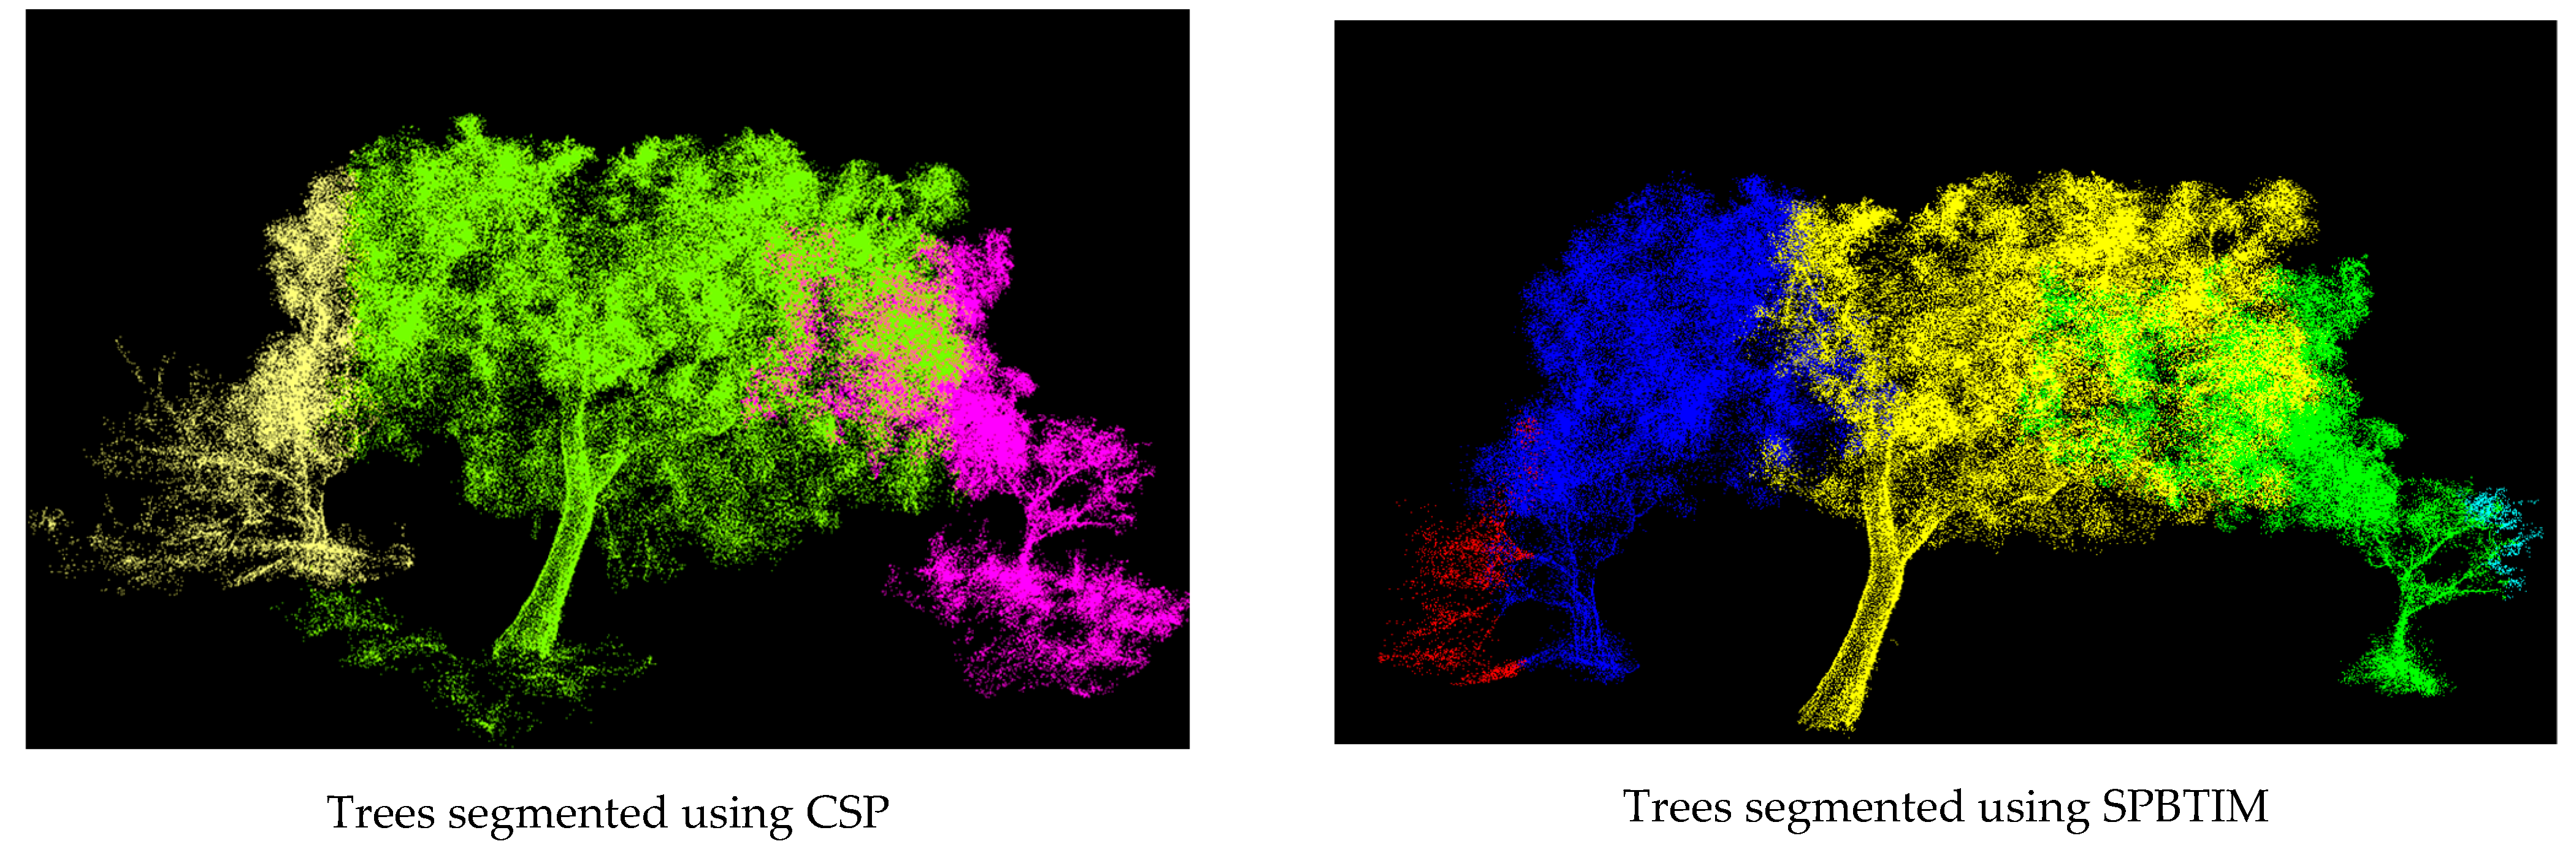
Segmentation errors in the small trees, which were neighbouring and suppressed by trees with large crowns, were also common in both segmentation methods (Figure 10). The small trees are suppressed by the middle tree, which has a large crown, and the small trees are under-segmented, whereas the middle tree is over-segmented using the CSP algorithm (left figure). However, considering the SPBTIM algorithm (right figure), the small adjacent trees are both under-segmented and over-segmented. In contrast, the middle tree is over-segmented, losing most of its crown to the adjacent small trees. It was observed that the SPBTIM has more over- and under-segmented trees than the CSP.

4.3. Uncertainty and Limitations of the Approach

In this study, the reference trees were not derived from surveyed trees on the ground but rather from semi-automatic segmentation and manual editing of trees from the TLS point clouds. Semi-automatic segmentation, combined with manual editing, provides a user-friendly approach that leverages the automation and precision of human intervention, resulting in enhanced efficiency, improved accuracy, and better handling of complex scenarios [51,52,53]. However, manual editing is limited by subjectivity and inconsistency among individuals [54,55]. The manual editing process is also labour-intensive [54] and primarily based on the initial segmentation. In the study, manual editing involved correcting under- and over-segmented trees and removing undergrowth, which took several hours (over 4 h) to edit the automatic segmentation of 125 reference trees on the 15.2 ha plot. Another challenge of manually editing trees from TLS data arises from overlapping canopies, making it difficult to accurately distinguish individual trees in such scenarios [56]. In this study, most trees were sparsely spaced; however, instances of trees in clusters with overlapping crowns were also observed (see Figure 8). Despite these limitations, data from TLS have been used by several studies as a validation tool [40,52,57,58], as TLS has been described as a ground-based method for validation [59]. Without field data, TLS has been regarded as the most accurate non-destructive method for individual trees [60].
In this regard, we would like to further highlight that the study was not aimed at comparing tree parameter measurements, such as DBH, tree height, and crown area, from TLS; therefore, the absence of field data. This study primarily focused on comparing two automatic tree segmentation methods. While we also do not have field data of the locations of the trees in the field, the plot was sparse (see Figure 1 and Figure 2) and well covered with the scans, which ensured that large trees were easily located in the point cloud by the human eye, providing a reference for the automatic tree segmentation.
Another limitation in our study arises from the noise in the TLS data, which results in errors in automatic segmentation, reconstruction, and parameter estimation of the trees. The effect of occlusions introduces noise that affects the accurate segmentation of individual trees. Wang et al. (2021) [57] observed that for structurally simple and sparse forest types with distanced trees and minimal interaction between crowns, most tree segmentation algorithms are accurate. However, dense low vegetation and limitations in setting up multi-scan TLS are often unavoidable and present challenges [57]. This study found this to be true, as both algorithms successfully segmented isolated trees. However, the algorithms were unable to distinguish the individual trees successfully in the few scenarios where trees had overlapping crowns. Calders et al. (2020) [61] alluded to this, stating that many tree segmentation algorithms are semi-automatic and require manual editing and quality control to correct for under- and over-segmentation. Of the two algorithms compared in this study, the CSP is semi-automatic because segmentation editing is possible within the software. In contrast, in the SPBTIM, segmentation editing can be achieved by writing a script that further classifies and refines the segments, where two segments are combined into one or by exporting the mis-segmented data to another software for segmentation editing.
The noise in the TLS data from wide tree canopies can prevent the detection of smaller trees that are suppressed by larger trees [62]. This was true for both algorithms in this study: suppressed small trees under the canopy of larger trees were under-segmented using the CSP algorithm and under- and over-segmented by the SPBTIM algorithm (see Figure 10). To address this challenge, Fu et al. (2022) [62] developed an enhanced DBSCAN algorithm to improve the successful segmentation of individual trees. The algorithm was successful in detecting suppressed small trees, effectively managing noise, and reducing the number of false positives.
Noise also affects the accurate reconstruction of trees using QSMs and, thus, the computed tree parameters [52]. Martin-Ducup et al. (2021) [52] concluded that the process of tree segmentation is a weak link in TLS automated pipelines, and human editing significantly reduces the error in the final QSM volume by a factor of 10 when considering wood volume and by a factor of 3 on a 1 ha plot. We observed that the CSP algorithm tends to include some ground points in the classification, especially for trees with large crowns, which would affect the overall modelled volume using the QSMs. In contrast, the SPBTIM applies a filtering step before the actual tree segmentation, removing ground points from the segmented trees (see Figure 10).
The use of QSMs to estimate tree structural parameters for comparing the recovery abilities of segmentation methods is limited, as QSMs inherently have uncertainty, and the derived parameter is always a mean across several QSMs with associated uncertainty [46,63]. This explains the over-segmented trees’ recovery ratios greater than 100% (see Table 5). For example, parameters such as trunk volume with values greater than 100% are attributed to the random nature of the reconstruction with TreeQSM, where computed values differ for every reconstruction, even if it is the same tree. Another source of error when using QSMs arises from TLS’s inability to resolve small branches in the tree crowns, leading to an overestimation of branch parameters, specifically branch volume [64].

4.4. Future Outlook

Accurately extracting trees from TLS point clouds is a crucial first step in processing TLS data, enabling the extraction of vegetation parameters and quantification of other metrics, such as biomass. In this study, we assessed the accuracy of two segmentation methods, both of which are based on ecological theory. We observed that both segmentation algorithms are accurate in segmenting savanna trees, particularly those that are sparsely distributed. However, both algorithms are limited in delineating crowns, especially trees in clusters with intersecting crowns. Therefore, further research is necessary to address the issue of intersecting tree crowns, mainly when segmentation editing is not feasible.
The advancement of tree segmentation algorithms, such as the ones compared in this study, ensures accurate and rapid segmentation of large TLS-scanned plots. However, although sufficient segmentation was achieved with the parameter setting suggested in this study for both methods, more parameter testing is required to define the individual trees efficiently, especially for those in clusters with intersecting crowns. In this regard, future research should modify the algorithms to accurately capture savanna-specific features, such as multi-stemmed detection, understory filtering, and parameter sensitivity to canopy density, which could not be carried out in this study. However, successful segmentation of multi-stemmed trees was achieved by both algorithms (see Figure 7), with the SPBTIM initially applying a filter to remove understory noise, unlike the CSP algorithm, which would require human intervention.
The segmentation errors observed in this study could be attributed to the parameter settings used. However, these errors can also be attributed to tree density [65,66], scan settings that affect point cloud quality [67], the structural complexity of the vegetation [66], and environmental conditions at the time of scanning, which could result in noise [68]. These other factors were not explored in this current study. There should be an area of future research to analyse the related factors associated with the segmentation errors observed.
The use of semi-automatic and manually edited trees for validation, as in the study, offers the advantages of leveraging automation with the precision of human intervention to improve accuracy, but may suffer from subjectivity, leading to inconsistencies [54]. Therefore, future research, especially when segmenting large areas, should adopt a fusion of field surveys with TLS data, thus offering a more inclusive validation of automatic tree segmentation methods.
The two segmentation algorithms in this study were only tested in a single plot, a 15.2 ha plot in a Tropical African savanna after a drought and enhanced elephant activity, which offered diverse shapes of trees. However, to establish the reliability of these algorithms across various and diverse savanna regions, future research should test the applicability of these methods across savanna biomes from temperate, mediterranean, montane, and flooded savanna ecosystems, which offer different types and characteristics of vegetation.
In this study, we used TLS to collect 3D point clouds in sparse savanna ecosystems. However, we acknowledge the laborious and extensive fieldwork required to acquire the point clouds using TLS [69]. LiDAR technologies, such as backpack LiDAR, would provide alternative solutions that are still efficient and less labour-intensive [70].
Future work should also continue to advance and improve methods to alleviate the limitation of noise in TLS data, thereby reducing the uncertainty inherent in automatic segmentation methods.

5. Conclusions

This study compared two segmentation methods based on the morphological theory for extracting savanna trees over a 15.2 ha TLS-scanned plot. We observed that both segmentation methods successfully segment savanna trees with high accuracy. One hundred and three (103) trees were correctly segmented using the CSP and SPBTIM algorithms against 125 reference trees. Both algorithms detected 90% of the trees. The SPBTIM had a precision of 91%, compared to the CSP algorithm, which had a precision of 90%. The overall segmentation accuracy was identical for both algorithms, with an F-score of 0.90. A comparison of the occupied voxel counts for the under- and over-segmented trees, using both methods, with the reference revealed that the differences in means are not statistically significant. The CSP algorithm had more segments (1845) than the SPBTIM (1438). Both segmentation methods are limited in accurately delineating trees in clusters, trees with overlapping branches, and suppressed small trees. Our results provide insights into the suitability of each method for savanna ecosystems, which is crucial for ecological monitoring and enables efficient workflows for processing TLS data. This comparison advances TLS research on accurate savanna tree extraction, supporting the development of precise tree segmentation methodologies tailored to the savanna ecosystem. This will be most beneficial for researchers working in savanna ecosystems who utilise LiDAR data and ecologists who need to conduct rapid vegetation assessments following events such as fires, droughts, or herbivory.

Supplementary Materials

The following supporting information can be downloaded at: https://www.mdpi.com/article/10.3390/land14091761/s1; zipped folder: data and scripts used in the manuscript, Excel S1: QSM computed parameters (under- and over-segmented trees) for both methods with the corresponding reference trees.

Author Contributions

T.P.M.: conceptualization, methodology, data processing, and analysis, writing—original draft. P.R.: conceptualization, methodology, software, reviewing, and editing. J.B.: TLS data acquisition and pre-processing, reviewing, and editing. C.C.: reviewing and editing. J.S.: reviewing and editing. C.S.: conceptualization, supervision, reviewing, and editing. All authors have read and agreed to the published version of the manuscript.

Funding

This study was made possible by funding from the Deutscher Akademischer Austauschdienstenst (DAAD) Ref No. SPACES II.2 CaBuDe 57531823 to T.P. Muumbe and the Bundesministerium für Bildung und Forschung (BMBF) through the projects ArsAfrica, South African Land Degradation Monitor (SALDi, Grant No. 01LL1701A), and Ecosystem Management Support for Climate Change in Southern Africa (EMSAfrica, Grant No. 01LL1801D). The Research Council of Finland provided funding to P. Raumonen: Flagship of Advanced Mathematics for Sensing Imaging and Modelling, Grant 359185; Centre of Excellence of Inverse Modelling and Imaging, Grant 353090. Fieldwork in Kruger National Park was conducted under the SANParks research permit KNP Erosion, Ref. No. BAAJ1127. We acknowledge support from the German Research Foundation (DFG), Project number 512648189, and the Open Access Publication Fund of the Thueringer Universitaetsund Landesbibliothek Jena.

Data Availability Statement

A small dataset of the TLS point cloud is provided, along with MATLAB scripts. The SPBTIM algorithm is available from Pasi Raumonen upon request at pasi.raumonen@tuni.fi.

Acknowledgments

During fieldwork in the Kruger National Park, we acknowledge the support of South African National Parks (SANParks) Scientific Services in Skukuza and Game Guards.

Conflicts of Interest

The authors declare no conflicts of interest.

Appendix A

Table A1. Plot-level metrics between segmentation methods.
CSP (n = 124)SPBTIM (n = 125)
MetricMeanMaxMin95th PercentileSEMSDMeanMaxMin95th PercentileSEMSDp Value
ToV (L)318294141397379189211031579985113731718820990.93
TrV (L)8122163351731434828152171271711434780.96
BrV (L)23707781104599215317042342809887578315317060.90
TH (m)10.815.25.313.70.21.910.915.05.313.60.21.90.71
BrL (m)701.02747.044.61688.545.5506.5665.62547.052.21573.243.3484.40.57
DBH (cm)43731163114437510641140.98
CA (m2)80.2219.62.9171.04.348.380.7216.42.8165.54.348.00.85
ToV is the total volume, TrV is the trunk volume, BrV is the branch volume, BrL is the branch length, DBH is the diameter at breast height, TH is the tree height, CA is the crown area, SEM is the standard error of the mean, and SD is the standard deviation.

References

  1. Sankaran, M.; Ratnam, J.; Hanan, N. Woody cover in African savannas: The role of resources, fire and herbivory. Glob. Ecol. Biogeogr. 2008, 17, 236–245. [Google Scholar] [CrossRef]
  2. Smit, I.P.; Asner, G.P.; Govender, N.; Kennedy-Bowdoin, T.; Knapp, D.E.; Jacobson, J. Effects of fire on woody vegetation structure in African savanna. Ecol. Appl. 2010, 20, 1865–1875. [Google Scholar] [CrossRef]
  3. Grace, J.; José, J.S.; Meir, P.; Miranda, H.S.; Montes, R.A. Productivity and carbon fluxes of tropical savannas. J. Biogeogr. 2006, 33, 387–400. [Google Scholar] [CrossRef]
  4. Stevens, N.; Lehmann, C.E.R.; Murphy, B.P.; Durigan, G. Savanna woody encroachment is widespread across three continents. Glob. Chang. Biol. 2017, 23, 235–244. [Google Scholar] [CrossRef] [PubMed]
  5. Asner, G.P.; Levick, S.R. Landscape-scale effects of herbivores on treefall in African savannas. Ecol. Lett. 2012, 15, 1211–1217. [Google Scholar] [CrossRef]
  6. Helm, C.V.; Witkowski, E.T.F.; Kruger, L.; Hofmeyr, M.; Owen-Smith, N. Mortality and utilisation of Sclerocarya birrea subsp. Caffra between 2001 and 2008 in the Kruger National Park, South Africa. S. Afr. J. Bot. 2009, 75, 475–484. [Google Scholar] [CrossRef]
  7. Vanak, A.T.; Shannon, G.; Thaker, M.; Page, B.; Grant, R.; Slotow, R. Biocomplexity in large tree mortality: Interactions between elephant, fire and landscape in an African savanna. Ecography 2012, 35, 315–321. [Google Scholar] [CrossRef]
  8. Levick, S.R.; Asner, G.P. The rate and spatial pattern of treefall in a savanna landscape. Biol. Conserv. 2013, 157, 121–127. [Google Scholar] [CrossRef]
  9. Cho, M.A.; Mathieu, R.; Asner, G.P.; Naidoo, L.; van Aardt, J.; Ramoelo, A.; Debba, P.; Wessels, K.; Main, R.; Smit, I.P.J.; et al. Mapping tree species composition in South African savannas using an integrated airborne spectral and LiDAR system. Remote Sens. Environ. 2012, 125, 214–226. [Google Scholar] [CrossRef]
  10. Pavelka, K.; Matoušková, E.; Pavelka, K. Remarks on Geomatics Measurement Methods Focused on Forestry Inventory. Sensors 2023, 23, 7376. [Google Scholar] [CrossRef]
  11. Hill, R.A.; Broughton, R.K. Mapping the understorey of deciduous woodland from leaf-on and leaf-off airborne LiDAR data: A case study in lowland Britain. ISPRS J. Photogramm. Remote Sens. 2009, 64, 223–233. [Google Scholar] [CrossRef]
  12. Boukoberine, M.N.; Zhou, Z.; Benbouzid, M. A critical review on unmanned aerial vehicles power supply and energy management: Solutions, strategies, and prospects. Appl. Energy 2019, 255, 113823. [Google Scholar] [CrossRef]
  13. Bauwens, S.; Bartholomeus, H.; Calders, K.; Lejeune, P. Forest inventory with terrestrial LiDAR: A comparison of static and hand-held mobile laser scanning. Forests 2016, 7, 127. [Google Scholar] [CrossRef]
  14. Naidoo, L.; Cho, M.A.; Mathieu, R.; Asner, G. Classification of savanna tree species, in the Greater Kruger National Park region, by integrating hyperspectral and LiDAR data in a Random Forest data mining environment. ISPRS J. Photogramm. Remote Sens. 2012, 69, 167–179. [Google Scholar] [CrossRef]
  15. Béland, M.; Widlowski, J.L.; Fournier, R.A.; Côté, J.F.; Verstraete, M.M. Estimating leaf area distribution in savanna trees from terrestrial LiDAR measurements. Agric. For. Meteorolo. 2011, 151, 1252–1266. [Google Scholar] [CrossRef]
  16. Wilkes, P.; Lau, A.; Disney, M.; Calders, K.; Burt, A.; de Tanago, J.G.; Bartholomeus, H.; Brede, B.; Herold, M. Data acquisition considerations for Terrestrial Laser Scanning of forest plots. Remote. Sens. Environ. 2017, 196, 140–153. [Google Scholar] [CrossRef]
  17. Maas, H.G.; Bienert, A.; Scheller, S.; Keane, E. Automatic forest inventory parameter determination from terrestrial laser scanner data. Int. J. Remote Sens. 2008, 29, 1579–1593. [Google Scholar] [CrossRef]
  18. Tansey, K.; Selmes, N.; Anstee, A.; Tate, N.J.; Denniss, A. Estimating tree and stand variables in a Corsican Pine woodland from terrestrial laser scanner data. Int. J. Remote Sens. 2009, 30, 5195–5209. [Google Scholar] [CrossRef]
  19. Bogdanovich, E.; Perez-Priego, O.; El-Madany, T.S.; Guderle, M.; Pacheco-Labrador, J.; Levick, S.R.; Moreno, G.; Carrara, A.; Martín, M.P.; Migliavacca, M. Using terrestrial laser scanning for characterizing tree structural parameters and their changes under different management in a Mediterranean open woodland. For. Ecol. Manag. 2021, 486, 118945. [Google Scholar] [CrossRef]
  20. Tao, S.; Wu, F.; Guo, Q.; Wang, Y.; Li, W.; Xue, B.; Hu, X.; Li, P.; Tian, D.; Li, C.; et al. Segmenting tree crowns from terrestrial and mobile LiDAR data by exploring ecological theories. ISPRS J. Photogramm. Remote. Sens. 2015, 110, 66–76. [Google Scholar] [CrossRef]
  21. Pirotti, F.; Kobal, M.; Roussel, J.R. A COMPARISON OF TREE SEGMENTATION METHODS USING VERY HIGH DENSITY AIRBORNE LASER SCANNER DATA. Int. Arch. Photogramm. Remote. Sens. Spat. Inf. Sci.-ISPRS Arch. 2017, 42, 285–290. [Google Scholar] [CrossRef]
  22. Xu, X.; Iuricich, F.; Calders, K.; Armston, J.; De Floriani, L. Topology-based individual tree segmentation for automated processing of terrestrial laser scanning point clouds. Int. J. Appl. Earth Obs. Geoinf. 2023, 116, 103145. [Google Scholar] [CrossRef]
  23. Zhan, Q.; Liang, Y.; Xiao, Y. Color-Based Segmentation of Point Clouds. In Laser Scanning; IAPRS: Hannover, Germany, 2009; Volume XXXVIII, pp. 248–252. [Google Scholar]
  24. Fisher, J.T.; Erasmus, B.F.N.; Witkowski, E.T.F.; van Aardt, J.; Wessels, K.J.; Asner, G.P. Savanna woody vegetation classification-now in 3-D. Appl. Veg. Sci. 2014, 17, 172–184. [Google Scholar] [CrossRef]
  25. Xin, H.L.; Malhi, Y.; Coomes, D.A.; Lin, Y.; Liu, B.L.; Yang, Q.L.; Shenkin, A. Individual tree detection and crown segmentation based on metabolic theory from airborne laser scanning data. J. Appl. Remote Sens. 2021, 15, 034504. [Google Scholar] [CrossRef]
  26. Liu, Q.; Ma, W.; Zhang, J.; Liu, Y.; Xu, D.; Wang, J. Point-cloud segmentation of individual trees in complex natural forest scenes based on a trunk-growth method. J. For. Res. 2021, 32, 2403–2414. [Google Scholar] [CrossRef]
  27. Williams, J.; Schonlieb, C.B.; Swinfield, T.; Lee, J.; Cai, X.; Qie, L. 3D Segmentation of Trees through a Flexible Multiclass Graph Cut Algorithm. IEEE Trans. Geosci. Remote Sens. 2020, 58, 754–776. [Google Scholar] [CrossRef]
  28. Swetnam, T.L.; Falk, D.A. Application of Metabolic Scaling Theory to reduce error in local maxima tree segmentation from aerial LiDAR. For. Ecol. Manage. 2014, 323, 158–167. [Google Scholar] [CrossRef]
  29. Zhu, D.; Liu, X.; Zheng, Y.; Xu, L.; Huang, Q. Improved Tree Segmentation Algorithm Based on Backpack-LiDAR Point Cloud. Forests 2024, 15, 136. [Google Scholar] [CrossRef]
  30. Raumonen, P.; Brede, B.; Lau, A.; Bartholomeus, H. A Shortest Path Based Tree Isolation Method for UAV LiDAR Data. In Proceedings of the 2021 IEEE International Geoscience and Remote Sensing Symposium IGARSS, Brussels, Belgium, 11–16 July 2021; pp. 724–727. [Google Scholar] [CrossRef]
  31. Scholes, R.J.; Gureja, N.; Giannecchinni, M.; Dovie, D.; Wilson, B.; Davidson, N.; Piggott, C.; McLoughlin, K.; van der Velde, A.; Freeman, S.; et al. The environment and vegetation of the flux measurement site near Skukuza, Kruger National Park. Koedoe 2001, 44, 73–84. [Google Scholar] [CrossRef]
  32. Dyer, C. New names for the African Acacia species in Vachellia and Senegalia. South. Forests. 2014, 76, iii. [Google Scholar] [CrossRef]
  33. Muumbe, T.P.; Baade, J.; Raumonen, P.; Coetsee, C.; Singh, J.; Schmullius, C. Quantifying Tree Structural Change in an African Savanna by Utilizing Multi-Temporal TLS Data. Remote Sens. 2025, 17, 757. [Google Scholar] [CrossRef]
  34. MacFadyen, S.; Zambatis, N.; Van Teeffelen, A.J.A.; Hui, C. Long-term rainfall regression surfaces for the Kruger National Park, South Africa: A spatio-temporal review of patterns from 1981 to 2015. Int. J. Climatol. 2018, 38, 2506–2519. [Google Scholar] [CrossRef]
  35. RIEGL Laser Measurements Systems, “RIEGL VZ-1000 High-Resolution and Accurate 3D Measurements”, Data Sheet 2017, pp. 1–4. Available online: http://www.riegl.com/uploads/tx_pxpriegldownloads/DataSheet_VZ-1000_2017-06-14.pdf (accessed on 15 January 2025).
  36. Riegl LMS GmbH, “RiSCAN PRO.” 2013, pp. 1–21. Available online: http://www.riegl.com/uploads/tx_pxpriegldownloads/RiSCAN-PRO_DataSheet_2022-10-07.pdf (accessed on 15 January 2025).
  37. Burt, A.; Disney, M.; Calders, K. Extracting individual trees from lidar point clouds using treeseg. Methods Ecol. Evol. 2019, 10, 438–445. [Google Scholar] [CrossRef]
  38. Girardeau-Montaut, D. “CloudCompare”. Paris, France. 2022. Available online: https://github.com/CloudCompare (accessed on 15 January 2025).
  39. Li, W.; Guo, Q.; Jakubowski, M.K.; Kelly, M. A new method for segmenting individual trees from the lidar point cloud. Photogramm. Eng. Remote Sens. 2012, 78, 75–84. [Google Scholar] [CrossRef]
  40. Wielgosz, M.; Puliti, S.; Xiang, B.; Schindler, K.; Astrup, R. SegmentAnyTree: A sensor and platform agnostic deep learning model for tree segmentation using laser scanning data. Remote. Sens. Environ. 2024, 313, 114367. [Google Scholar] [CrossRef]
  41. Singh, M.; Evans, D.; Tan, B.S.; Nin, C.S. Mapping and Characterizing Selected Canopy Tree Species at the Angkor World Heritage Site in Cambodia Using Aerial Data. PLoS ONE 2015, 10, e0121558. [Google Scholar] [CrossRef] [PubMed]
  42. Yu, J.; Lei, L.; Li, Z. Individual Tree Segmentation Based on Seed Points Detected by an Adaptive Crown Shaped Algorithm Using UAV-LiDAR Data. Remote Sens. 2024, 16, 825. [Google Scholar] [CrossRef]
  43. Raumonen, P.; Kaasalainen, M.; Åkerblom, M.; Kaasalainen, S.; Kaartinen, H.; Vastaranta, M.; Holopainen, M.; Disney, M.; Lewis, P. Fast automatic precision tree models from terrestrial laser scanner data. Remote Sens. 2013, 5, 491–520. [Google Scholar] [CrossRef]
  44. Raumonen, P.; Casella, E.; Calders, K.; Murphy, S.; Åkerbloma, M.; Kaasalainen, M. Massive-Scale Tree Modelling From Tls Data. ISPRS Ann. Photogramm. Remote Sens. Spat. Inf. Sci. 2015, II-3/W4, 189–196. [Google Scholar] [CrossRef]
  45. Calders, K.; Newnham, G.; Burt, A.; Murphy, S.; Raumonen, P.; Herold, M.; Culvenor, D.; Avitabile, V.; Disney, M.; Armston, J.; et al. Nondestructive estimates of above-ground biomass using terrestrial laser scanning. Methods Ecol. Evol. 2015, 6, 198–208. [Google Scholar] [CrossRef]
  46. Fekry, R.; Yao, W.; Cao, L.; Shen, X. Ground-based/UAV-LiDAR data fusion for quantitative structure modeling and tree parameter retrieval in subtropical planted forest. For. Ecosyst. 2022, 9, 100065. [Google Scholar] [CrossRef]
  47. Wilkes, P.; Shenkin, A.; Disney, M.; Malhi, Y.; Bentley, L.P.; Vicari, M.B. Terrestrial laser scanning to reconstruct branch architecture from harvested branches. Methods Ecol. Evol. 2021, 12, 2487–2500. [Google Scholar] [CrossRef]
  48. Abegg, M.; Bösch, R.; Kükenbrink, D.; Morsdorf, F. Tree volume estimation with terrestrial laser scanning — Testing for bias in a 3D virtual environment. Agric. For. Meteorol. 2023, 331, 109348. [Google Scholar] [CrossRef]
  49. The R Project for Statistical Computing. Available online: https://www.r-project.org/ (accessed on 4 December 2024).
  50. Wang, D. Unsupervised semantic and instance segmentation of forest point clouds. ISPRS J. Photogramm. Remote Sens. 2020, 165, 86–97. [Google Scholar] [CrossRef]
  51. Luck, L.; Hutley, L.B.; Calders, K.; Levick, S.R. Exploring the variability of tropical savanna tree structural allometry with terrestrial laser scanning. Remote Sens. 2020, 12, 3893. [Google Scholar] [CrossRef]
  52. Martin-Ducup, O.; Mofack, G.; Wang, D.; Raumonen, P.; Ploton, P.; Sonké, B.; Barbier, N.; Couteron, P.; Pélissier, R. Evaluation of automated pipelines for tree and plot metric estimation from TLS data in tropical forest areas. Ann. Bot. 2021, 128, 753–766. [Google Scholar] [CrossRef]
  53. Lisiewicz, M.; Kamińska, A.; Kraszewski, B.; Stereńczak, K. Correcting the Results of CHM-Based Individual Tree Detection Algorithms to Improve Their Accuracy and Reliability. Remote Sens. 2022, 14, 1822. [Google Scholar] [CrossRef]
  54. Wilkes, P.; Disney, M.; Armston, J.; Bartholomeus, H.; Bentley, L.; Brede, B.; Burt, A.; Calders, K.; Chavana-Bryant, C.; Clewley, D.; et al. TLS2trees: A scalable tree segmentation pipeline for TLS data. Methods Ecol. Evol. 2023, 14, 3083–3099. [Google Scholar] [CrossRef]
  55. Steier, J.; Goebel, M.; Iwaszczuk, D. Is Your Training Data Really Ground Truth? A Quality Assessment of Manual Annotation for Individual Tree Crown Delineation. Remote Sens. 2024, 16, 2786. [Google Scholar] [CrossRef]
  56. Zhang, Q.; Cai, S.; Liang, X. Individual tree segmentation in occluded complex forest stands through ellipsoid directional searching and point compensation. For. Ecosyst. 2024, 11, 100238. [Google Scholar] [CrossRef]
  57. Wang, D.; Liang, X.; Mofack, G.I.; Martin-Ducup, O. Individual tree extraction from terrestrial laser scanning data via graph pathing. For. Ecosyst. 2021, 8, 67. [Google Scholar] [CrossRef]
  58. Wardius, Y.; Hein, S. Terrestrial laser scanning vs. manual methods for assessing complex forest stand structure: A comparative analysis on plenter forests. Eur. J. For. Res. 2024, 143, 635–649. [Google Scholar] [CrossRef]
  59. Allen, M.J.; Owen, H.J.F.; Grieve, S.W.D.; Lines, E.R. Manual Labelling Artificially Inflates Deep Learning-Based Segmentation Performance on Closed Canopy: Validation Using TLS. arXiv 2025, arXiv:2503.14273. [Google Scholar]
  60. Brede, B.; Terryn, L.; Barbier, N.; Bartholomeus, H.M.; Bartolo, R.; Calders, K.; Derroire, G.; Moorthy, S.M.K.; Lau, A.; Levick, S.R.; et al. Non-destructive estimation of individual tree biomass: Allometric models, terrestrial and UAV laser scanning. Remote Sens Environ. 2022, 280, 113180. [Google Scholar] [CrossRef]
  61. Calders, K.; Adams, J.; Armston, J.; Bartholomeus, H.; Bauwens, S.; Bentley, L.P.; Chave, J.; Danson, F.M.; Demol, M.; Disney, M.; et al. Terrestrial laser scanning in forest ecology: Expanding the horizon. Remote Sens. Environ. 2020, 251, 112102. [Google Scholar] [CrossRef]
  62. Fu, H.; Li, H.; Dong, Y.; Xu, F.; Chen, F. Segmenting Individual Tree from TLS Point Clouds Using Improved DBSCAN. Forests 2022, 13, 566. [Google Scholar] [CrossRef]
  63. Ye, N.; van Leeuwen, L.; Nyktas, P. Analysing the potential of UAV point cloud as input in quantitative structure modelling for assessment of woody biomass of single trees. Int. J. Appl. Earth Obs. Geoinf. 2019, 81, 47–57. [Google Scholar] [CrossRef]
  64. Morales, A.; Macfarlane, D.W. Reducing tree volume overestimation in quantitative structure models using modeled branch topology and direct twig measurements. For. An. Int. J. For. Res. 2024, 98, 394–409. [Google Scholar] [CrossRef]
  65. Li, Y.; Xie, D.; Wang, Y.; Jin, S.; Zhou, K.; Zhang, Z.; Li, W.; Zhang, W.; Mu, X.; Yan, G. Individual tree segmentation of airborne and UAV LiDAR point clouds based on the watershed and optimized connection center evolution clustering. Ecol. Evol. 2023, 13, e10297. [Google Scholar] [CrossRef]
  66. Yang, Q.; Su, Y.; Jin, S.; Kelly, M.; Hu, T.; Ma, Q.; Li, Y.; Song, S.; Zhang, J.; Xu, G.; et al. The influence of vegetation characteristics on individual tree segmentation methods with airborne LiDAR data. Remote Sens. 2019, 11, 2880. [Google Scholar] [CrossRef]
  67. Hamraz, H.; Contreras, M.A.; Zhang, J. Forest understory trees can be segmented accurately within sufficiently dense airborne laser scanning point clouds. Sci. Rep. 2017, 7, 6770. [Google Scholar] [CrossRef]
  68. Chen, X.; Wang, R.; Shi, W.; Li, X.; Zhu, X.; Wang, X. An Individual Tree Segmentation Method That Combines LiDAR Data and Spectral Imagery. Forests 2023, 14, 1009. [Google Scholar] [CrossRef]
  69. Richardson, J.J.; Monika Moskal, L.; Bakker, J.D. Terrestrial laser scanning for vegetation sampling. Sensors 2014, 14, 20304–20319. [Google Scholar] [CrossRef]
  70. Goebel, M.; Iwaszczuk, D. Backpack System for Capturing 3D Point Clouds of Forests. ISPRS Ann. Photogramm. Remote Sens. Spat. Inf. Sci. 2023, 10, 695–702. [Google Scholar] [CrossRef]
Figure 1. Study area location (left) showing the scanned area marked in black and the 15.2 ha study area plot used for analysis marked in grey, and (right) the map of Kruger National Park showing the location of Skukuza Flux Tower where scanning was conducted.
Land 14 01761 g001
Figure 2. Field photos showing the state of the study area when scanning was conducted.
Land 14 01761 g002
Figure 3. Example of a true positive, false positive, and false negative (left) derived using the CSP algorithm [20] and (right) derived from the SPBTIM algorithm [30].
Land 14 01761 g003
Figure 4. Occupied voxel count CSP [20] and SPBTIM [30] over segmented trees (false positives) with reference trees. Each bar in the figure corresponds to a tree.
Land 14 01761 g004
Figure 5. Occupied voxel count CSP [20] and SPBTIM [30] under segmented trees (false negatives) with reference trees. Each bar in the figure corresponds to a tree.
Land 14 01761 g005
Figure 6. Examples of a branch/felled tree, shrub, and standing tree (damaged, small, and dead) (left) segmented using the CSP algorithm [20] and (right) segmented from the SPBTIM algorithm [30].
Land 14 01761 g006aLand 14 01761 g006b
Figure 7. Examples of multi-stemmed trees correctly segmented (left), segmented using the CSP algorithm [20], and (right) from the SPBTIM algorithm [30]. The point clouds are coloured according to height.
Land 14 01761 g007
Figure 8. Trees in clusters (left) segmented using the CSP algorithm [20] and (right) segmented from the SPBTIM algorithm [30]. The different colours denote segments.
Land 14 01761 g008
Figure 9. Trees with extended branches (left) segmented using the CSP algorithm [20] and (right) segmented from the SPBTIM algorithm [30]. The different colours denote segments.
Land 14 01761 g009
Figure 10. Suppressed small trees (left) segmented using the CSP algorithm [20] and (right) segmented from the SPBTIM algorithm [30]. The different colours denote segments.
Land 14 01761 g010
Table 1. Advantages and disadvantages of the comparative shortest path (CSP) algorithm.
ADVANTAGESDISADVANTAGES
High accuracy
Automatic segmentation
Estimation of individual tree attributes (unique ID, location, tree height, DBH, crown area, crown diameter, and crown volume)
Customisable parameters to suit forest type
Segmentation editing is possible
Extraction of individual segments is possible
Can handle large datasets
3D Visualization
Costs and licensing
Accurate segmentation is dependent on accurate pre-processing stages, as errors in these stages propagate into the final segmentation results
Sensitive to point density, low density affects segmentation results, and higher densities require more computing time
Table 2. Advantages and disadvantages of the shortest path-based tree isolation method (SPBTIM) algorithm.
ADVANTAGESDISADVANTAGES
Free and open-source software implemented in MATLAB, which can be modified and adapted to user needs
High accuracy
Automatic segmentation
Customizable parameters to suit forest type
Can handle large datasets
3D visualization
The implementing software (MATLAB) is not free and requires licensing costs
Estimation of individual tree parameters is not automatic and requires programming knowledge to extract individual trees and derive tree attributes
Table 3. Segmentation summary between the two methods.
Type of SegmentCSP SPBTIM
True positives (perfect segmentation)103103
False positive (over-segmented)1110
False negatives (under-segmented)1112
Recall (r)0.900.90
Precision (p)0.900.91
F-score0.900.90
Table 4. Comparison of occupied voxel count between segmentation methods and reference trees.
Type of Segment (n)CSP
Mean ± SE
Reference Trees
Mean ± SE
p Value
False Negatives (10)18,604 ± 383410,725 ± 32480.13
False Positives (11)41,057 ± 900357,264 ± 12,5240.31
SPBTIM
Mean ± SE
Reference trees
Mean ± SE
p value
False Negatives (12)18,486 ± 307412,804 ± 38450.26
False Positives (10)53,982 ± 795170,352 ± 76360.15
Table 5. Recovery ratio over segmented trees CSP and SPBTIM compared to the reference trees. In this case, common trees refer to those over-segmented by both methods.
Common Trees in Both Segmentation Methods
MetricFalse Positives—CSPFalse Positives—SPBTIM
ID47951768790691510441344Average common trees CSP34921538578695Average common trees
SPBTIM
p value
Tov58.555.396.9101.895.878.171.879.764.155.491.0102.296.188.766.080.50.94
TrV121.4100.1101.499.695.8126.690.6105.1194.6100.497.2100.6100.196.388.3111.10.70
BrV50.943.795.2102.595.867.969.675.148.443.788.6102.794.387.163.475.50.98
TH109.997.4100.9100.0100.573.6100.397.5110.297.398.6100.4100.566.299.896.10.84
BrL37.136.184.980.4103.064.153.665.636.534.368.779.1101.234.349.457.60.57
DBH54.299.9105.198.899.3103.290.893.078.3102.697.499.0103.589.890.394.40.86
CA66.769.994.491.498.267.075.080.470.568.292.493.798.447.883.679.20.90
Different trees
MetricFalse positive—CSPFalse Positives—SPBTIM
ID15956718051513 Average all trees CSP161959 Average all trees
SPBTIM
p value
Tov82.598.994.750.3 80.4100.7122.289.0 87.50.42
TrV118.3100.2100.792.5 104.3101.683.5103.8 106.60.83
BrV75.496.192.241.3 75.5100.5139.982.0 85.10.40
TH99.0100.5100.299.8 98.4100.495.199.9 96.80.73
BrL57.997.475.435.2 65.973.367.771.6 61.60.68
DBH101.499.597.397.7 95.298.5102.5101.5 96.30.82
CA66.198.688.647.5 78.595.972.184.3 80.70.76
ToV is the total volume, TrV is the trunk volume, BrV is the branch volume, BrL is the branch length, DBH is the diameter at breast height, TH is the tree height, and CA is the crown area. The parameter unit is %. The p-value is computed based on the averages per method.
Table 6. Recovery ratio under segmented trees CSP and SPBTIM compared to the reference trees. Common trees, in this case, were under-segmented by both methods.
Common Trees
MetricFalse Negatives—CSPFalse Negatives—SPBTIM
ID9779771723172347857069883511051085Average common trees CSP114114133133761226483115111Average common trees SPBTIMp value
Tov185.7201.6170.6195.8269.8148.3112.0104.91000.9451.8284.1192.4208.8175.0200.9240.579.3106.6102.91029.7836.1317.20.81
TrV102.1103.8150.4131.4199.9127.594.672.8965.6222.7217.198.399.9151.2132.1136.084.595.170.91647.0452.9296.80.66
BrV224.2251.2179.0236.2292.3152.9119.7110.91005.3516.3308.8235.6264.0184.9244.1274.378.2111.6109.0952.4944.2339.80.82
TH97.2110.2100.2103.6218.4172.7116.4137.7213.0231.2150.1100.1113.499.2102.5205.7170.0116.0142.7205.0251.8150.60.98
BrL169.1160.2147.3208.0212.1132.6113.183.7501.8382.5211.0186.2176.5122.5173.0223.872.4105.879.3436.6834.3241.00.73
DBH108.198.3134.7116.1143.8102.3101.469.2343.8171.2138.9106.296.6128.9111.1102.7102.6105.063.4357.9186.1136.10.94
CA198.4194.0136.2218.1197.6213.2103.7110.6425.5167.9196.5225.3220.3131.8211.1251.7165.7105.9105.9475.6333.6222.70.58
Different trees
Metricxxx False negatives—SPBTIM
ID 89116 Average all treesp value
Tov 70.1247.6 290.80.96
TrV 118.0278.6 280.40.70
BrV 64.5241.5 308.70.99
TH 107.0180.4 149.50.98
BrL 49.0219.3 223.20.88
DBH 96.8107.1 130.40.80
CA 70.7269.6 214.00.70
ToV is the total volume, TrV is the trunk volume, BrV is the branch volume, BrL is the branch length, DBH is the diameter at breast height, TH is the tree height, and CA is the crown area. The parameter unit is %. The p-value is computed based on the averages per method.
Disclaimer/Publisher’s Note: The statements, opinions and data contained in all publications are solely those of the individual author(s) and contributor(s) and not of MDPI and/or the editor(s). MDPI and/or the editor(s) disclaim responsibility for any injury to people or property resulting from any ideas, methods, instructions or products referred to in the content.