Abstract
Understanding how land use and climate change jointly affect water availability is essential for sustainable planning in tropical Andean–Amazonian basins. This study focuses on the Utcubamba River Basin in northeastern Peru, a data-scarce and socioecologically strategic watershed where land transformation and climate variability converge. A multi-temporal land use/land cover (LULC) analysis (1990–2024) was conducted, coupled with hydrological modeling using the SWAT model under historical and future climate scenarios (SSP2–4.5 and SSP5–8.5), including the spatial overlay of the LULC change concentration with key hydrological indicators. LULC classifications revealed forest loss and the expansion of pasture, agriculture, and shrubland areas, particularly in the upper basin. Hydrological projections showed significant changes in water flow, including reductions in minimum monthly flows by up to 73.9% and increases in peak flows by 14.8% under the SSP5–8.5 scenario. The water balance is expected to shift, with increased percolation and reduced lateral flow, suggesting decreased storage capacity. By identifying critical sub-basins where land degradation and water insecurity converge, the study supports adaptive strategies for land restoration, aquifer recharge planning, and ecosystem conservation. Despite limited hydrological infrastructure, the SWAT model effectively simulated water dynamics, aiding climate resilience and water security efforts in the Amazonian Andes.
1. Introduction
Global water scarcity is exacerbated by population growth, environmental deterioration, and the acceleration of the effects of climate change, severely impacting areas already vulnerable to water stress [1]. More than 50% of the world’s water needs are met through rivers and streams whose flows are influenced by long-term changes in precipitation, temperature and evapotranspiration [2,3]. In recent decades, human development has led to changes in land use and climate, affecting water resources and ecosystems [4,5]. These transformations highlight the importance of integrated water management, which encompasses multiple interrelated elements that influence the environment, ecology, economy, and society [6,7]. In this context, runoff emerges as a critical factor in hydrological processes, playing a vital role in ecological and environmental changes at the regional level and exerting considerable influence on economic development [8].
Understanding and managing runoff becomes essential for watershed management. This is supported by hydrological models, Geographic Information System (GIS) tools, and remote sensing techniques that process and analyze date to understand hydrological processes [9,10]. These processes, in particular the use of models like the Soil and Water Assessment Tool (SWAT), are notable for integrating climate, soil, topography, and land use data, enabling simulations of water flow, quality, and sedimentation over different timescales [11,12,13]. SWAT, developed by the US Department of Agriculture—Agricultural Research Service (USDA-ARS) and Texas A&M AgriLife Research, is a flexible and widely used model for simulating hydrological responses to land use changes and managing water resources. It integrates climate, soil, and land use data, making it suitable especially in data-scarce regions [14,15,16]. Around the world, it has been used to evaluate the effects of land disturbances on water flow, sediment, and pollutants, relying primarily on precipitation and temperature as input data [17,18].
In the context of climate change, several studies have used the SWAT model to assess the impacts of land use and climate variability on flow dynamics across watersheds worldwide [18,19,20]. These models are often run under future scenarios based on Shared Socioeconomic Pathways (SSP) or using data from the Coupled Model Intercomparison Project Phase 6 (CMIP6), which simulate changes in precipitation and temperature that can influence runoff, infiltration, and overall water balance [21,22,23]. In tropical biomes, these hydrological shifts are further driven by land cover transformations due to deforestation, agricultural expansion, and settlement growth [23,24,25]. In the tropical Andes, for instance, several studies have reported that land use and land cover (LULC) changes significantly affect streamflow regimes, particularly in watersheds of the Colombian and Ecuadorian Andes [15,25].
In ecosystems across Peruvian territory, the application of the SWAT model has predominantly focused along the Pacific and in semi-arid basins, demonstrating its capacity to represent the water balance and capture the seasonal variations in key hydrological components [26]. However, its use in the Amazonian Andes remains limited. Notably, the model has been applied in a basin where hydrometeorological data are scarce to assess the effects of deforestation from gold mining on hydrological response, providing reliable daily streamflow data for tributaries of the Madre de Dios river [27]. Another major river is the Utcubamba, located in northwestern Peru. It is an important tributary of the Marañón River, which in turn feeds into the Amazon River. The Utcubamba Basin, which shares its name with the river, is a key area due to its ecological, hydrological and socioeconomic importance. Ecologically, it include diverse ecosystems and protected areas, which interconnected trough ecological corridors that contribute to biodiversity and conservation [28]. Hydrologically, it feeds the Marañón River and provides crucial water resources for agriculture, waterfalls, and local communities. Socioeconomically, the basin supports key activities such as agriculture, aquaculture, and ecotourism, underscoring its regional significance [29,30]. These factors position the Utcubamba Basin as a strategic area for conservation, water resource management, and climate adaptation efforts within the Andean–Amazon corridor of northern Peru.
However, the scarce availability of hydrometeorological data in this basin has constrained detailed analysis of hydrological processes, particularly in the context of ongoing climate change and its relationship with LULC in the area over time. This is particularly significant given that the Amazonas Department, where the Utcubamba Basin is located, experienced a cumulative forest loss of approximately 121,392 hectares between 2001 and 2023, with most of this loss occurring in small patches of less than 1 hectare and between 1 and 5 hectares (https://geobosques.minam.gob.pe/geobosque/view/perdida.php, accessed on 23 May 2025). Forest loss in small patches contributes to landscape fragmentation [31], and has long-term impacts on surface runoff, evapotranspiration, and groundwater recharge, as observed in similar contexts when assessing streamflow changes in headwater watersheds [16,17].
Therefore, the objectives of this study are (i) to analyze LULC changes in the Utcubamba River Basin from 1990 to 2024, in order to identify areas most susceptible to landscape transformation and their potential influence on hydrological dynamics, and (ii) to evaluate the applicability of the SWAT model in this Andean–Amazonian basin, characterized by scare hydrological data, to simulate streamflow behavior under current conditions and future climate scenarios, particularly under extreme emissions pathways. These insights will be fundamental for identifying priority areas for the restoration and management of natural resources. These insights are fundamental for identifying priority areas for the restoration and management of natural resources. By providing practical guidance for land and water planning in data-scarce mountain ecosystems and aligning with global sustainability objectives, this research significantly contributes to Sustainable Development Goals (SDGs) 6 (Clean Water and Sanitation), 13 (Climate Action), and 15 (Life on Land) [32]. Additionally, the SWAT model test will serve as a reference for evaluating water resources in data-scarce ecosystems such as the Utcubamba Basin, where urban expansion, landscape fragmentation, and climate change exacerbate water scarcity, highlighting the urgent need for integrated land and water management strategies.
2. Materials and Methods
2.1. Study Area
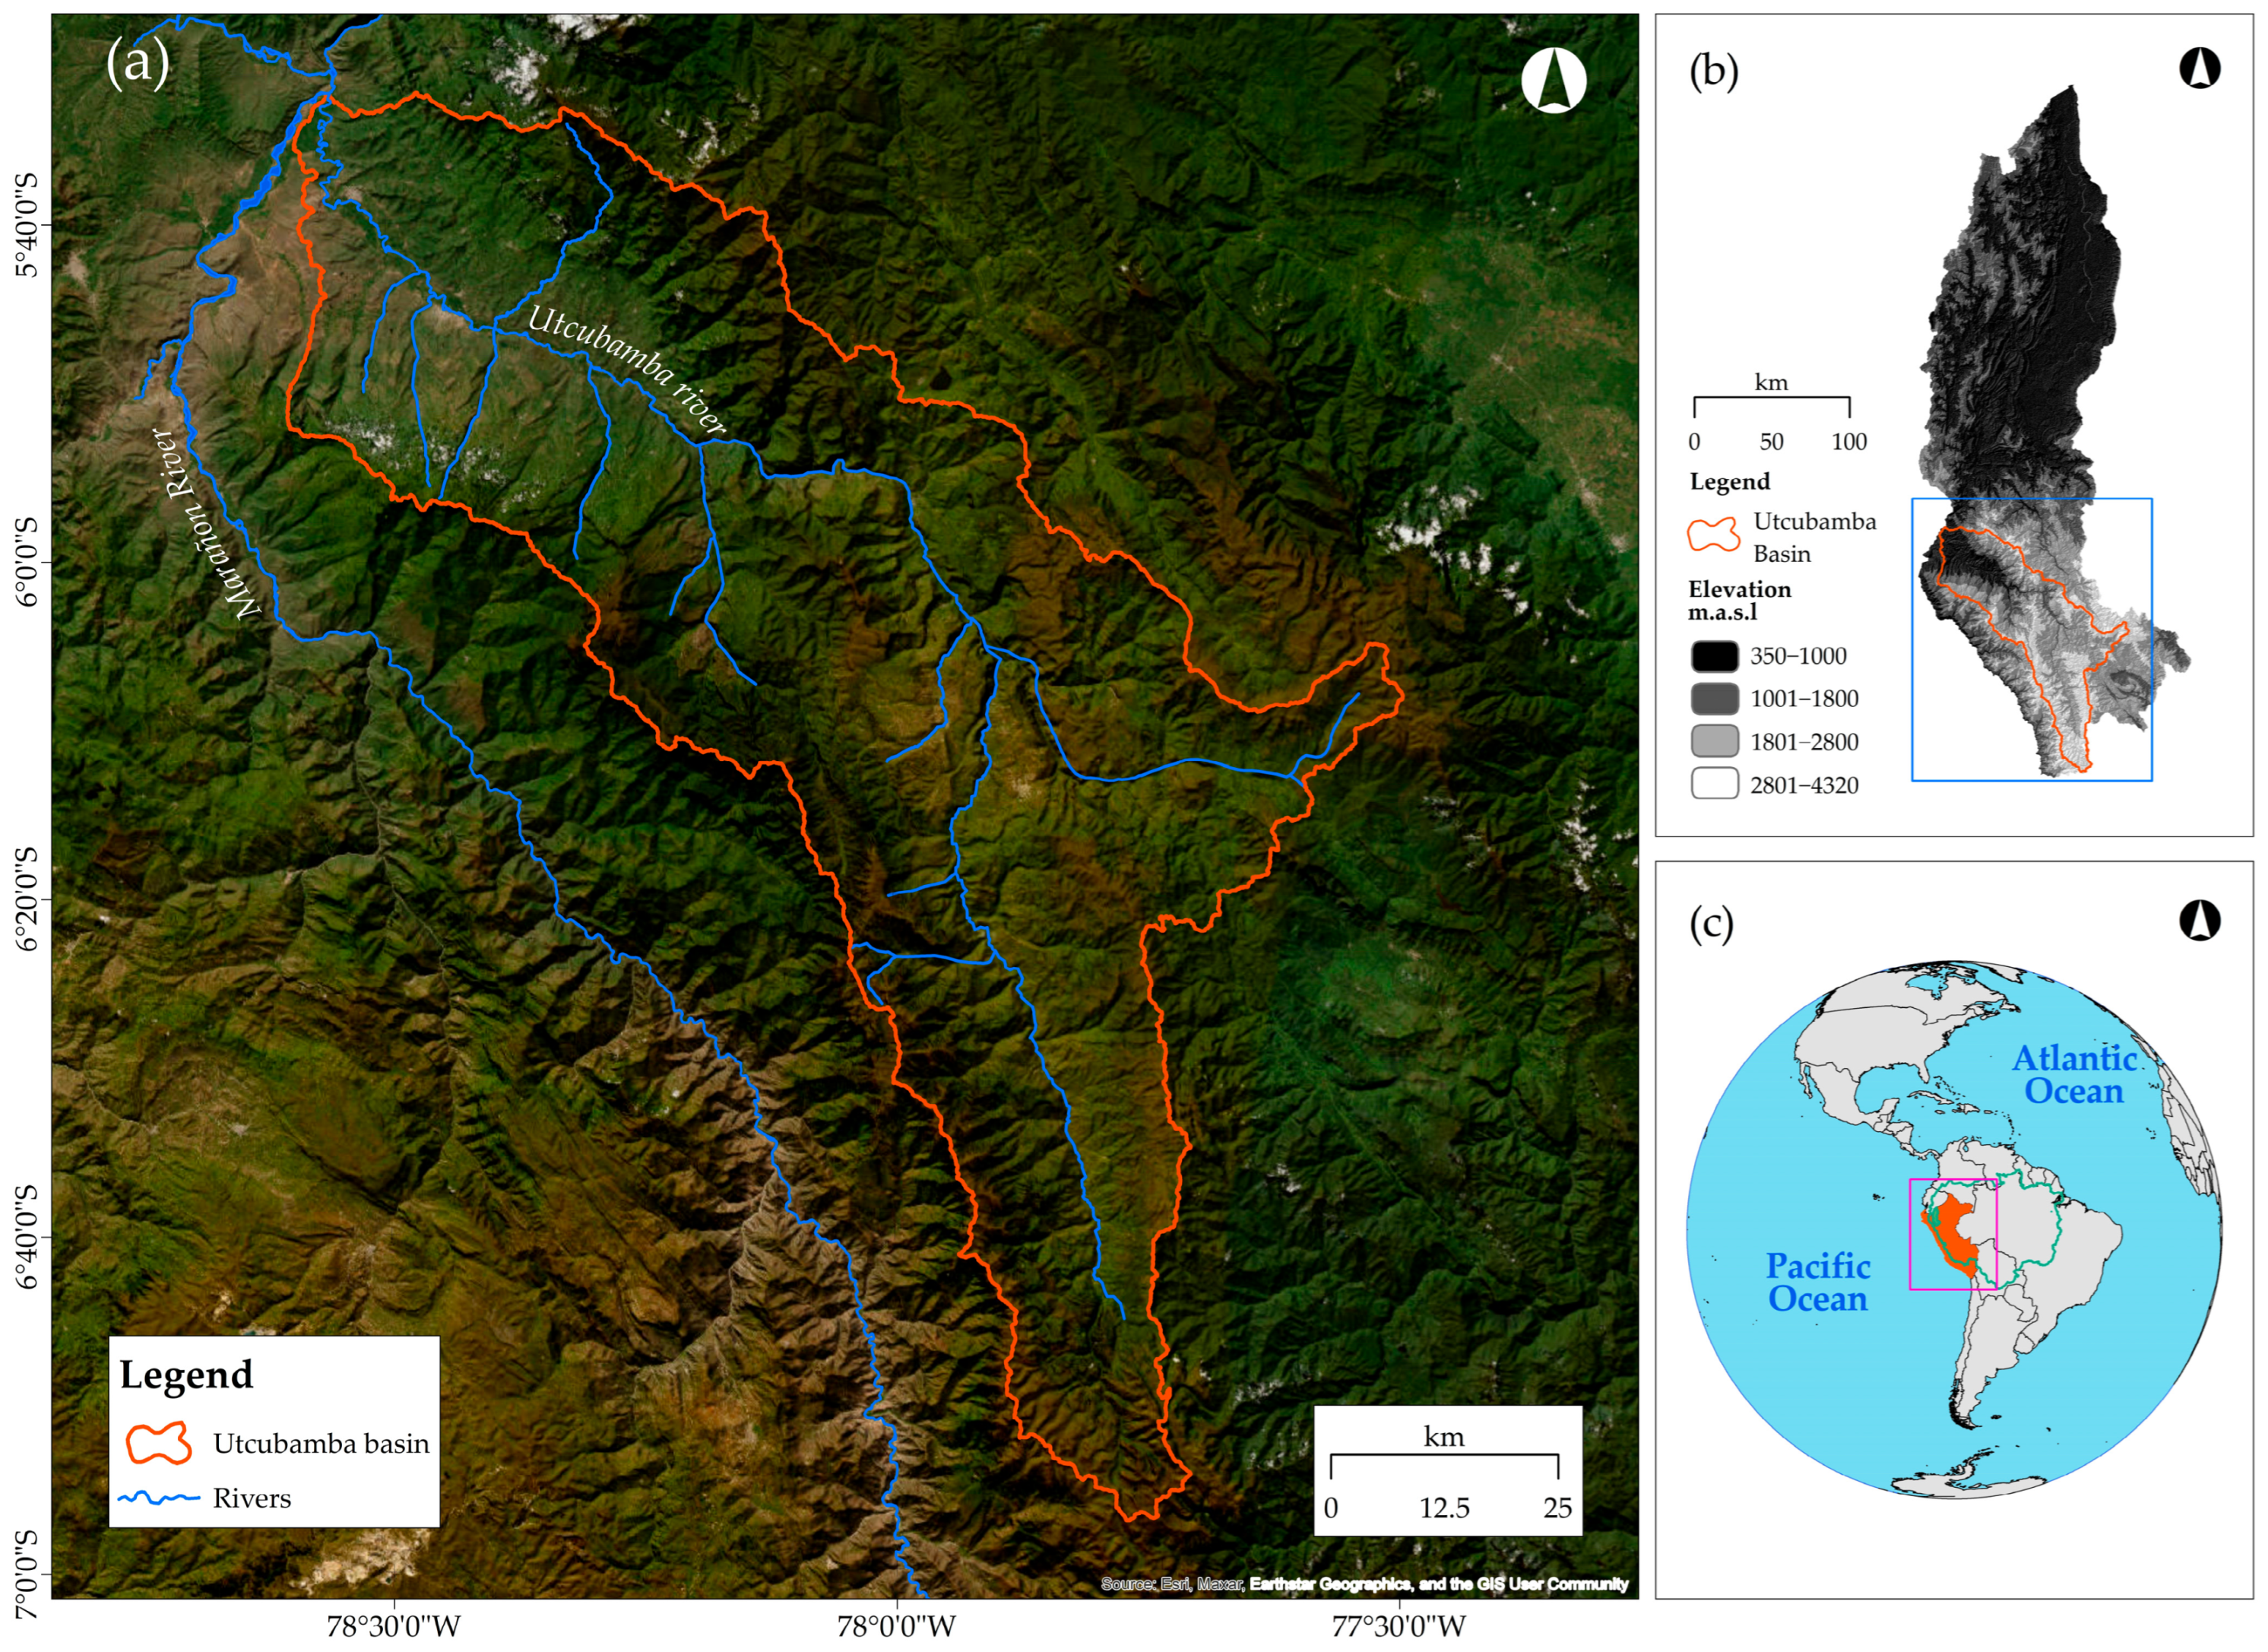
The study focuses on the Utcubamba Basin, located in the Amazonas Department in the Andean mountains of northeastern Peru. It covers an area of approximately 6650 km2 and ranges in elevation from 360 to 4200 m a.l.s (Figure 1). It is characterized by predominantly mountainous geomorphology, with structural landforms and slopes ranging from moderate to steep [33]. Within this territory, local communities, including both indigenous and mestizo settlements, have developed a close relationship with the land, engaging in agriculture, livestock, and ecotourism activities [34,35]. Approximately 220,000 inhabitants are distributed throughout the Utcubamba River Basin, with the main urban centers being the cities and towns of Bagua, Bagua Grande, Chachapoyas, Cajaruro, El Milagro, Leymebamba, and Pedro Ruiz [36]. Among agricultural activities, the cultivation of rice, coffee, and cocoa in the lower basin is a vital economic activity that provides livelihoods for numerous families, while corn and potato are primarily cultivated in the upper basin [30,37]. These activities, over the years, have led to changes in vegetation cover, as reflected in the fragmentation of the landscape within the territory of rural communities and conservation areas located in this basin [28,31].
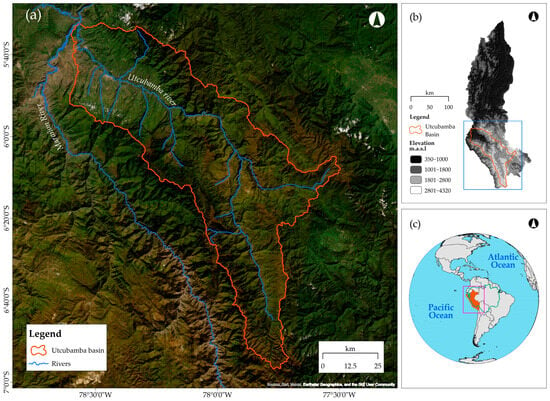
Figure 1.
Geographic location of (a) Utcubamba Basin, located in the (b) Amazonas Department in the (c) northwest of Peru.
According to the Peruvian National Meteorological and Hydrological Service (SENAMHI), regarding climatic conditions, in the lower Utcubamba Basin, the average temperatures range from 18 to 36 °C and there is an annual accumulated rainfall of 750 mm. In contrast, the upper part of the Utcubamba Basin is characterized by a rainy humid climate throughout the year, with semi-cold temperatures, as recorded by the Chachapoyas meteorological station. Temperatures range between 7 and 25 °C and the average annual accumulated rainfall is around 850 mm [38].
2.2. Land Use Land Cover Analysis
LULC analysis in the Utcubamba Basin was conducted using satellite remote sensing data and cloud-based processing through Google Earth Engine (GEE) [39]. Data acquisition involved selecting satellite images from the Landsat 5 (ID: LANDSAT/LT05/C02/T1_L2) and Landsat 8 (LANDSAT/LC08/C02/T1_L2) collections for the years 1990 and 2024, available in Google Earth Catalog (https://developers.google.com/earth-engine/datasets/catalog/landsat; accessed on 12 January 2025). A date filter was first applied from 1 January to 31 December to each Landsat collection for the target years. For each year, only scenes with less than 10% cloud cover were selected to generate annual mosaics, and cloud and shadow masks were applied following the methods used for satellite image analysis in this region [19,40]. Based on the spectral bands of each mosaic, several spectral indices were calculated, including the Normalized Difference Vegetation Index (NDVI) [41], Normalized Difference Water Index (NDWI) [42], Enhanced Vegetation Index (EVI) [43], Soil Adjusted Vegetation Index (SAVI) [44], Normalized Burn Ratio (NBR) [45], and Green Leaf Index (GLI) [46]. These indices, together with the 30 m spatial resolution slope layer derived from the Shuttle Radar Topography Mission (SRTM) digital elevation model (DEM) [47], were integrated to enhance the classification process and improve the prediction of LULC types [48]. The entire process was implemented on a GEE platform [39].
Land cover classes were defined according to the European Commission’s Coordination of Information on the Environment (CORINE) Land Cover nomenclature, adapted for Peru [49]. For the classification process, due to flexibility, ease of implementation, an ensemble structure based on multiple decision trees, and a proven capacity to achieve high mapping accuracy, the Random Forest (RF) machine learning algorithm [50] was used [51,52,53]. For this process, a total of 1000 training areas were visually identified using high-resolution imagery from sources such as Google Earth Pro and included in GEE code editor. These training areas were randomly distributed across 11 land cover classes: forest, dry forest, secondary forest, grassland, shrubs, pasture, agriculture, agricultural mosaic, urban, non-vegetated areas, and inland waters. This ensured balanced representation across all classes. The dataset was split so that 75% was used for model training and 25% was used for validation, as performed for similar ecosystems in previous studies [54]. The classification accuracy was evaluated using the Kappa index [55], a statistical measure that assesses the degree of agreement between the classified output and reference data, while accounting for the agreement that could occur by chance [56,57]. Finally, the classified raster generated in the GEE was exported and converted to a vector format in ArcGIS Pro v. 3.1.0 (ESRI, CA, USA) for further spatial analysis and mapping.
To assess land use changes between 1990 and 2024, spatial comparisons of the classified LULC maps were conducted in QGIS to identify transformation areas. Centroids were extracted from the resulting change polygons to represent the location of each land cover change event. We acted like this as most of these changes occurred in small, fragmented patches, typically under 5 hectares, and as the use of centroids provided a suitable representation of spatial patterns. These centroids were then used to generate a heatmap through the QGIS heatmap tool, applying kernel density estimation to visualize the spatial concentration of landscape changes. This approach for the identification of the concentration of forest loss aligns with the methodology proposed by the Peruvian Ministry of Environment [58] for territorial planning and land monitoring. The resulting heatmap also served as a spatial input for integration with hydrological modeling outputs, supporting the identification of areas where land cover change overlaps with significant alterations in water balance components.
2.3. Dataset Input for the SWAT Model
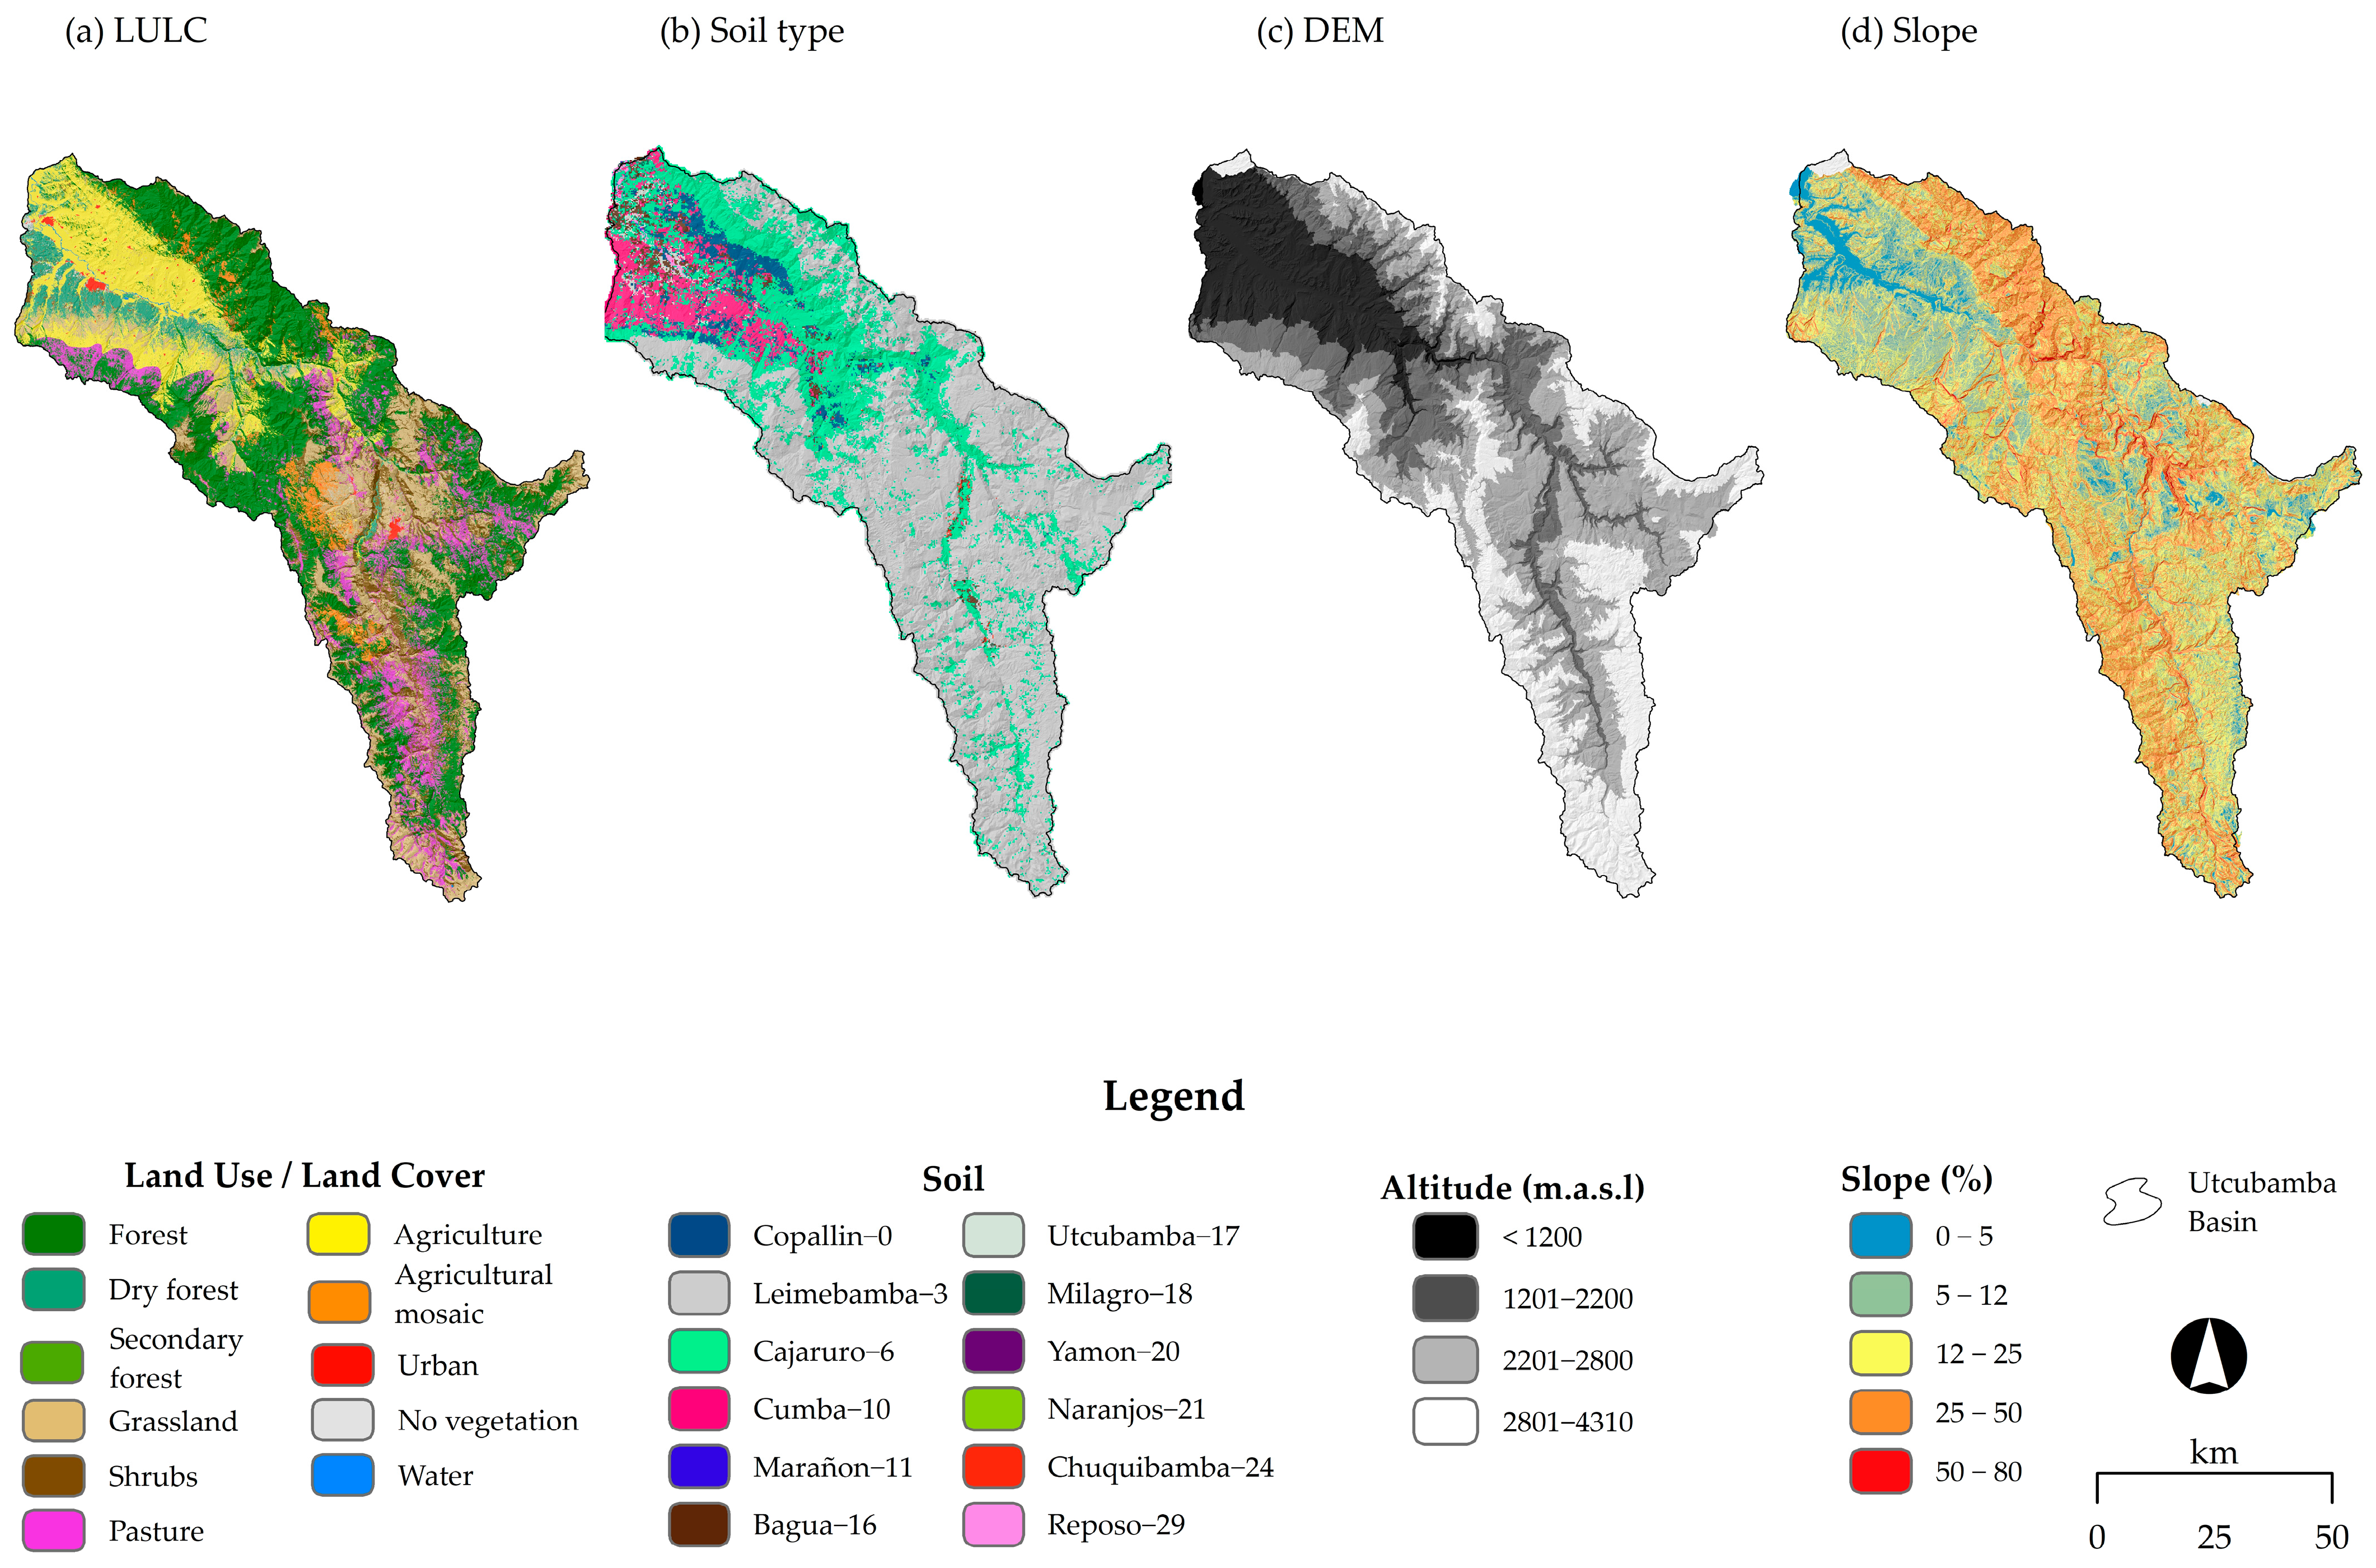
The 2024 LULC map obtained in the previous step was used as input (Figure 2a); land cover types were reclassified to match SWAT codes, as reported in previous studies conducted under similar topographic conditions in Colombia and Ecuador [25,59]. Soil type data with a spatial resolution of 250 m were obtained from SoilGrids: Global Information on Grid Soils [60]. The majority of the basin area is covered by Andosols (Leimebamba-3, Marga; 59.89%) and Cambisols (Cajaruro-6, Clay Grass; 26.69%), as depicted in Figure 2b. The same DEM used for LULC classification at a 30 m spatial resolution (Figure 2c) was also used to derive slope surface (Figure 2d), and subsequently to delineate sub-basins within the Utcubamba Basin using QSWAT version 2.0.1 within QGIS ver. 3.34.
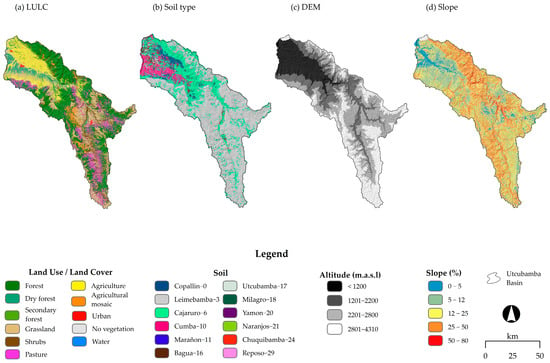
Figure 2.
Input layers of the SWAT model: land use (a), soil (b), DEM (c), and slope (d).
The lack of meteorological stations distributed throughout the study area limited the generation of raster data. As such, we only used local station records, gridded data on averaged precipitation, and temperature (min and max) data provided by the Peruvian Interpolated Data of SENAMHI’s Climatological and Hydrological Observations from 1981 to 2016 [61]. This dataset that has been widely used in hydrological analyses with the SWAT model to assess watershed responses to land cover change [26,27,62].
Monthly hydrometric data from 2002 to 2017, obtained from the Naranjos hydrological station located in the lower basin (Lon: −78.43; Lat: −5.75) and provided by the Peruvian governmental institutions of SENAMHI and the National Water Authority [63], were used for the calibration and validation of the SWAT model simulation.
Finally, after SWAT model calibration and validation, future hydrological behavior in the basin for the period 2015–2100 was predicted. Daily climate projections from the NEX-GDDP-CMIP6 dataset was used. Temperature (max and min) and precipitation were considered under extreme climate scenarios, with scenarios defined by the Shared Socioeconomic Pathways (SSP) 4.5 and 8.5, similar to a valid model used in similar studies [59,64]; the data were obtained from NASA Center for Climate Simulation [65].
Table 1 describes the climate, topographic, and hydrological data used as inputs for the SWAT model in this study.

Table 1.
Input dataset used in this study.
2.4. SWAT Model
SWAT is known for its flexibility and ability to simulate diverse regions with varying environmental conditions, topography, and data availability [15]. To ensure compatibility with the model execution, the input raster datasets were standardized to match the native spatial resolution of the DEM (30 m) using the nearest-neighbor resampling technique in QGIS, a method that has demonstrated high performance in preparing resampled data for use in the SWAT model [66,67].
In the initial configuration of the SWAT model, the Utcubamba Basin was delineated into sub-basins, and subsequently into hydrological response units (HRUs) based on slope, LULC, and soil data. Each HRU represents a homogeneous area within a sub-basin, sharing similar characteristics across these variables to support the simulation of land-phase hydrological processes [68]. For each HRU, the model calculates the water balance and subsequently integrates the results for each sub-basin, as considered in the Equation (1) [69,70].
where SWt represents the final volume of water stored in the soil at time “t”, expressed in millimeters (mm); SW0 is the initial soil water content (mm); “t” denotes the time in days; Rday is the precipitation that falls on day “i” (mm); Qsurf is surface runoff generated on that day (mm); Ea refers to the depth of evapotranspiration in days “i” (mm); and Eseep accounts for the percolation from the soil profile to the vadose zone in the day. Finally, Qgw represents the return flow or the volume of water that returns to the stream via baseflow on day “i” (mm).
2.5. Model Simulation, Calibration y Validation
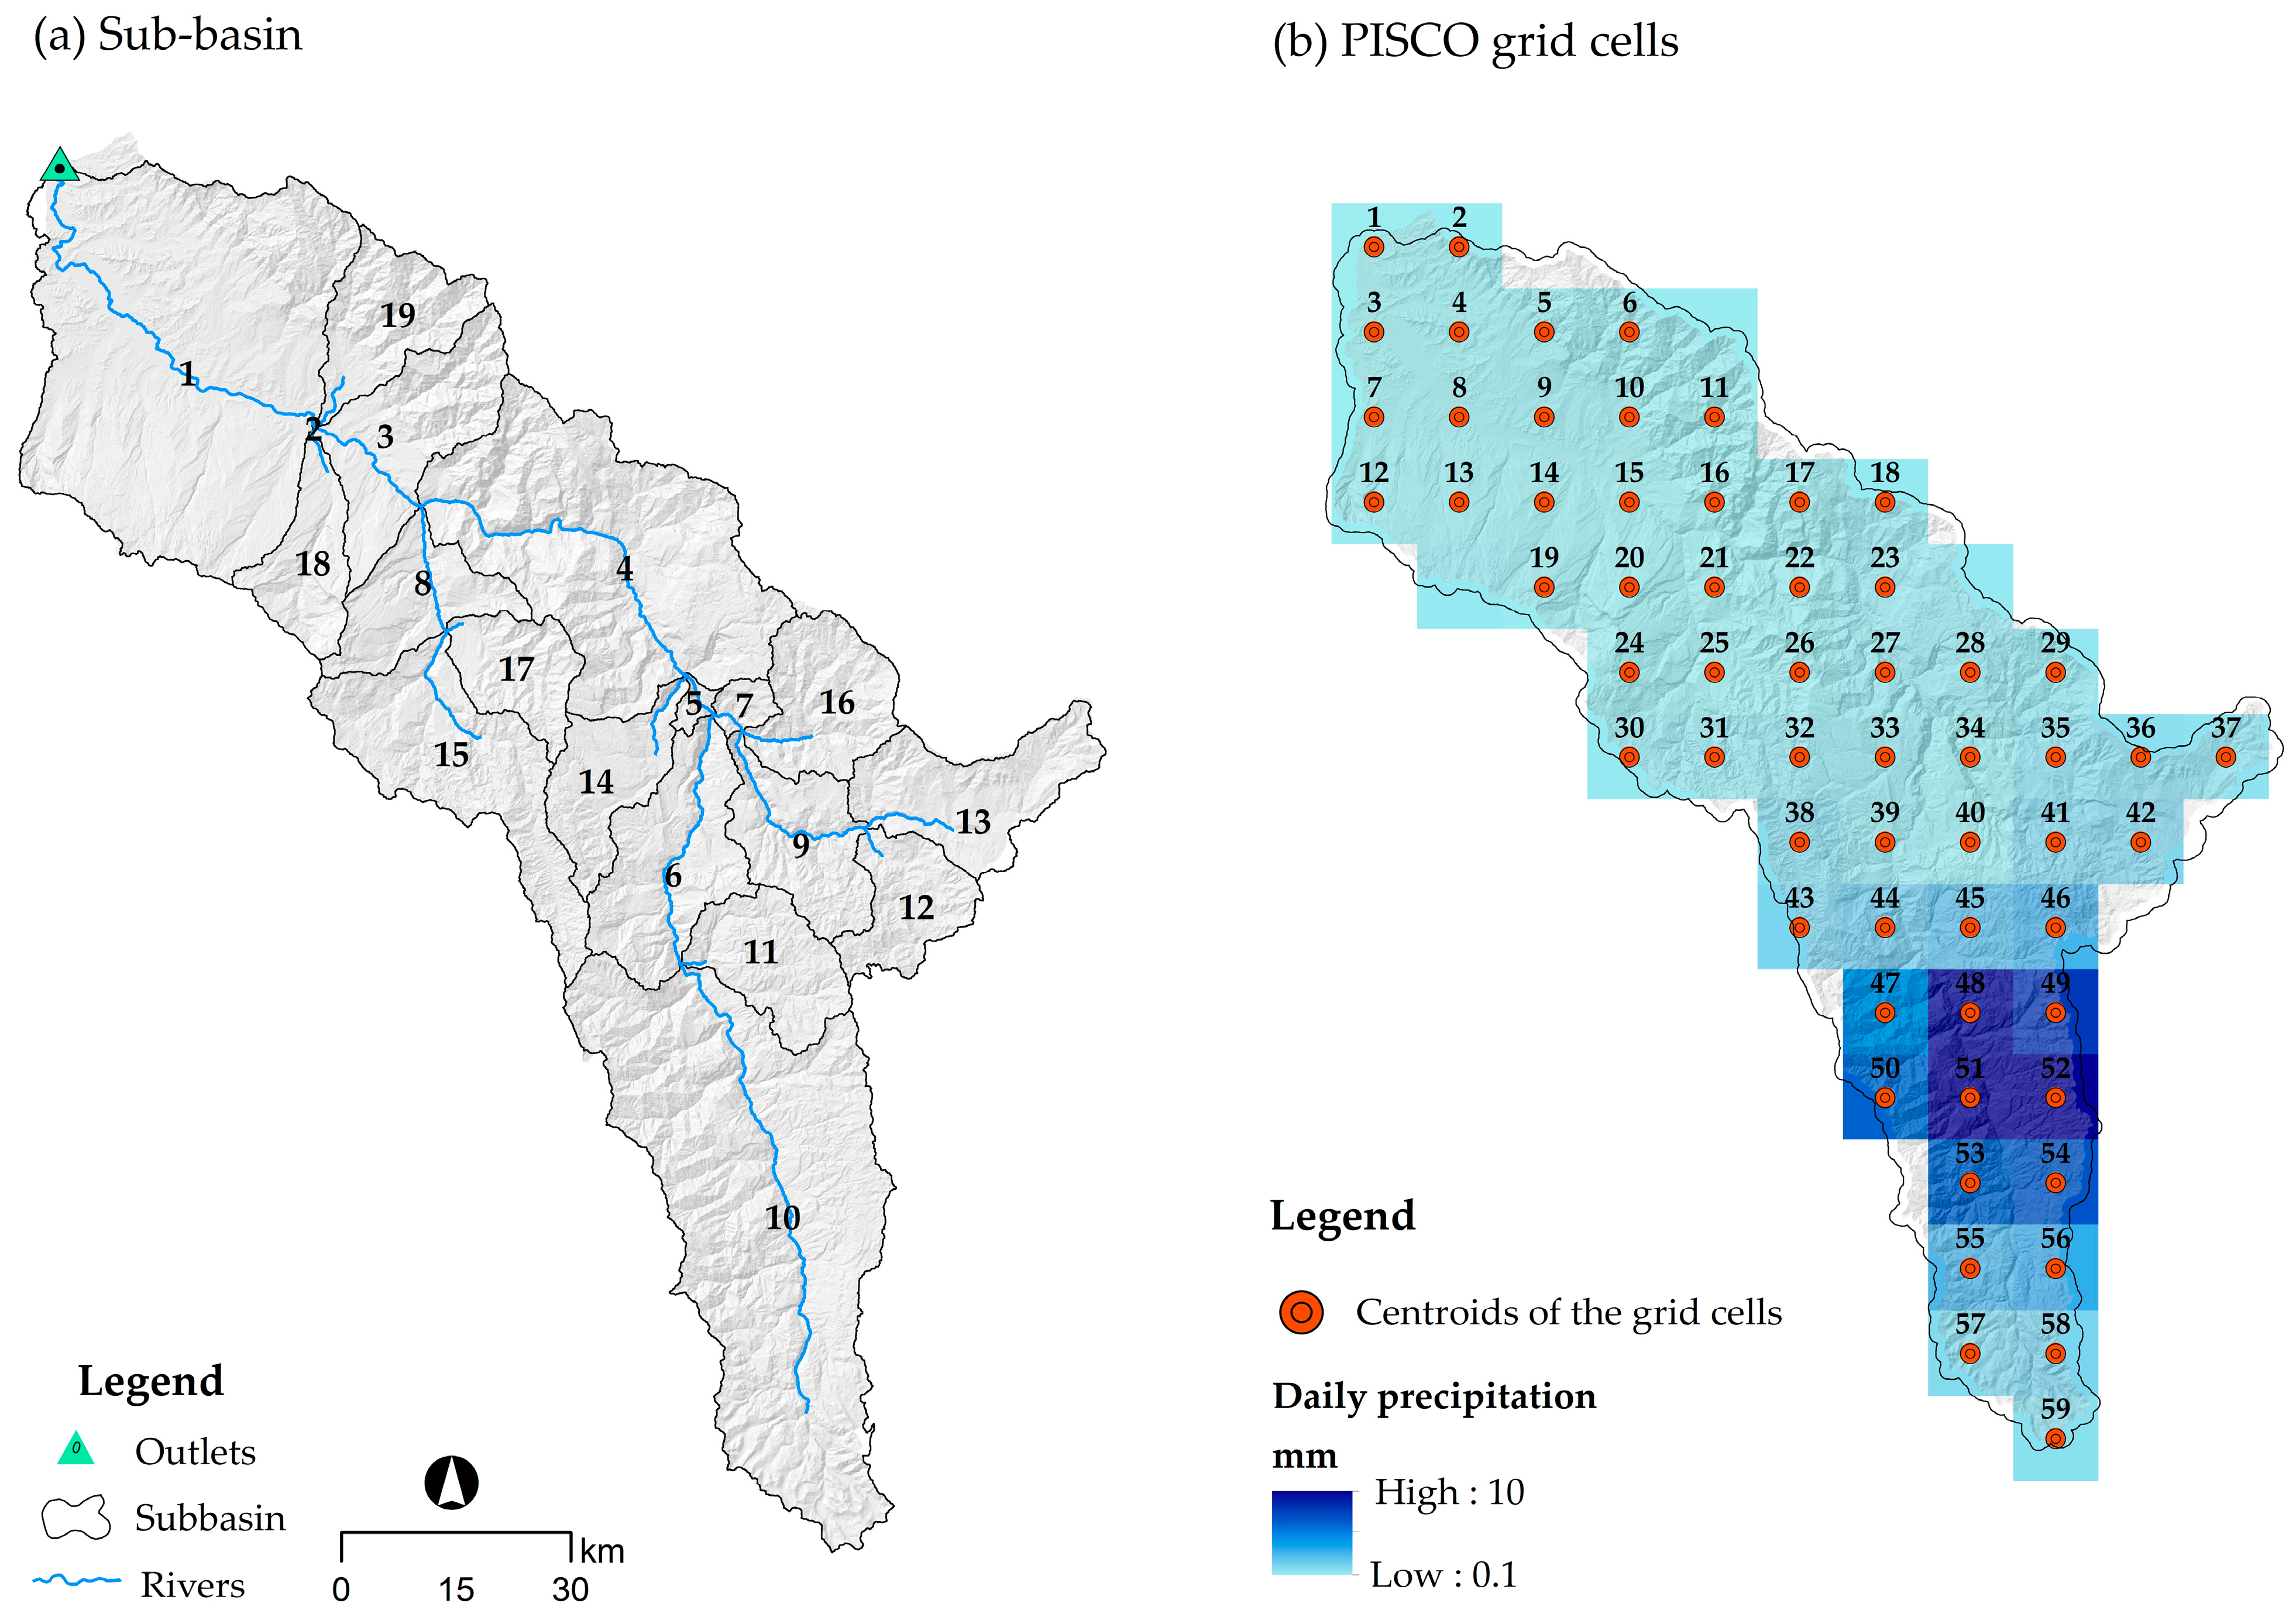
The SWAT 2012 model was used to run simulations through its QSWAT version 2.0.1 [71], an extension in QGIS version 3.34. First, the basin delineation was derived from the DEM raster. This process in SWAT depends on a user-defined threshold value for the drainage area, as described by [72]. In this study, a threshold of 150 km2 was used based on the extent of the study area, resulting in the identification of 19 sub-basins within the Utcubamba Basin (Figure 3a). Second, a total of 2229 HRUs were defined based on unique combinations of elevation, slope, LULC, and soil data. Finally, hydrological simulations were performed for each HRU to estimate key components of the water balance. Meteorological inputs such as T° min, T° max, and precipitation (1981–2016) were used from the PISCO gridded dataset [73], with 59 grid cells covering the Utcubamba Basin assigned to sub-basins based on their centroid location (Figure 3b).
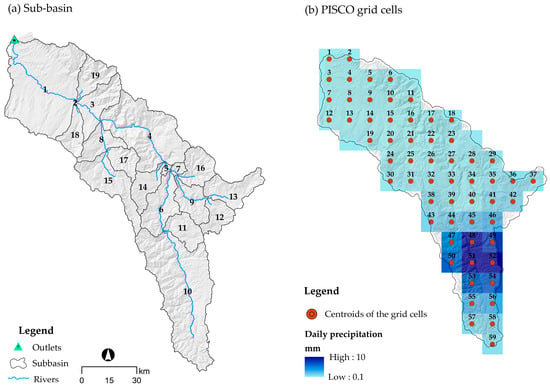
Figure 3.
Sub-basin delineation (a) and PISCO grid cell distribution (b) within Utcubamba Basin.
Monthly streamflow records from 2002 to 2010, obtained from the Naranjos hydrological station, were used for calibration, and data from 2011 to 2016 supported the validation process. The calibration was carried out in SWAT-CUP version 5.1.6, focusing on sensitivity analysis to identify the most influential parameters in the basin. Using the SUFI-2 algorithm, as applied in previous studies [15,26,74], fourteen parameter options were selected, where the sensitivity of each parameter was assessed based on p-values and t-statistics, measures commonly used to evaluate performance in hydrological models employing SWAT-CUP [74,75].
2.6. Model Performance
During the calibration and validation process, the time series performance was assessed, and the potential impacts of future climate change on water balance dynamics were evaluated. The performance ratings described in Table 2 include the coefficient of determination (R2), percentage bias (PBIAS), and Kling–Gupta Efficiency (KGE), a composite metric that accounts for the correlation between observed and simulated data, relative bias, and the ratio of their standard deviations, as defined in Equation (2).
where r is the correlation between real and simulated data; β is relative bias, expressed as the ratio of the means of observed and simulated data; γ is the ratio of the standard deviations between observed and simulated data.

Table 2.
Statistics for the evaluation of monthly scale flow performance.
2.7. Climate Change Scenary
Climate data under future scenarios (projected from 2025 to 2100), including daily values of maximum and minimum temperature and precipitation, were provided by [65] and downscaled to the local scale according to the study area level. The downscaling process was carried out using the Quantile Mapping method (QM), also referred to as the Quantile Perturbation Method (QPM) by [76,77], using the Statdownscaling tool [77] in R. This method is designed to analyze long-term variability in extreme values, detect changes in hydrological extremes, and adjust projected data by comparing them with historical observations, being used in previous studies [78,79].
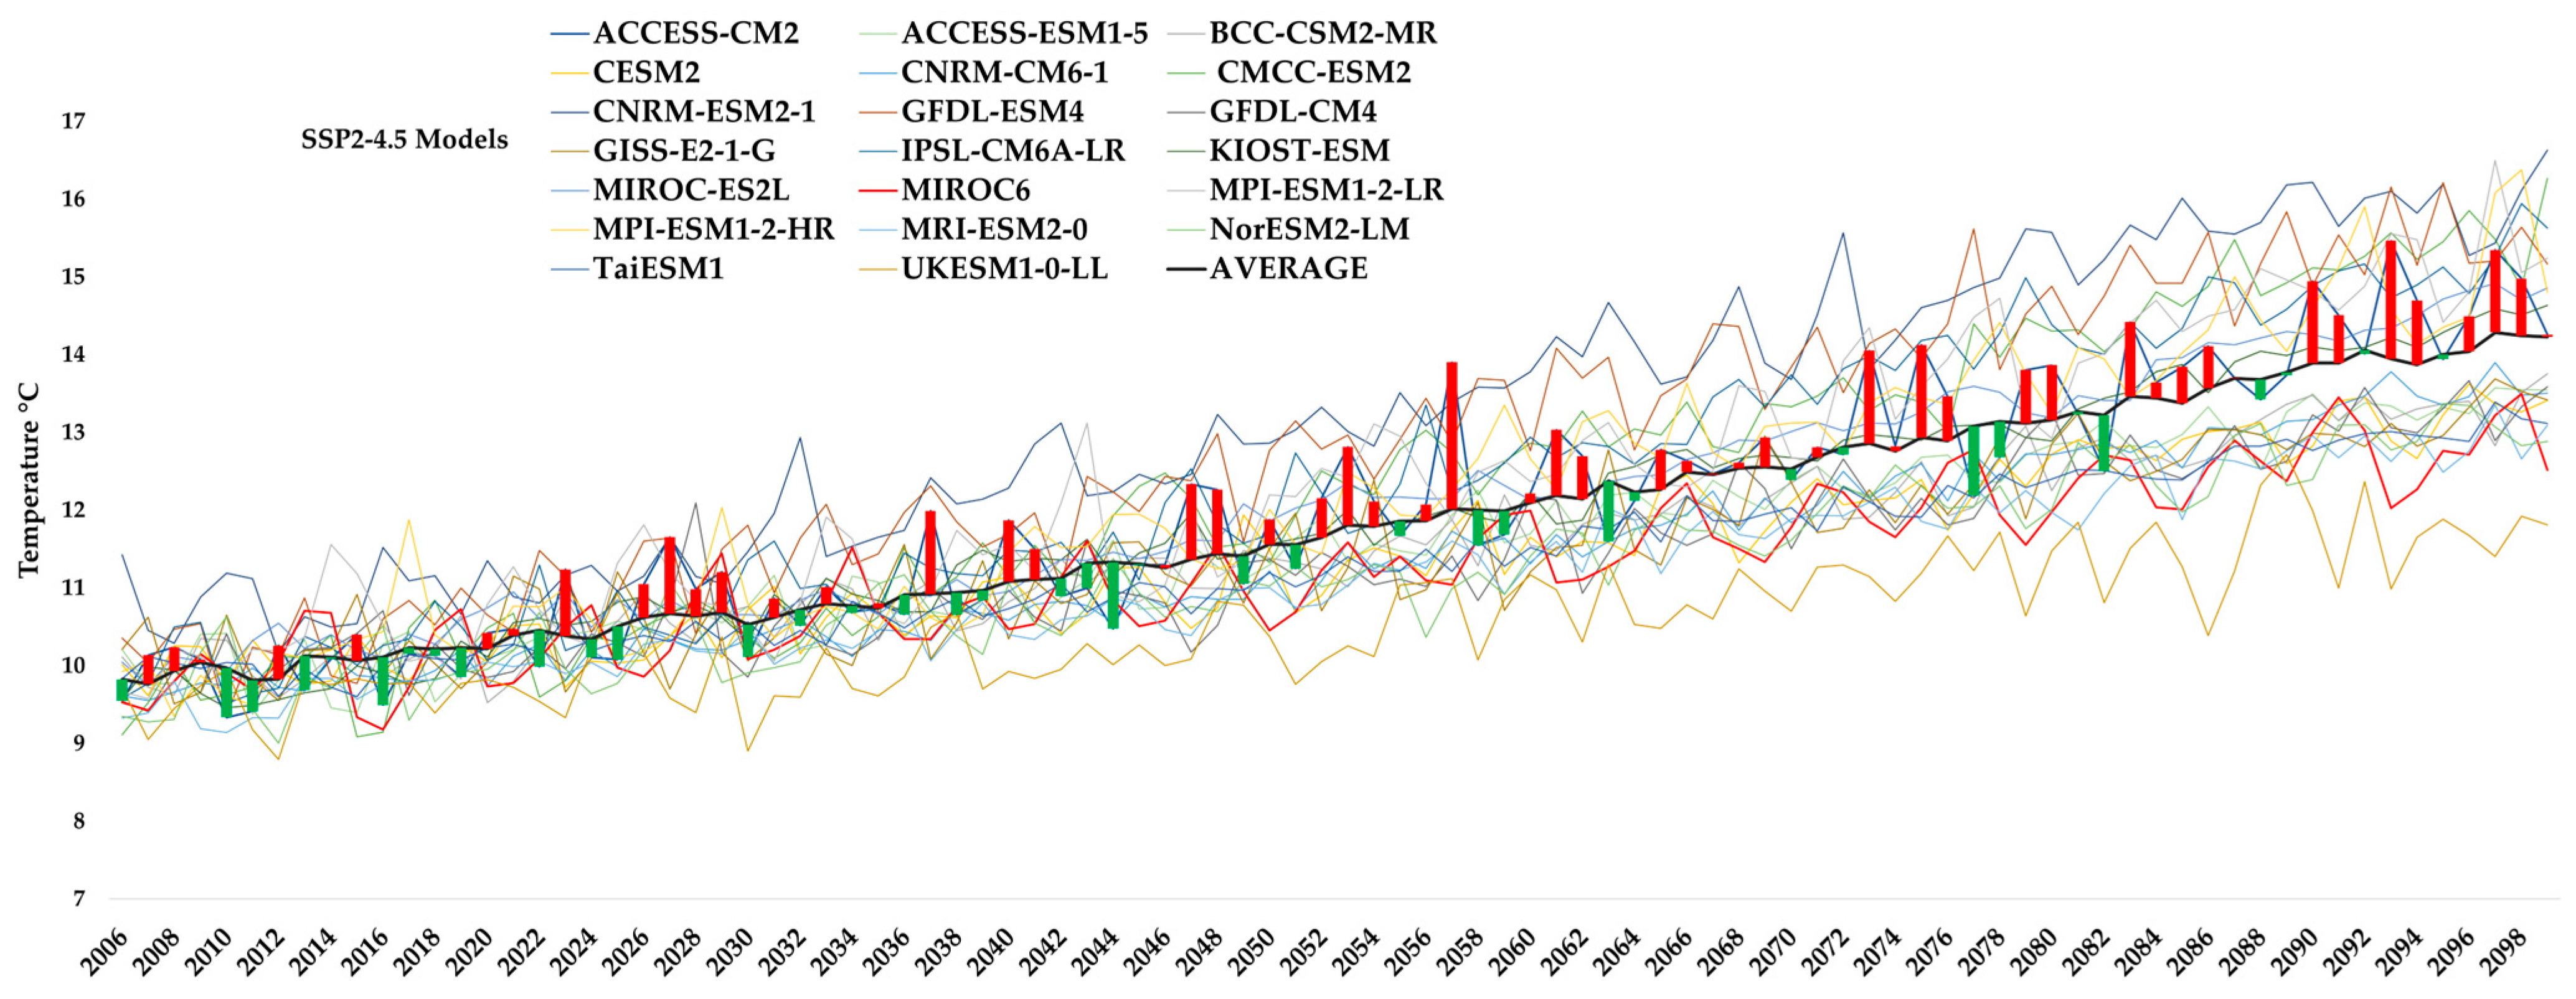
After the downscaling process, the ensemble average of the 20 most widely used global climate models (GCMs) in South America was considered and calculated for both SSP2–4.5 and SSP5–8.5 scenarios. This step aimed to minimize potential biases in minimum and maximum temperature values [80]. These scenarios represent two socioeconomic pathways: SSP2–4.5 assumes moderate emissions aligned with current or slightly reduced CO₂ consumption, while SSP5–8.5 reflects a high-emission pathway with approximately doubled CO₂ emissions over time. Figure 4 shows the time series of the 20 most commonly used global climate models (GCMs) for South America, along with their ensemble average under the SSP2–4.5 scenario as an example. However, the ensemble average was also calculated for the SSP5–8.5 scenario. Both ensemble datasets were incorporated into the SWAT model to simulate the hydrological response of the Utcubamba Basin under future climate conditions.
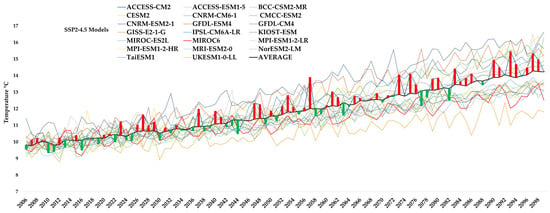
Figure 4.
Time series of annual average temperature projections from 20 most commonly used global climate models (GCMs) for South America under SSP2–4.5 scenario. Each colored line represents individual GCM, while black line indicates ensemble average. Red and green vertical bars indicate the intermodel variability for each year, with red bars showing the upper deviation and green bars the lower deviation from the ensemble mean, highlighting the uncertainty range across GCMs.
2.8. Water Balance Modeling Under Future Climate Scenarios
To evaluate the projected changes in the water balance under future climate scenarios, the outputs of the calibrated SWAT model were used to extract key hydrological variables, including precipitation (PREC), potential evapotranspiration (PET), actual evapotranspiration (ET), surface runoff (SURQ), percolation (PERC), groundwater flow (GWQ), and lateral flow (LATQ). Simulations were run for the period of 2025–2099 under the SSP2–4.5 and SSP5–8.5 scenarios, using downscaled climate inputs from the NEX-GDDP-CMIP6 dataset. The average annual values for each variable were computed and compared to the historical baseline (1987–2016) to assess percentage changes.
2.9. Water Balance and Land Cover Change
Finally, to explore the spatial interactions between land cover change concentration and hydrological processes, bivariate maps were generated by overlapping deforestation concentration with three key hydrological outputs from the SWAT model—surface runoff (SURQ), potential evapotranspiration (PET), and precipitation (PREC)—under current conditions and the SSP2–4.5 and SSP5–8.5 scenarios. Both deforestation concentration and each hydrological variable were independently reclassified into three categories using natural breaks (Jenks optimization method), which allowed thresholds to be defined according to the natural distribution of values. This enhanced the spatial interpretation of areas experiencing simultaneous ecological and hydrological stress. The resulting convergence of climatic and anthropogenic pressures highlights sub-basins with heightened hydrological vulnerability, informing the development of more targeted strategies for climate adaptation, land use regulation, and watershed conservation.
3. Results
3.1. Land Use and Land Cover
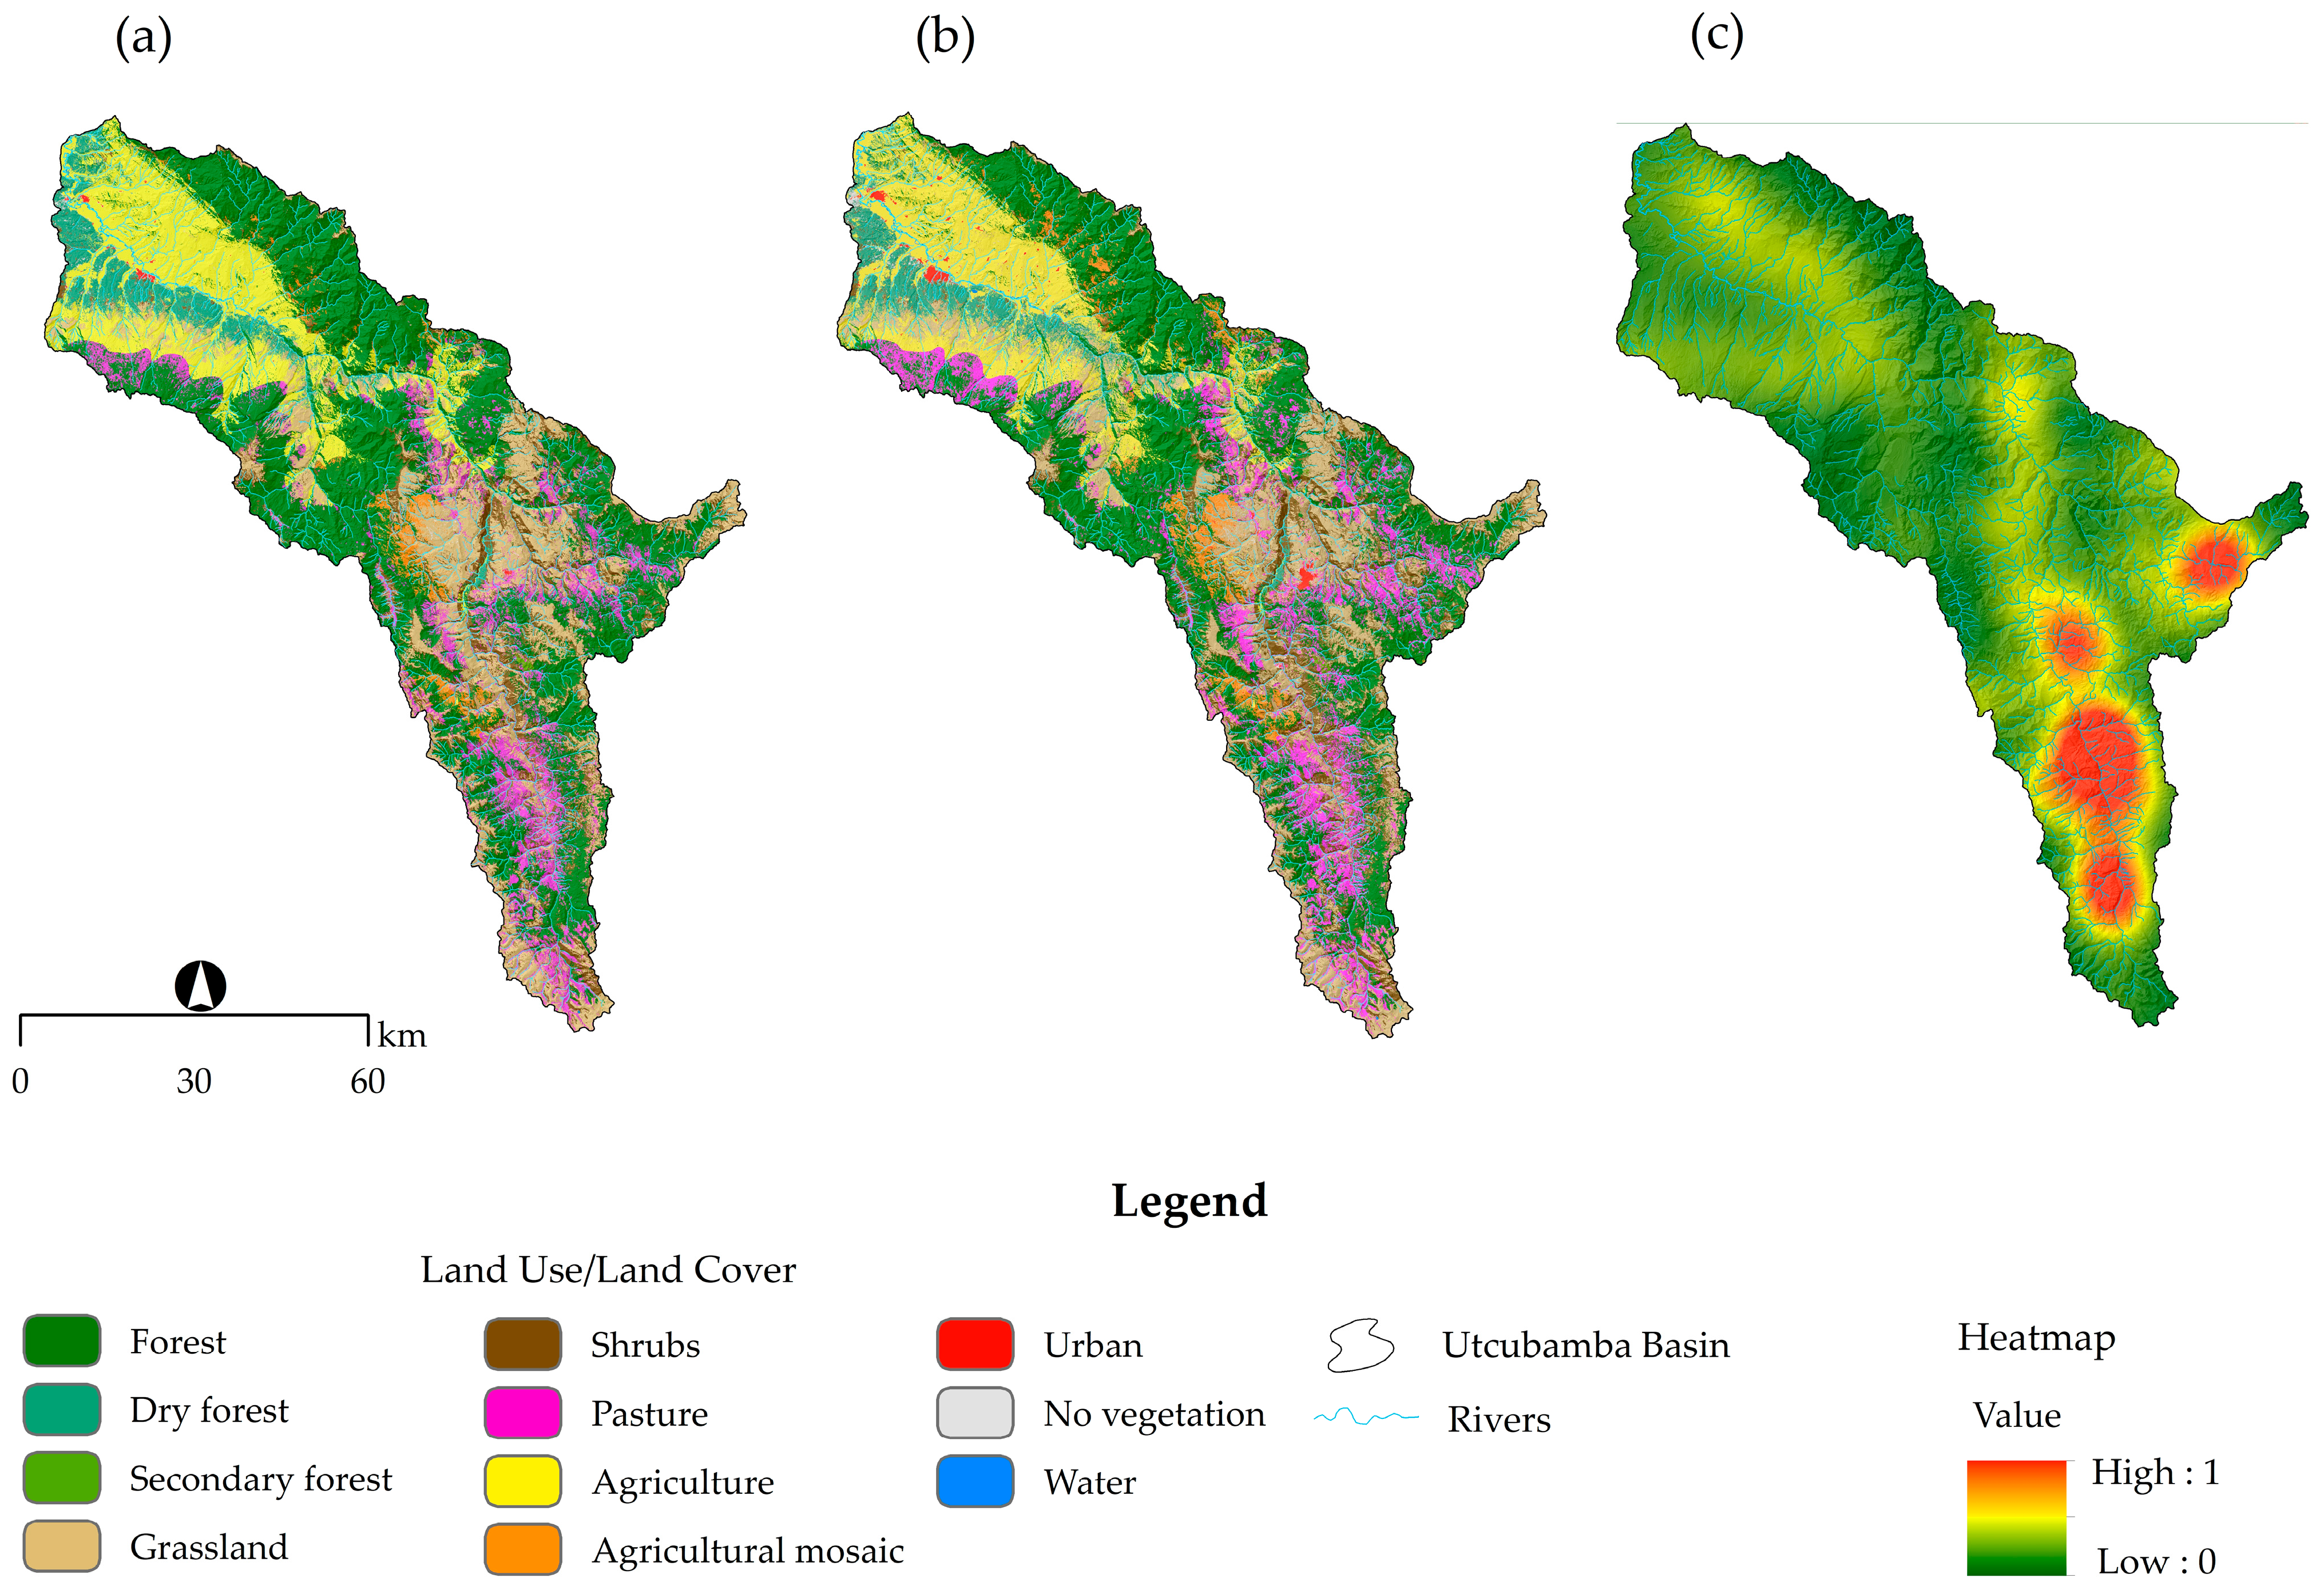
The classification of LULC showed strong performance in both years, with a Kappa index value of 0.86 for the 1990 classification and one of 0.92 for 2024. Forest, grassland, and agriculture were identified as the dominant land cover classes in the Utcubamba Basin for both 1990 and 2024, as shown in Table 3. In 1990, the forest class covered 271,449.90 ha (40.82%) of the Utcubamba Basin, followed by grasslands with 119,919.78 ha (18.03%) and agricultural areas with 108,018.54 ha (16.24%). By 2024, these values had decreased to 255,951.99 ha (38.49%) for forests, 113,788.26 ha (17.11%) for grasslands, and 99,500.04 ha (14.96%) for agriculture. Overall, forest cover decreased by 15,497.91 ha, representing a 2.33% loss within the basin, followed by a reduction of 8518.50 ha in agricultural land. In contrast, urban areas expanded by 2491.56 ha, reflecting increasing human pressure on land resources. These anthropogenic pressures are particularly evident in the upper part of the basin, where most of the land cover changes are concentrated, as shown in Figure 5c.

Table 3.
Area (in hectares) and percentage relative to the total basin area (in parentheses) for each land cover class in the Utcubamba Basin for the years 1990 and 2024, including absolute and relative differences.
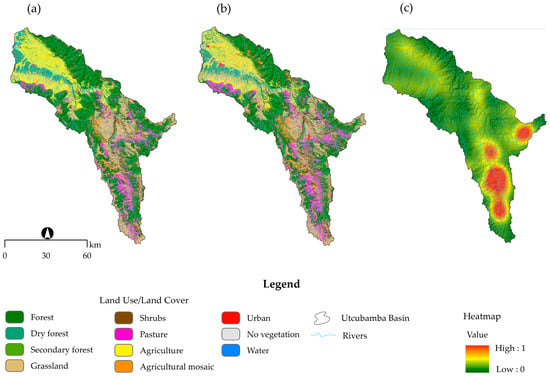
Figure 5.
Land use and land over (LULC) map for 1990 (a), LULC map for 2024 (b), and heatmap of change concentration in the Utcubamba Basin (c).
3.2. SWAT Model Sensitivity, Calibration y Validation
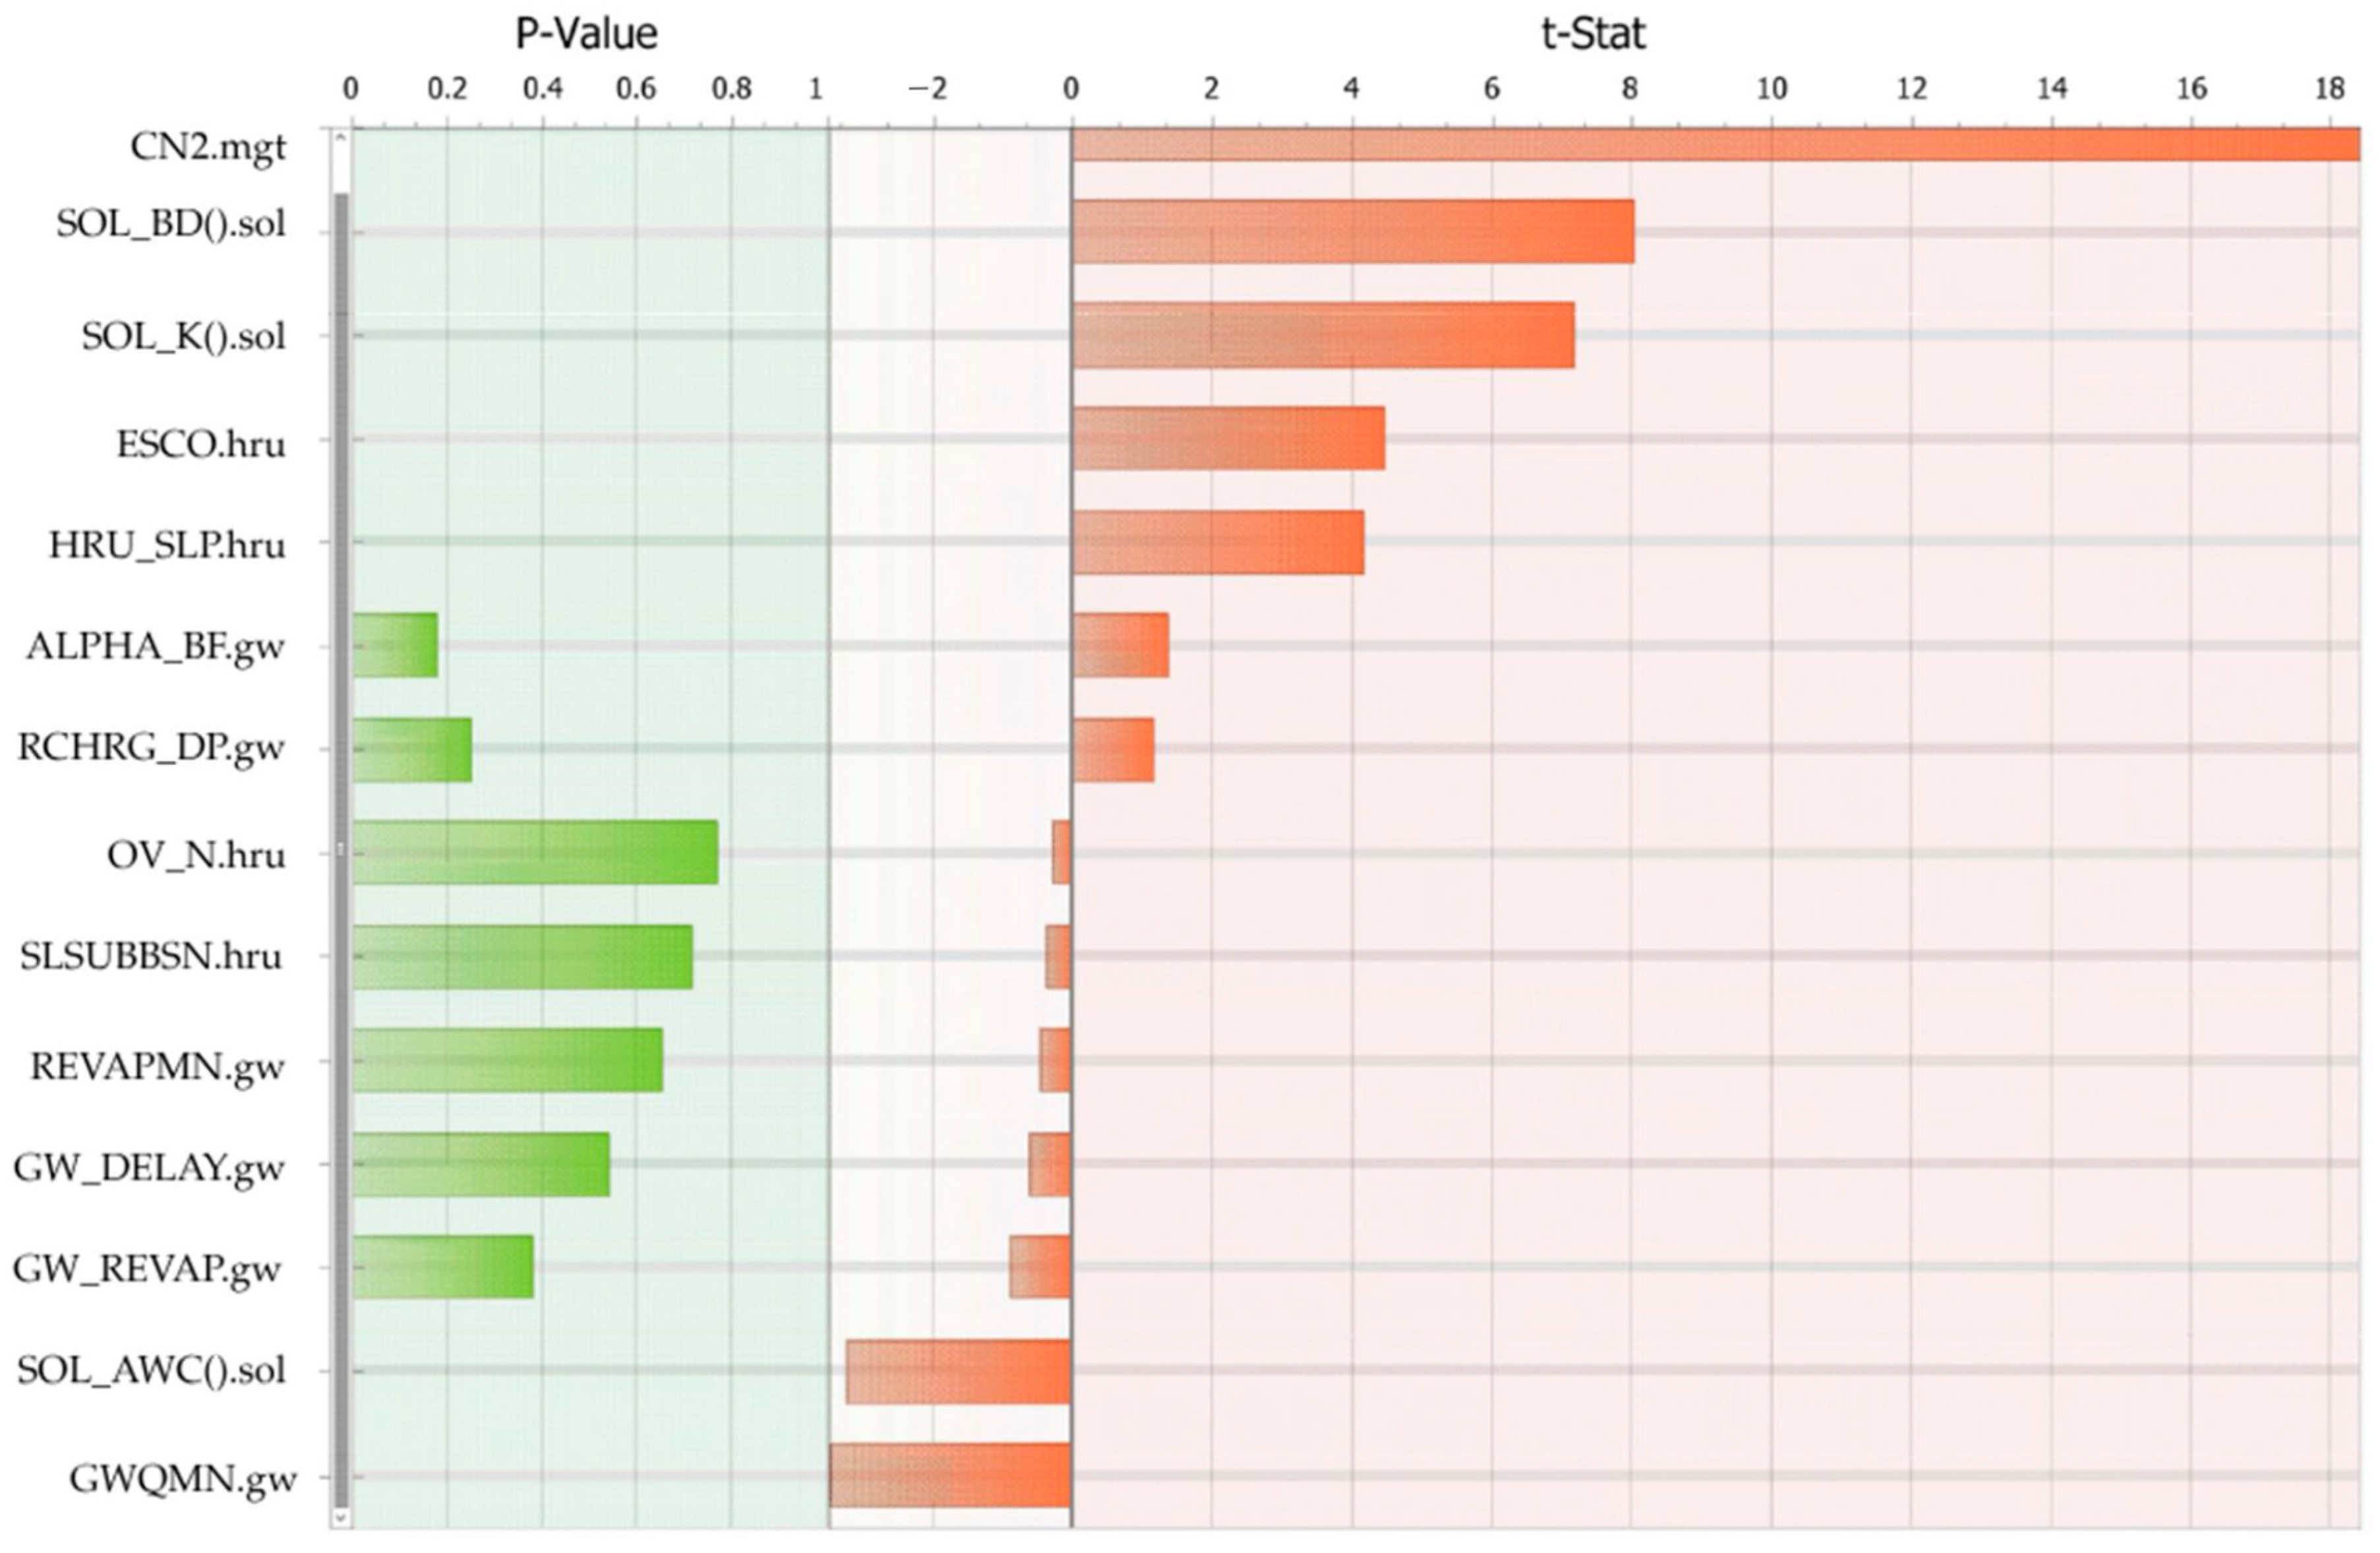
The sensitivity analysis identified the parameters with the greatest influence on streamflow simulation, as depicted in Figure 6. Among the 14 parameters evaluated, the Curve Number (CN2.mgt) was the most influential, showing the highest t-Stat value (18.4) and a highly significant p-value (p < 0.001). This indicated the existence of a strong effect on surface runoff estimation. The bulk density of the soil (SOL_BD.sol) and the saturated hydraulic conductivity (SOL_K.sol) also demonstrated high sensitivity, with t-Stat values of 8.02 and 7.16, and corresponding p-values of p < 0.001, respectively. These variables play a critical role in regulating infiltration and subsurface flow processes. In contrast, parameters such as soil roughness for surface runoff (OV_N.hru) and sub-basin slope (SLSUBBSN.hru) showed lower sensitivity, as reflected by p-values above 0.6 and t-Stat values close to zero. This indicates the limited contribution of these parameters to the model’s output for the Utcubamba Basin analysis.
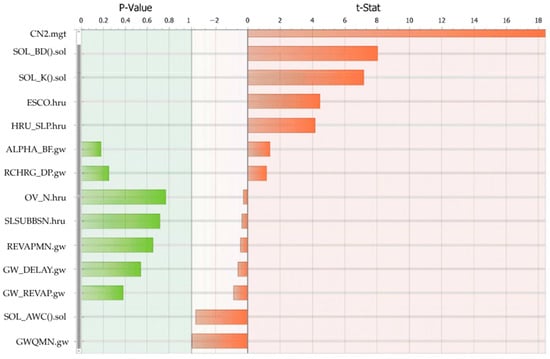
Figure 6.
Sensitivity analysis results for 14 parameters evaluated using p-values (left) and t-Stat (right).
Following the sensitivity analysis, the selected parameters were calibrated within defined ranges and validated against observed streamflow data. Table 4 presents the calibrated and validated values for each of the 14 parameters. For instance, CN2.mgt was calibrated within a range from 0 to 4 and validated at 0.21, while SOL_BD.sol and SOL_K.sol were validated at 0.35 and −0.36, respectively. These values confirm the key role of these parameters in accurately simulating the hydrological behavior of the Utcubamba Basin.

Table 4.
Calibrated and validated values of the most relevant parameters used in the SWAT model.
3.3. Hydrological Model Performance
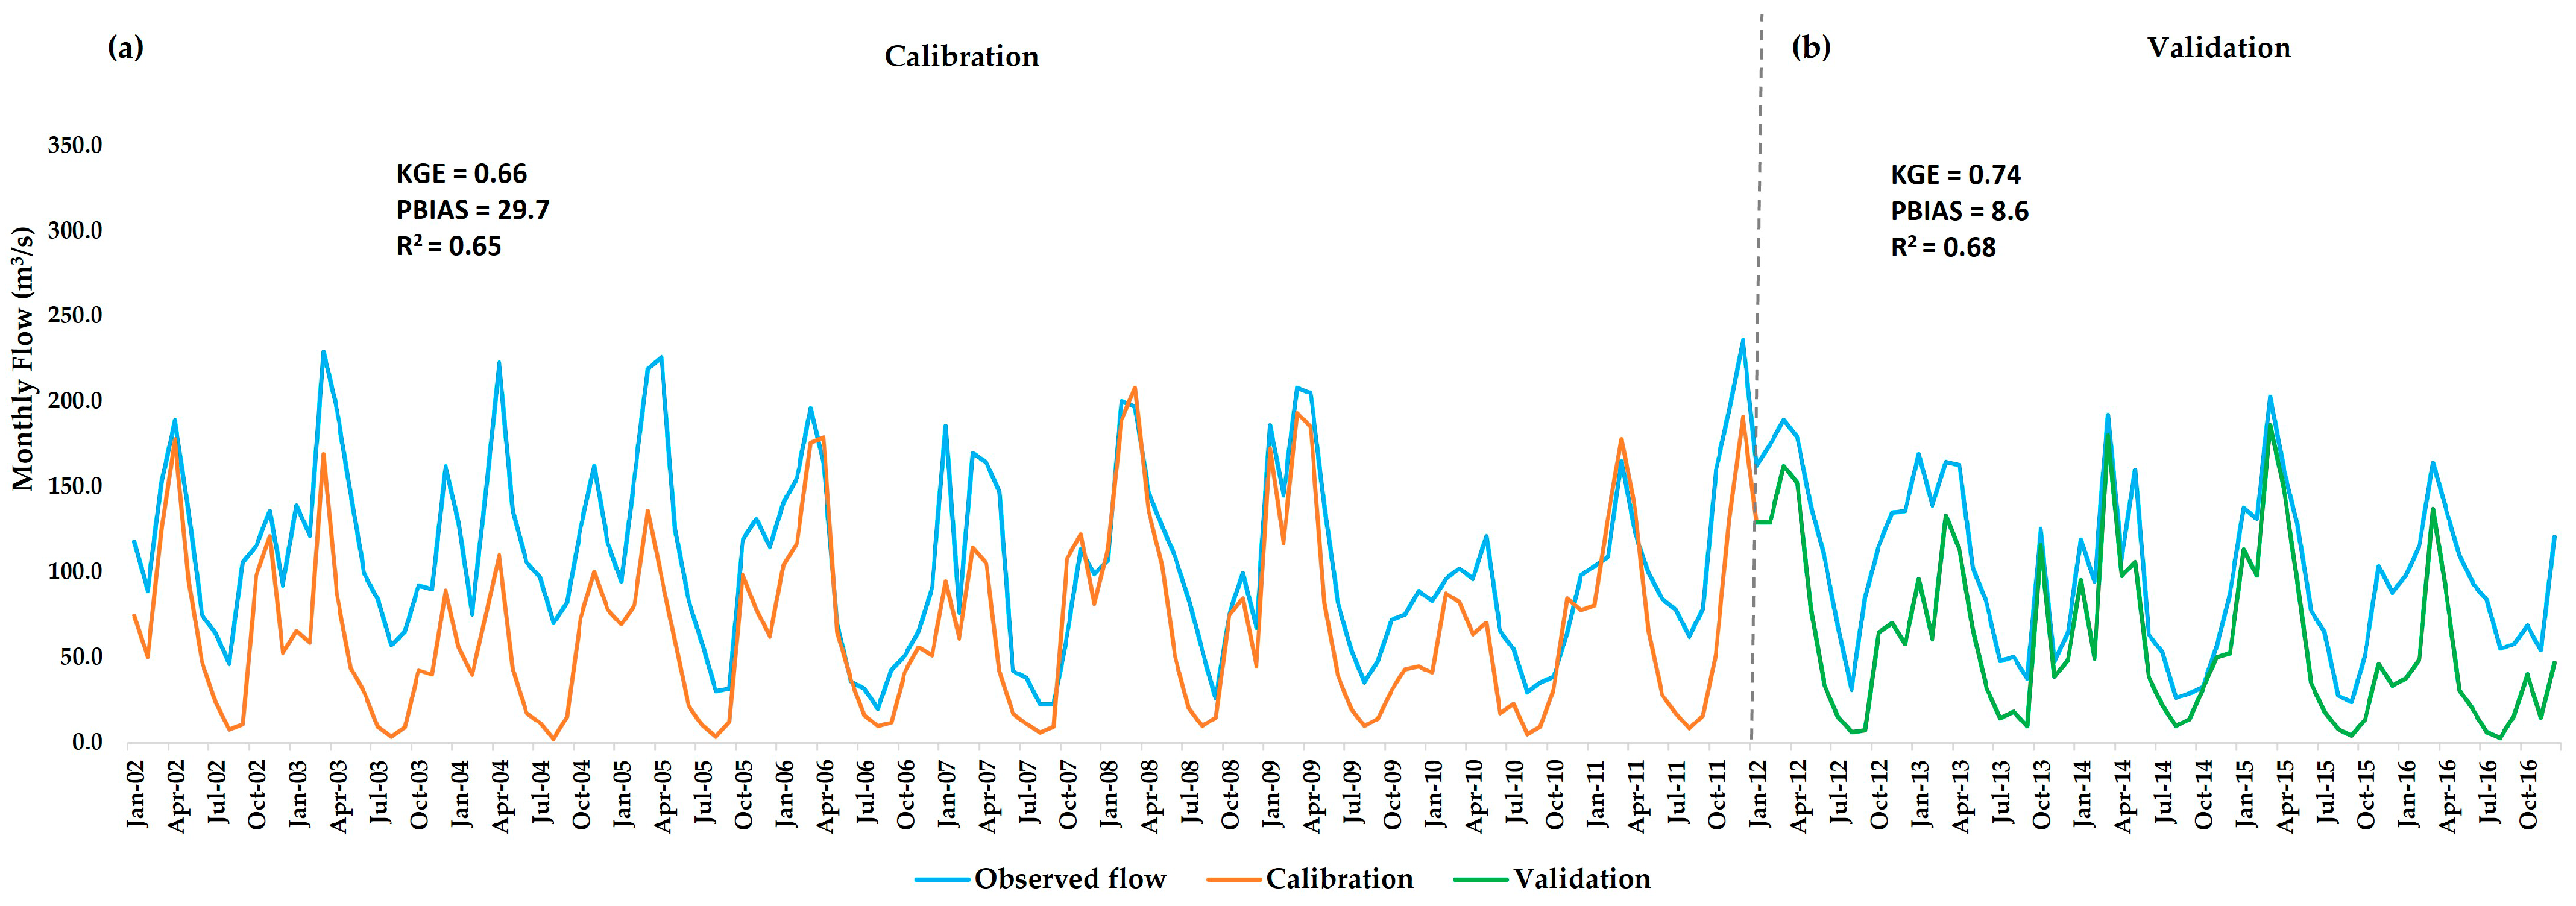
Model performance during both the calibration and validation periods is depicted in Figure 7. For the calibration stage (2002–2011), KGE = 0. 0.66, R2 = 0.65, and PBIAS = 29.7%, indicating acceptable agreement between simulated and observed streamflow. In the validation period (2012–2017), the model performance improved, with a KGE of 0.74, an R2 of 0.68, and a reduction in PBIAS to 8.6%. These results demonstrate that the model accurately represents the hydrological dynamics at the Naranjos hydrological station in the Utcubamba River Basin.
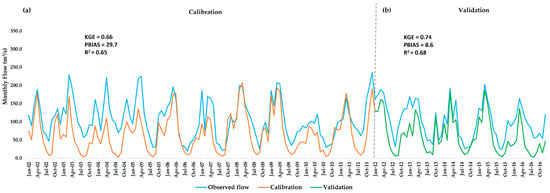
Figure 7.
Monthly comparison between observed and simulated monthly streamflow during calibration period (2002–2011) (a) and validation period (2012–2017) (b) at Naranjos station.
3.4. Historical Flow Dynamics in the Utcubamba Basin
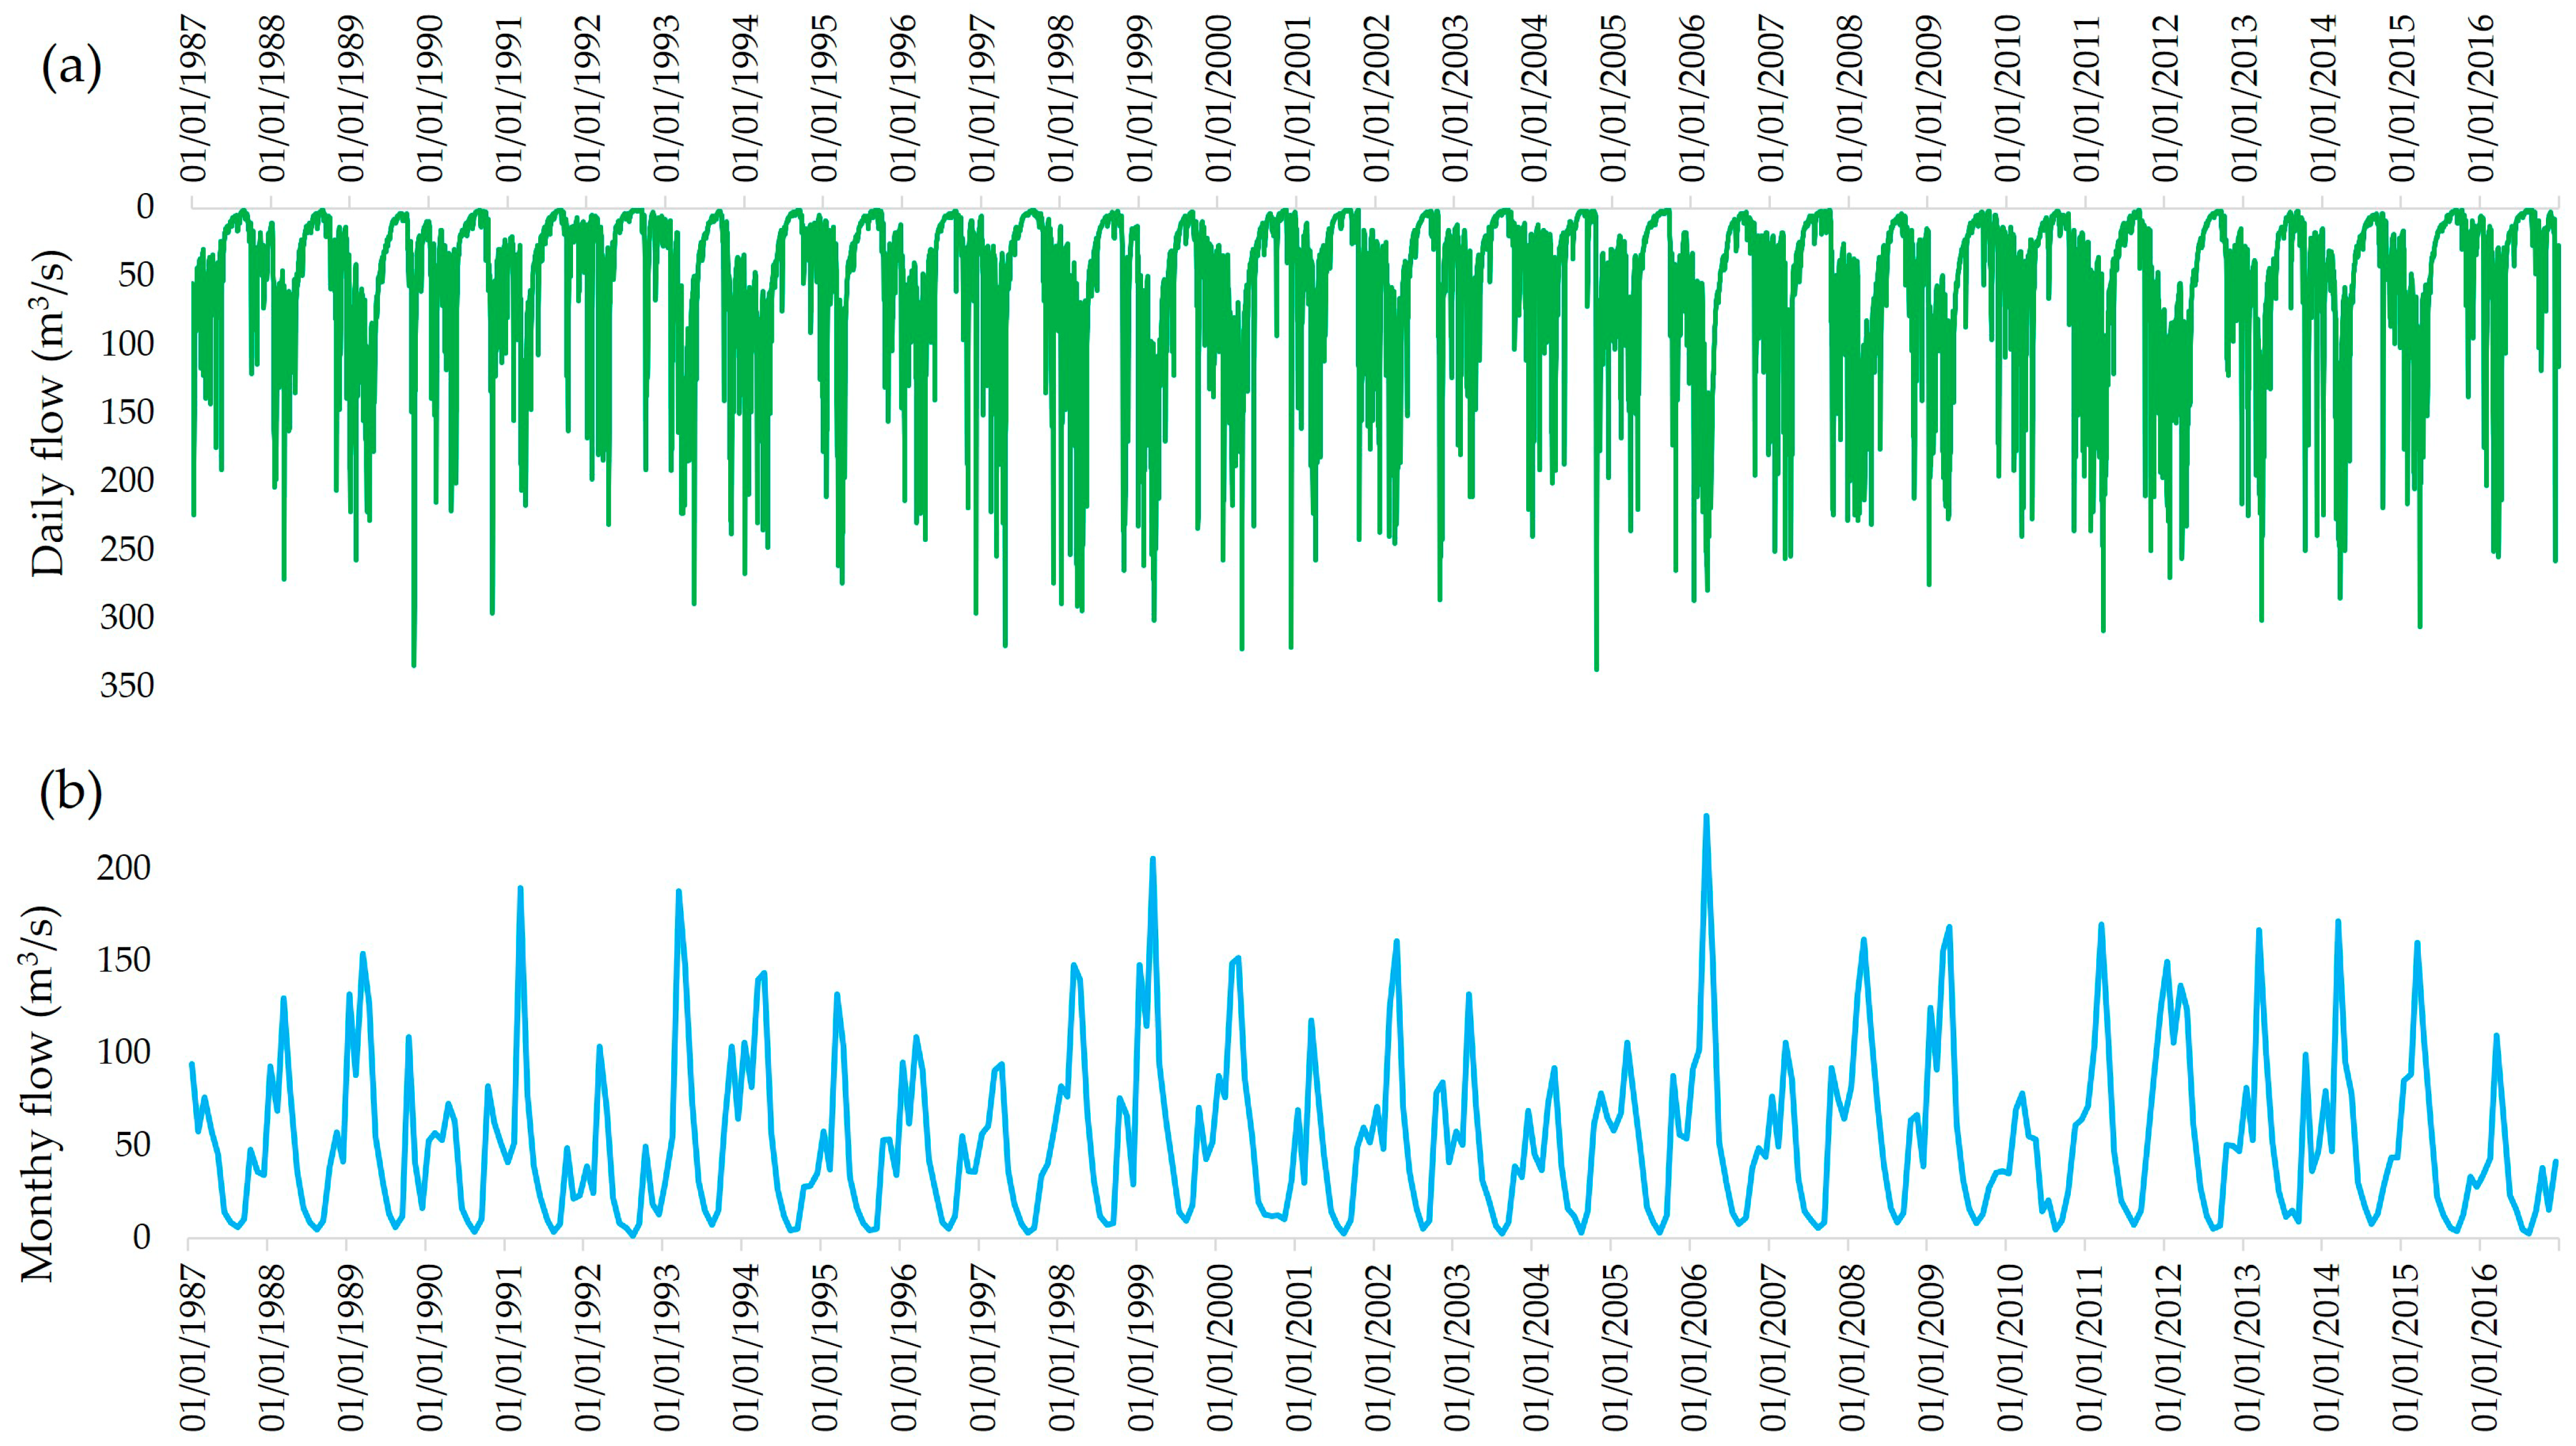
The Utcubamba River Basin exhibits a clear seasonal hydrological regime, with peak flows typically occurring between December and March, and low flows recorded between June and August. On a daily scale (Figure 8a), simulated streamflow values using the PISCO dataset for the 1987–2016 period reflect strong short-term variability, ranging from below 5 m3/s during dry periods to over 350 m3/s during peak events. At the monthly scale (Figure 8b), this pronounced seasonality is also captured, where average flows fluctuate between approximately 10 m3/s and 300 m3/s. The calibration and validation of the SWAT model yielded good performance (KGE = 0.74), indicating the model’s ability to reliably reproduce the basin’s hydrological dynamics.
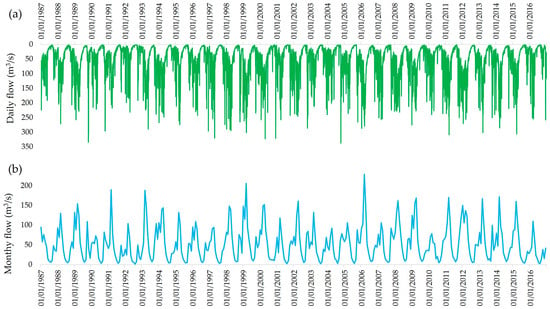
Figure 8.
Historical streamflow in Utcubamba Basin from 1987 to 2016 using PISCO climate data: (a) daily flow variability; (b) monthly average flow patterns.
3.5. Projected Hydrological Response Under Climate Scenary’s SSP2–4.5 and SSP5–8.5
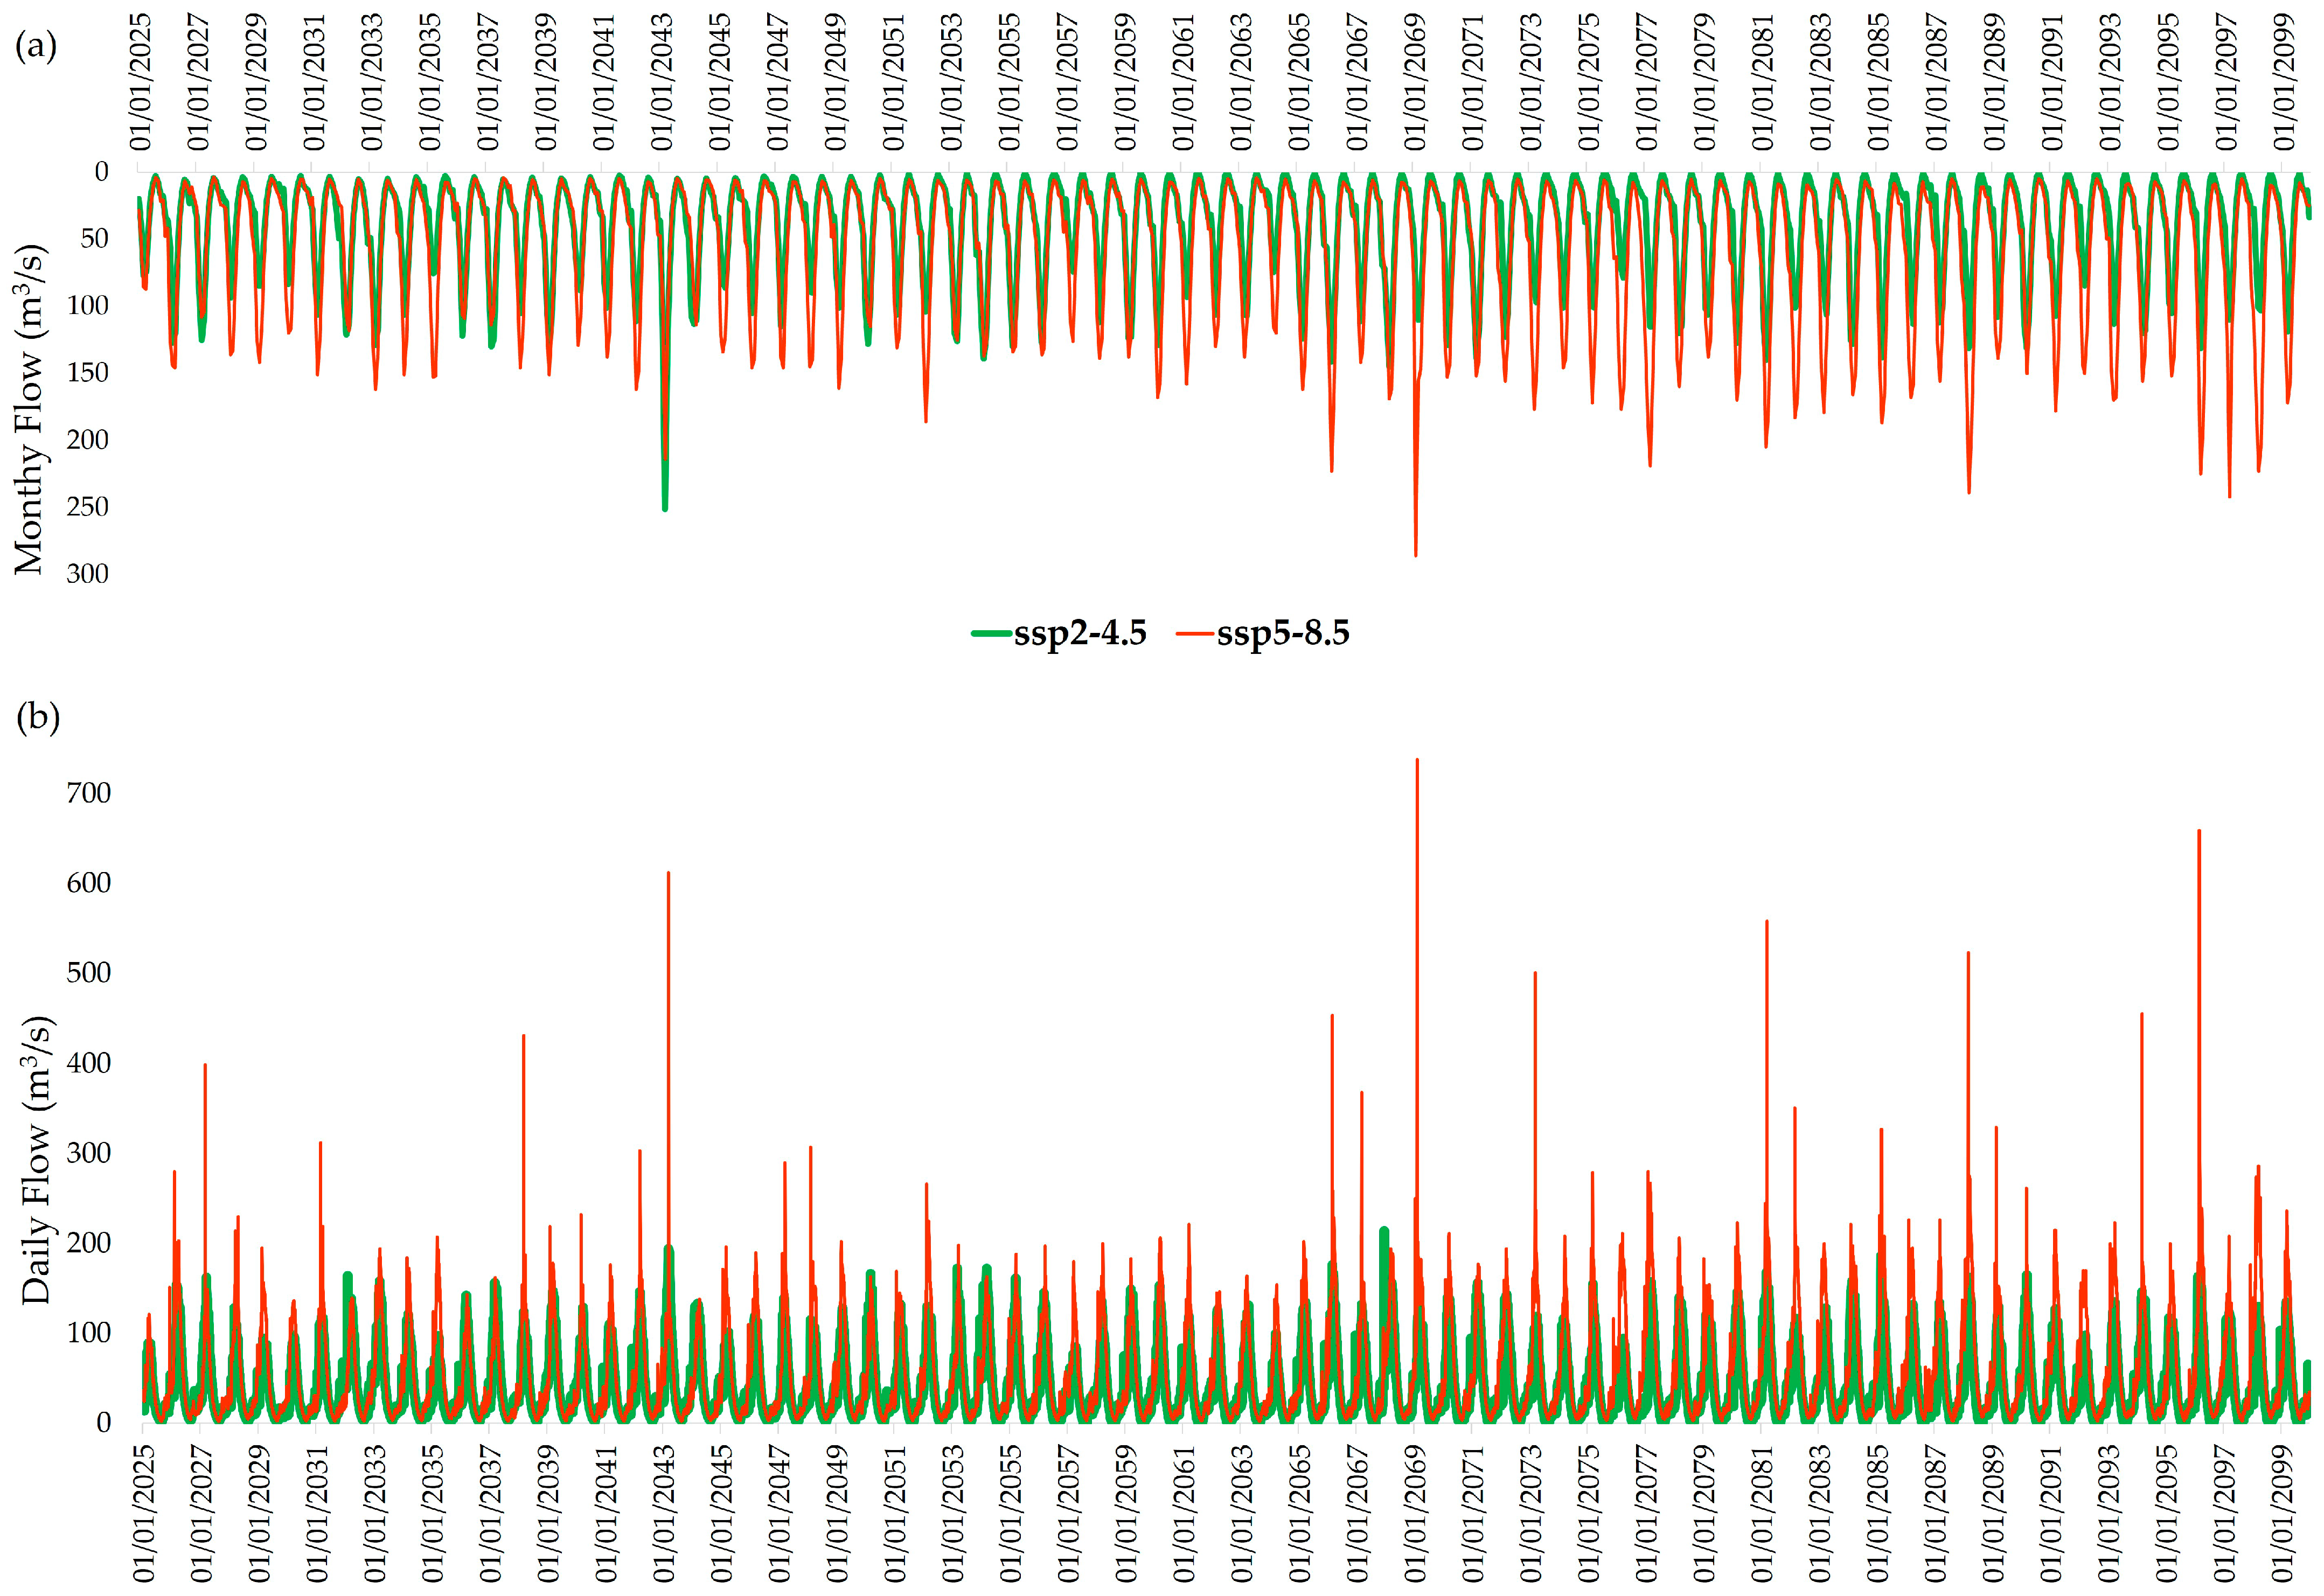
The projected hydrological response of the Utcubamba Basin under future climate conditions reveals notable changes in flow dynamics for both SSP2–4.5 and SSP5–8.5 scenarios at monthly (Figure 9b) and daily (Figure 9b) flow projections.
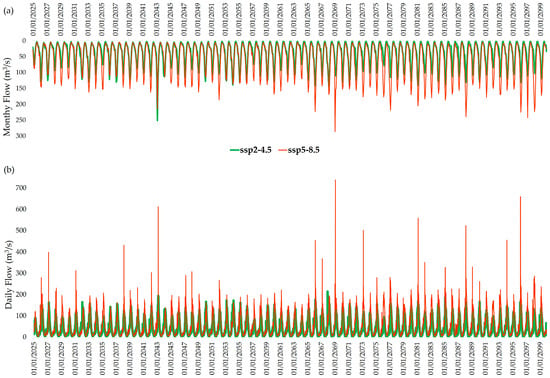
Figure 9.
Projected streamflow in Utcubamba Basin under climate scenarios SSP2–4.5 and SSP5–8.5: (a) monthly flows; (b) daily flows for period of 2025–2100.
Under SSP5–8.5, a high-emission scenario, simulations indicate an average monthly flow reduction of approximately 4%, decreasing from 60.2 to 57.8 m3/s (Figure 9a). This reduction is particularly evident during the dry season (August–September), with a maximum decline of 60%, from 4.6 to 1.38 m3/s, suggesting the significant intensification of low-flow conditions. Conversely, during the wet season, a 6.5% increase in peak monthly flows is expected, rising from 192.1 to 204.2 m3/s.
In contrast, the SSP2–4.5 scenario shows more moderate variations. Monthly flows decrease by an average of 10%, with minimum flows reduced by up to 13%, which is 10% less severe than under SSP5–8.5. Peak flows also decline, though more moderately, with a 7% reduction relative to historical values. These results suggest that mitigation efforts associated with SSP2–4.5 could moderate the adverse hydrological impacts of climate change.
Daily flow projections (Figure 9b) reveal increased interannual variability in both scenarios, although this is more pronounced under SSP5–8.5. Simulations indicate the occurrence of extreme events, with daily peak flows exceeding 800 m3/s and lows dropping to nearly 1 m3/s, raising concerns about the potential for both flash floods and prolonged droughts. Such extremes could severely impact water availability, agricultural productivity, and aquatic ecosystems.
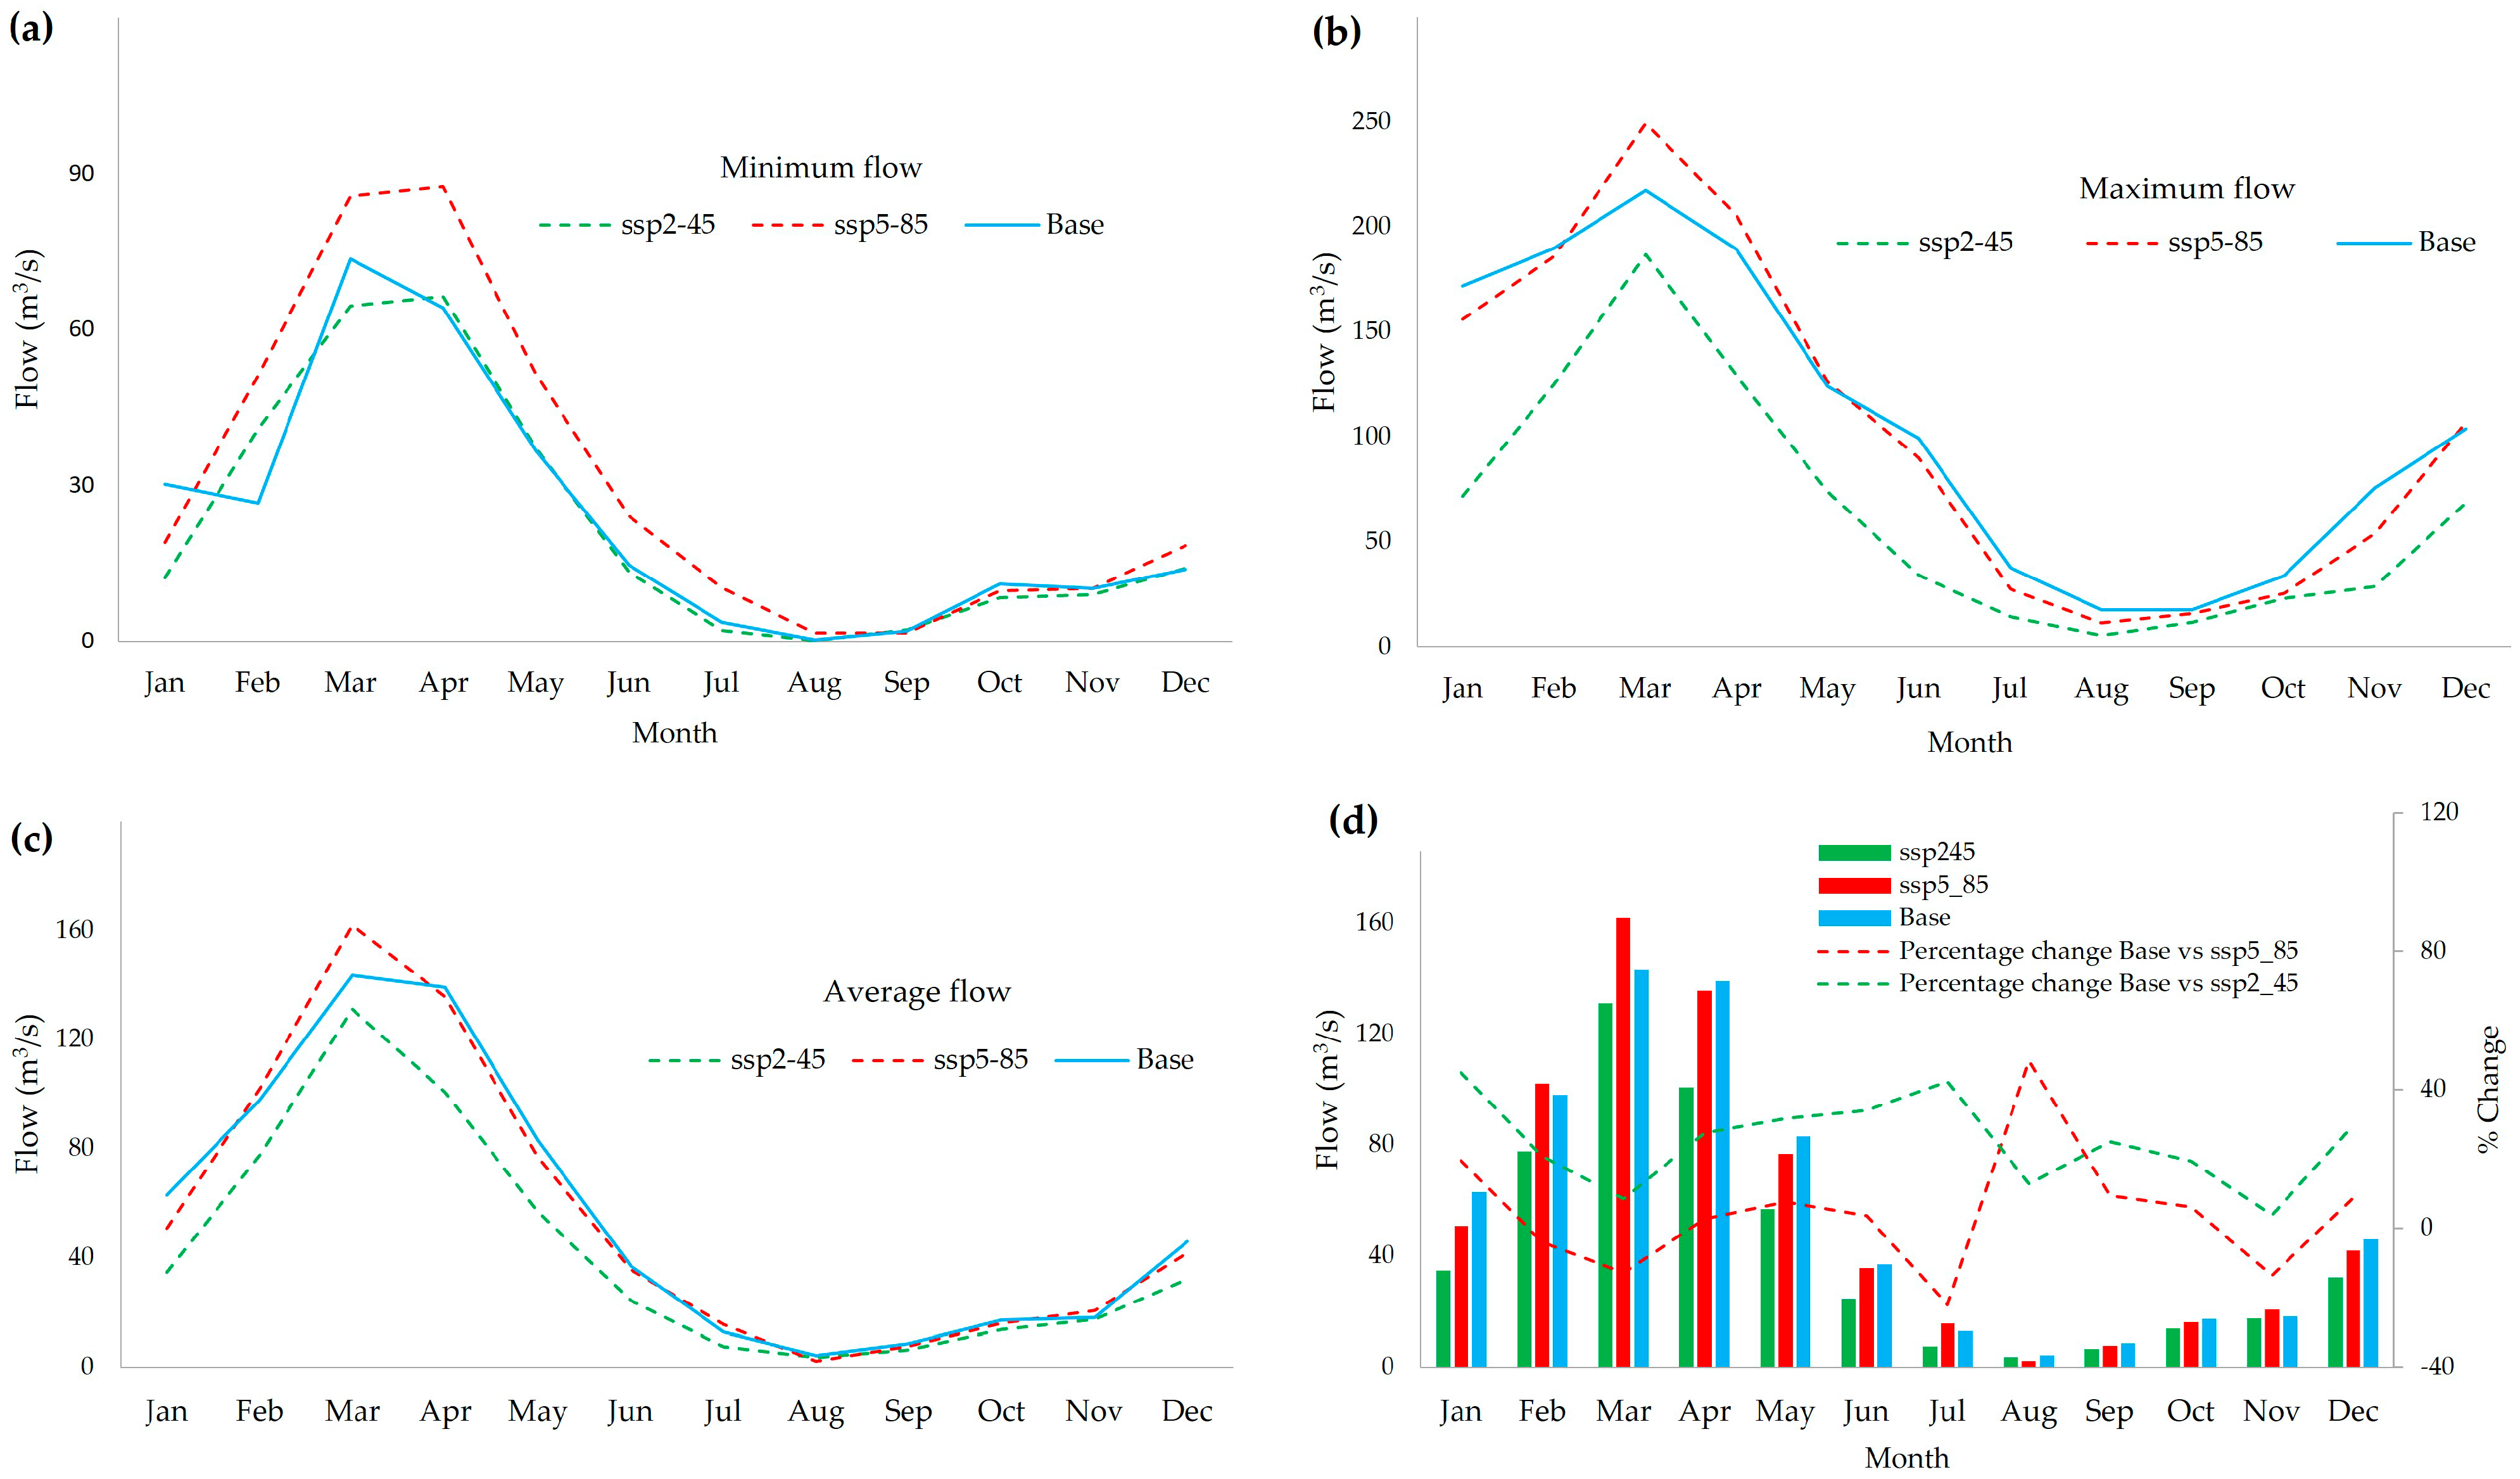
A detailed averaged monthly-scale analysis performed for the period of 2025–2099 under the SSP2–4.5 and SSP5–8.5 scenarios is depicted in Figure 10a–d, which shows the average minimum, maximum, and averaged monthly flows compared to the historical baseline (1987–2016). Minimum flows during the dry season (July–October) are projected to drop sharply (Figure 10a), reaching 1.38 m3/s under SSP5-8.5 and 2.85 m3/s under SSP2–4.5, compared to a baseline value of 5.3 m3/s. On the other hand, maximum flows during January–May the rainy season, as depicted in Figure 10b, show an increase under SSP5–8.5, with March flows rising by 32 m3/s (a 14% increase) relative to historical peaks, while SSP2–4.5 shows a slight reduction in maximum flows.
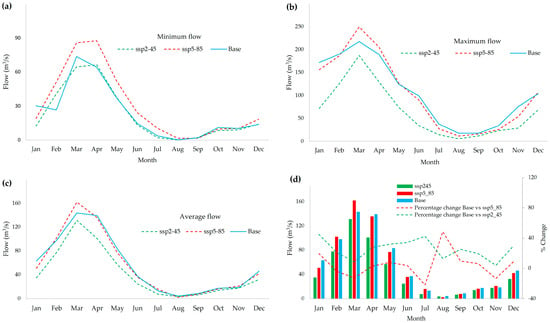
Figure 10.
Projected minimum (a), maximum (b), and average (c) monthly flows, and percentage changes (d) under SSP2–4.5 and SSP5–8.5 scenarios for 2025–2099, compared to historical baseline (1987–2016).
The average monthly flow also exhibits a general decline throughout the year in both scenarios (Figure 10c), with greater intensity of decline under SSP5–8.5. These projected trends are further illustrated by the percentage change in monthly flows (Figure 10d), where the most pronounced decreases are concentrated in the dry season.
3.6. Alterations in the Water Balance Under Future Climate Scenarios
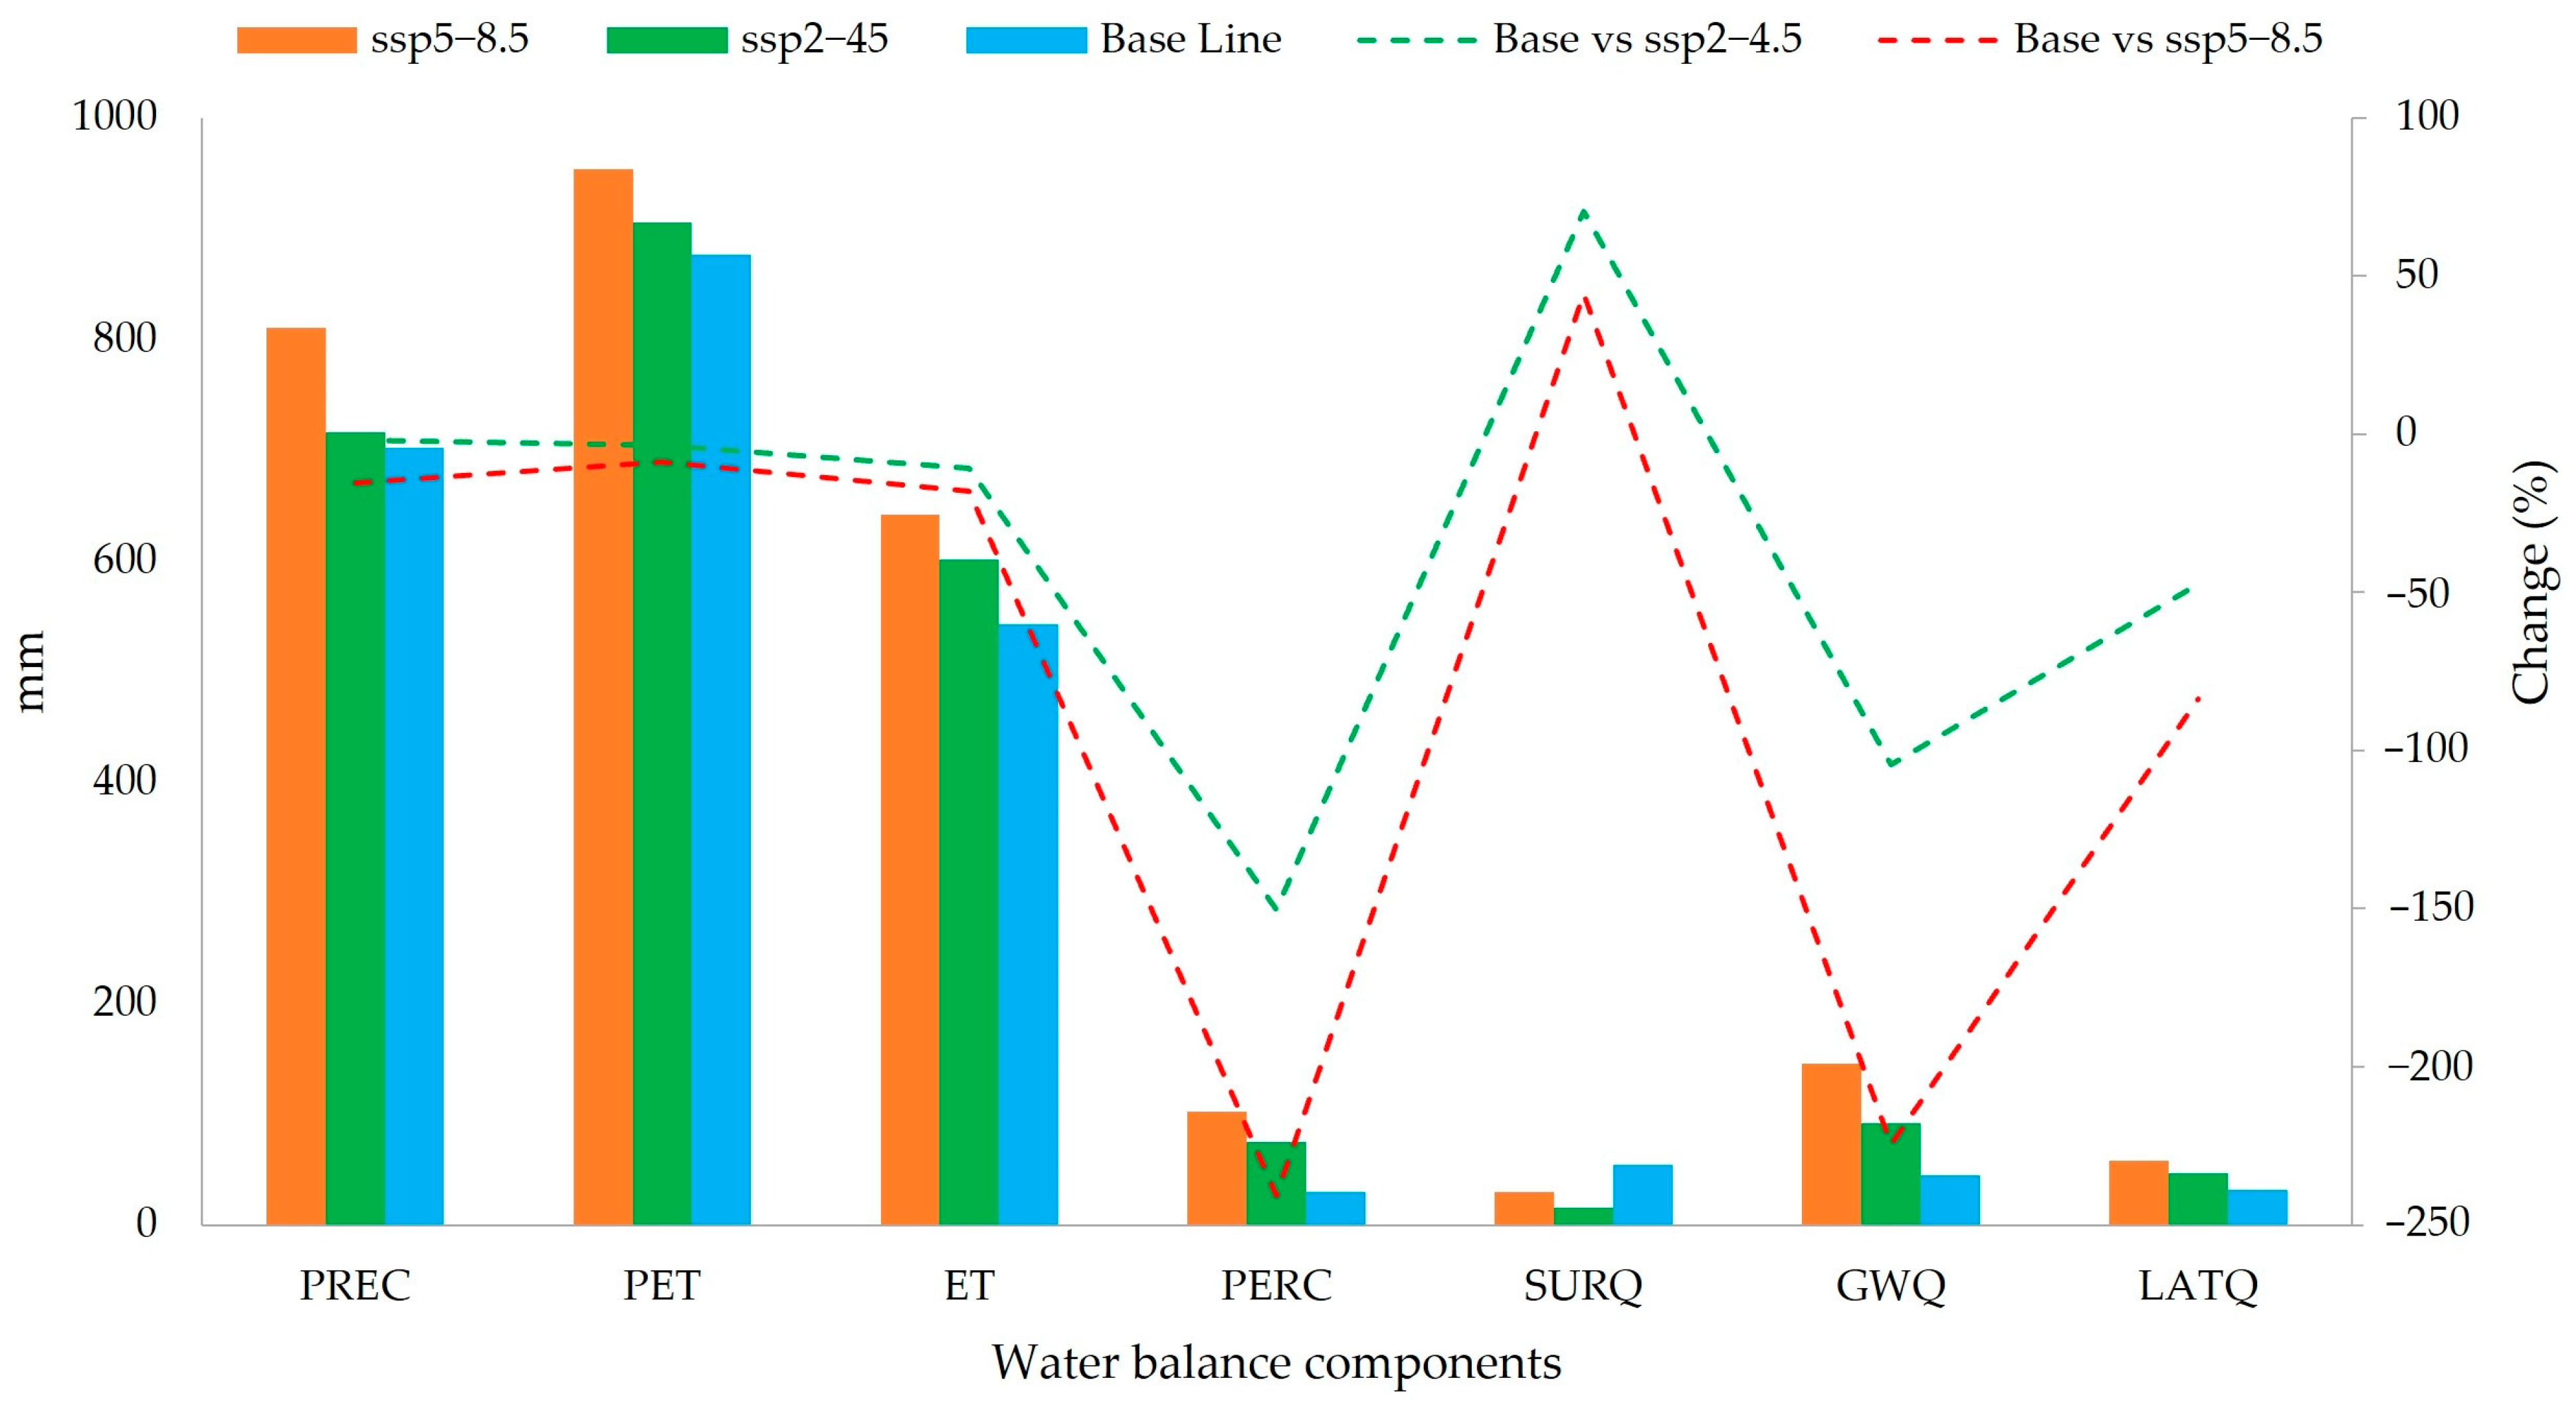
The projected impacts of climate change on the components of the water balance are illustrated in Figure 11 and quantified in Table 5, comparing the historical baseline (1987–2016) with projections for the 2025–2099 period under the SSP2–4.5 and SSP5-8.5 scenarios. Precipitation (PREC) is projected to increase in both scenarios, with a moderate rise of 2.0% under SSP2–4.5 and an increase of 15.4% under SSP5–8.5, reflecting the intensification of rainfall events in a warmer climate. As a result of higher temperatures, both potential evapotranspiration (PET) and actual evapotranspiration (ET) are also expected to rise by 10.8% and 18.2%, respectively. Similarly, surface runoff (SURQ) increases in both scenarios (+3.7% under SSP2–4.5 and +7.4% under SSP5–8.5), suggesting heightened flood risk. In contrast, percolation (PERC) shows a dramatic increase, especially under SSP5-8.5 (+240.9%) and SSP2–4.5 (+150.4%), indicating a shift in water partitioning that may reduce groundwater recharge efficiency.
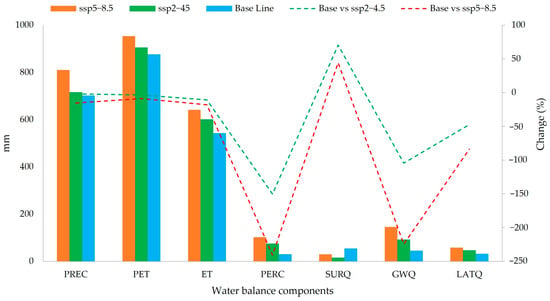
Figure 11.
Projected changes in water balance components (PREC, PET, ET, PERC, SURQ, GWQ, LATQ) under SSP2–4.5 and SSP5–8.5 scenarios, compared to historical baseline (1987–2016).

Table 5.
Variations in water balance components under future climate scenarios relative to historical baseline.
Despite this, groundwater flow (GWQ) responds negatively, with marked decreases of −104.4% under SSP2–4.5 and −224.4% under SSP5–8.5, pointing to possible reductions in baseflow and long-term aquifer support. Similarly, lateral flow (LATQ) is projected to decline by −47.4% and −83.8%, respectively, in each scenario. Both trends point to potential reductions in baseflow and long-term aquifer support, with implications for water availability during dry periods.
3.7. Water Balance and Land Cover Change in the Utcubamba Watershed
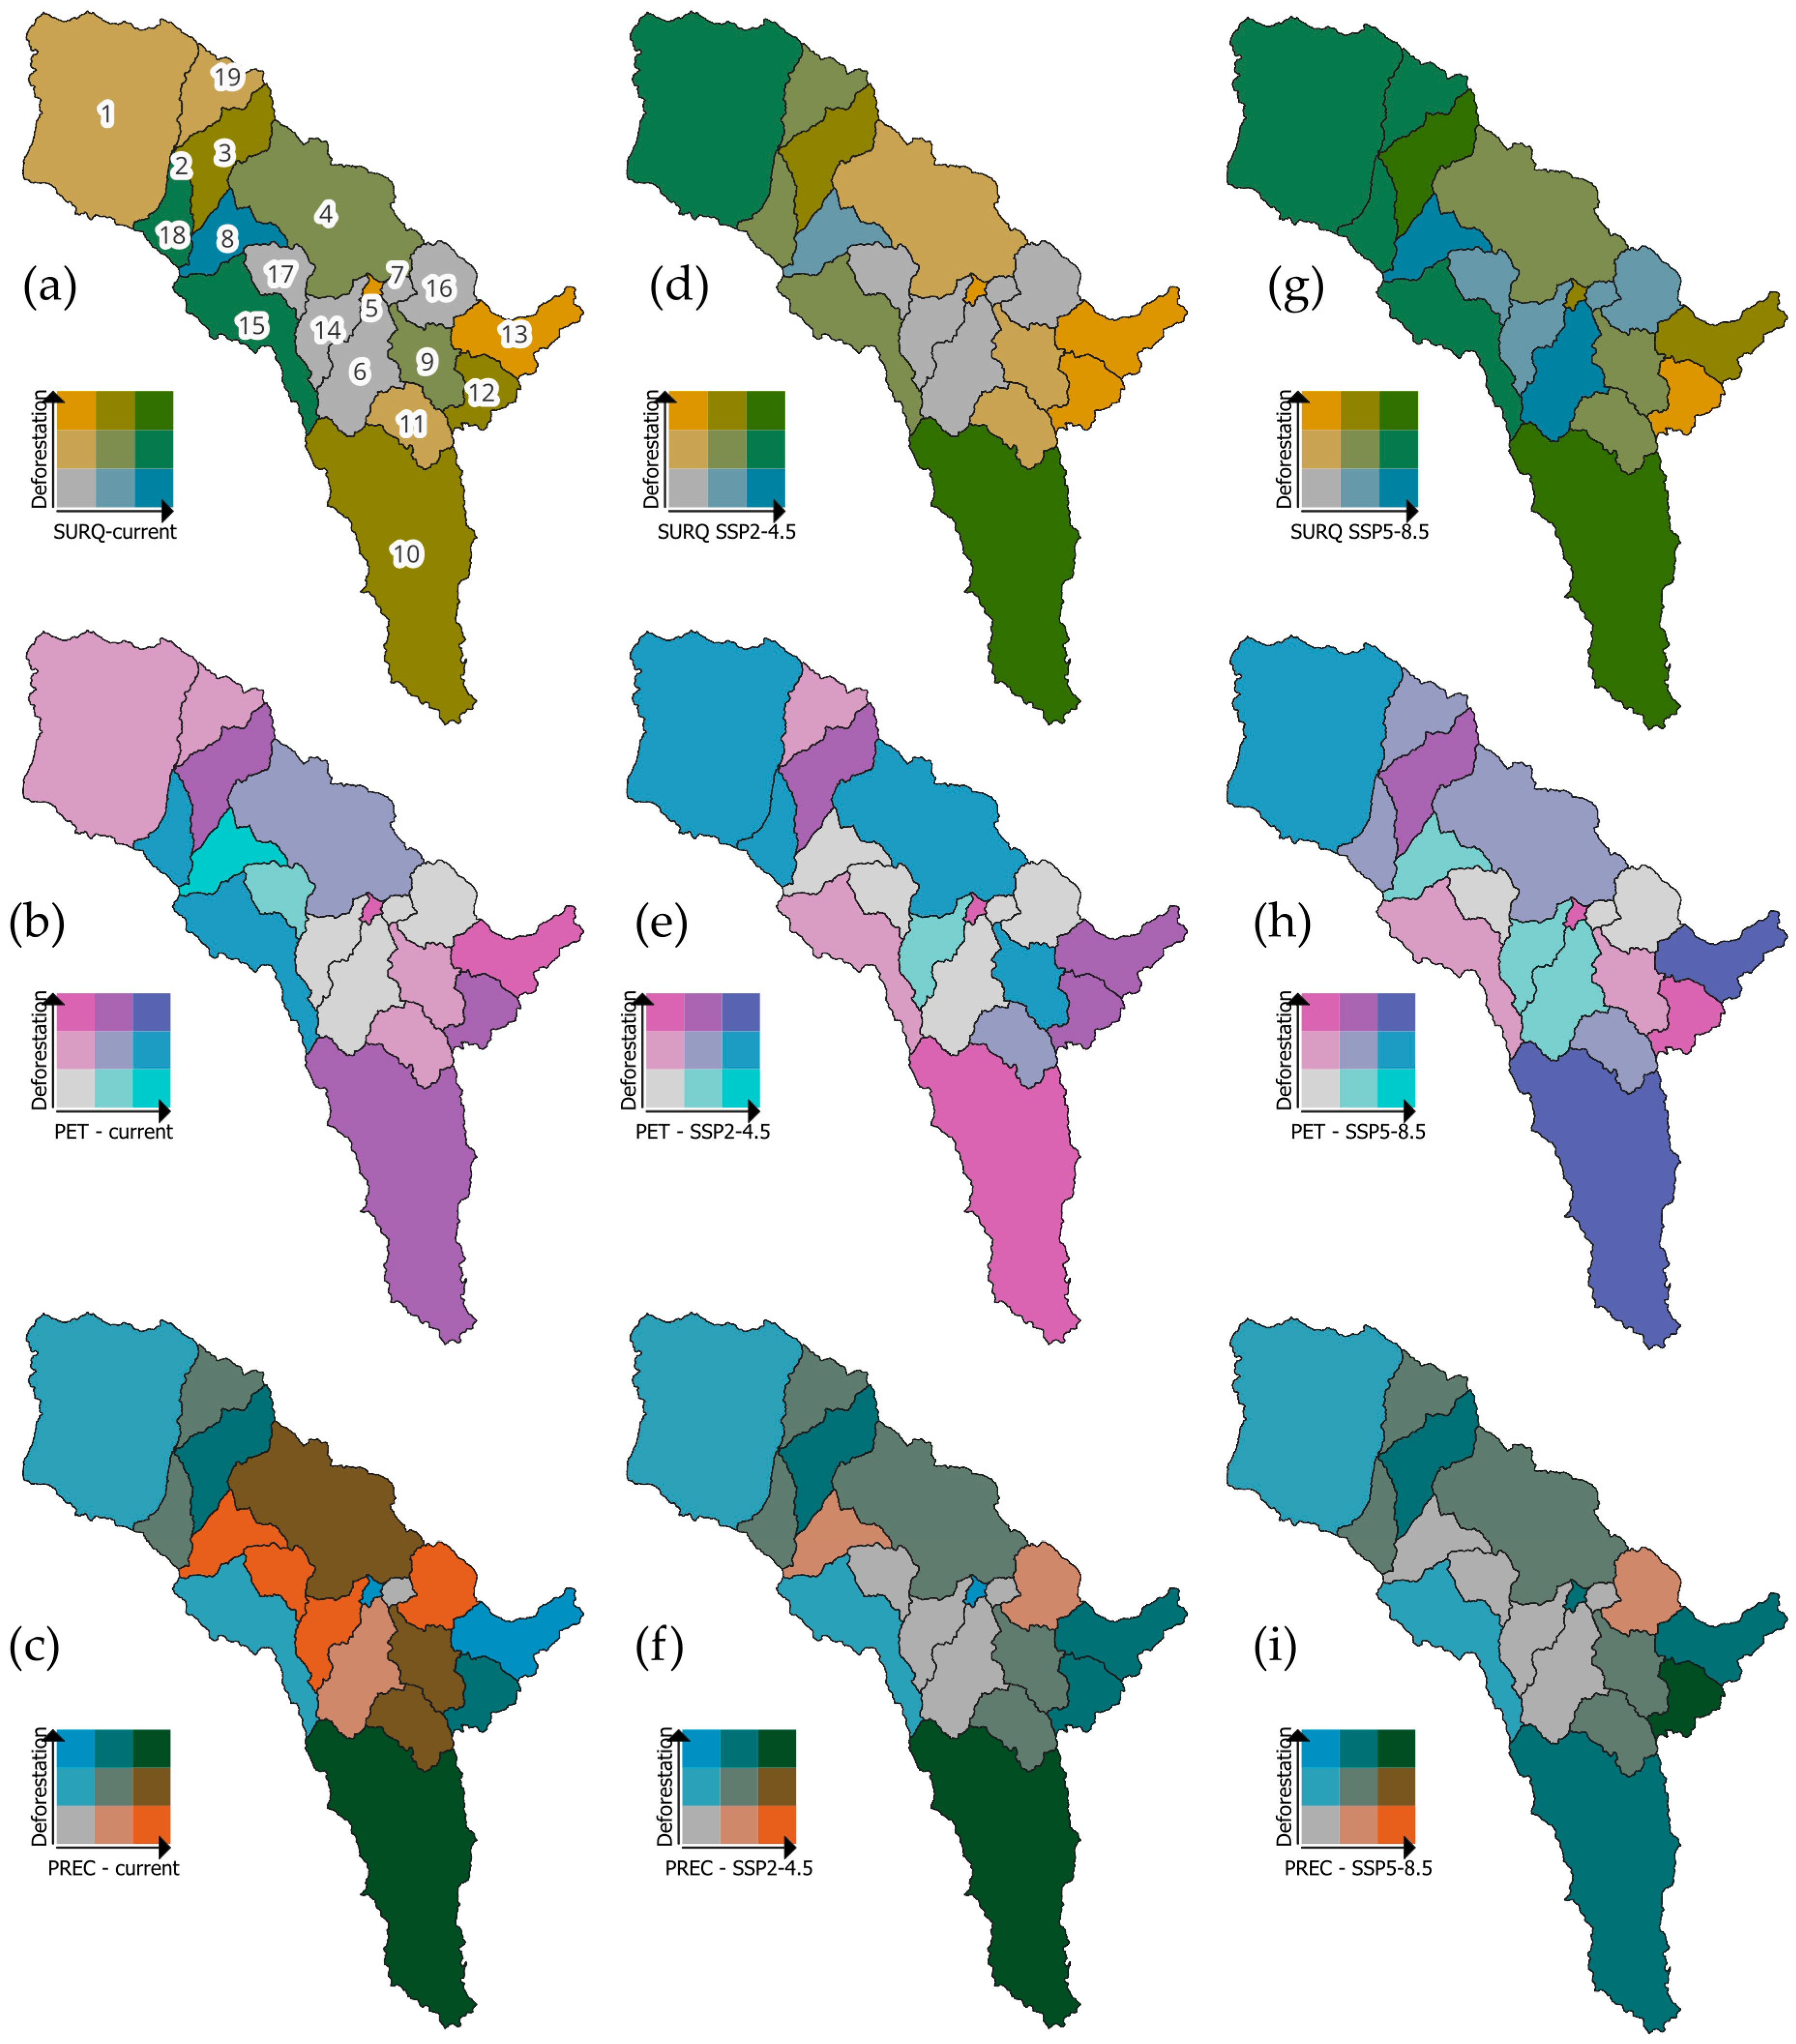
Under current conditions (panels Figure 12a–c), sub-basins 1, 10, and 13 display a high concentration of deforestation, overlapping with surface runoff (SURQ) and potential evapotranspiration (PET), suggesting increased vulnerability to soil erosion and reduced moisture retention. In particular, sub-basin 10 shows the consistent convergence of high land cover change with hydrological stress across all variables. Under SSP2–4.5 (panels Figure 12d–f), this pattern intensifies in sub-basins 10 and 14, where high deforestation aligns with increased SURQ and precipitation (PREC). Scenario SSP5–8.5 (panels Figure 12g–i) reveals even broader spatial overlap, with sub-basins 10, 12, and 13 exhibiting high deforestation along with extreme hydrological values, especially in SURQ and PET. These results highlight the clear amplification of hydrological pressures under future climate pathways, reinforcing the need to prioritize sub-basin-level interventions, particularly in upstream areas, to enhance vegetation cover and improve watershed resilience.
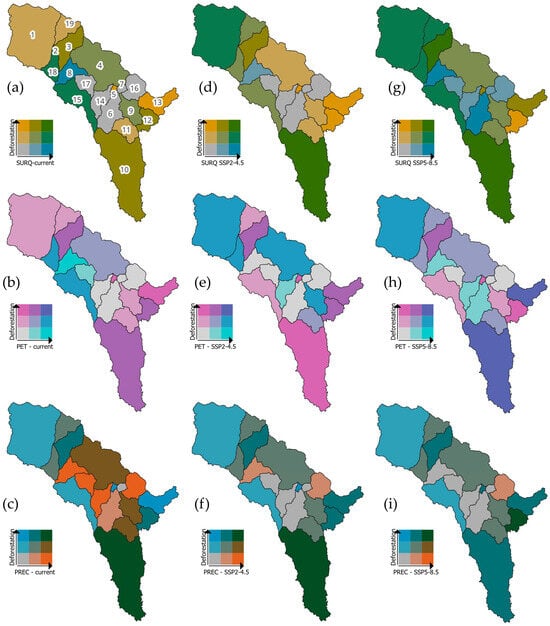
Figure 12.
Bivariate spatial analysis of deforestation concentration and three key hydrological variables simulated with SWAT—surface runoff (SURQ), potential evapotranspiration (PET), and precipitation (PREC)—for current conditions (a–c), SSP2–4.5 scenario (d–f), and SSP5–8.5 scenario (g–i).
4. Discussion
The high accuracy obtained in the LULC classifications for 1990 and 2024 (Kappa index = 0.86 and 0.92, respectively) reflects the robustness of the Random Forest algorithm [81]. In addition, the integration of spectral indices and topographic variables enhanced the accuracy of the LULC process, as found in Andean ecosystems [82]. The land cover changes identified in the Utcubamba Basin, especially the reduction in forest and the expansion of pastures and shrublands, are consistent with local patterns of deforestation and agricultural intensification in rural communities’ territory located in the basin, as reported by [40]. These transformations are not only altering the vegetative structure and increasing landscape fragmentation [31], but are also affecting the hydrological cycle, surface runoff dynamics, and the infiltration capacity of the basin [15,25]. These variations in the hydrological cycle due to vegetation loss are evident in the availability of water for consumption by the population located in the lower Utcubamba Basin [83]. In addition, this hydrological irregularity is further exacerbated by the deterioration of water quality, driven by effluents from domestic, agricultural, and livestock sources along the tributaries of the basin [84].
The findings of this study reveal spatial and temporal shifts in key components of the hydrological cycle, both under historical conditions and future climate scenarios, using the SWAT model, an extensively applied tool in data-scarce regions in order to conduct comprehensive hydrological assessments in support of effective water resource management. Taking in account these results, it is possible to propose the establishment of a pilot framework for integrated watershed management that prioritizes strategic water recharge areas, integrates land use changes, and proposes payment for environmental services in the area [83]. In addition, the appropriate management of páramo and jalca wetlands located in the headwaters of the Utcubamba Basin could help improve year-round water availability [85], which may be reflected in the sustained flow of emblematic waterfalls within the basin such as Gocta, Jumbilla, Chinata or Ashpachaca natural attractions that support local tourism and promote the socioeconomic vitality of communities along the Utcubamba River’s tributaries.
The sensitivity analysis identified the Curve Number for moisture condition II (CN2.mgt), the saturated hydraulic conductivity of the soil profile (SOL_K), and the bulk density of the soil (SOL_BD) as the most influential parameters, aligning with previous studies [86,87], and highlights the need for precise parameterization in regions with complex terrain and high land cover variability, such as mountain basins [15,88]. From this, the simulations under future climate conditions enhance our understanding of when and how the basin might be most vulnerable to droughts or floods. Minimum flows in the dry season (July–October) declined dramatically up to 73.9% under SSP5-8.5, posing serious risks to water security during periods of natural scarcity. Meanwhile, maximum flows increased by 14.8% under the same scenario, indicating potential for more frequent and severe flood events. Floods have occurred over the years in these areas as a result of extreme events, particularly one associated with the El Niño phenomenon [89,90]. These events have caused crop losses, material damage to homes, and landslides that disrupt transportation along the vital route that crosses the Utcubamba Basin and connects the Peruvian coast with the Amazon region [89,91,92]. Therefore, the historical average monthly flow of 60.2 m3/s hides increasingly pronounced seasonal contrasts, ranging from a minimum of 4.6 m3/s to peak flows exceeding 192 m3/s (Figure 9), making water management more difficult as regards agricultural irrigation, human consumption, and tourism activities that depend on this resource. Comparing both scenarios, the more moderate changes projected under SSP2–4.5 suggest lower hydrological disruption. In contrast, the intensified extremes in SSP5–8.5 could strongly impact sub-basins already under land use pressure. These contrasts highlight the importance of evaluating water and climate risks at the sub-basin level and integrating them into local adaptation strategies. Overall, these findings are in line with previous research in high Andean basins, where climate change has been linked to greater flow variability and the loss of hydrological regulation [15,25].
These historical and projected hydrological variations are reflected in changes in the components of the water balance. Under SSP5–8.5, precipitation is expected to increase by 15.4%, while potential evapotranspiration will rise to 953 mm (an 8.8% increase). These changes, combined with a 240.9% increase in percolation and an 83.8% decrease in lateral flow, suggest the weakening of the basin’s capacity to buffer water through subsurface storage and gradual release. This shift may also alter aquifer recharge processes and reduce water availability for riparian ecosystems and local communities, raising important concerns for long-term water security, water quality, and the sustainability of incentive-based conservation mechanisms such as payment for ecosystem services [74,75]. As a result, the need to enhance surface runoff regulation and groundwater recharge requires increases in forest and shrub cover, as these types of vegetation have a direct influence on these parameters, with groundwater recharge being notably more temporally stable under natural forest conditions [93].
Therefore, the analysis of the land use change heatmap allows for the identification of headwater micro-basins in the upper basin, where degraded areas can be restored to increase vegetation cover. This is worthwhile as greater forest cover improves soil water storage and percolation capacity, which are essential for aquifer recharge and the long-term regulation of streamflow [94,95,96]. Maintaining or restoring this vegetative cover also helps to reduce soil degradation, preserve water retention capacity, and mitigate erosion, factors that are critical to sustaining ecosystem functionality in mountain watersheds [12,87]. Greater emphasis on micro-basins 10 and 13 (Figure 12), where Leymebamba and Molinopampa livestock zones as well as extensive agricultural and livestock farms are located, has historically contributed to forest loss and soil compaction [97,98]. Despite reforestation and afforestation efforts aimed at enhancing water recharge, the recovery of these micro-basins has not prioritized the use of native species that support the integrity of the local ecosystem. Instead, reforestation has mainly relied on exotic species such as Pinus as reported by the National Registry of Plantations maintained by the National Forestry and Wildlife Service of Peru—SERFOR (https://geo.serfor.gob.pe/visor/, accessed on 10 February 2025), leaving significant work still needed to restore these degraded areas using native vegetation.
Overall, this study underscores the urgent need for integrated land and water resource management strategies under changing climate scenarios in the Amazonian Andes. However, challenges such as the lack of hydrometeorological stations across the basin pose limitations in terms of obtaining detailed data, thereby necessitating reliance on large-scale climatic variables for modeling. Despite the satisfactory calibration and validation performance (KGE = 0.74; PBIAS = 8.6%), modeling may constrain spatial extrapolation due to a short historical period (15 years) and the use of a single gauging station. Moreover, future projections were based on current land cover, which does not account for potential changes in LULC over the coming decades, an aspect that could further influence hydrological processes. Addressing these challenges will require the expansion of hydrometeorological monitoring networks, the improved integration of dynamic land use scenarios, and the assessment of uncertainties in multiple model inputs. Thus, it will be possible to anticipate hydrological extremes and focus on vulnerabilities at both the sub-basin and basin levels, as well as promote recovery actions for vegetation that enhance water recharge in the headwaters and micro-basins. This multi-scale perspective also supports the more effective integration of watershed dynamics into urban planning, road, and irrigation systems for agriculture and promotes conservation corridors that connect protected areas within the Utcubamba Basin, offering a valuable framework for adaptive management and regional land use planning.
5. Conclusions
This study explored the effects of historical land cover changes (1990–2024) and future climate scenarios on the hydrological dynamics of the Utcubamba Basin, a tropical Andean–Amazonian watershed pressured by deforestation, land use intensification, and climate variability. Despite its ecological and hydrological importance, the basin remains understudied due to limited monitoring infrastructure and data scarcity. To address this challenge, the SWAT model was employed as a decision-support tool, demonstrating good performance in replicating observed streamflow patterns, with a KGE of 0.74 and a PBIAS of 8.6% during the calibration period. These results confirm the model’s suitability for analyzing hydrological behavior in data-scarce mountainous regions and support its application in long-term water resource planning under changing land use and climate conditions.
Hydrological projections under SSP5-8.5 indicate a 73.9% reduction in minimum flows and a 14.8% increase in peak flows, intensifying seasonal extremes. The water balance also shifts, with percolation increasing by 240.9% and lateral flow declining by 83.8%, suggesting disruption in groundwater recharge and runoff partitioning. These findings underscore how land cover dynamics and climate interactions exacerbate water availability risks, especially in upper sub-basins such as 10 and 13, which encompass the areas with Leimebamba and Molinopampa livestock. In these zones, highland grasslands (pajonales) and wetlands play a crucial role in sustaining aquifer recharge throughout the entire Utcubamba Basin.
To ensure long-term water security and socioecological resilience, integrated watershed planning should prioritize the restoration of degraded areas with native forest species, the implementation of localized monitoring, and adaptive strategies that align with sub-basin vulnerabilities. Although this study relied on limited observed data and global models, it provides a replicable framework for other data-scarce basins. Future research should strengthen distributed calibration, explore sociohydrological feedback, and promote participatory approaches to support climate-resilient watershed governance in the Amazonian Andes.
Author Contributions
Conceptualization, A.S.R.-F., R.S.L. and N.R.; data curation, A.S.R.-F. and K.M.T.-T.; formal analysis, A.S.R.-F., J.A.Z.-S., A.J.M.-M., J.A.S.-V. and T.B.S.-M.; funding acquisition, C.P.; investigation, A.S.R.-F., A.C.-S., J.A.Z.-S., N.R., A.J.M.-M., K.M.T.-T., M.O.-C., C.P. and E.B.; methodology, A.S.R.-F., R.S.L., J.A.Z.-S., N.R. and A.J.M.-M.; project administration, R.S.L., M.O.-C. and C.P.; resources, E.B.; software, A.S.R.-F.; supervision, R.S.L., M.O.-C. and E.B.; validation, A.S.R.-F.; visualization, A.S.R.-F.; writing—original draft, A.S.R.-F.; writing—review & editing, A.C.-S., J.A.Z.-S. and E.B. All authors have read and agreed to the published version of the manuscript.
Funding
This research was funded by the Public Investment Project “Creation of a Geomatics and Remote Sensing Laboratory of the National University Toribio Rodríguez of Mendoza of Amazonas” GEOMATICA, (CUI N° 2255626). The APC was funded by the Vice-Rectorate for Research of the Universidad Nacional del Amazonas Toribio Rodríguez de Mendoza de Amazonas.
Data Availability Statement
Data supporting the results of this research are available upon request, by contacting the authors.
Acknowledgments
The authors wish to express their sincere gratitude to the following institutions for their invaluable contribution to this research: the National Water Authority (ANA), for its institutional support, and the National Meteorology and Hydrology Service of Peru (SENAMHI), for providing the historical climate and hydrology data of the study area.
Conflicts of Interest
The authors state that there are no pecuniary interests or interpersonal relationships that could bias the results recorded in this manuscript.
Correction Statement
This article has been republished with a minor correction to an author’s ORCID. This change does not affect the scientific content of the article.
References
- Shemer, H.; Wald, S.; Semiat, R. Challenges and Solutions for Global Water Scarcity. Membranes 2023, 13, 612. [Google Scholar] [CrossRef]
- Chen, Y.; Takeuchi, K.; Xu, C.; Chen, Y.; Xu, Z. Regional Climate Change and Its Effects on River Runoff in the Tarim Basin, China. Hydrol. Process. 2006, 20, 2207–2216. [Google Scholar] [CrossRef]
- Oki, T.; Kanae, S. Global Hydrological Cycles and World Water Resources. Science 2006, 313, 1068–1072. [Google Scholar] [CrossRef] [PubMed]
- Kaushal, S.S.; Gold, A.J.; Mayer, P.M. Land Use, Climate, and Water Resources-Global Stages of Interaction. Water 2017, 9, 815. [Google Scholar] [CrossRef] [PubMed]
- Elkouk, A.; Pokhrel, Y.; Satoh, Y.; Bouchaou, L. Implications of Changes in Climate and Human Development on 21st-Century Global Drought Risk. J. Environ. Manag. 2022, 317, 115378. [Google Scholar] [CrossRef]
- Meran, G.; Siehlow, M.; von Hirschhausen, C. Integrated Water Resource Management: Principles and Applications. In Springer Water; Springer Nature: Berlin, Germany, 2021; pp. 23–121. [Google Scholar]
- Katusiime, J.; Schütt, B. Integrated Water Resources Management Approaches to Improve Water Resources Governance. Water 2020, 12, 3424. [Google Scholar] [CrossRef]
- Xue, S.; Guo, X.; He, Y.; Cai, H.; Li, J.; Zhu, L.; Ye, C. Effects of Future Climate and Land Use Changes on Runoff in Tropical Regions of China. Sci. Rep. 2024, 14, 30922. [Google Scholar] [CrossRef]
- Flotemersch, J.E.; Leibowitz, S.G.; Hill, R.A.; Stoddard, J.L.; Thoms, M.C.; Tharme, R.E. A Watershed Integrity Definition and Assessment Approach to Support Strategic Management of Watersheds. River Res. Appl. 2016, 32, 1654–1671. [Google Scholar] [CrossRef]
- Wu, Y.; Zhang, H.; Lan, T.; Wei, X.; Shao, S.; Zhang, J.; Ding, H. Attribution of Runoff Variation to Climate and Human-Driven Changes in the Transition Zone between the Qinling Mountains and the Loess Plateau under Vegetation Greening. Hydrol. Res. 2022, 53, 733–753. [Google Scholar] [CrossRef]
- Khadka, D.; Babel, M.S.; Kamalamma, A.G. Assessing the Impact of Climate and Land-Use Changes on the Hydrologic Cycle Using the SWAT Model in the Mun River Basin in Northeast Thailand. Water 2023, 15, 3672. [Google Scholar] [CrossRef]
- Wang, K.; Yue, D.; Zhang, H. Runoff Simulation of the Upstream Watershed of the Feiling Hydrological Station in the Qinhe River Based on the SWAT Model. Water 2024, 16, 1044. [Google Scholar] [CrossRef]
- Badora, D.; Wawer, R.; Nieróbca, A.; Król-Badziak, A.; Kozyra, J.; Jurga, B.; Nowocień, E. Simulating the Effects of Agricultural Adaptation Practices onto the Soil Water Content in Future Climate Using SWAT Model on Upland Bystra River Catchment. Water 2022, 14, 2288. [Google Scholar] [CrossRef]
- Gupta, A.; Himanshu, S.K.; Gupta, S.; Singh, R. Evaluation of the SWAT Model for Analysing the Water Balance Components for the Upper Sabarmati Basin. In Lecture Notes in Civil Engineering; Springer: Berlin/Heidelberg, Germany, 2020; Volume 39, pp. 141–151. [Google Scholar]
- Valencia, S.; Villegas, J.C.; Hoyos, N.; Duque-Villegas, M.; Salazar, J.F. Streamflow Response to Land Use/Land Cover Change in the Tropical Andes Using Multiple SWAT Model Variants. J. Hydrol. Reg. Stud. 2024, 54, 101888. [Google Scholar] [CrossRef]
- Huang, X.; Qiu, L. Impacts of Climate Change and Land Use/Cover Change on Runoff in the Huangfuchuan River Basin. Land 2024, 13, 2048. [Google Scholar] [CrossRef]
- Aznarez, C.; Jimeno-Sáez, P.; López-Ballesteros, A.; Pacheco, J.P.; Senent-Aparicio, J. Analysing the Impact of Climate Change on Hydrological Ecosystem Services in Laguna Del Sauce (Uruguay) Using the Swat Model and Remote Sensing Data. Remote Sens. 2021, 13, 2014. [Google Scholar] [CrossRef]
- Valdivia, A.M.; Díaz, D.S. Impacto Del Cambio Climático En La Hidrología de Regiones Criohidrológicas: Una Revisión Sistemática. J. Sci. Metrics Eval. 2023, 1, 12–25. [Google Scholar] [CrossRef]
- Briceño, N.B.R.; Castillo, E.B.; Quintana, J.L.M.; Cruz, S.M.O.; López, R.S. Deforestation in the Peruvian Amazon: Indexes of Land Cover/Land Use (LC/LU) Changes Based on GIS. Bol. Asoc. Geogr. Esp. 2019, 81, 2538a. [Google Scholar] [CrossRef]
- Liu, Y.; Su, Y.; Wang, L.; Zhao, Y. Simulation and Evaluation of Runoff in Tributary of Weihe River Basin in Western China. Water 2024, 16, 221. [Google Scholar] [CrossRef]
- Colín-García, G.; Palacios-Vélez, E.; López-Pérez, A.; Bolaños-González, M.A.; Flores-Magdaleno, H.; Ascencio-Hernández, R.; Canales-Islas, E.I. Evaluation of the Impact of Climate Change on the Water Balance of the Mixteco River Basin with the SWAT Model. Hydrology 2024, 11, 45. [Google Scholar] [CrossRef]
- Masood, M.U.; Khan, N.M.; Haider, S.; Anjum, M.N.; Chen, X.; Gulakhmadov, A.; Iqbal, M.; Ali, Z.; Liu, T. Appraisal of Land Cover and Climate Change Impacts on Water Resources: A Case Study of Mohmand Dam Catchment, Pakistan. Water 2023, 15, 1313. [Google Scholar] [CrossRef]
- Ferraz, L.L.; de Sousa, L.F.; de Jesus, R.M.; Costa, K.A.; Santos, C.A.S.; Rocha, F.A. Climate and Land Use Changes Impacts on Streamflow in the Brazilian Cerrado Basin. Ecohydrol. Hydrobiol. 2024, 25, 357–366. [Google Scholar] [CrossRef]
- Barreto-Martin, C.; Sierra-Parada, R.; Calderón-Rivera, D.; Jaramillo-Londono, A.; Mesa-Fernández, D. Spatio-Temporal Analysis of the Hydrological Response to Land Cover Changes in the Sub-Basin of the Chicú River, Colombia. Heliyon 2021, 7, e07358. [Google Scholar] [CrossRef] [PubMed]
- Mera-Parra, C.; Oñate-Valdivieso, F.; Massa-Sánchez, P.; Ochoa-Cueva, P. Establishment of the Baseline for the Iwrm in the Ecuadorian Andean Basins: Land Use Change, Water Recharge, Meteorological Forecast and Hydrological Modeling. Land 2021, 10, 513. [Google Scholar] [CrossRef]
- Pachac-Huerta, Y.; Lavado-Casimiro, W.; Zapana, M.; Peña, R. Understanding Spatio-Temporal Hydrological Dynamics Using SWAT: A Case Study in the Pativilca Basin. Hydrology 2024, 11, 165. [Google Scholar] [CrossRef]
- Paiva, K.; Rau, P.; Montesinos, C.; Lavado-Casimiro, W.; Bourrel, L.; Frappart, F. Hydrological Response Assessment of Land Cover Change in a Peruvian Amazonian Basin Impacted by Deforestation Using the SWAT Model. Remote Sens. 2023, 15, 5774. [Google Scholar] [CrossRef]
- Cotrina Sánchez, A.; Salazar, A.; Oviedo, C.; Bandopadhyay, S.; Mondaca, P.; Valentini, R.; Rojas Briceño, N.B.; Torres Guzmán, C.; Oliva, M.; Guzman, B.K.; et al. Integrated Cloud Computing and Cost Effective Modelling to Delineate the Ecological Corridors for Spectacled Bears (Tremarctos Ornatus) in the Rural Territories of the Peruvian Amazon. Glob. Ecol. Conserv. 2022, 36, e02126. [Google Scholar] [CrossRef]
- Yunis, C.R.C.; López, R.S.; Cruz, S.M.O.; Castillo, E.B.; López, J.O.S.; Trigoso, D.I.; Briceño, N.B.R. Land Suitability for Sustainable Aquaculture of Rainbow Trout (Oncorhynchus Mykiss) in Molinopampa (Peru) Based on RS, GIS, and AHP. ISPRS Int. J. Geo-Inf. 2020, 9, 28. [Google Scholar] [CrossRef]
- Medina Medina, A.J.; Salas López, R.; Zabaleta Santisteban, J.A.; Tuesta Trauco, K.M.; Turpo Cayo, E.Y.; Huaman Haro, N.; Oliva Cruz, M.; Gómez Fernández, D. An Analysis of the Rice-Cultivation Dynamics in the Lower Utcubamba River Basin Using SAR and Optical Imagery in Google Earth Engine (GEE). Agronomy 2024, 14, 557. [Google Scholar] [CrossRef]
- Gómez-Fernández, D.; López, R.S.; Zabaleta-Santisteban, J.A.; Medina-Medina, A.J.; Goñas, M.; Silva-López, J.O.; Oliva-Cruz, M.; Rojas-Briceño, N.B. Landsat Images and GIS Techniques as Key Tools for Historical Analysis of Landscape Change and Fragmentation. Ecol. Inform. 2024, 82, 102738. [Google Scholar] [CrossRef]
- United Nations Transformar Nuestro Mundo: La Agenda 2030 para el Desarrollo Sostenible|Departamento de Asuntos Económicos y Sociales. Available online: https://sdgs.un.org/2030agenda (accessed on 27 May 2025).
- Castro, W.F. Geomorfología. In Estudios Temáticos para la Zoonificación Ecológica y Económica del Departamento de Amazonas; IIAP: Amazonas, Peru, 2014; p. 55. [Google Scholar]
- Huaman, N.; Lopezhaya Mendoza, J.B.; Medina Medina, A.J.; Zabaleta Santisteban, J.A.; Tineo Flores, D.; Juarez-Contreras, L.; Goñas, M.; Oliva-Cruz, M. Agronomic and Economic Evaluation of Tree Species in Agroforestry Systems with Cocoa (Theobroma cacao L.) in Amazonas. Preprints 2024. [Google Scholar] [CrossRef]
- Orrillo, G. Ecoturismo Como Estrategia de Desarrollo Sostenible del Área de Conservación Privada Hierva Buena—Allpayacu: Provincia de Bongará, Amazonas, 2021; IIAP: Amazonas, Peru, 2022; Available online: https://hdl.handle.net/20.500.14077/2717 (accessed on 10 May 2025).
- Instituto Nacional de Estadística e Informática (INEI) Censos Nacionales 2017: XII Población, VII Vivienda y III Comunidades IndÍgenas. Available online: https://censos2017.inei.gob.pe/redatam/ (accessed on 25 May 2025).
- Goñas, M.; Rojas-Briceño, N.B.; Gómez Fernández, D.; Iliquín Trigoso, D.; Atalaya Marin, N.; Bravo, V.C.; Díaz-Valderrama, J.R.; Maicelo-Quintana, J.L.; Oliva-Cruz, M. Economic Profitability of Carbon Sequestration of Fine-Aroma Cacao Agroforestry Systems in Amazonas, Peru. Forests 2024, 15, 500. [Google Scholar] [CrossRef]
- SENAMHI Datos Hidrometereologicos. Available online: https://www.senamhi.gob.pe/site/descarga-datos/ (accessed on 10 July 2024).
- Gorelick, N.; Hancher, M.; Dixon, M.; Ilyushchenko, S.; Thau, D.; Moore, R. Google Earth Engine: Planetary-Scale Geospatial Analysis for Everyone. Remote Sens. Environ. 2017, 202, 18–27. [Google Scholar] [CrossRef]
- Barboza, E.; Turpo, E.Y.; Tariq, A.; Salas López, R.; Pizarro, S.; Zabaleta-Santisteban, J.A.; Medina-Medina, A.J.; Tuesta-Trauco, K.M.; Oliva-Cruz, M.; Vásquez, H.V. Spatial Distribution of Burned Areas from 1986 to 2023 Using Cloud Computing: A Case Study in Amazonas (Peru). Fire 2024, 7, 413. [Google Scholar] [CrossRef]
- Peñuelas, J.; Gamon, J.A.; Griffin, K.L.; Field, C.B. Assessing Community Type, Plant Biomass, Pigment Composition, and Photosynthetic Efficiency of Aquatic Vegetation from Spectral Reflectance. Remote Sens. Environ. 1993, 46, 110–118. [Google Scholar] [CrossRef]
- McFeeters, S.K. The Use of the Normalized Difference Water Index (NDWI) in the Delineation of Open Water Features. Int. J. Remote Sens. 1996, 17, 1425–1432. [Google Scholar] [CrossRef]
- Gitelson, A.A.; Gritz, Y.; Merzlyak, M.N. Relationships between Leaf Chlorophyll Content and Spectral Reflectance and Algorithms for Non-Destructive Chlorophyll Assessment in Higher Plant Leaves. J. Plant Physiol. 2003, 160, 271–282. [Google Scholar] [CrossRef]
- Huete, A.R. A Soil-Adjusted Vegetation Index (SAVI). Remote Sens. Environ. 1988, 25, 295–309. [Google Scholar] [CrossRef]
- Key, C.H.; Benson, N. The Normalized Burn Ratio (NBR): A Landsat TM Radiometric Measure of Burn Severity; USGS Northern Rocky Mountain Science Center. Available online: https://www.frames.gov/catalog/5860 (accessed on 6 June 2025).
- Watson, D.J. Comparative Physiological Studies on the Growth of Field Crops: I. Variation in Net Assimilation Rate and Leaf Area between Species and Varieties, and within and between Years. Ann. Bot. 1947, 11, 41–76. [Google Scholar] [CrossRef]
- Farr, T.G.; Rosen, P.A.; Caro, E.; Crippen, R.; Duren, R.; Hensley, S.; Kobrick, M.; Paller, M.; Rodriguez, E.; Roth, L.; et al. The Shuttle Radar Topography Mission. Rev. Geophys. 2007, 45, 2004. [Google Scholar] [CrossRef]
- Aguilar, R.; Zurita-Milla, R.; Izquierdo-Verdiguier, E.; de By, R.A. A Cloud-Based Multi-Temporal Ensemble Classifier to Map Smallholder Farming Systems. Remote Sens. 2018, 10, 729. [Google Scholar] [CrossRef]
- MINAM. Mapa Nacional de Cobertura Vegetal. Memoria Descriptiva; Dirección General de Evaluación, Valoración y Financiamiento del Patrimonio Natural: Lima, Perú, 2015. [Google Scholar]
- Breiman, L. Random Forests. Mach. Learn. 2001, 45, 5–32. [Google Scholar] [CrossRef]
- Nguyen, L.H.; Joshi, D.R.; Clay, D.E.; Henebry, G.M. Characterizing Land Cover/Land Use from Multiple Years of Landsat and MODIS Time Series: A Novel Approach Using Land Surface Phenology Modeling and Random Forest Classifier. Remote Sens. Environ. 2020, 238, 111017. [Google Scholar] [CrossRef]
- Talukdar, S.; Eibek, K.U.; Akhter, S.; Ziaul, S.; Towfiqul Islam, A.R.M.; Mallick, J. Modeling Fragmentation Probability of Land-Use and Land-Cover Using the Bagging, Random Forest and Random Subspace in the Teesta River Basin, Bangladesh. Ecol. Indic. 2021, 126, 107612. [Google Scholar] [CrossRef]
- Barboza, E.; Salazar, W.; Gálvez-Paucar, D.; Valqui-Valqui, L.; Saravia, D.; Gonzales, J.; Aldana, W.; Vásquez, H.V.; Arbizu, C.I. Cover and Land Use Changes in the Dry Forest of Tumbes (Peru) Using Sentinel-2 and Google Earth Engine Data. Environ. Sci. Proc. 2022, 22, 2. [Google Scholar] [CrossRef]
- Arizapana-Almonacid, M.A.; Pariona-Antonio, V.H.; Castañeda-Tinco, I.; Ascención Mendoza, J.C.; Gutiérrez Gómez, E.; Ramoni-Perazzi, P. Land Cover Changes and Comparison of Current Landscape Metrics in a Region of the Central Andes Affected by Population Migration. Ann. GIS 2024, 30, 105–120. [Google Scholar] [CrossRef]
- Thanh Noi, P.; Kappas, M. Comparison of Random Forest, k-Nearest Neighbor, and Support Vector Machine Classifiers for Land Cover Classification Using Sentinel-2 Imagery. Sensors 2017, 18, 18. [Google Scholar] [CrossRef] [PubMed]
- Cohen, J. A Coefficient of Agreement for Nominal Scales. Educ. Psychol. Meas. 1960, 20, 37–46. [Google Scholar] [CrossRef]
- Heydari, S.S.; Mountrakis, G. Effect of Classifier Selection, Reference Sample Size, Reference Class Distribution and Scene Heterogeneity in per-Pixel Classification Accuracy Using 26 Landsat Sites. Remote Sens. Environ. 2018, 204, 648–658. [Google Scholar] [CrossRef]
- MINAM. Nota Técnica No. 1. Programa Nacional de Conservación de Bosques Mapas Kernel Como Indicador de la Concentración de la Pérdida de Bosques Húmedos Amazónicos del Perú; Ministerio del Ambiente (Perú): Lima, Peru, 2014; pp. 1–14. [Google Scholar]
- Villamizar, S.R.; Pineda, S.M.; Carrillo, G.A. The Effects of Land Use and Climate Change on the Water Yield of a Watershed in Colombia. Water 2019, 11, 285. [Google Scholar] [CrossRef]
- ISRIC SOIL GRIDS. Available online: https://www.isric.org/explore/soilgrids (accessed on 8 July 2024).
- PISCO SENAMHI HSR PISCO. Available online: https://iridl.ldeo.columbia.edu/SOURCES/.SENAMHI/.HSR/.PISCO/index.html?Set-Language=es (accessed on 20 February 2024).
- Asurza-Véliz, F.A.; Lavado-Casimiro, W.S. Regional Parameter Estimation of the SWAT Model: Methodology and Application to River Basins in the Peruvian Pacific Drainage. Water 2020, 12, 3198. [Google Scholar] [CrossRef]
- ANA. Observatorio Nacional de Recursos Hídricos. Autoridad Nacional del Agua (Perú), Lima, Perú. Available online: https://snirh.ana.gob.pe/onrh/ (accessed on 10 July 2024).
- Murillo, P.; Fabricio, R. Impacto Del Uso de Suelo y Cambio Climático En El Caudal y Generación de Sedimentos En La Cuenca Puyango-Tumbes. Ph.D. Thesis, Universidad Nacional Agraria La Molina, Lima, Peru, 2024. [Google Scholar]
- NCCS. Proyecciones Diarias Reducidas Globales de NASA Earth Exchange (NEX-GDDP-CMIP6). Available online: https://www.nccs.nasa.gov/services/data-collections/land-based-products/nex-gddp-cmip6 (accessed on 12 March 2025).
- Goyal, M.K.; Panchariya, V.K.; Sharma, A.; Singh, V. Comparative Assessment of SWAT Model Performance in Two Distinct Catchments under Various DEM Scenarios of Varying Resolution, Sources and Resampling Methods. Water Resour. Manag. 2018, 32, 805–825. [Google Scholar] [CrossRef]
- Tan, M.L.; Ficklin, D.L.; Dixon, B.; Ibrahim, A.L.; Yusop, Z.; Chaplot, V. Impacts of DEM Resolution, Source, and Resampling Technique on SWAT-Simulated Streamflow. Appl. Geogr. 2015, 63, 357–368. [Google Scholar] [CrossRef]
- Rufino, P.R.; Gücker, B.; Faramarzi, M.; Boëchat, I.G.; Cardozo, F.d.S.; Santos, P.R.; Zanin, G.D.; Mataveli, G.; Pereira, G. Evaluation of the SWAT Model for the Simulation of Flow and Water Balance Based on Orbital Data in a Poorly Monitored Basin in the Brazilian Amazon. Geographies 2022, 3, 1–18. [Google Scholar] [CrossRef]
- Arnold, J.G.; Srinivasan, R.; Muttiah, R.S.; Williams, J.R. LARGE AREA HYDROLOGIC MODELING AND ASSESSMENT PART I: MODEL DEVELOPMENT1. JAWRA J. Am. Water Resour. Assoc. 1998, 34, 73–89. [Google Scholar] [CrossRef]
- Neitsch, J.; Arnold, J.W. Soil and Water Assessment Tool Theoretical Documentation; Texas Water Resources Institute: College Station, TX, USA, 2005; Available online: https://swat.tamu.edu/media/1292/swat2005theory.pdf (accessed on 4 June 2025).
- Dile, Y.T.; Daggupati, P.; George, C.; Srinivasan, R.; Arnold, J. Introducing a New Open Source GIS User Interface for the SWAT Model. Environ. Model. Softw. 2016, 85, 129–138. [Google Scholar] [CrossRef]
- Sharma, A.; Patel, P.L.; Sharma, P.J. Influence of Climate and Land-Use Changes on the Sensitivity of SWAT Model Parameters and Water Availability in a Semi-Arid River Basin. CATENA 2022, 215, 106298. [Google Scholar] [CrossRef]
- Huerta, A.; Aybar, C.; Imfeld, N.; Correa, K.; Felipe-Obando, O.; Rau, P.; Drenkhan, F.; Lavado-Casimiro, W. High-Resolution Grids of Daily Air Temperature for Peru—The New PISCOt v1.2 Dataset. Sci. Data 2023, 10, 847. [Google Scholar] [CrossRef] [PubMed]
- Anaba, L.A.; Banadda, N.; Kiggundu, N.; Wanyama, J.; Engel, B.; Moriasi, D.; Anaba, L.A.; Banadda, N.; Kiggundu, N.; Wanyama, J.; et al. Application of SWAT to Assess the Effects of Land Use Change in the Murchison Bay Catchment in Uganda. Comput. Water Energy Environ. Eng. 2016, 6, 24–40. [Google Scholar] [CrossRef]
- Teshome, F.T.; Bayabil, H.K.; Thakural, L.N.; Welidehanna, F.G.; Teshome, F.T.; Bayabil, H.K.; Thakural, L.N.; Welidehanna, F.G. Modeling Stream Flow Using SWAT Model in the Bina River Basin, India. J. Water Resour. Prot. 2020, 12, 203–222. [Google Scholar] [CrossRef]
- Ntegeka, V.; Willems, P. Trends and Multidecadal Oscillations in Rainfall Extremes, Based on a More than 100-Year Time Series of 10 Min Rainfall Intensities at Uccle, Belgium. Water Resour. Res. 2008, 44, W07402. [Google Scholar] [CrossRef]
- Montenejto, J. GitHub—Hydroenvironment/Statdownscaling: Statistical Dowscaling of Climate Data at Daily Scale Using Quantile Mapping (QPM) Technique. Available online: https://github.com/Hydroenvironment/Statdownscaling (accessed on 28 April 2025).
- Tabari, H.; Taye, M.T.; Onyutha, C.; Willems, P. Decadal Analysis of River Flow Extremes Using Quantile-Based Approaches. Water Resour. Manag. 2017, 31, 3371–3387. [Google Scholar] [CrossRef]
- Taye, M.T.; Willems, P. Identifying Sources of Temporal Variability in Hydrological Extremes of the Upper Blue Nile Basin. J. Hydrol. 2013, 499, 61–70. [Google Scholar] [CrossRef]
- Rivera, P.; Herrera, E.; Ochoa, W. Comparación de Series Mensuales de Precipitación y Temperaturas de Los Modelos CMIP6 Para Guatemala. Ciencia Tecnol. Y Salud 2022, 9, 132–149. [Google Scholar] [CrossRef]
- Belgiu, M.; Drăgu, L. Random Forest in Remote Sensing: A Review of Applications and Future Directions. ISPRS J. Photogramm. Remote Sens. 2016, 114, 24–31. [Google Scholar] [CrossRef]
- Pizarro, S.E.; Pricope, N.G.; Vargas-Machuca, D.; Huanca, O.; Ñaupari, J. Mapping Land Cover Types for Highland Andean Ecosystems in Peru Using Google Earth Engine. Remote Sens. 2022, 14, 1562. [Google Scholar] [CrossRef]
- Guzman-Castillo, W.; Arellanos-Carrion, E.S.; Chavez-Quintana, S.G. Determinación e Incidencia de La Disposicion a Pagar En Esquemas de Pagos Por Servicios Ambientales Hidricos: Estudio de Casos En Las Capitales de Las Provincias de Chachapoyas, Rodriguez de Mendoza y Utcubamba. Folia Amaz. 2012, 21, 141. [Google Scholar] [CrossRef]
- Corroto, F.; Gamarra, O.; Barboza, E. Evaluación Multivariante de La Calidad Del Agua En La Cuenca Del Utcubamba (Perú)—Multivariate Assessment of Water Quality in the Utcubamba Basin (Peru). Tecnol. Y Cienc. Del Agua 2018, 9, 33–57. [Google Scholar] [CrossRef]
- Curatola Fernández, G.F.; Makowski Giannoni, S.; Delgado Florián, E.; Rengifo, P.; Rascón, J.; Chichipe Vela, E.; Butrich, C.; Salas López, R.; Oliva-Cruz, M.; Scheske, C. Mapping High-Altitude Peatlands to Inform a Landscape Conservation Strategy in the Andes of Northern Peru. Environ. Conserv. 2023, 50, 212–219. [Google Scholar] [CrossRef]
- Anore, H.W.; Lohani, T.K.; Ayalew, A.T. Identification of Potential Hydropower Generation Sites Using Geospatial Techniques in the Megecha Watershed of Ethiopia. Heliyon 2025, 11, e42063. [Google Scholar] [CrossRef]
- Nazari-Sharabian, M.; Taheriyoun, M.; Karakouzian, M. Sensitivity Analysis of the DEM Resolution and Effective Parameters of Runoff Yield in the SWAT Model: A Case Study. J. Water Supply Res. Technol. 2020, 69, 39–54. [Google Scholar] [CrossRef]
- Yu, Z. SWAT Output Viewer User Manual, Version 0.1. Available online: https://swatviewer.com/wp-content/uploads/2020/05/swatoutputviewermanual_v0.1.pdf (accessed on 4 June 2025).
- Rodríguez-Morata, C.; Díaz, H.F.; Ballesteros-Canovas, J.A.; Rohrer, M.; Stoffel, M. The Anomalous 2017 Coastal El Niño Event in Peru. Clim. Dyn. 2019, 52, 5605–5622. [Google Scholar] [CrossRef]
- Newell, F.L.; Ausprey, I.J.; Robinson, S.K. Spatiotemporal Climate Variability in the Andes of Northern Peru: Evaluation of Gridded Datasets to Describe Cloud Forest Microclimate and Local Rainfall. Int. J. Climatol. 2022, 42, 5892–5915. [Google Scholar] [CrossRef]
- Santisteban, J.A.Z.; López, R.S.; Rojas-Briceño, N.B.; Fernández, D.G.; Medina Medina, A.J.; Tuesta Trauco, K.M.; Rivera Fernandez, A.S.; Crisóstomo, J.L.; Oliva-Cruz, M.; Silva-López, J.O. Optimizing Landfill Site Selection Using Fuzzy-AHP and GIS for Sustainable Urban Planning. Civ. Eng. J. 2024, 10, 1698–1719. [Google Scholar] [CrossRef]
- Briceño, N.B.R.; Castillo, E.B.; Torres, O.A.G.; Oliva, M.; Tafur, D.L.; Gurbillón, M.Á.B.; Corroto, F.; López, R.S.; Rascón, J. Morphometric Prioritization, Fluvial Classification, and Hydrogeomorphological Quality in High Andean Livestock Micro-Watersheds in Northern Peru. ISPRS Int. J. Geo-Inf. 2020, 9, 305. [Google Scholar] [CrossRef]
- Krishnaswamy, J.; Bonell, M.; Venkatesh, B.; Purandara, B.K.; Rakesh, K.N.; Lele, S.; Kiran, M.C.; Reddy, V.; Badiger, S.; Krishnaswamy, J.; et al. The Groundwater Recharge Response and Hydrologic Services of Tropical Humid Forest Ecosystems to Use and Reforestation: Support for the “Infiltration-Evapotranspiration Trade-off Hypothesis”. J. Hydrol. 2013, 498, 191–209. [Google Scholar] [CrossRef]
- Fries, A.; Silva, K.; Pucha-Cofrep, F.; Oñate-Valdivieso, F.; Ochoa-Cueva, P. Water Balance and Soil Moisture Deficit of Different Vegetation Units under Semiarid Conditions in the Andes of Southern Ecuador. Climate 2020, 8, 30. [Google Scholar] [CrossRef]
- François, M.; de Aguiar, T.R.; Mielke, M.S.; Rousseau, A.N.; Faria, D.; Mariano-Neto, E. Interactions Between Forest Cover and Watershed Hydrology: A Conceptual Meta-Analysis. Water 2024, 16, 3350. [Google Scholar] [CrossRef]
- Molina, A.; Govers, G.; Vanacker, V.; Poesen, J.; Zeelmaekers, E.; Cisneros, F. Runoff Generation in a Degraded Andean Ecosystem: Interaction of Vegetation Cover and Land Use. CATENA 2007, 71, 357–370. [Google Scholar] [CrossRef]
- Mendoza Chichipe, M.E.; Salas López, R.; Barboza Castillo, E. Análisis Multitemporal de La Deforestación Usando La Clasificación Basada En Objetos, Distrito de Leymebamba (Perú). INDES Rev. Investig. Desarro. Sustentable 2017, 3, 67. [Google Scholar] [CrossRef][Green Version]
- Vásquez, H.V.; Huamán Puscán, M.M.; Bobadilla, L.G.; Zagaceta, H.; Valqui, L.; Maicelo, J.L.; Silva-López, J.O. Evaluation of Pasture Degradation through Vegetation Indices of the Main Livestock Micro-Watersheds in the Amazon Region (NW Peru). Environ. Sustain. Indic. 2023, 20, 100315. [Google Scholar] [CrossRef]
Disclaimer/Publisher’s Note: The statements, opinions and data contained in all publications are solely those of the individual author(s) and contributor(s) and not of MDPI and/or the editor(s). MDPI and/or the editor(s) disclaim responsibility for any injury to people or property resulting from any ideas, methods, instructions or products referred to in the content. |
© 2025 by the authors. Licensee MDPI, Basel, Switzerland. This article is an open access article distributed under the terms and conditions of the Creative Commons Attribution (CC BY) license (https://creativecommons.org/licenses/by/4.0/).

