Article

Response of Water-Use Efficiency (WUE) in Alpine Grasslands to Hydrothermal and Radiative Factors Across Elevation Gradients

1
School of Hydrology and Water Resources, Nanjing University of Information Science and Technology, Nanjing 210044, China
2
Key Laboratory of Hydrometeorological Disaster Mechanism and Warning of Ministry of Water Resources, Nanjing University of Information Science and Technology, Nanjing 210044, China
3
Beijing Water Planning Institute, Beijing 101117, China
4
Qinghai Province Institute of Meteorological Sciences, Xining 810001, China
5
Key Laboratory of Disaster Prevention and Mitigation of Qinghai Province, Xining 810001, China
*
Author to whom correspondence should be addressed.
Land 2025, 14(6), 1173; https://doi.org/10.3390/land14061173
Submission received: 30 April 2025 / Revised: 26 May 2025 / Accepted: 27 May 2025 / Published: 29 May 2025

Abstract

:
Vegetation water-use efficiency (WUE), which represents the trade-off between carbon assimilation and water consumption, is a key indicator of ecosystem adaptation to environmental change. While previous studies have addressed the climatic controls on WUE in alpine ecosystems, the quantitative response mechanisms along elevation gradients remain insufficiently explored. This study investigated the growing season WUE patterns of alpine grasslands across elevation zones on the Qinghai–Tibetan Plateau by integrating partial correlation analysis and structural equation modeling (SEM). The findings revealed a clear triphasic pattern in WUE variation: a modest increase below 3000 m, a pronounced peak near 3700 m, and a steady decline at higher elevations. The dominant hydrothermal drivers shift with elevation. At lower altitudes, WUE was primarily influenced by the vapor pressure deficit (VPD), whereas soil temperature (ST) and VPD jointly govern WUE at mid-to-high altitudes. The SEM results indicated that the total effect of temperature on WUE increased from 0.51 at low elevations to 0.95 at high elevations, while the total effect of precipitation rose from −0.36 to −0.18. ST and VPD mediate the effects of temperature and precipitation on WUE, reflecting indirect and nonlinear regulatory pathways. Moreover, contribution rate analysis showed an elevation-dependent shift in WUE control: evapotranspiration (ET) exerted a dominant influence at low elevations (contribution rate: −82.50%), while net primary productivity (NPP) became the primary driver at high elevations (contribution rate: 54.71%). These findings demonstrate that alpine vegetation’s carbon–water coupling exhibits threshold-like behavior along altitudinal gradients, governed by differentiated hydrothermal constraints, offering new insights into ecosystem resilience under climate change.

1. Introduction

Alpine grasslands, covering 67% of the Qinghai–Tibet Plateau, are crucial to terrestrial ecosystems, influencing ecological dynamics and carbon cycling through processes like photosynthesis, respiration, and transpiration [1,2,3,4]. Net primary productivity (NPP) reflects carbon fixation by plants, minus autotrophic respiration, and serves as a key indicator of ecosystem productivity and health [5,6,7]. Water-use efficiency (WUE) is the ratio of carbon fixed by vegetation to water consumed, represented as NPP/ET, and reflects the ability of plants to fix carbon under specific water consumption conditions [8,9]. Studying the WUE of alpine grasslands not only helps us to understand the changes in vegetation carbon–water coupling in these ecosystems but also allows for an exploration of how alpine grassland ecosystems respond to climate change and water stress. This research provides a reliable basis for the management of alpine grassland ecosystems.
The impact of WUE on vegetation growth is primarily reflected in the ecological and physiological processes of vegetation. With changes in precipitation, temperature, and other climatic factors, along with the increase in the atmospheric CO2 concentration, the ecological and physiological processes of vegetation are affected, primarily including transpiration, respiration, and photosynthesis. This enhances the carbon absorption rate of vegetation, thereby influencing its carbon-fixation capacity during growth and development [10,11,12,13,14,15,16]. Warming accelerates vegetation greening, which in turn increases spring ET, resulting in a greater depletion of soil moisture and intensifying summer drought. Consequently, vegetation growth becomes constrained by drought stress and, due to water shortage, droughts can directly inhibit plant growth or even lead to plant mortality [17,18]. During the growth and development of vegetation, stomatal conductance regulates photosynthesis and transpiration. As stomatal conductance increases, both the assimilation rate of CO2 and water loss through transpiration rise simultaneously [19,20]. However, since the diffusion resistance of CO2 is only 0.64-times that of water vapor, an increase in stomatal conductance leads to relatively higher water loss, thereby reducing vegetation WUE. In addition to stomatal transpiration, vegetation also loses water through cuticular transpiration. Notably, C4 plants lose about 100 molecules of water per molecule of fixed CO2, whereas C3 plants are less efficient, losing approximately 600 molecules of water per CO2 fixed [21,22].
In alpine ecosystems, there is controversy regarding the response of WUE to environmental factors such as temperature, precipitation, and radiation. Under the context of climate change, precipitation and temperature are the primary climatic factors influencing variations in WUE. An increase in precipitation not only enhances soil moisture, which in turn promotes soil water evaporation, but also higher air humidity helps to maintain a higher stomatal conductance, making photosynthesis more efficient in vegetation [23,24]. For instance, a study by Bai et al. [25]. suggested that the WUE in grasslands of Inner Mongolia, China, increases with precipitation. However, the response of WUE to precipitation differs under varying climatic conditions. Studies have shown that under arid conditions, WUE initially increases and then decreases [26]. Temperature influences vegetation growth and physiological activities by regulating the activity of enzymes within the plants. A rise in temperature increases stomatal conductance (gs) of vegetation [27]; when the increase in photosynthetic rate (Pn) is relatively higher than the rise in gs, WUE correspondingly increases. However, when the temperature exceeds a specific threshold, transpiration becomes stronger than photosynthesis, leading to a decrease in WUE [28]. Currently, there is considerable research on the response of ecosystem carbon–water cycles to temperature variations. For example, a study by Ma Liming et al. [29] using isotopic techniques demonstrated a positive correlation between temperature and WUE. Furthermore, Sun et al. [30] revealed that from 1982 to 2008, global WUE exhibited a stronger response to temperature, particularly in high-latitude regions. Some studies focus on the response of WUE to climatic factors across different vegetation types. For example, Du et al. [2] found that from 2000 to 2018, alpine meadows and alpine grasslands in northwest China were more susceptible to temperature changes, while temperate desert grasslands were more influenced by variations in precipitation. Similarly, Yan et al. [8] found that in the Qinghai–Tibet Plateau region, alpine steppes are more sensitive to changes in WUE in response to climatic factors, whereas alpine desert steppes show lower sensitivity. However, WUE is not solely driven by a single environmental factor, such as precipitation or temperature; it is influenced by the interplay of multiple environmental factors. Consequently, exploring the effects and underlying mechanisms of these factors on WUE is essential for clarifying the carbon–water coupling in ecosystems.
Although the effects of climatic variables on WUE in alpine grasslands have been widely studied, most existing research has relied on simple linear correlations to evaluate the influence of individual factors [31,32,33]. However, WUE is inherently governed by the synergistic and often nonlinear interactions among multiple hydrothermal and radiative variables, which can lead to mutual reinforcement or attenuation. With the increasing availability of multivariate statistical tools, it has become essential to move beyond univariate analyses to quantify the combined and indirect influences of multiple climatic drivers on WUE dynamics. This need is particularly urgent in high-altitude regions such as the Qinghai–Tibet Plateau, where ecosystems are exceptionally sensitive to climate variability [34,35]. Despite progress in this area, few studies have conducted integrated, elevation-stratified evaluations of WUE response mechanisms. Addressing this gap, the present study employs partial correlation analysis and structural equation modeling (SEM) to disentangle the direct and mediated pathways through which temperature, precipitation, radiation, and other environmental factors influence WUE across elevation gradients. The findings provide a comprehensive understanding of vegetation carbon–water coupling in alpine ecosystems under accelerating climate change.
Building on this framework, the present study focuses on the alpine grasslands of the Qinghai–Tibet Plateau—an ecologically fragile and climate-sensitive region [36,37,38,39]—where the drivers of vegetation productivity and water fluxes are particularly complex and elevation-dependent. Using multi-source datasets from 2001 to 2018, we analyzed spatial and temporal variations in net primary productivity (NPP), evapotranspiration (ET), and WUE across elevation gradients during the growing season. Specifically, partial correlation analysis and SEM are employed to quantify both the direct and indirect effects of six climatic variables—precipitation, temperature, soil moisture, soil temperature, vapor pressure deficit (VPD), and photosynthetically active radiation (PAR)—on WUE. Additionally, a contribution rate decomposition approach is applied to assess how NPP and ET differentially influence WUE across elevation zones. By integrating these methods, the study aims to uncover elevation-sensitive mechanisms of ecosystem carbon–water coupling, offering new insights into how alpine vegetation responds to multi-factor climate regulation under accelerating environmental change.

2. Materials and Methods

2.1. Study Area

Qinghai Province is located in the northeastern part of the Qinghai–Tibet Plateau, and the entire province is part of the plateau region. The geographic coordinates are 89°35′ E to 103°04′ E longitude and 31°39′ N to 39°19′ N latitude. The province has a complex topography, with a general trend of higher elevations in the west and lower elevations in the east. The average elevation of the province is approximately 3000 m, with the highest point being the Bukadaban Peak in the Kunlun Mountains at 6860 m, and the lowest point located in Xiachuankou Village, Minhe, at an elevation of 1650 m. The province boasts abundant grassland resources, with natural grasslands covering approximately 4053 × 104  hm2, which accounts for 56.00% of the total land area. On the Qinghai–Tibet Plateau, C3 plants constitute the predominant vegetation type, widely distributed across alpine grasslands and high-altitude regions. These species mainly include cool-season grasses (such as those in the Poaceae family) and legumes (Fabaceae), which exhibit strong adaptability to low temperatures, high elevations, and relatively weak solar radiation. As a result, C3 plants dominate in cold and high-altitude environments. In contrast, C4 plants are primarily restricted to lower-elevation areas with relatively warmer climates and stronger solar radiation. Although their abundance and species diversity are significantly lower than those of C3 plants, representative species—such as those from the genera Setaria and Eragrostis—possess high photosynthetic efficiency and strong drought-tolerance. However, their distribution is highly sensitive to temperature and water availability [40,41,42,43], as shown in Figure 1.

2.2. Data Source

The alpine grassland data are sourced from the MOD12Q1 (land cover) dataset provided by MODIS Terra + Aqua, with a temporal resolution of 1 year and a spatial resolution of 500 m. Evapotranspiration (ET) data are derived from the MOD16A2GF dataset from MODIS, with a temporal resolution of 8 days and a spatial resolution of 500 m. All data are available from MODIS (https://ladsweb.modaps.eosdis.nasa.gov/).
NPP data are sourced from the National Earth System Science Data Center (http://www.geodata.cn), part of the National Science and Technology Infrastructure Platform. These data are derived from the GLASS GPP dataset, using the TRENDY model to compare the ratio of plant autotrophic respiration to GPP simulated by 10 dynamic vegetation models, which generates the GLASS NPP product. The temporal resolution of the data is 8 days, and the spatial resolution is 500 m.
The climate variable data used in this study are sourced from multiple platforms. precipitation and temperature data are obtained from the China Regional Meteorological Element Driving Dataset (CMFD) (http://data.tpdc.ac.cn), with a temporal resolution of 1 day and a spatial resolution of 0.1° [44]. Soil moisture data are sourced from the China Soil Moisture/Soil Water Dataset (2000–2020) (http://data.tpdc.ac.cn). This dataset includes high temporal and spatial resolution soil moisture data for the period from 2000 to 2020, with a daily temporal resolution and measurements at 10 cm intervals across 10 soil depth layers (10–100 cm). For this study, which focuses on alpine grasslands, the surface 10 cm soil moisture data were selected, with a temporal resolution of 1 day and a spatial resolution of 0.1° [45]. Soil temperature data and vapor pressure deficit (VPD) data are both sourced from the ERA5-Land reanalysis dataset (https://cds.climate.copernicus.eu). The data have a temporal resolution of 1 h and a spatial resolution of 0.1°. The VPD is calculated based on the temperature and dew point temperature. The photosynthetically active radiation (PAR) data are sourced from the Global Long-Term High-Resolution Photosynthetically Active Radiation Dataset (http://data.tpdc.ac.cn), with a temporal resolution of 1 day and a spatial resolution of 10 km [46].
In order to match the spatial resolution of the meteorological data, all datasets in this study were interpolated to a spatial resolution of 0.1°. The study period selected was from 2001 to 2018.

2.3. Methods

2.3.1. The Calculations of VPD

The vapor pressure deficit (VPD) refers to the difference between the maximum water vapor content that air can hold under a given temperature and the actual water vapor content. The VPD data used in this study were calculated using the temperature and dew point temperature [47]. The calculations are primarily based on the following formulas:
V P D = e w e a
e w = 6.112 × e 17.62 t 243.12 + t
e a = 6.112 × e 17.62 t d 243.12 + t d
In the formula, e w is the saturated vapor pressure, e a is the actual vapor pressure, t is the actual temperature, and td is the dew point temperature.

2.3.2. The Calculations of WUE

The vegetation water-use efficiency (WUE) data in this study are obtained by the ratio of net primary productivity (NPP) to evapotranspiration (ET). The calculation formula is as follows:
W U E = N P P E T
In the formula, WUE represents vegetation water-use efficiency, NPP represents net primary productivity, and ET denotes evapotranspiration.

2.3.3. Partial Correlation Analysis

Correlation analysis measures the degree of joint variation between two variables. However, during the analysis, it is found that the two correlated variables may be influenced by other variables. Partial correlation analysis, on the other hand, reveals the independent relationship between the dependent and independent variables while controlling for the effects of other variables. The value of the partial correlation coefficient ranges from −1 to 1. Vegetation growth is usually influenced by multiple water and thermal factors acting together. In this study, higher-order partial correlation analysis is used to quantify the relationship between a single climate factor and vegetation growth. The expression for calculating the correlation coefficient is as follows:
r i j , l 1 l 2 l g = r i j . l 1 l 2 l g 1 r i l g . l 1 l 2 l g 1 r j l g . l 1 l 2 l g 1 1 r i l g . l 1 l 2 l g 1 2 1 r j l g . l 1 l 2 l g 1 2
In the formula, r j . l 1 l 2 . . . l g represents the gth-order partial correlation coefficient between variables x i and x j ;   r j . l 1 l 2 . . . l g 1 represents the (g − 1)-th order partial correlation coefficient.

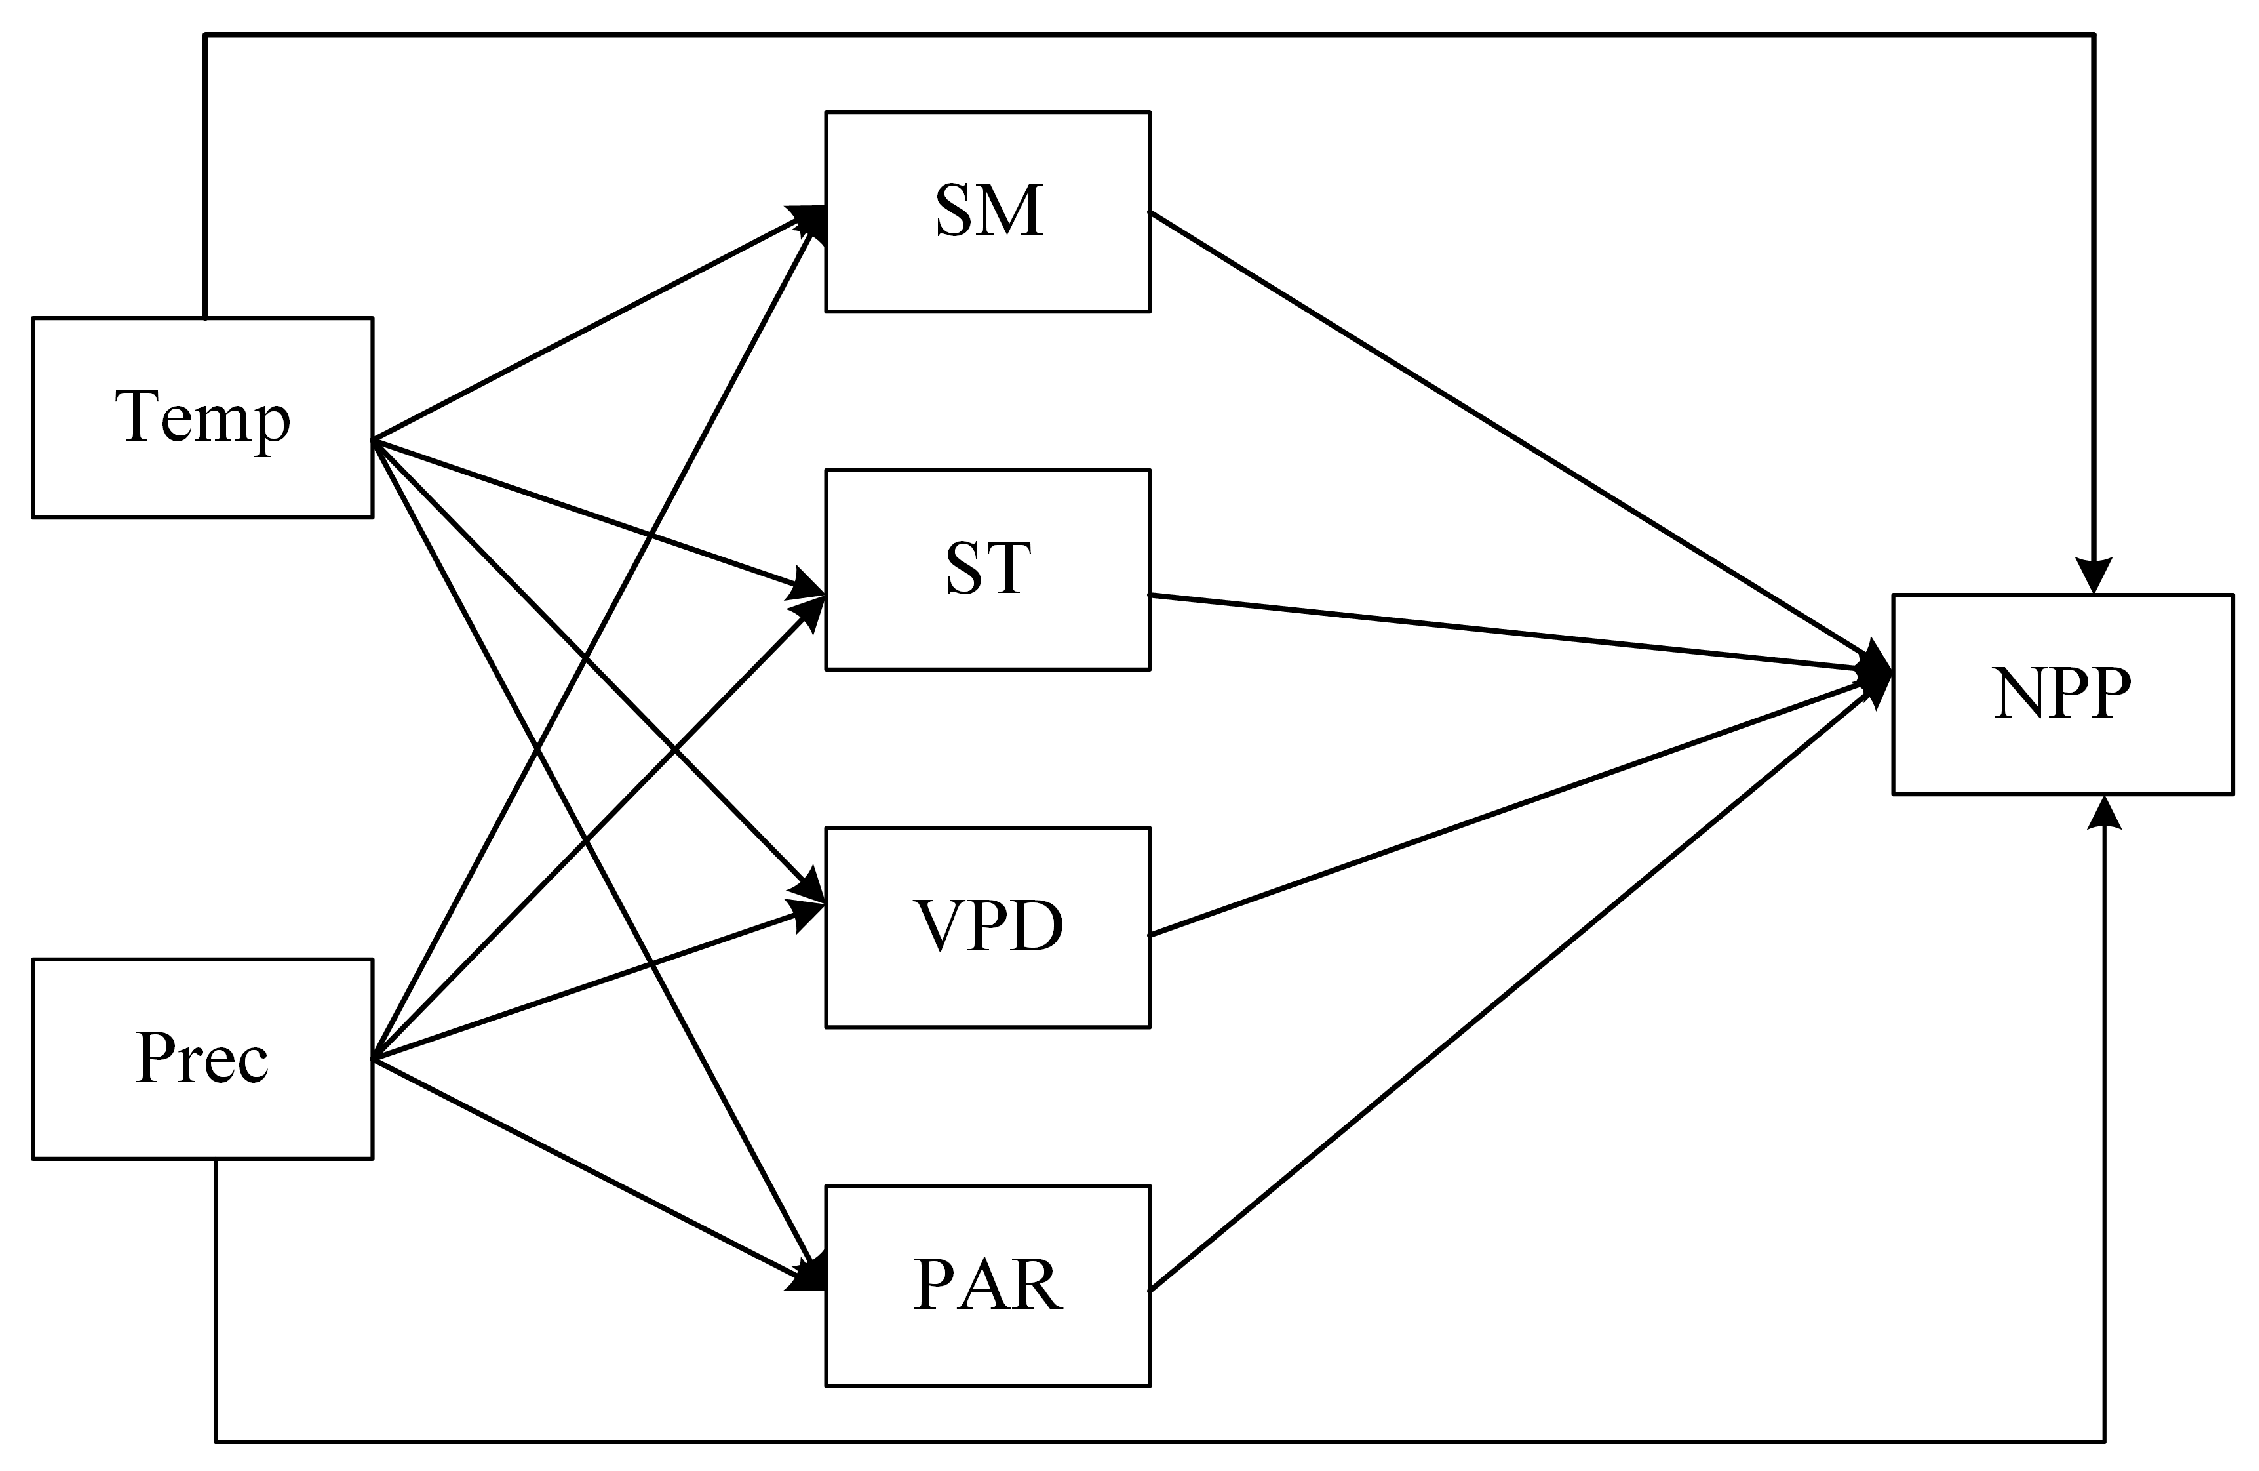
2.3.4. Structural Equation Modeling (SEM)

SEM is a linear statistical model that encompasses a set of multivariate statistical techniques, including factor analysis, multiple regression analysis, path analysis, and simultaneous equation modeling. SEM uses hypothesis testing procedures in statistics to analyze internal structures by observing external indicators of the system. This method not only quantifies the effect of a single variable by removing the influence of other variables, but also effectively quantifies the combined effect of multiple influencing factors on the target variable by considering the interactions between independent variables [48]. The main approach to constructing an SEM is as follows: first, based on prior experience, hypothesize the potential causal relationships between all variables to build a conceptual model. Then, the conceptual model is converted into a mathematical model, which is continuously adjusted and fitted. Once the fitting results are satisfactory, it is considered the final constructed SEM [49]. The criteria for an acceptable SEM are RMSEA < 0.08, CFI > 0.80, and GFI > 0.90. The structural equation model mainly consists of two parts: the measurement model and the structural model.
The measurement model, also known as the factor model, is used to analyze the relationships between observed variables (variables that can be directly observed) and latent variables (variables that cannot be directly observed and need to be inferred from other directly observed variables). The model mainly reflects the fit, reliability, and validity by measuring the relationship between latent variables and the integrated observed variables. The principle expression is as follows:
X = Λ x ξ + δ
Y = Λ y η + ε
In the equation, X represents the observed variables of ξ , and δ is the residual term of X . Λ x is the factor loading matrix (q × n) of X on ξ ; Y represents the observed indicators of η , and ε is the residual term of Y .   Λ y is the factor loading matrix (p × m) of Y on η . q is the number of observed variables in X , and p is the number of observed variables in Y.
The structural model, also known as the causal model, is used to measure the relationships between latent variables and is an important component of the SEM.
η = B η + Γ ξ + ζ
In the equation, η represents the endogenous latent variables, ξ represents the exogenous latent variables, and ζ represents the error term, which is the part of η and ξ that is not explained. B is the (m × m) coefficient matrix of the relationships between multiple η variables, and Γ is the (m × n) coefficient matrix of the relationships between multiple ξ variables. m is the number of η variables, and n is the number of ξ variables.
Temperature (Temp) and precipitation (Prec) are the fundamental hydrothermal factors for vegetation growth, directly affecting respiration and transpiration. Soil moisture (SM) and soil temperature (ST) influence vegetation growth by affecting root activity and water absorption. The vapor pressure deficit (VPD) indirectly affects vegetation growth by influencing the hydrothermal conditions. Photosynthetically active radiation (PAR) is an important energy source for vegetation growth and development. Therefore, this study selected six hydrothermal and radiative factors—Temp, Prec, SM, ST, VPD, and PAR—that are closely related to vegetation carbon–water coupling (NPP, ET, and WUE) to construct the SEM. The schematic diagram of the constructed SEM is shown below (Figure 2):

2.3.5. Contribution Rate Calculation

This study used the partial derivative contribution rate method to explore the contributions of NPP and ET to WUE. This method is primarily based on trend analysis, calculating the trends of NPP, ET, and WUE to quantify the contribution rates of NPP and ET to changes in WUE. The formulas are as follows [50]:
C i = y x i · d x i d t
C R i = C i i n C i
In the equation, C i represents the contribution of the i-th factor to WUE, where y x i denotes the linear regression coefficient between WUE and NPP or ET, and d x i d t is the Sen’s slope coefficient of NPP or ET. C R i is the ratio of C i to the sum of the absolute values of all C i , used to analyze the positive and negative contributions of NPP and ET to WUE.

3. Results

3.1. Changes in Hydrothermal and Radiation Factors

The climatic factors in the study area exhibited significant seasonal variations. Most of the annual precipitation occurred between May and October—particularly during the summer months (June, July, and August) (Figure 3a). It was also observed from the figure (Figure 3a) that summer precipitation during 2001–2018 showed a decreasing trend, mainly in June and July. During the study period, the monthly average temperature ranged approximately from −15 °C in January to 15 °C in July (Figure 3b), with no significant long-term trend observed over the years. The three climate factors—SM, ST, and VPD—also exhibited no clear interannual trends. All three increased gradually from spring (March to May), peaked during summer (June to August), and then gradually declined (Figure 3c–e). The long-term trend of PAR showed no significant changes in spring (mainly March and April), autumn, and winter. However, during the summer months (June to August), a clear increasing trend was observed, with the most pronounced increase occurring in July, showing a linear slope of 0.55 (Figure 3f).

3.2. Spatial and Temporal Characteristics

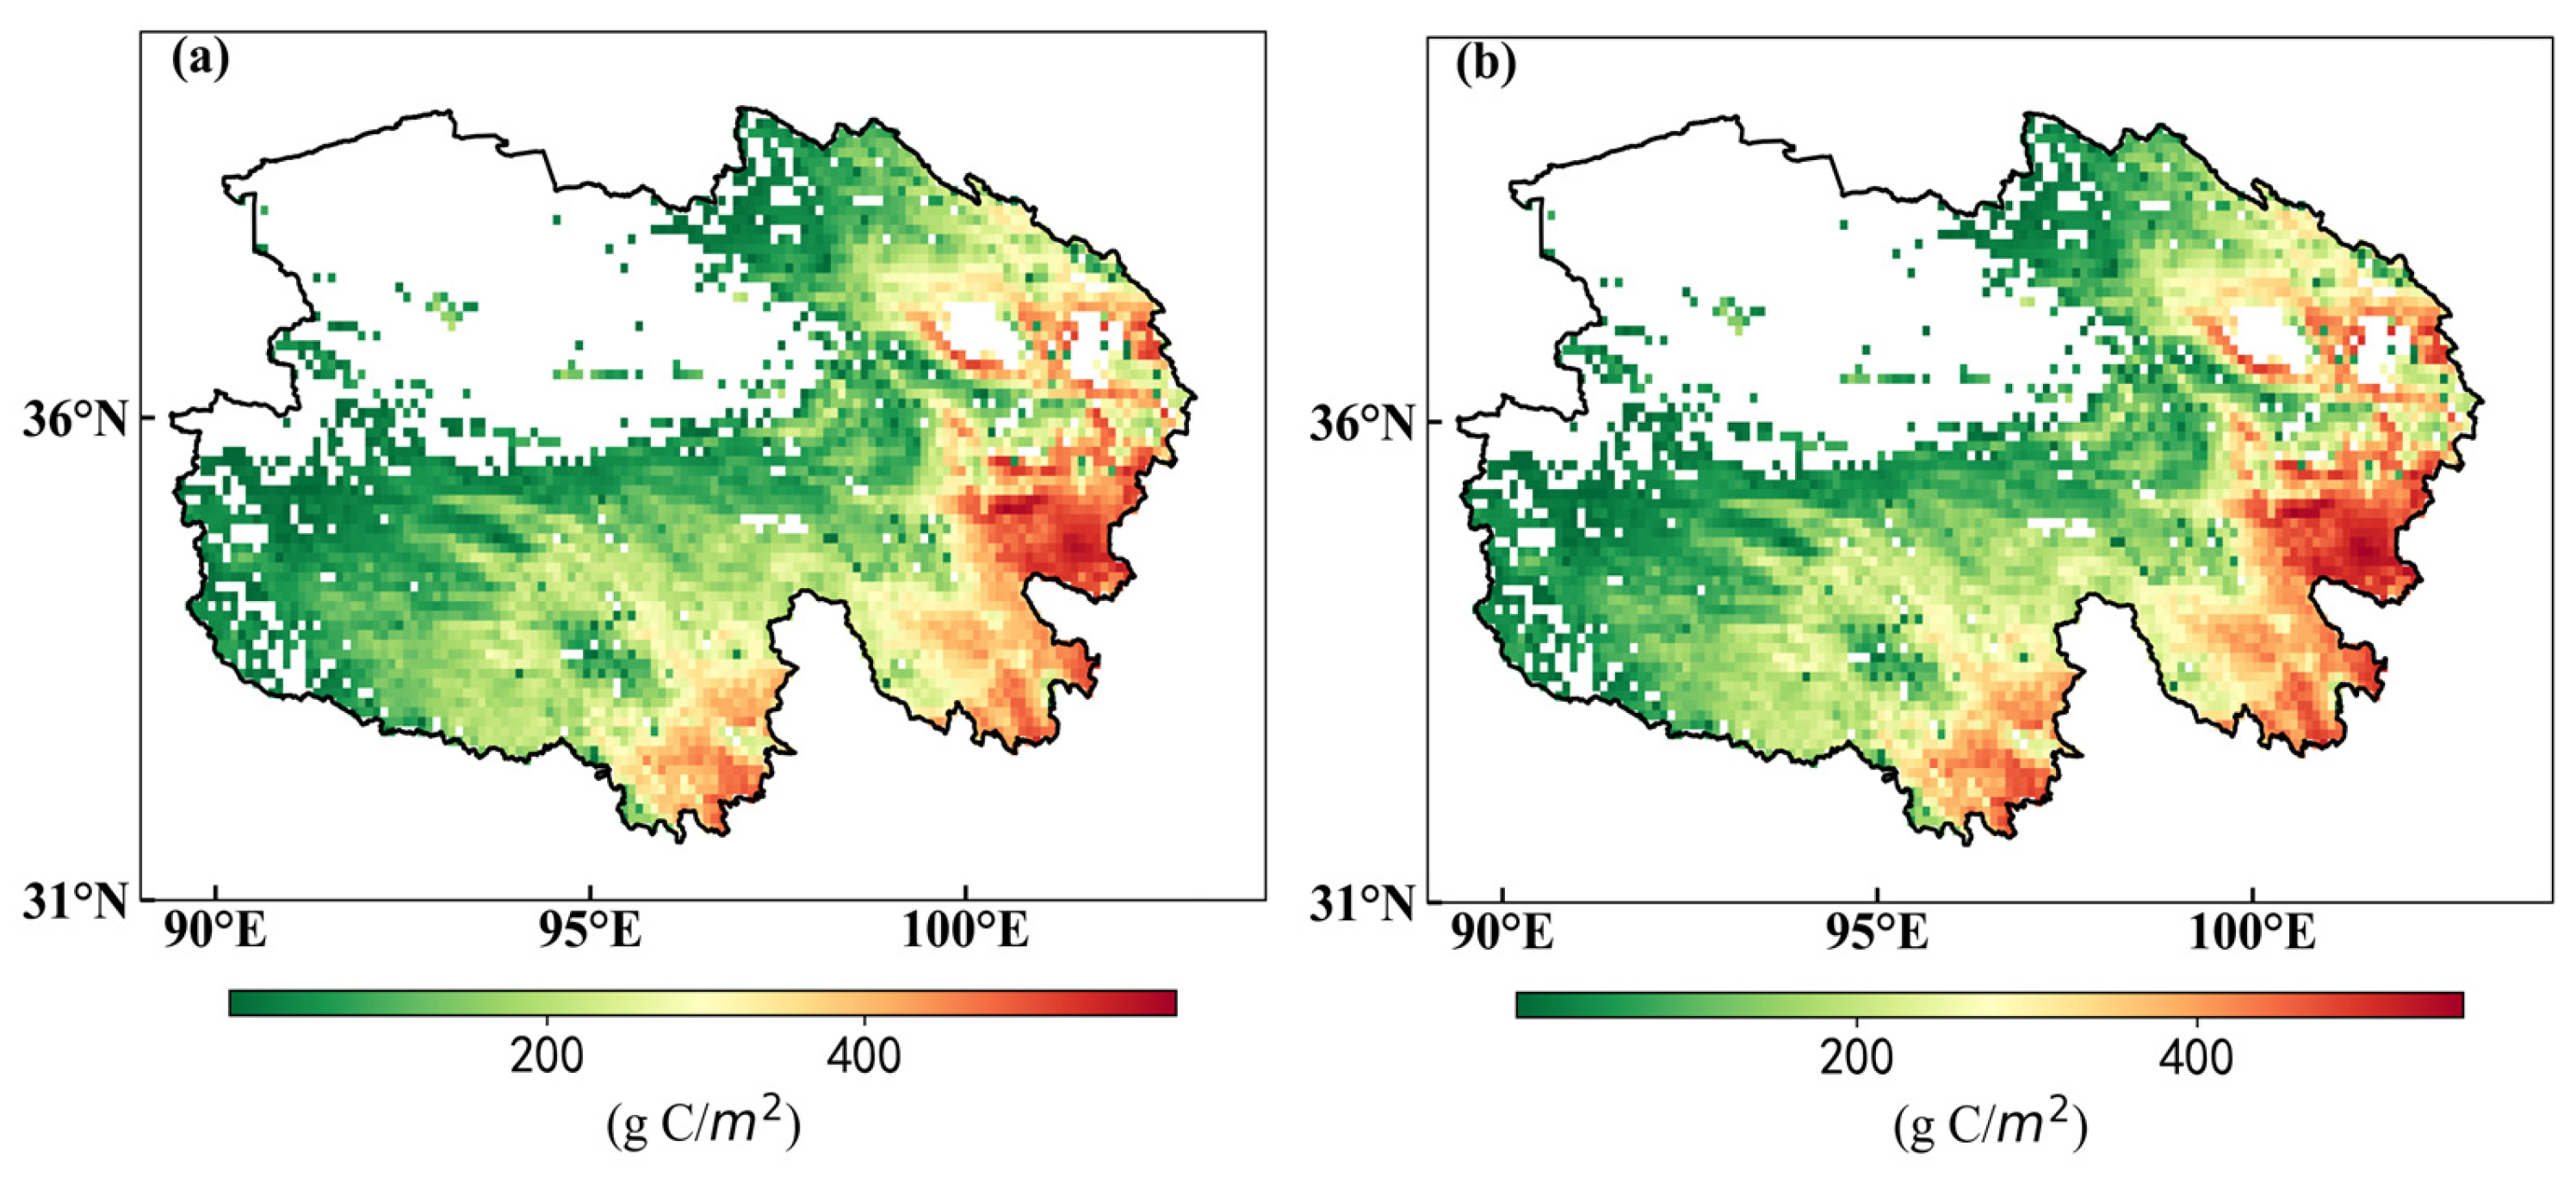
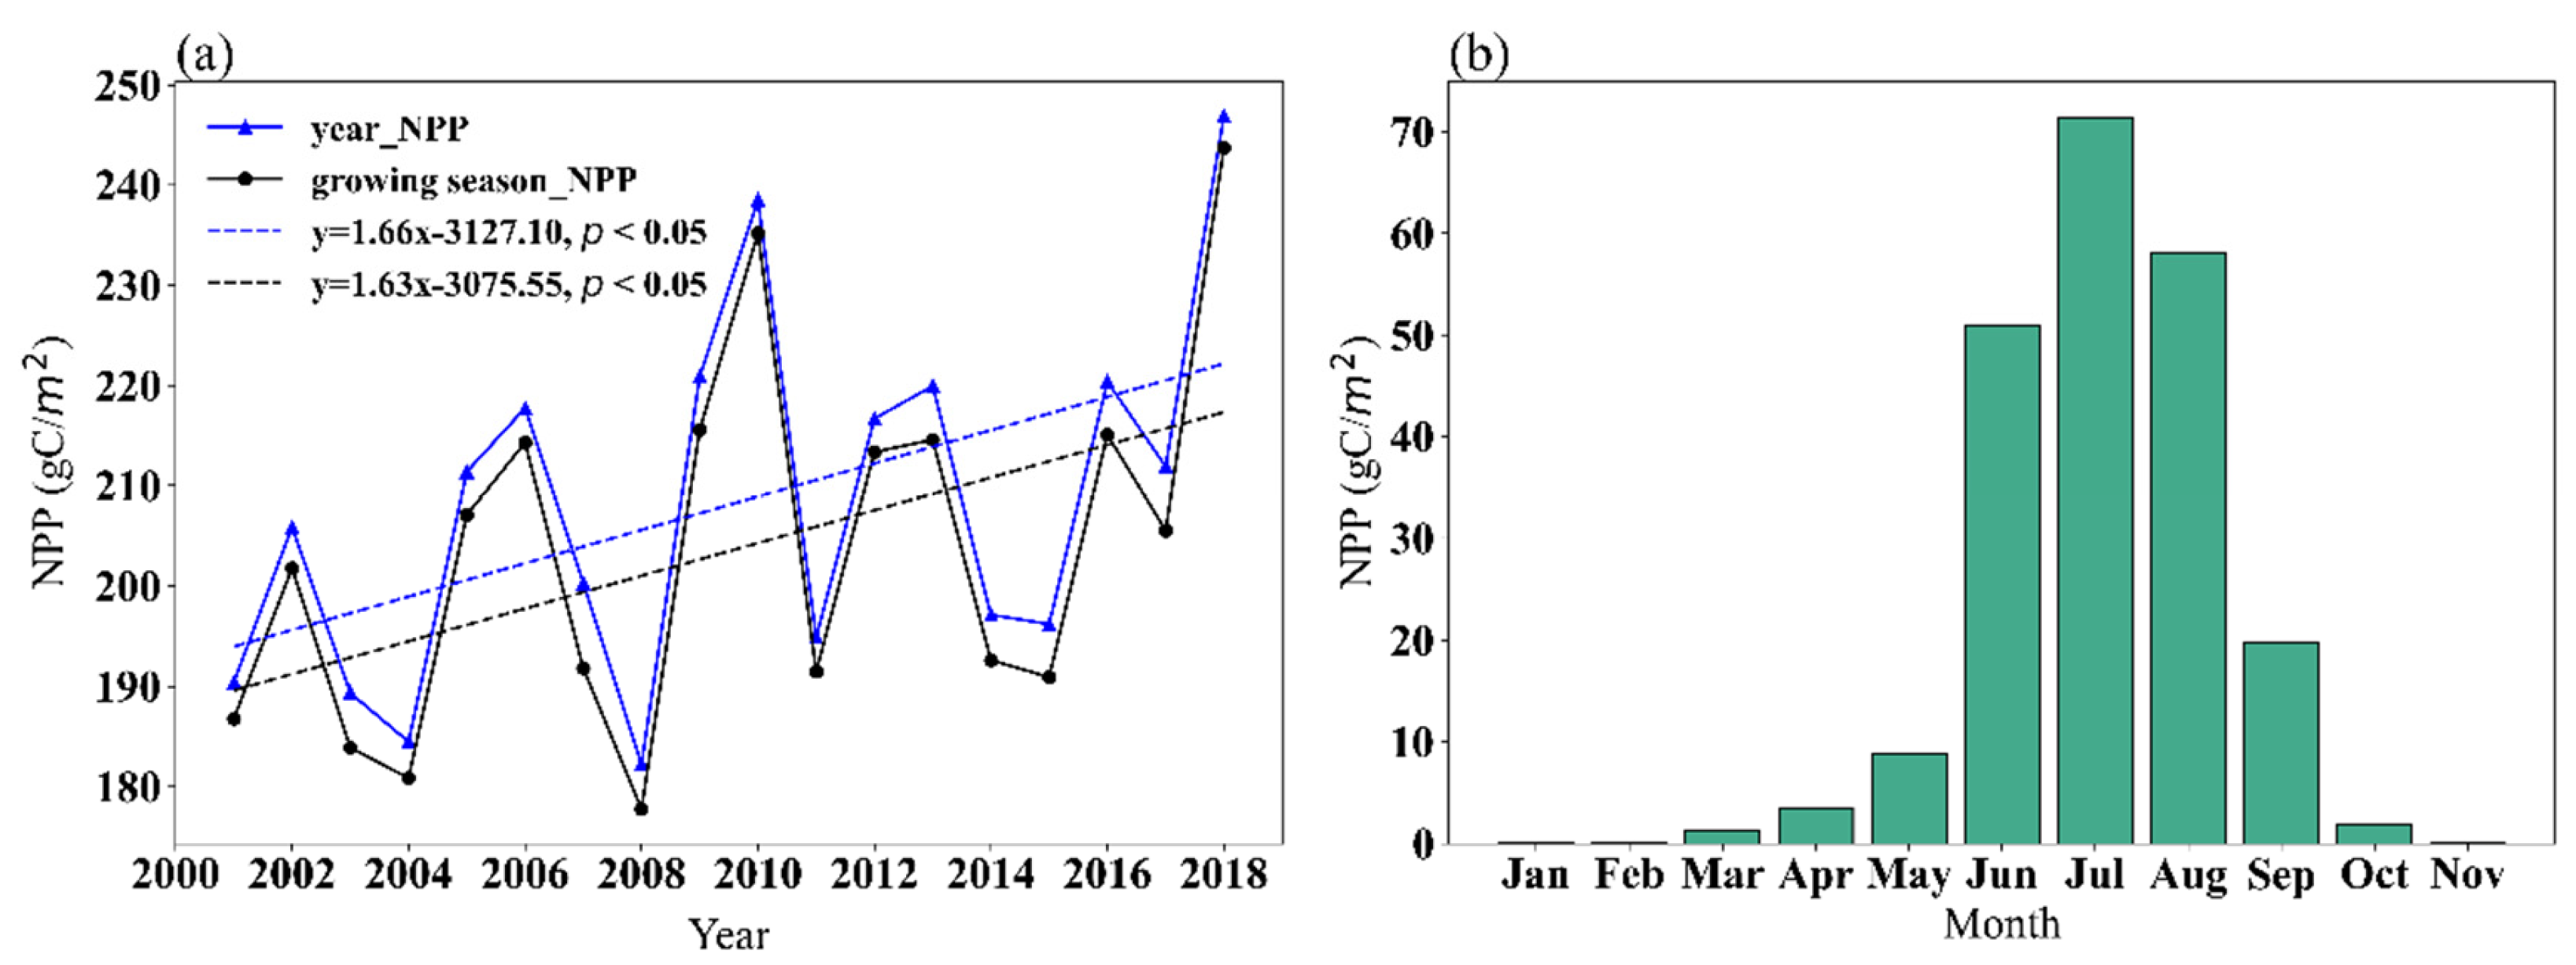
3.2.1. Spatial and Temporal Characteristics of NPP

The study analyzed the changes in NPP across the Qinghai Plateau’s alpine grasslands from 2001 to 2018 for both the entire year and the growing season (May–September). Figure 4 illustrated the spatial distribution of the mean annual and growing season NPP values. Overall, the NPP in the alpine grasslands increased gradually from the northwest to the southeast, with significant regional variation across the area. The regions with higher NPP values were primarily located in the central and eastern parts of the Yangtze River source, the Lancang River region, and the southeastern part of the Yellow River source. The areas with lower NPP values were mainly found near the Kunlun Mountain range and the western part of the Qilian Mountain range.
From the annual multi-year average distribution map of NPP in the alpine grassland, it could be seen that NPP generally ranged from 80 to 500 gC/m2. Of this, 26.06% of the area had NPP values below 80 gC/m2, and 2.9% of the area had NPP values above 500 gC/m2. The southeastern region of the entire area generally had NPP values higher than 400 gC/m2, accounting for 12.17% of the total area, while the northwestern region generally had NPP values lower than 100 gC/m2, as shown in Figure 4a. The spatial distribution of NPP during the growing season in the study area was consistent with the annual distribution. The regions with high and low NPP values during the growing season align with those observed in the annual distribution. This is because the annual NPP was obtained by accumulating NPP values every 8 days, so it could be concluded that the majority of the annual NPP was contributed by the NPP during the growing season, as shown in Figure 4b.
This study statistically analyzed the annual NPP of the alpine grasslands in Qinghai Province from 2001 to 2018 and examined the interannual variability. The results are shown in Figure 5a. From the figure, it could be observed that both the annual and growing season NPP showed an upward trend, though with some fluctuations, and the upward trend was consistent for both the whole year and the growing season. From an interannual perspective, the lowest NPP value in the alpine grasslands occurred in 2008 (182 gC/m2), while the highest value was recorded in 2018 (247 gC/m2). The NPP trend during the growing season was consistent with that of the whole year, with the growing season NPP being approximately 5 gC/m2 lower than the annual value. Figure 5b shows the multi-year average monthly NPP of alpine grasslands in Qinghai Province from 2001 to 2018. The results indicated that the NPP of alpine grasslands was higher from May to September, which was consistent with the previously determined growing season for alpine grasslands (May to September). The NPP value in May was around 10 gC/m2, gradually increasing thereafter. In July, the NPP reaches its peak value (72 gC/m2), and then began to decline starting in August, dropping to about 20 gC/m2 in September. By October, the NPP approached zero. This was because the vegetation had already withered during the period from October to April of the following year, resulting in an NPP close to zero.

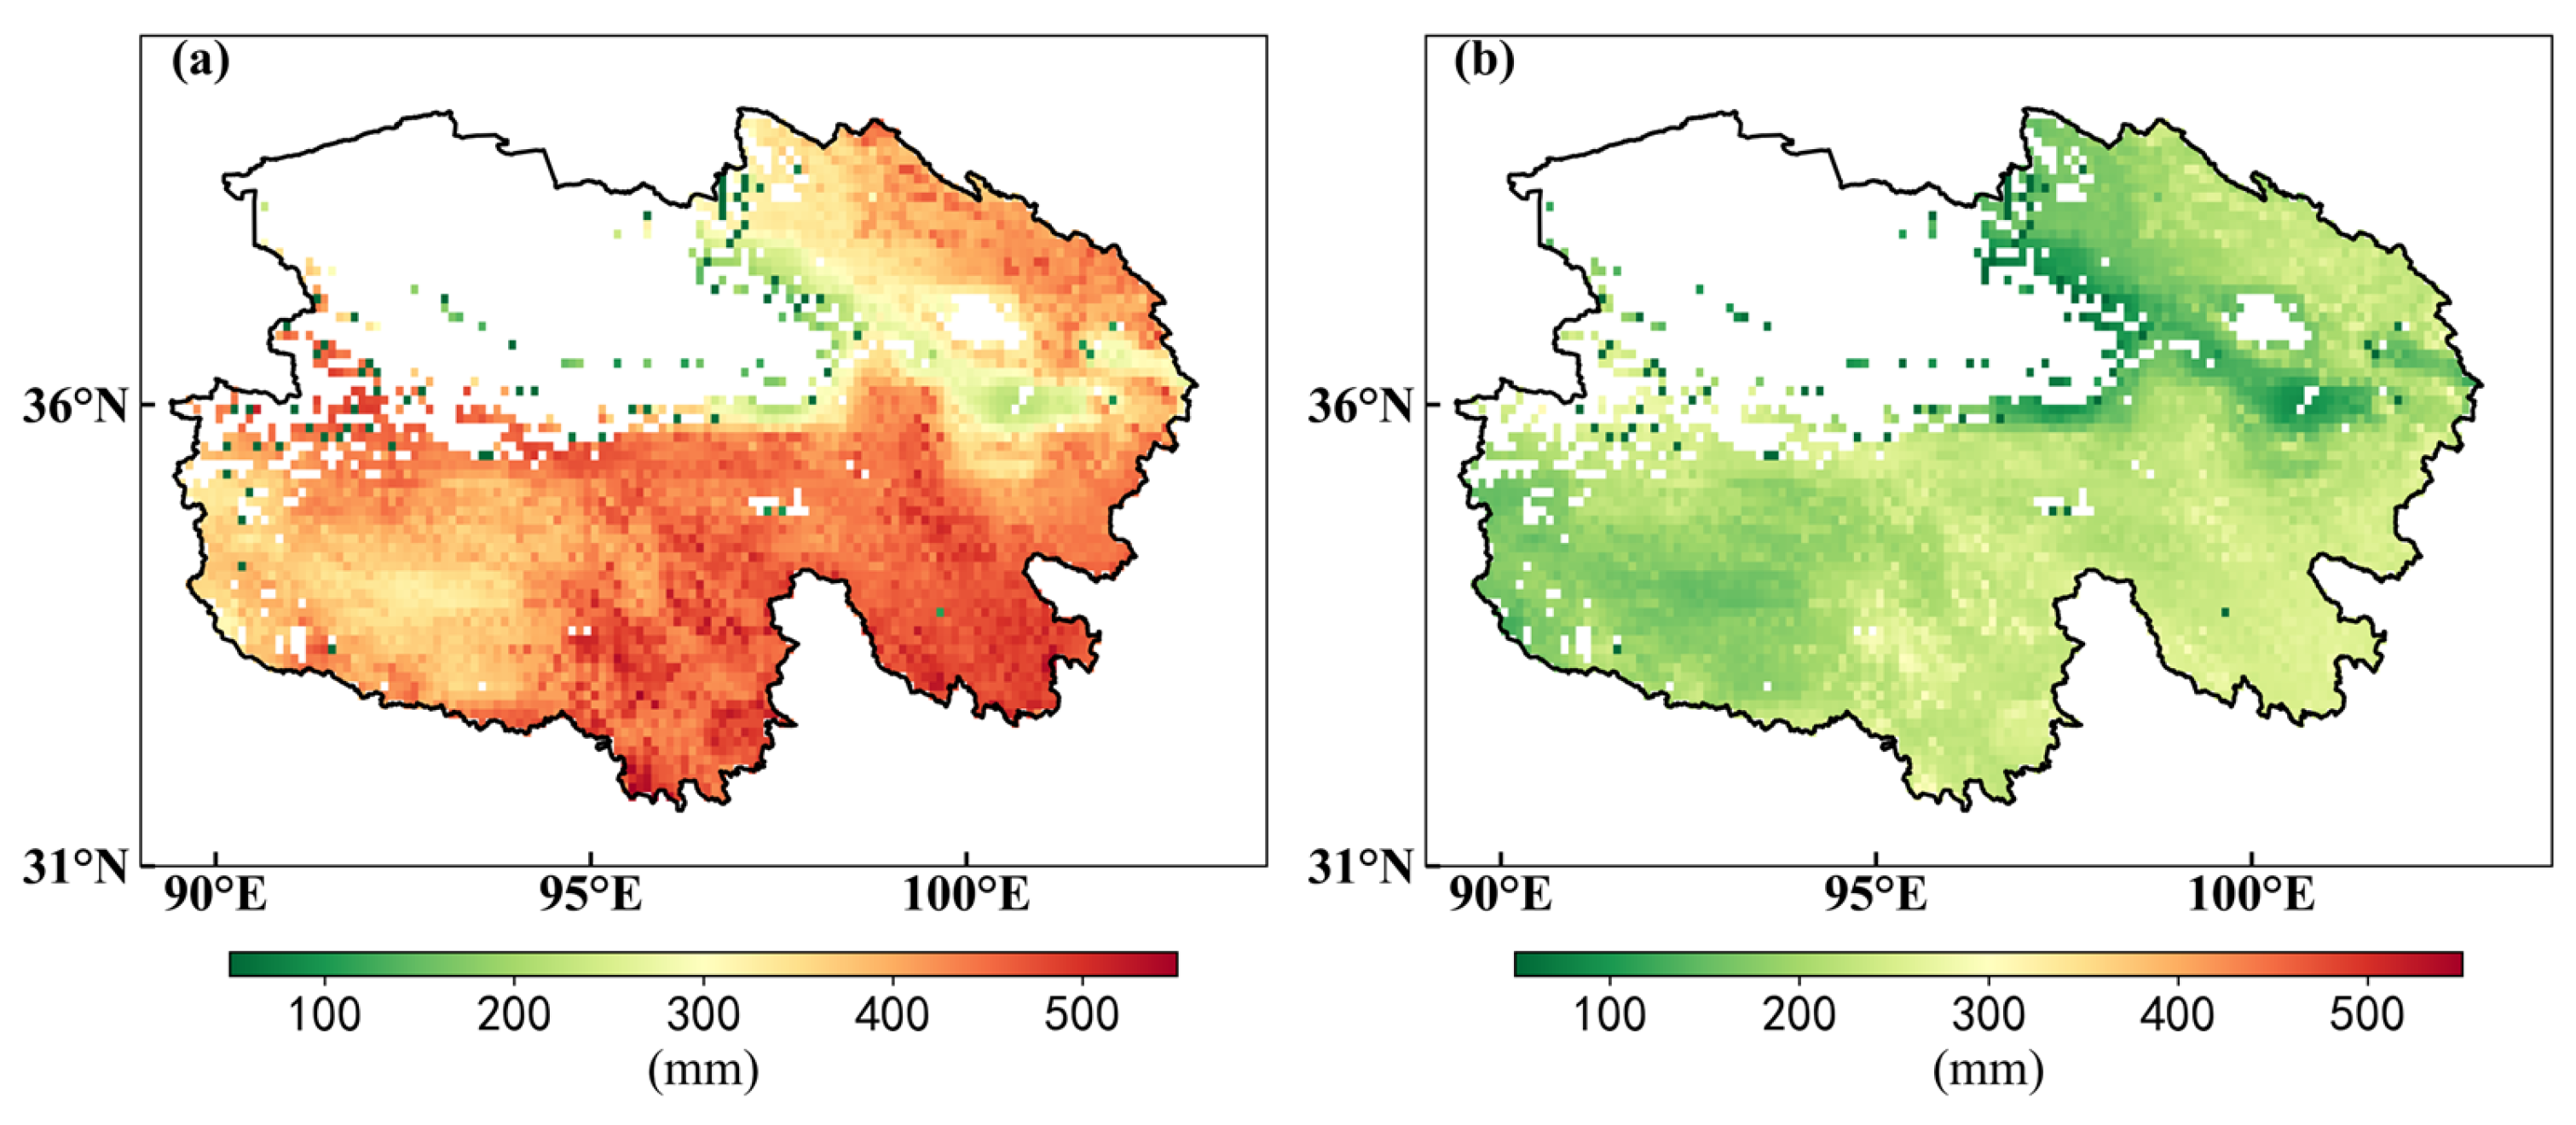
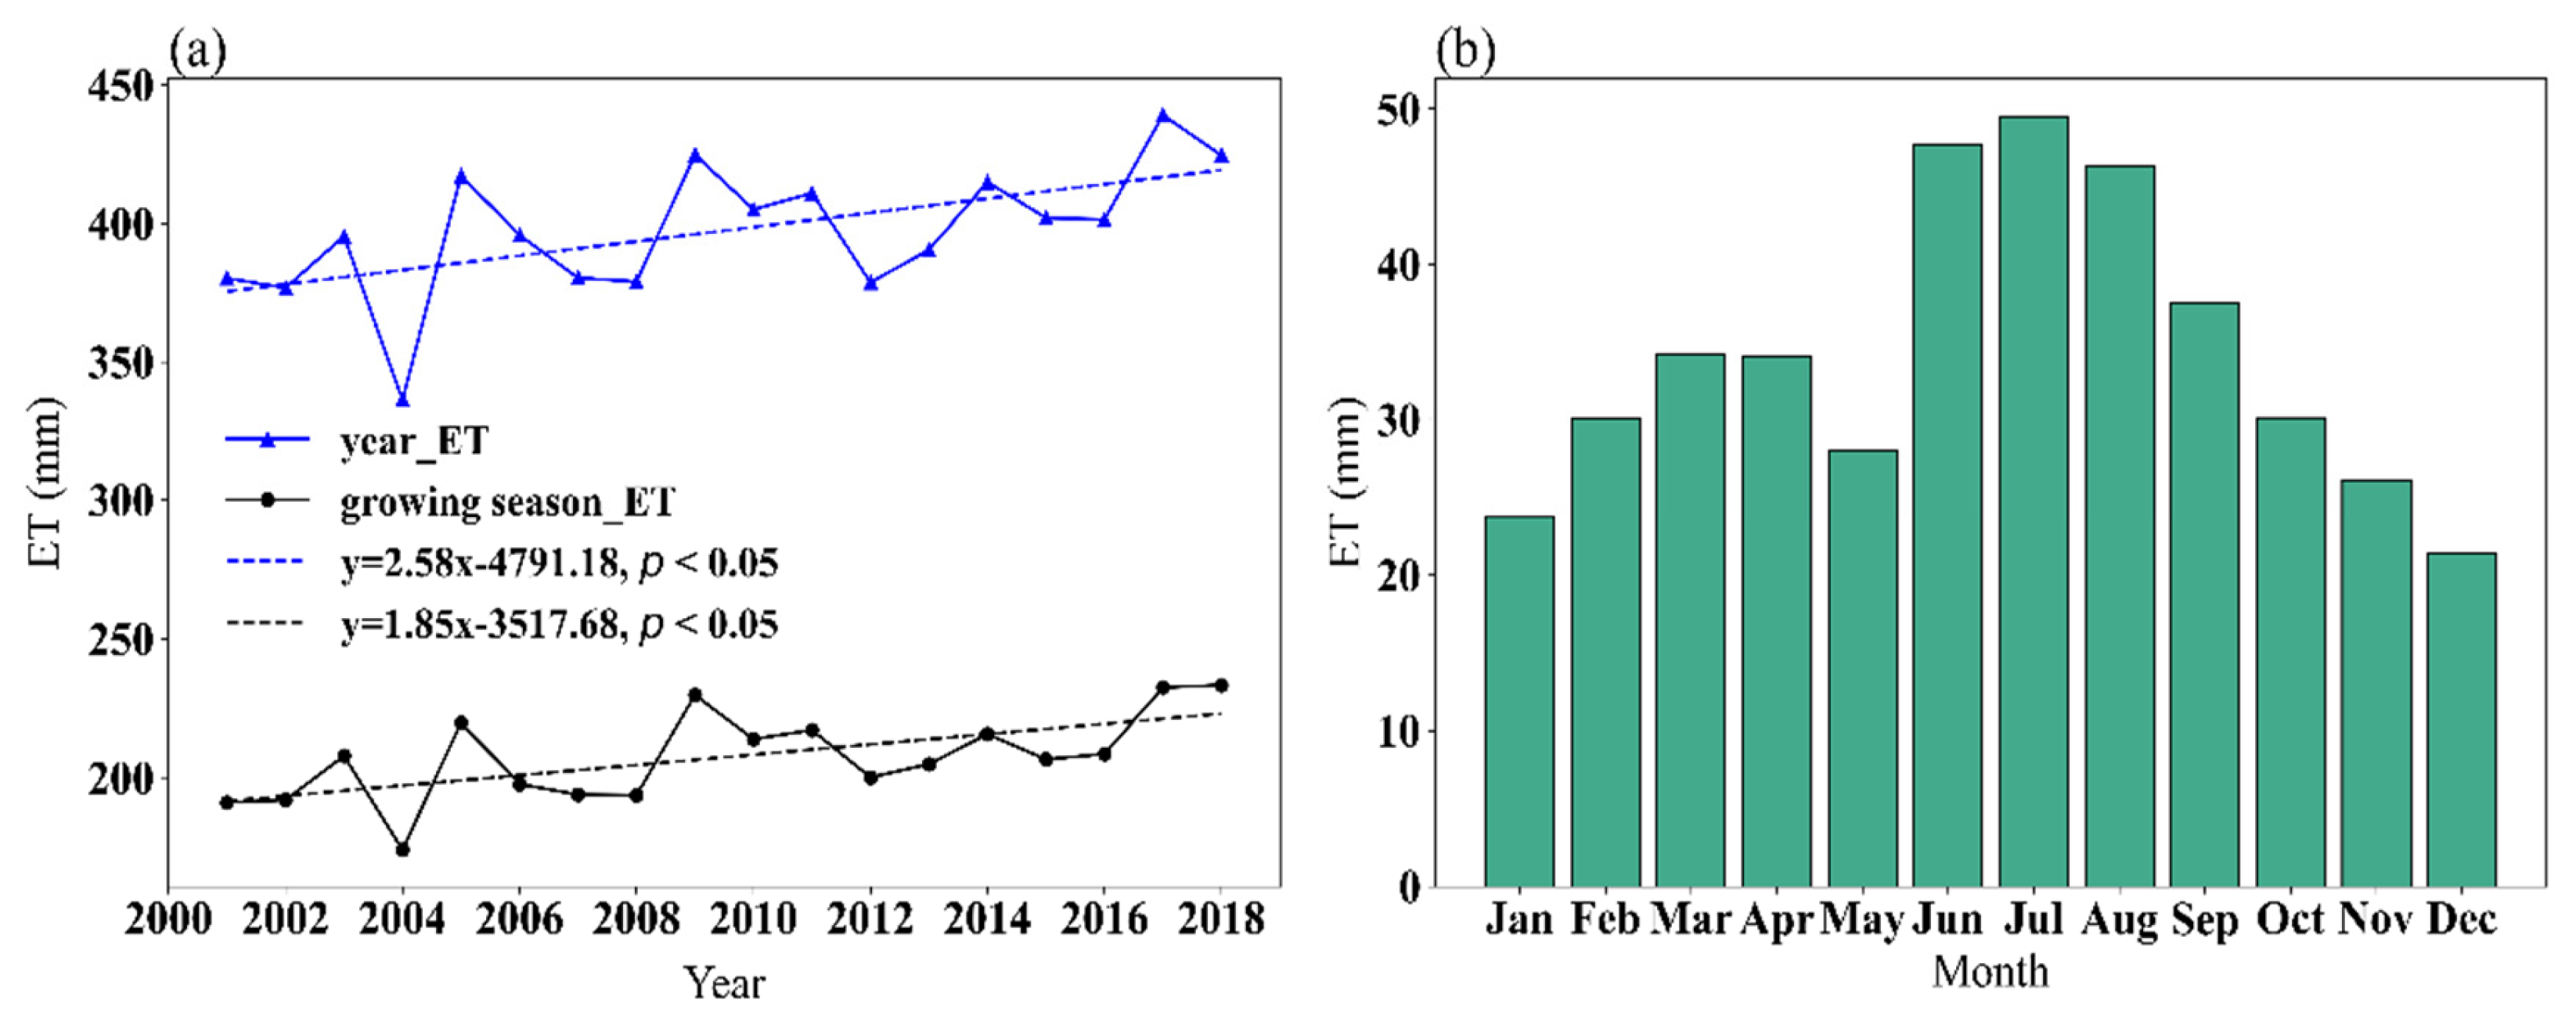
3.2.2. Spatial and Temporal Characteristics of ET

This study statistically analyzed the annual and growing season (from May to September) multi-year average evapotranspiration (ET) changes in the alpine grasslands of Qinghai Province from 2001 to 2018. Figure 6 showed the multi-year average ET spatial distribution map for the alpine grasslands of Qinghai Province. The entire study area showed certain spatial variation in ET, with high ET values concentrated around the Yangtze River source, Lancang River, and the Yellow River source. Low ET values were mainly distributed near the Kunlun Mountain range and the southern part of Qinghai Lake. The regions with higher evapotranspiration (ET) were located in the Sanjiangyuan area, where the surrounding soil moisture content was high, leading to higher evapotranspiration.
From the spatial distribution maps of the annual and growing season average evapotranspiration (ET), it could be observed that the annual ET values range from 250 to 550 mm, accounting for more than 90% of the area, with 68.4% of the region having ET values between 300 and 450 mm. The eastern region of Qinghai Lake had relatively low annual average ET, ranging from 200 to 300 mm, as shown in Figure 6a. The spatial distribution of ET during the growing season was generally consistent with that of the entire year. The higher ET values were found near the sources of the Yangtze, Lancang, and Yellow Rivers, with ET ranging from 250 to 350 mm, while the southern part of Qinghai Lake showed relatively low ET, ranging from 100 to 200 mm.
This study analyzed the annual ET in the Qinghai Plateau alpine grasslands from 2001 to 2018 and examined the interannual variation trends, as shown in Figure 7a. From the figure, it can be observed that both the annual and growing season ET showed an increasing trend, albeit with fluctuations, and the trends were consistent for both the entire year and the growing season. The interannual mean ET values ranged from 336.8 mm to 439.2 mm, with the highest value occurring in 2017 and the lowest in 2004. The mean annual ET during the growing season was approximately 150 mm lower than the overall annual value, indicating that soil evaporation occurs to a certain extent in the other months of the year in the alpine grassland areas. Figure 7b showed the multi-year average monthly ET for the Qinghai alpine grassland from 2001 to 2018. As shown in the figure, there was a certain amount of evapotranspiration in the alpine grassland every month. In November, December, and January, the evapotranspiration was around 20 mm. Starting from April and May, ET began to increase, peaking in July at 48 mm. From August to October, as the temperature began to decrease and vegetation entered the senescence period, evapotranspiration gradually declined.

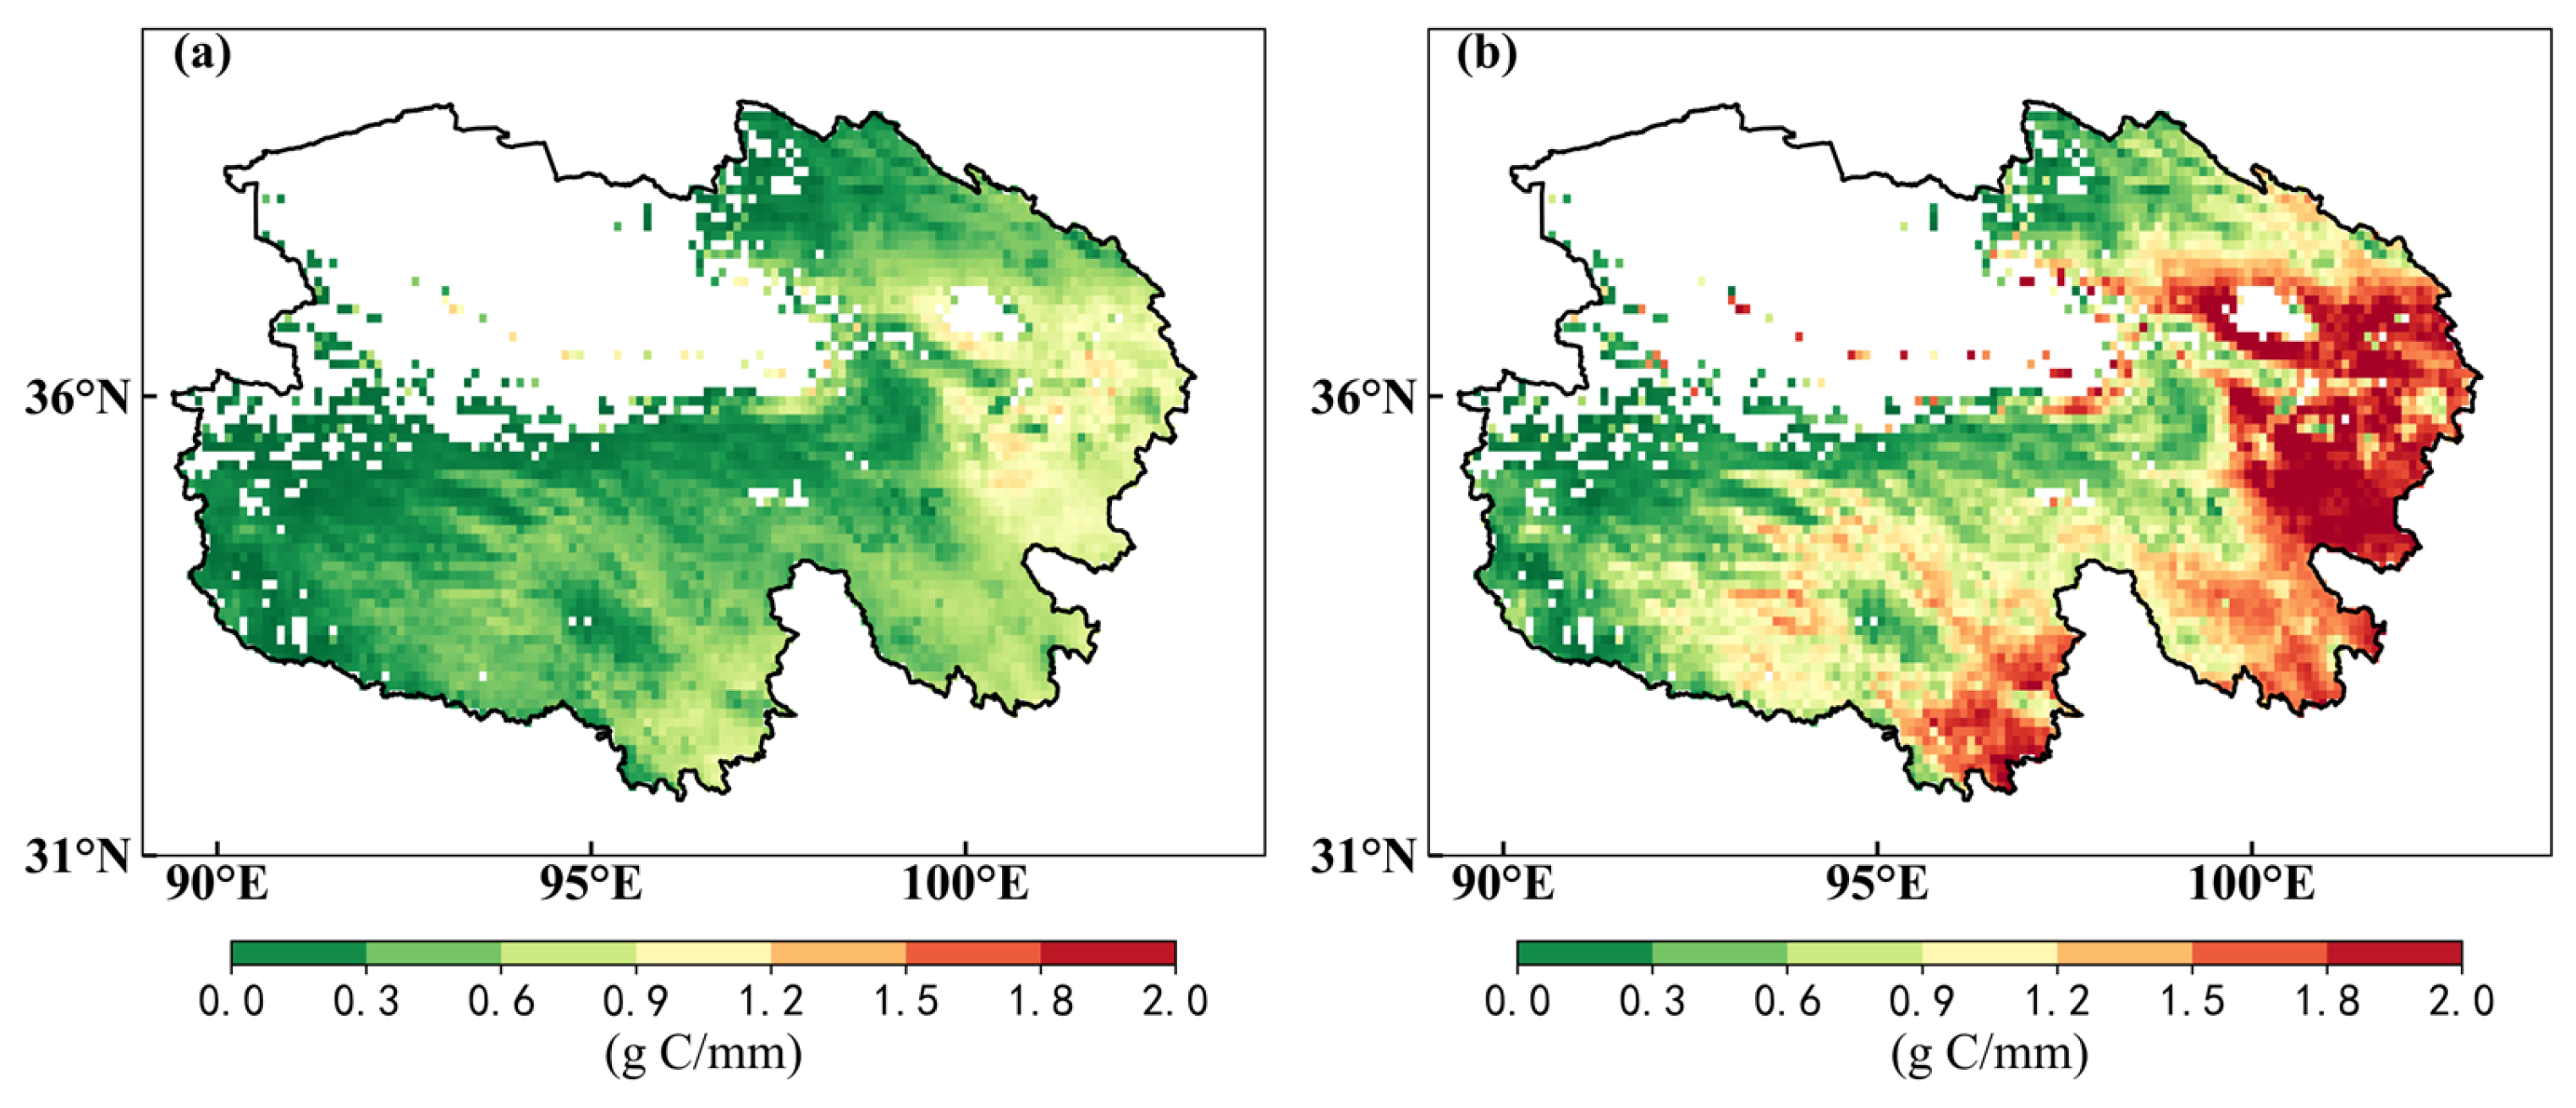
3.2.3. Spatial and Temporal Characteristics of WUE

This study analyzed the interannual variation in vegetation water-use efficiency (WUE) in the alpine grassland of Qinghai Province from 2001 to 2018, including the changes in annual and growing season average values. The WUE across the study area shows significant spatial variation. Higher WUE values were distributed around lower elevation areas near Qinghai Lake, the source of the Lancang River, and the source of the Yellow River. Lower WUE values were mainly found around the Qaidam Basin and near the Tanggula Mountains. The WUE of the alpine grassland generally increased from northwest to southeast, with the WUE in the Sanjiangyuan region being significantly higher than in the sparsely vegetated areas of the northwest.
In the annual mean WUE spatial distribution map, the WUE of the alpine grassland mainly ranged from 0 to 1.5 gC/mm, with areas where the WUE exceeded 0.5 gC/mm accounting for 34.56%, as shown in Figure 8a. The spatial distribution of WUE during the growing season was basically consistent with that of the entire year. The areas where the WUE exceeded 0.5 gC/mm during the growing season accounted for 68.12%, and the areas where the WUE exceeded 1.0 gC/mm accounted for 37.9%. This indicated that the mean WUE during the growing season in the alpine grassland was generally higher than 0.5 gC/mm. In areas with lower elevation around Qinghai Lake, the WUE during the growing season even reached 1.5 gC/mm, as shown in Figure 8b.
This study statistically analyzed the annual WUE of the Qinghai Plateau alpine grassland from 2001 to 2018 and examined the interannual variation trend, as shown in Figure 9a. From a long-term perspective, the WUE trend from 2001 to 2018 was not significant, but there were noticeable fluctuations between years. The annual WUE fluctuated between 0.82 and 1.07 gC/mm, with the highest value in 2006 and the lowest in 2013. The growing season WUE fluctuated between 0.94 and 1.17 gC/mm, and the fluctuation range was similar to that of the annual WUE. Considering the interannual variations in NPP and ET, it was evident that the lower WUE in 2003 was primarily driven by the higher ET in that year. Figure 9b illustrates the multi-year average monthly WUE from 2001 to 2018 for the alpine grasslands of Qinghai Province. An analysis of the intra-annual variation indicates that WUE values were consistently below 0.5 gC/mm during January to April and October to November. In contrast, from May to September, WUE exceeded 0.5 gC/mm, with a gradual increase from May to July, reaching its peak in July at 1.46 gC/mm, before gradually decreasing from August to September. This was likely due to the characteristics of the alpine region, where from October onward, low temperatures and reduced precipitation lead to soil freezing. Vegetation enters a dormant state and becomes desiccated, preventing photosynthesis and transpiration. As a result, WUE approaches zero.

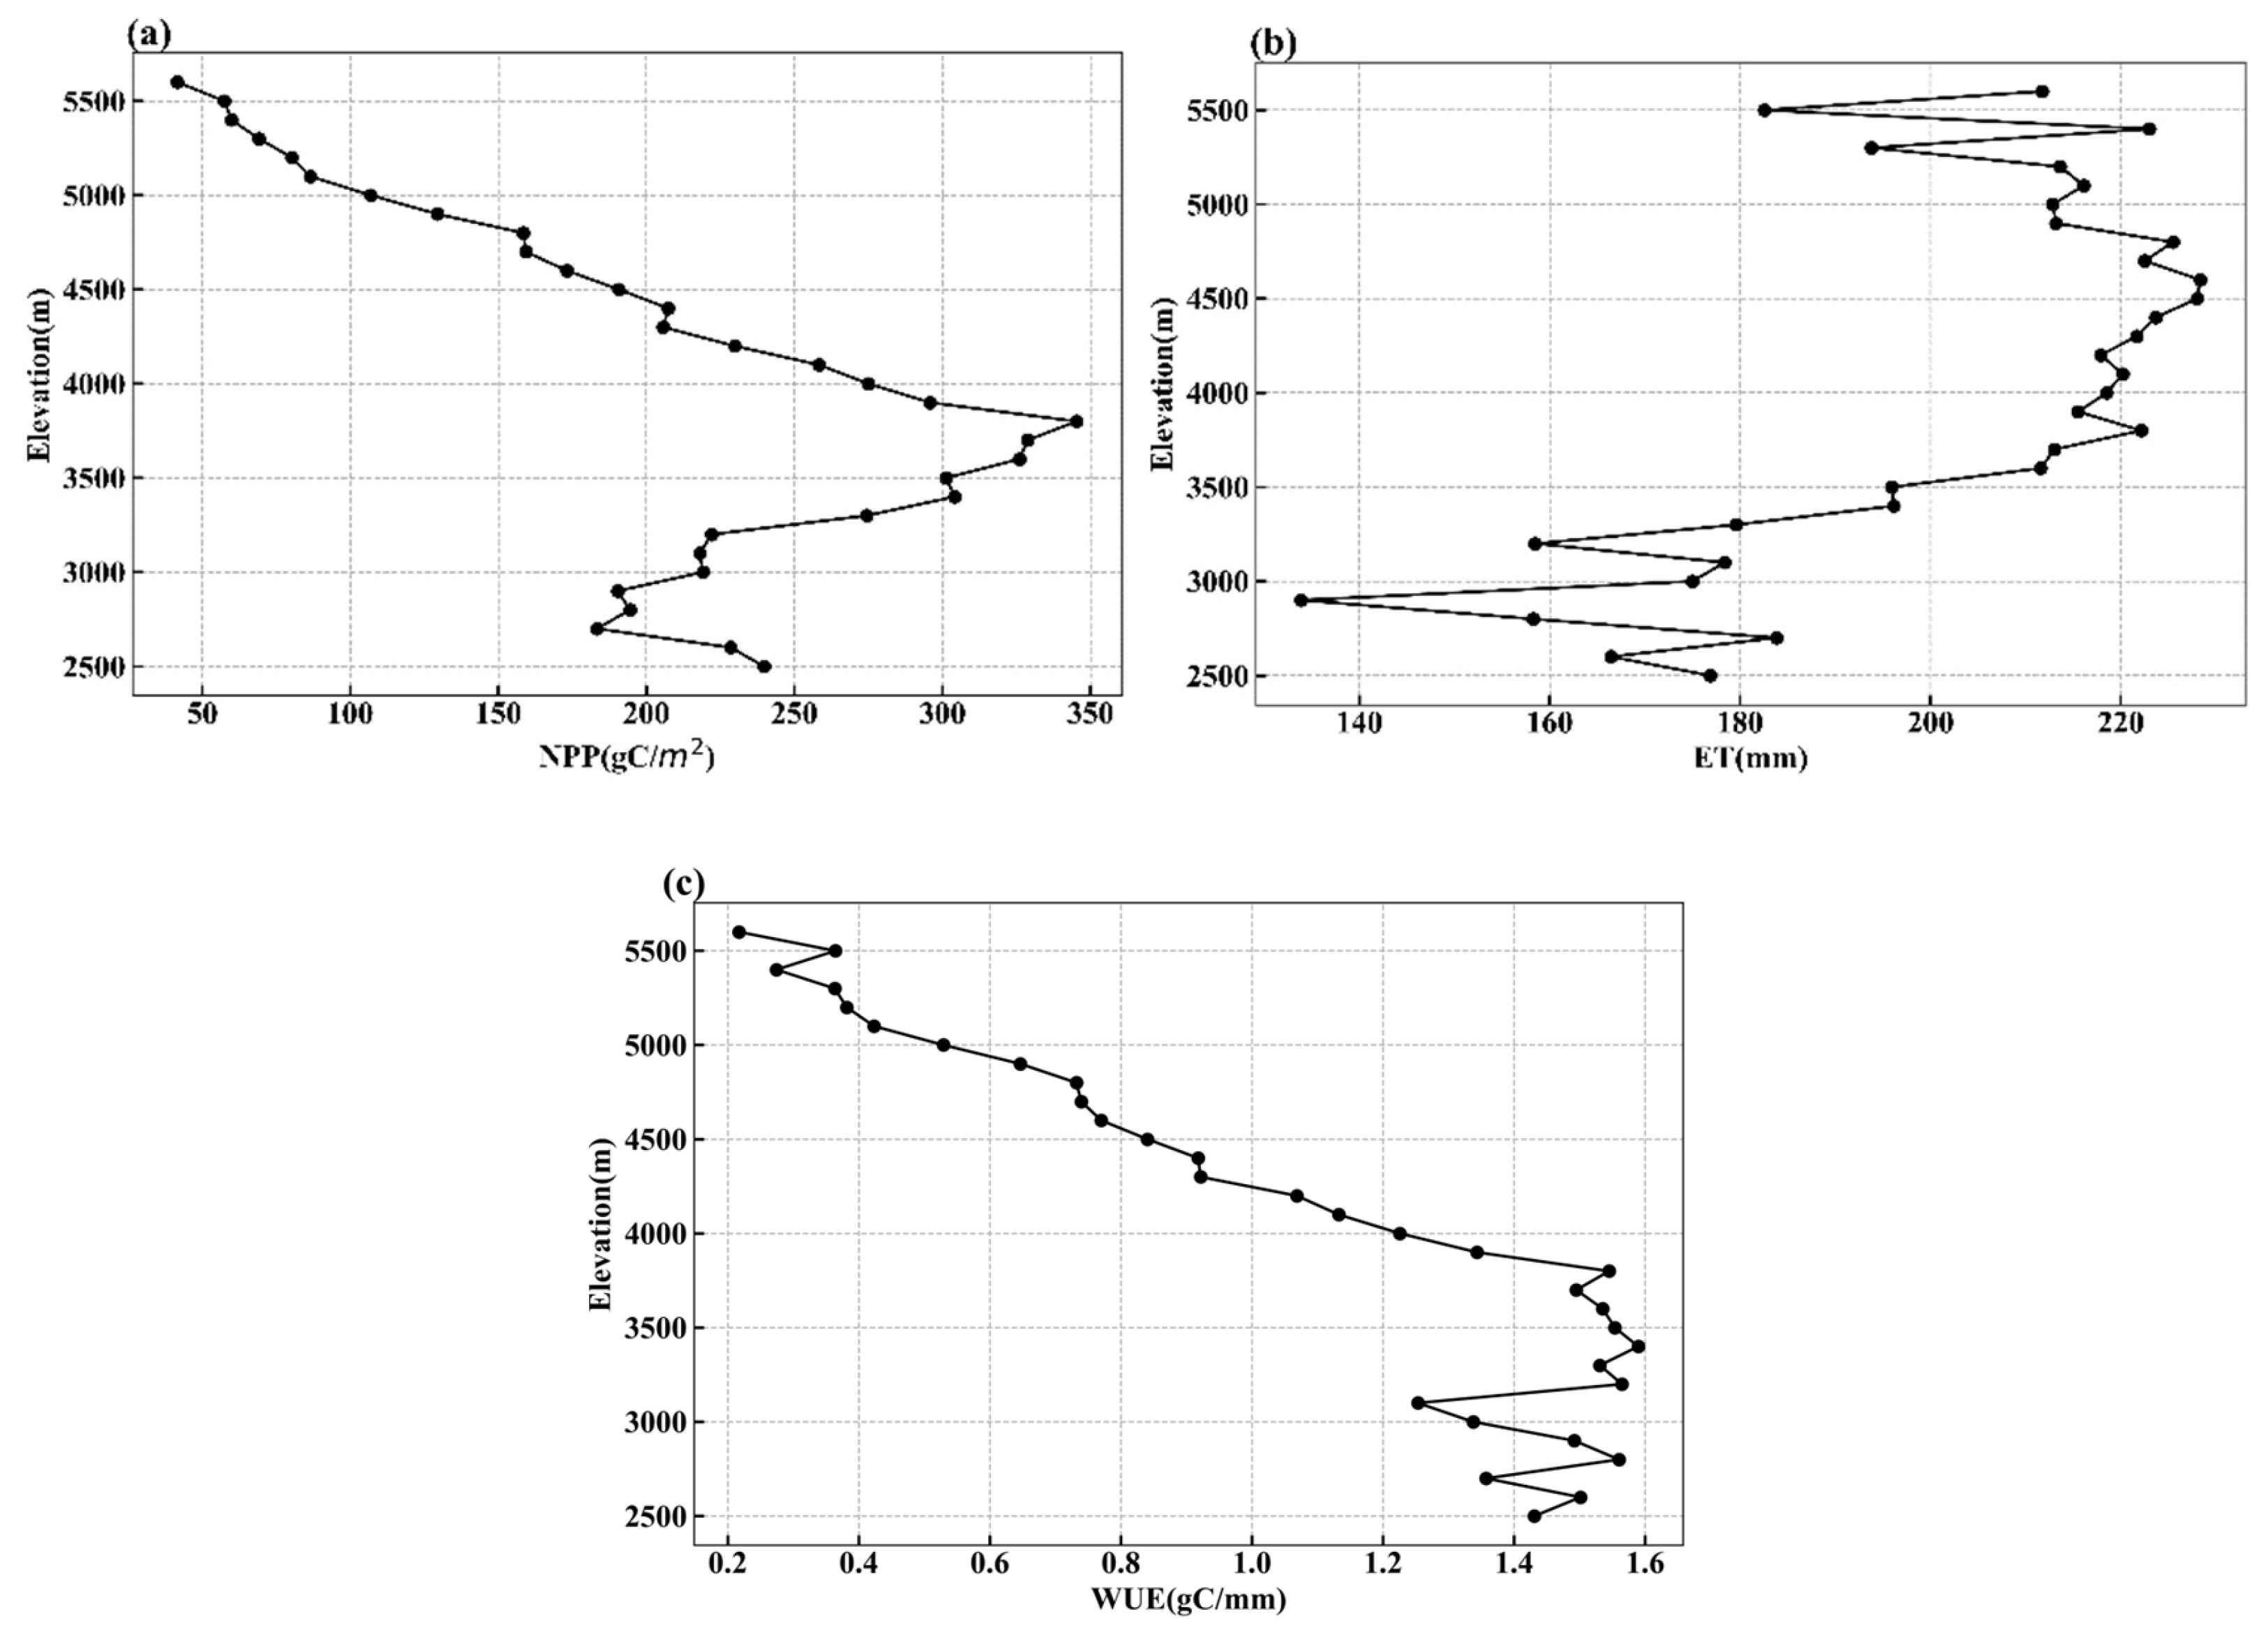
3.3. Variation Characteristics Along Elevation Gradient

This study investigated the elevation-based patterns of NPP, ET, and WUE by stratifying data at 100 m intervals, allowing for a detailed assessment of ecological sensitivity to altitudinal shifts. WUE exhibited a trend parallel to that of NPP, suggesting that productivity predominantly governed water-use efficiency under varying elevation conditions. The results indicated that below 3000 m, NPP initially decreased slightly to around 165 gC/m2, then increased to about 200 gC/m2 with slight fluctuations. As the elevation rises, NPP gradually increases, reaching its maximum value of 348 gC/m2 at around 3700 m. However, beyond this elevation, NPP began to decrease, dropping to below 50 gC/m2, as shown in Figure 10a. The trend of ET variation with elevation was shown in Figure 10b. Below 3200 m, ET fluctuated within the range of 120–190 mm. Between 3200 and 3800 m, ET showed a clear increasing trend with elevation. From 3800 to 4800 m, the change in ET was relatively small. Above 4800 m, ET decreased with increasing elevation, although the fluctuation amplitude becomes larger. The variation in WUE with elevation was similar to that of NPP. Below 3100 m, WUE showed a small fluctuation, initially increased and then decreased with elevation. As the elevation reaches around 3700 m, the increase in WUE became gradual. Above 3700 m, WUE gradually decreased with increasing elevation, reached 0.2 gC/mm.

3.4. Response Mechanism Analysis

3.4.1. Results of Partial Correlation Analysis

The NPP, ET, and WUE showed significant variation trends at different 100 m elevation gradients, with NPP and WUE exhibiting similar trends across these gradients. To standardize the elevation gradient intervals, this study divided the elevation into three zones: <3000 m, 3000–3700 m, and >3700 m. The responses of NPP, ET, and WUE to factors such as Prec, Temp, SM, ST, VPD, and PAR were analyzed, as shown in Figure 11.
The results showed that the partial correlation relationships between various factors and NPP differed across elevation zones. Below 3000 m, only VPD had a negative partial correlation with NPP, with partial correlation coefficients ranging from −0.40 to −0.20. Prec, Temp, SM, sST, and PAR all showed positive correlations with NPP, with the correlation between Prec and NPP being weak, having a partial correlation coefficient around 0.1. Below 3000 m, the positive correlation between SM and NPP was the strongest, with partial correlation coefficients ranging from 0.30 to 0.45. The positive correlations between ST and PAR with NPP were somewhat weaker. Between 3000 m and 3700 m, the relationship between Prec and NPP became less pronounced, with partial correlation coefficients ranging from −0.10 to 0.05. The positive correlation between ST and NPP was the strongest, with a partial correlation coefficient around 0.60. The positive correlation between SM and NPP was weakened. The partial correlation between VPD and NPP changed to a positive correlation, with a correlation coefficient of approximately 0.15. The relationships between Temp and PAR with NPP showed no significant changes. As the elevation increases, when the elevation exceeds 3700 m, thermal factors primarily influence the NPP of vegetation. The partial correlation coefficient between Temp and NPP reached around 0.35, and the relationship between ST and NPP remained the strongest, with a partial correlation coefficient of about 0.50. The effects of Prec and SM on NPP became less significant. VPD showed a notable positive correlation with NPP, with a correlation coefficient around 0.20. In summary, there were indeed differences in the relationships between various factors and NPP across different elevation zones. As the elevation increases, the relationship between Temp and NPP strengthens; ST showed an initial increase followed by a decrease, and the relationship between VPD and NPP shifted from negative to positive, as shown in Figure 11a.
The partial correlation relationships between ET and various factors also differed across different elevation gradients. Prec, Temp, SM, ST, and PAR all showed a positive correlation with ET at different elevation zones, while VPD was negatively correlated with ET. Below 3000 m, the partial correlation coefficient between Prec and ET was around 0.13. Between 3000 and 3700 m, the median of the partial correlation coefficient between Prec and ET decreased. Above 3700 m, the interquartile range became smaller, and the partial correlation coefficient between Prec and ET became uniform across this elevation zone. The partial correlation between Temp and ET was positive across all elevation zones, indicating that with an increase in temperature, both soil evaporation and vegetation transpiration intensify. However, above 3700 m, the median of the box plot was lower, which may be due to the limitation of water-related factors in high-altitude areas, restricting ET. The partial correlation coefficient between SM and ET was positive across all elevation zones, indicating that an increase in SM promoted ET. Below 3000 m, the partial correlation coefficient was relatively low and more dispersed, suggesting that the influence of SM on ET in this elevation zone might be influenced by other factors. In the elevation zones below 3000 m and between 3000 m and 3700 m, the partial correlation coefficient between ST and ET increased with elevation. However, in the elevation zone above 3700 m, the median of the boxplot decreases, which might be due to the fact that at higher elevations, ET is limited by water availability. The partial correlation between VPD and ET was negative across different elevation zones, and the correlation coefficient increased with elevation. In the elevation zones between 3000 m and 3700 m, as well as above 3700 m, the median showed little change. However, in the 3000–3700 m zone, the boxplot distribution was more scattered, suggesting that the response of ET to VPD in this zone was influenced by other factors. The partial correlation between PAR and VPD increased with elevation. The higher the elevation, the more pronounced the vegetation’s response to energy, leading to enhanced photosynthesis and transpiration, as shown in Figure 11b.
The response of vegetation WUE to various factors differed across elevation zones, showing a different pattern of correlation compared to the response of NPP and ET to the hydrological and thermal factors. The partial correlation between Prec and WUE was negative across different elevation zones, with no significant differences observed. The partial correlation between Temp and WUE showed significant differences across elevation zones. In the <3000 m and 3000–3700 m zones, the partial correlation coefficients between Temp and WUE were generally negative, with the median close to 0. This might be because the influence of Temp on NPP is slightly smaller than its influence on ET. However, when the elevation exceeds 3700 m, the partial correlation coefficient between Temp and WUE significantly increases. Considering the influence of Temp on both NPP and ET, this suggests that in high-elevation regions, the effect of temperature on vegetation respiration outweighs its impact on transpiration. The partial correlation between SM and WUE was positive in both the <3000 m and 3000–3700 m elevation zones, with correlation coefficients ranging from 0.1 to 0.2. At elevations greater than 3700 m, the partial correlation between SM and WUE became negative, suggesting that as SM increases, the combined effects of soil evaporation and vegetation transpiration outweigh the photosynthetic activity of vegetation, resulting in a decline in WUE. The response of WUE to ST increased with elevation, indicating that the higher the elevation, the more pronounced the effect of soil temperature on the growth and development of vegetation. The effect of VPD on WUE strengthened with increasing elevation, which could reflect the effect of VPD on NPP and ET in different elevation zones. There was a difference in the response of WUE to PAR under different elevation zones, and the bias correlation coefficient did not change significantly under the zones of elevation of less than 3000 m and 3000–3700 m, and when the elevation was higher than 3700 m, the effect of PAR on WUE was weakened, and this was related to the strengthening of the effect of PAR on ET under this elevation zone, as shown in Figure 11c.

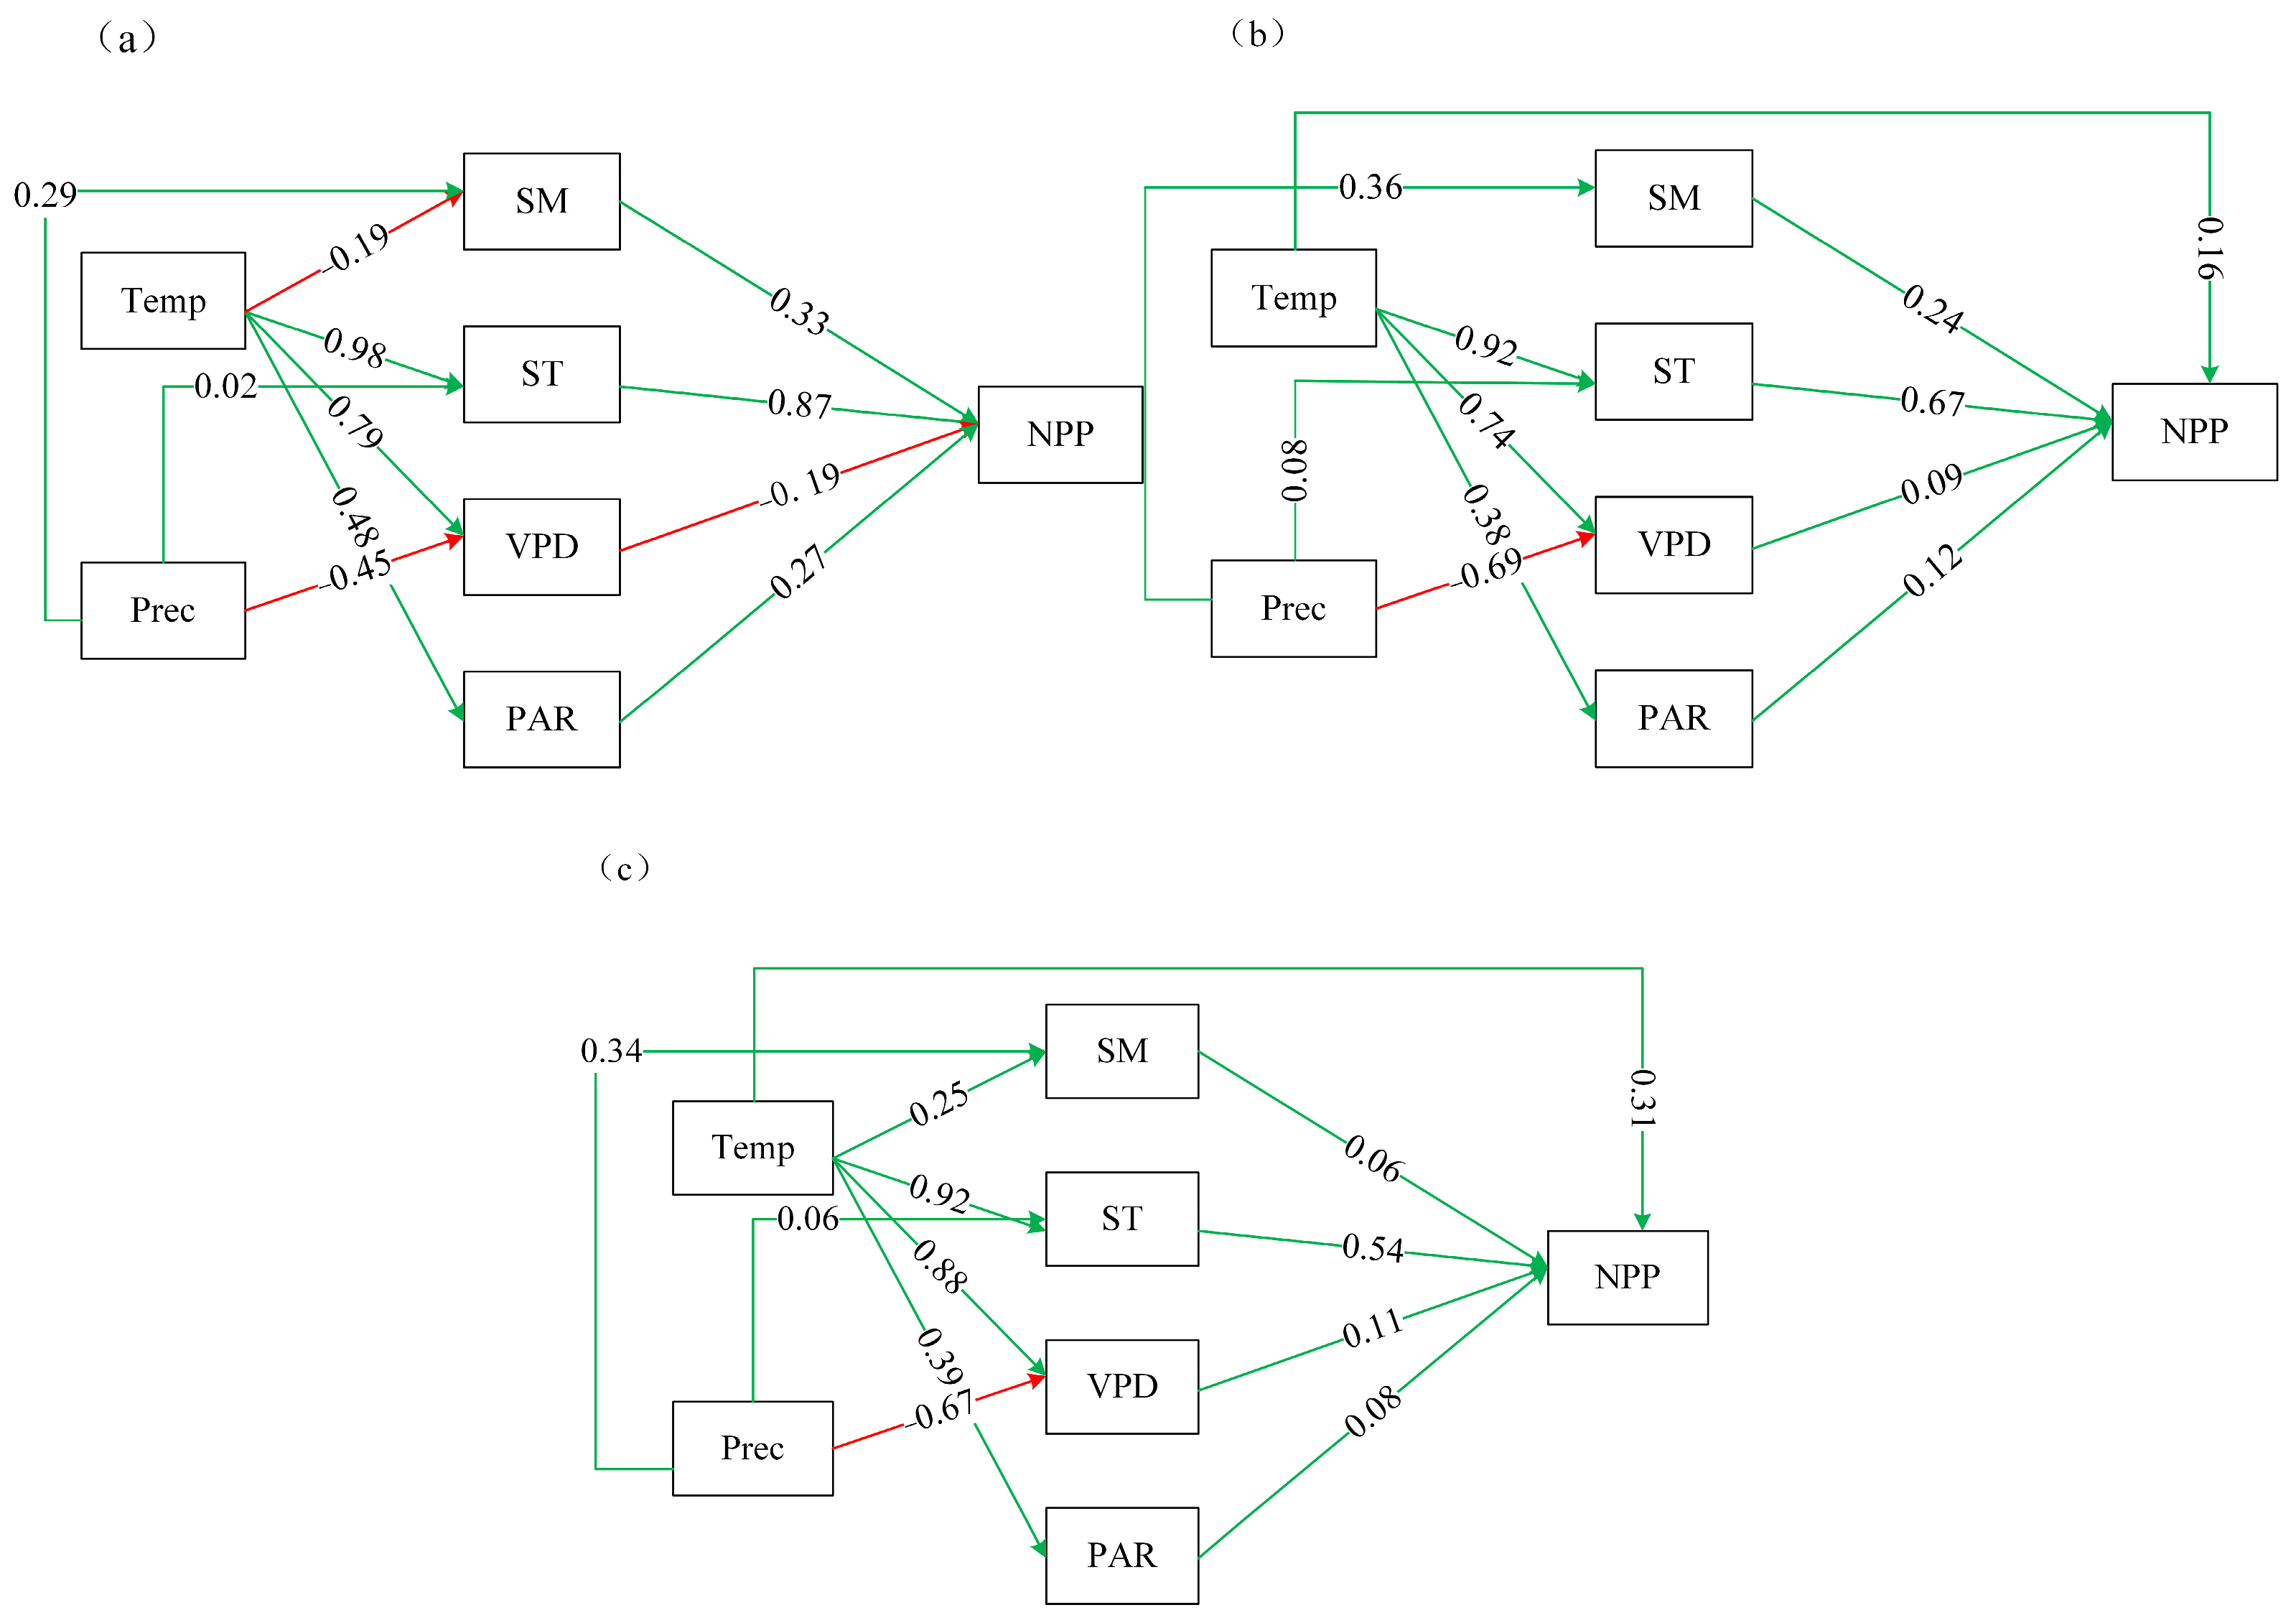
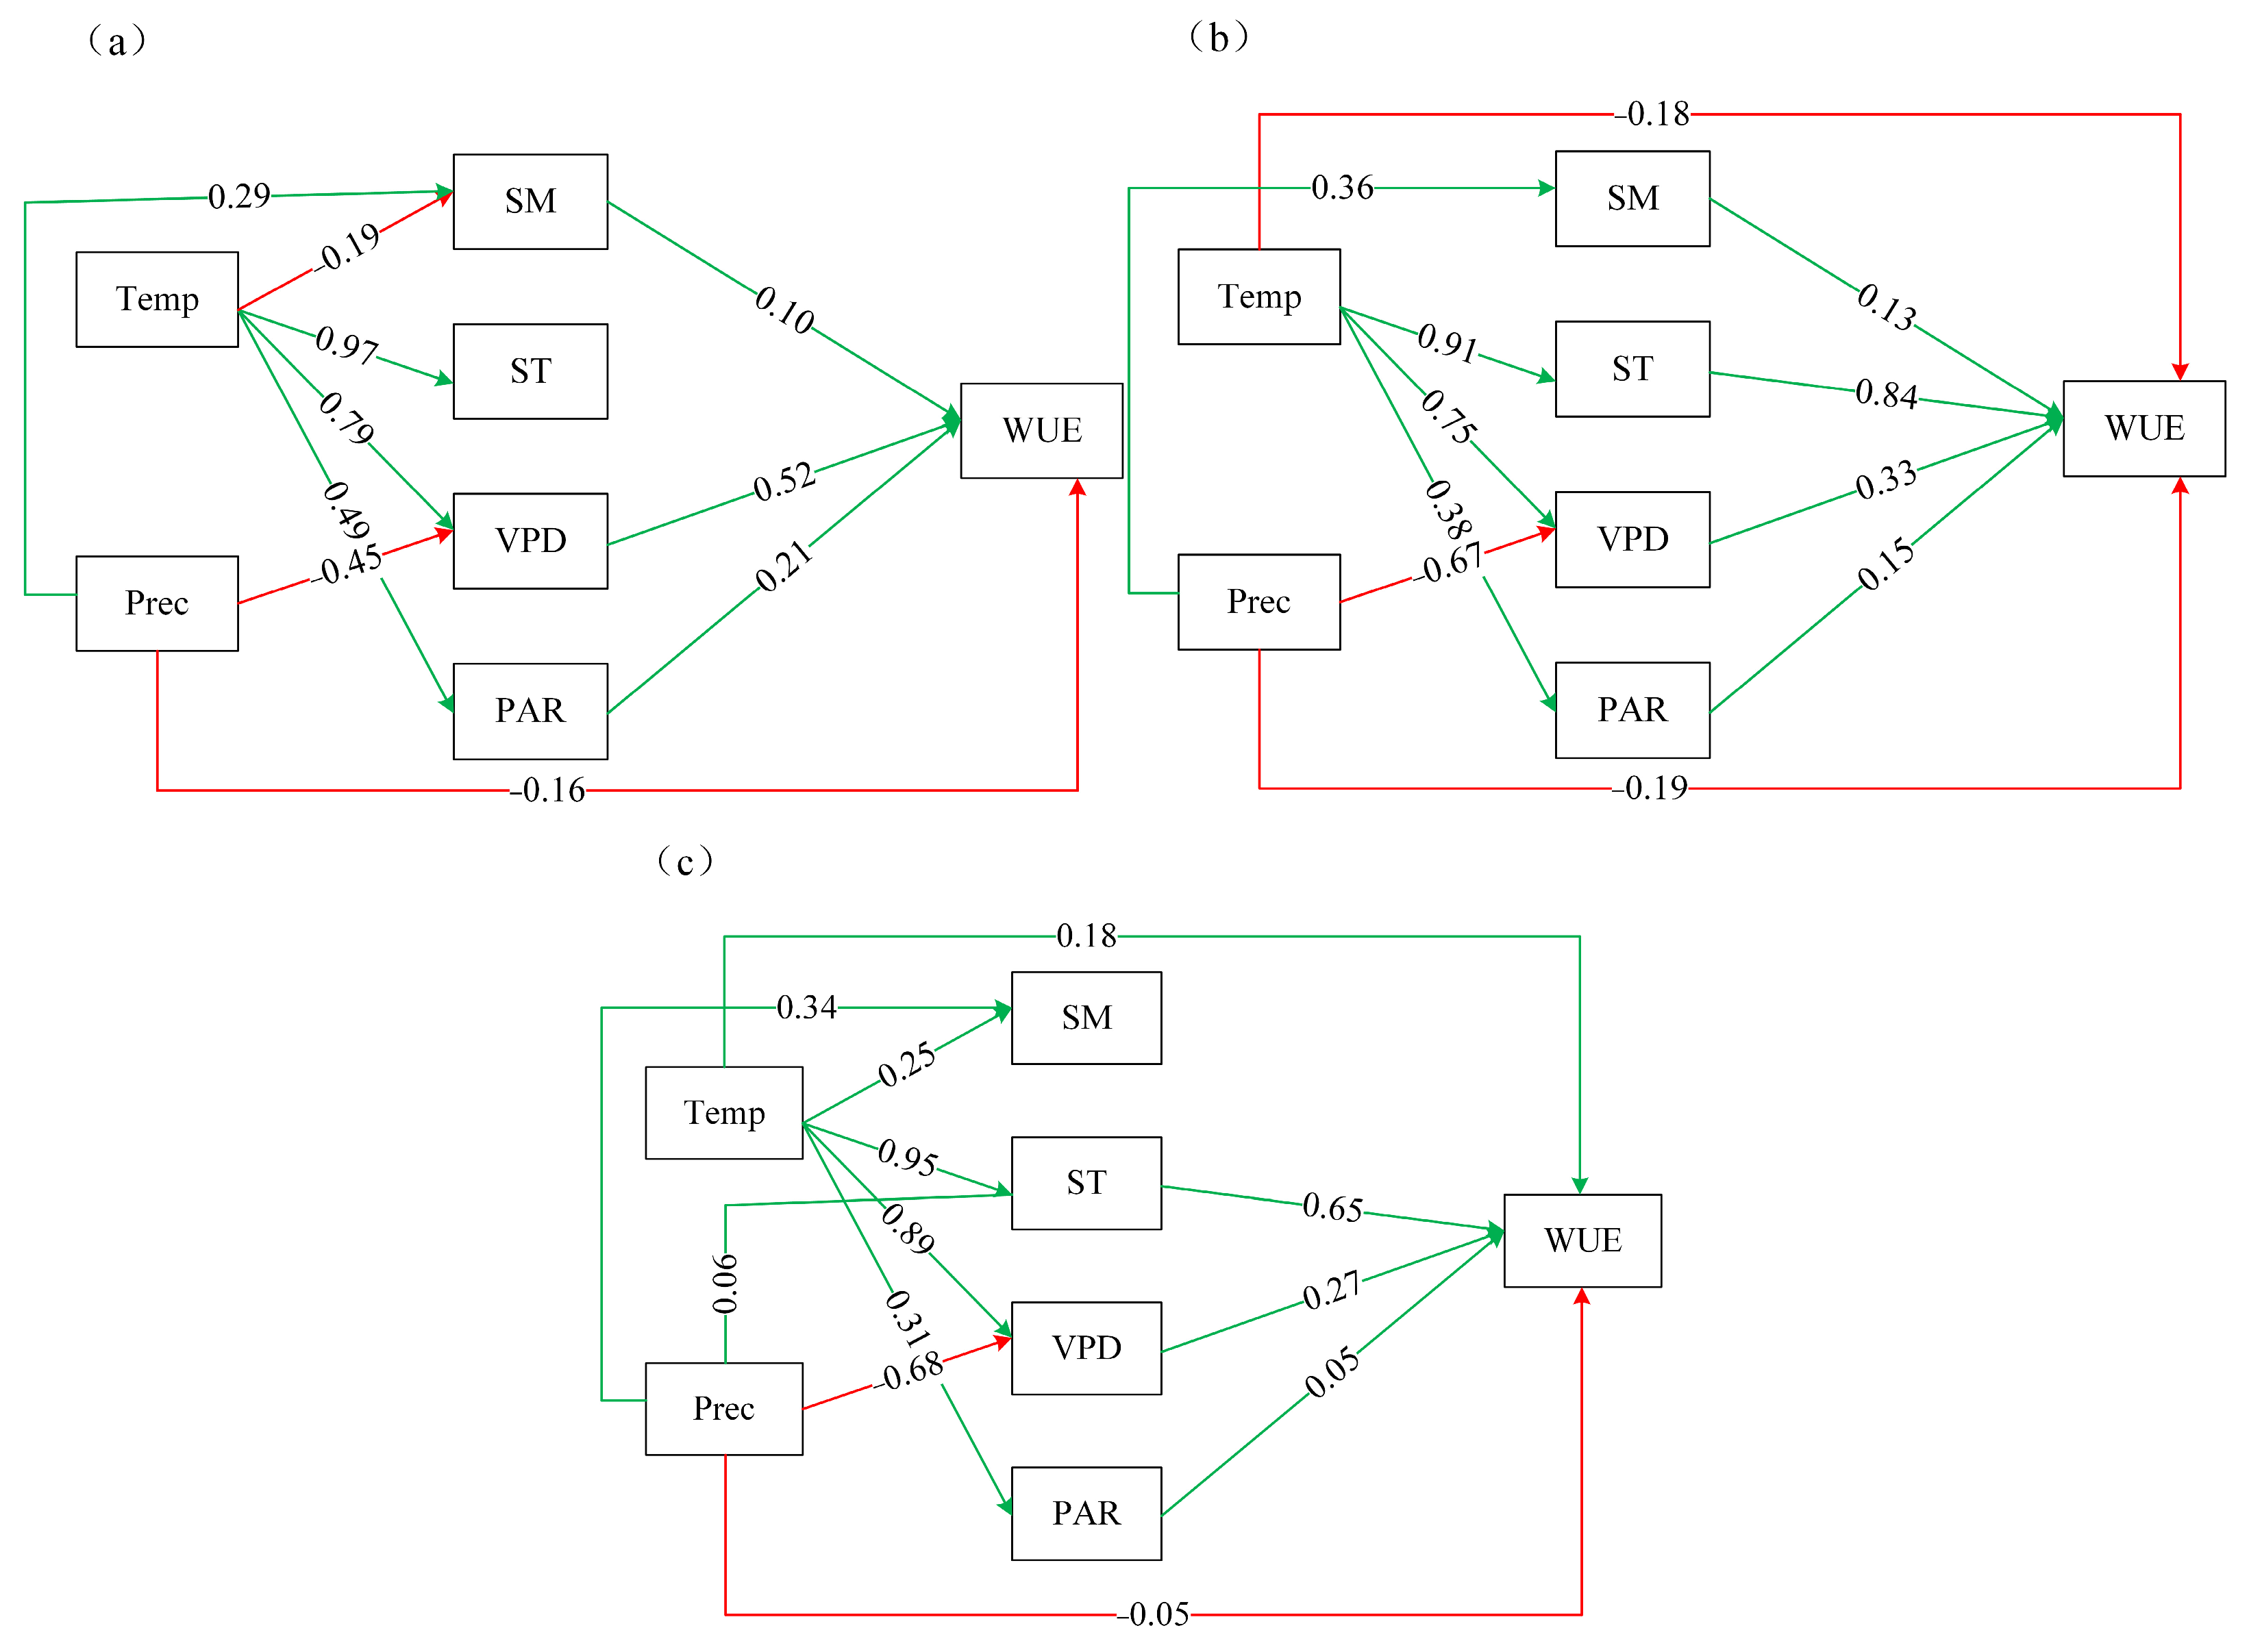
3.4.2. Results of Structural Equation Modeling

As shown in Figure 12a, the changes in Prec and Temp have no direct effect on NPP at elevations less than 3000 m, while SM, ST, VPD, and PAR had direct effects on NPP, which were 0.33, 0.87, −0.19, and 0.27, respectively. The total effect of Temp on the changes in NPP was 0.77 (−0.06 + 0.85 −0.15 + 0.13), which mainly affected NPP through indirect effects on SM (−0.06), ST (0.85), VPD (−0.15), and PAR (0.13). The total effect of Prec on the NPP change was 0.20, mainly indirectly through its effect on VPD. In summary, the total effect of ST on NPP change was the largest under this elevation partition. The elevation ranged from 3000 to 3700 m. The results showed that Temp had a direct effect on the changes in NPP, with a total effect coefficient on NPP of 0.89 (0.16 + 0.92 × 0.67 + 0.74 × 0.09 + 0.38 × 0.12) indicating an increased dependence of vegetation on the thermal factor with increasing elevation. The direct effects of SM, ST, and PAR on the NPP change decreased, while VPD had a weak positive direct effect on NPP at this elevation partition. The total effect of precipitation on the NPP change was 0.08, which was a weak effect. At elevations greater than 3700 m, the direct effects of SM, VPD, and PAR on NPP were less than 0.10, indicating that these factors had little effect at high elevations, while the direct effects on Temp and ST were enhanced to 0.31 and 0.54, respectively, with a total effect of Temp on NPP of 0.94, and a total effect of Prec on NPP of −0.01, as shown in Figure 12c. The model fit indices were as follows: RMSEA values were 0.01, 0.04, and 0.05; CFI values were 1.00, 0.99, and 0.99; and GFI values were 0.99, 0.99, and 0.99, respectively. In the figure, green lines indicate positive path coefficients and red lines indicate negative path coefficients (the same applies to Figure 13 and Figure 14).
The results of SEM of ET with Prec, Temp, SM, ST, VPD, and PAR at the three elevation zones of <3000 m, 3000–3700 m, and >3700 m are shown in Figure 13. The results showed that at elevations of less than 3000 m, as shown in Figure 13a, Prec and Temp produced a total effect of 0.42 and 0.54 on ET changes, respectively, and precipitation mainly affected ET by indirectly influencing VPD and then ET, and Temp mainly affected ET positively by affecting ST and PAR, and negatively by affecting VPD, with an effect coefficient of −0.43 (0.79 × −0.55), while higher temperatures and increased VPD led to a decrease in vegetation stomatal conductance and weaker vegetation transpiration. The direct effects of SM, ST, VPD, and PAR on the changes in ET were 0.15, 0.49, −0.55, and 0.10, respectively. The positive effects of Prec and Temp on ET increased with elevation, with an increase in Prec, adequate water availability, and increased evapotranspiration with higher temperatures. The elevation ranged from 3000 to 3700 m. Temp produced a total effect of 0.51 on ET, with a direct effect of 0.37, and 0.14 from indirect effects on other factors. Prec produced a total effect of 0.41 on ET, with a direct effect of 0.20, and the indirect effect was mainly through the effects of VPD (−0.67 × −0.20) and SM (0.36 × 0.22), as shown in Figure 13b. The results of the SEM of ET and the factors under an elevation greater than 3700 m are shown in Figure 13c, showing that the indirect effect of Temp on the total effect of ET included the direct positive effect of SM, which might be related to the increase in elevation, the soil properties in the freeze–thaw region with the increase in temperature, and melting. Temp had the largest coefficient of direct positive effects on ET (0.34), the negative effect coefficient of VPD on the ET was the largest (−0.44), precipitation had the largest total effect on ET, which was 0.62, and temperature had the largest negative effect of 0.07 through VPD. The path coefficient was the largest (−0.44), and precipitation had the largest total effect on ET change at 0.62, while temperature had a total effect on ET of 0.07, with the negative effect through VPD having an influence coefficient of −0.39. The model fit indices were as follows: RMSEA values were 0.01, 0.01, and 0.05; CFI values were 0.99, 0.99, and 0.99; and GFI values were 0.99, 0.99, and 0.99, respectively.
The results showed that the effect of each hydrothermal light factor on WUE production was related to the effect on NPP and ET production under different elevation zones. At elevations less than 3700 m, Temp did not have a direct effect on WUE, and had an indirect effect on WUE mainly through its effect on SM, VPD, and PAR, with an effect coefficient of 0.49; precipitation had a negative effect on WUE at this elevation partition, with a total effect of −0.37; and the direct effect of VPD on the change in WUE was 0.52; between 3000 and 3700 m elevation, both Temp and Prec had a direct negative effect on WUE, and Temp attenuated the direct negative effect it produced through its indirect positive effect on ST, VPD and PAR, with a total effect coefficient of 0.89, which was related to the fact that Temp produced a direct positive effect on ET at this elevation zone. The results showed that ST produced the largest total effect on WUE, with a direct effect coefficient of 0.84, and the higher the ST, the more suitable the soil environment was for vegetation growth, favoring vegetation respiration and photosynthesis. Prec produced a total effect of −0.36 on the change in WUE, the increase in precipitation increased ET, and the vegetation evapotranspiration was greater than the photosynthesis rate, suppressing WUE. At elevations greater than 3700 m, Temp had a direct positive effect on WUE, which was consistent with the positive effect of Temp on changes in NPP at this elevation partition. Under this elevation partition, SM had no direct effect on WUE, and PAR had almost no effect on WUE with a coefficient of 0.05; WUE was mainly affected indirectly by the effect of Temp on ST and VPD and the effect of Prec on VPD. The model fit indices were as follows: RMSEA values were 0.01, 0.01, and 0.05; CFI values were 1.00, 1.00, and 0.97; and GFI values were 0.99, 0.99, and 0.98, respectively.

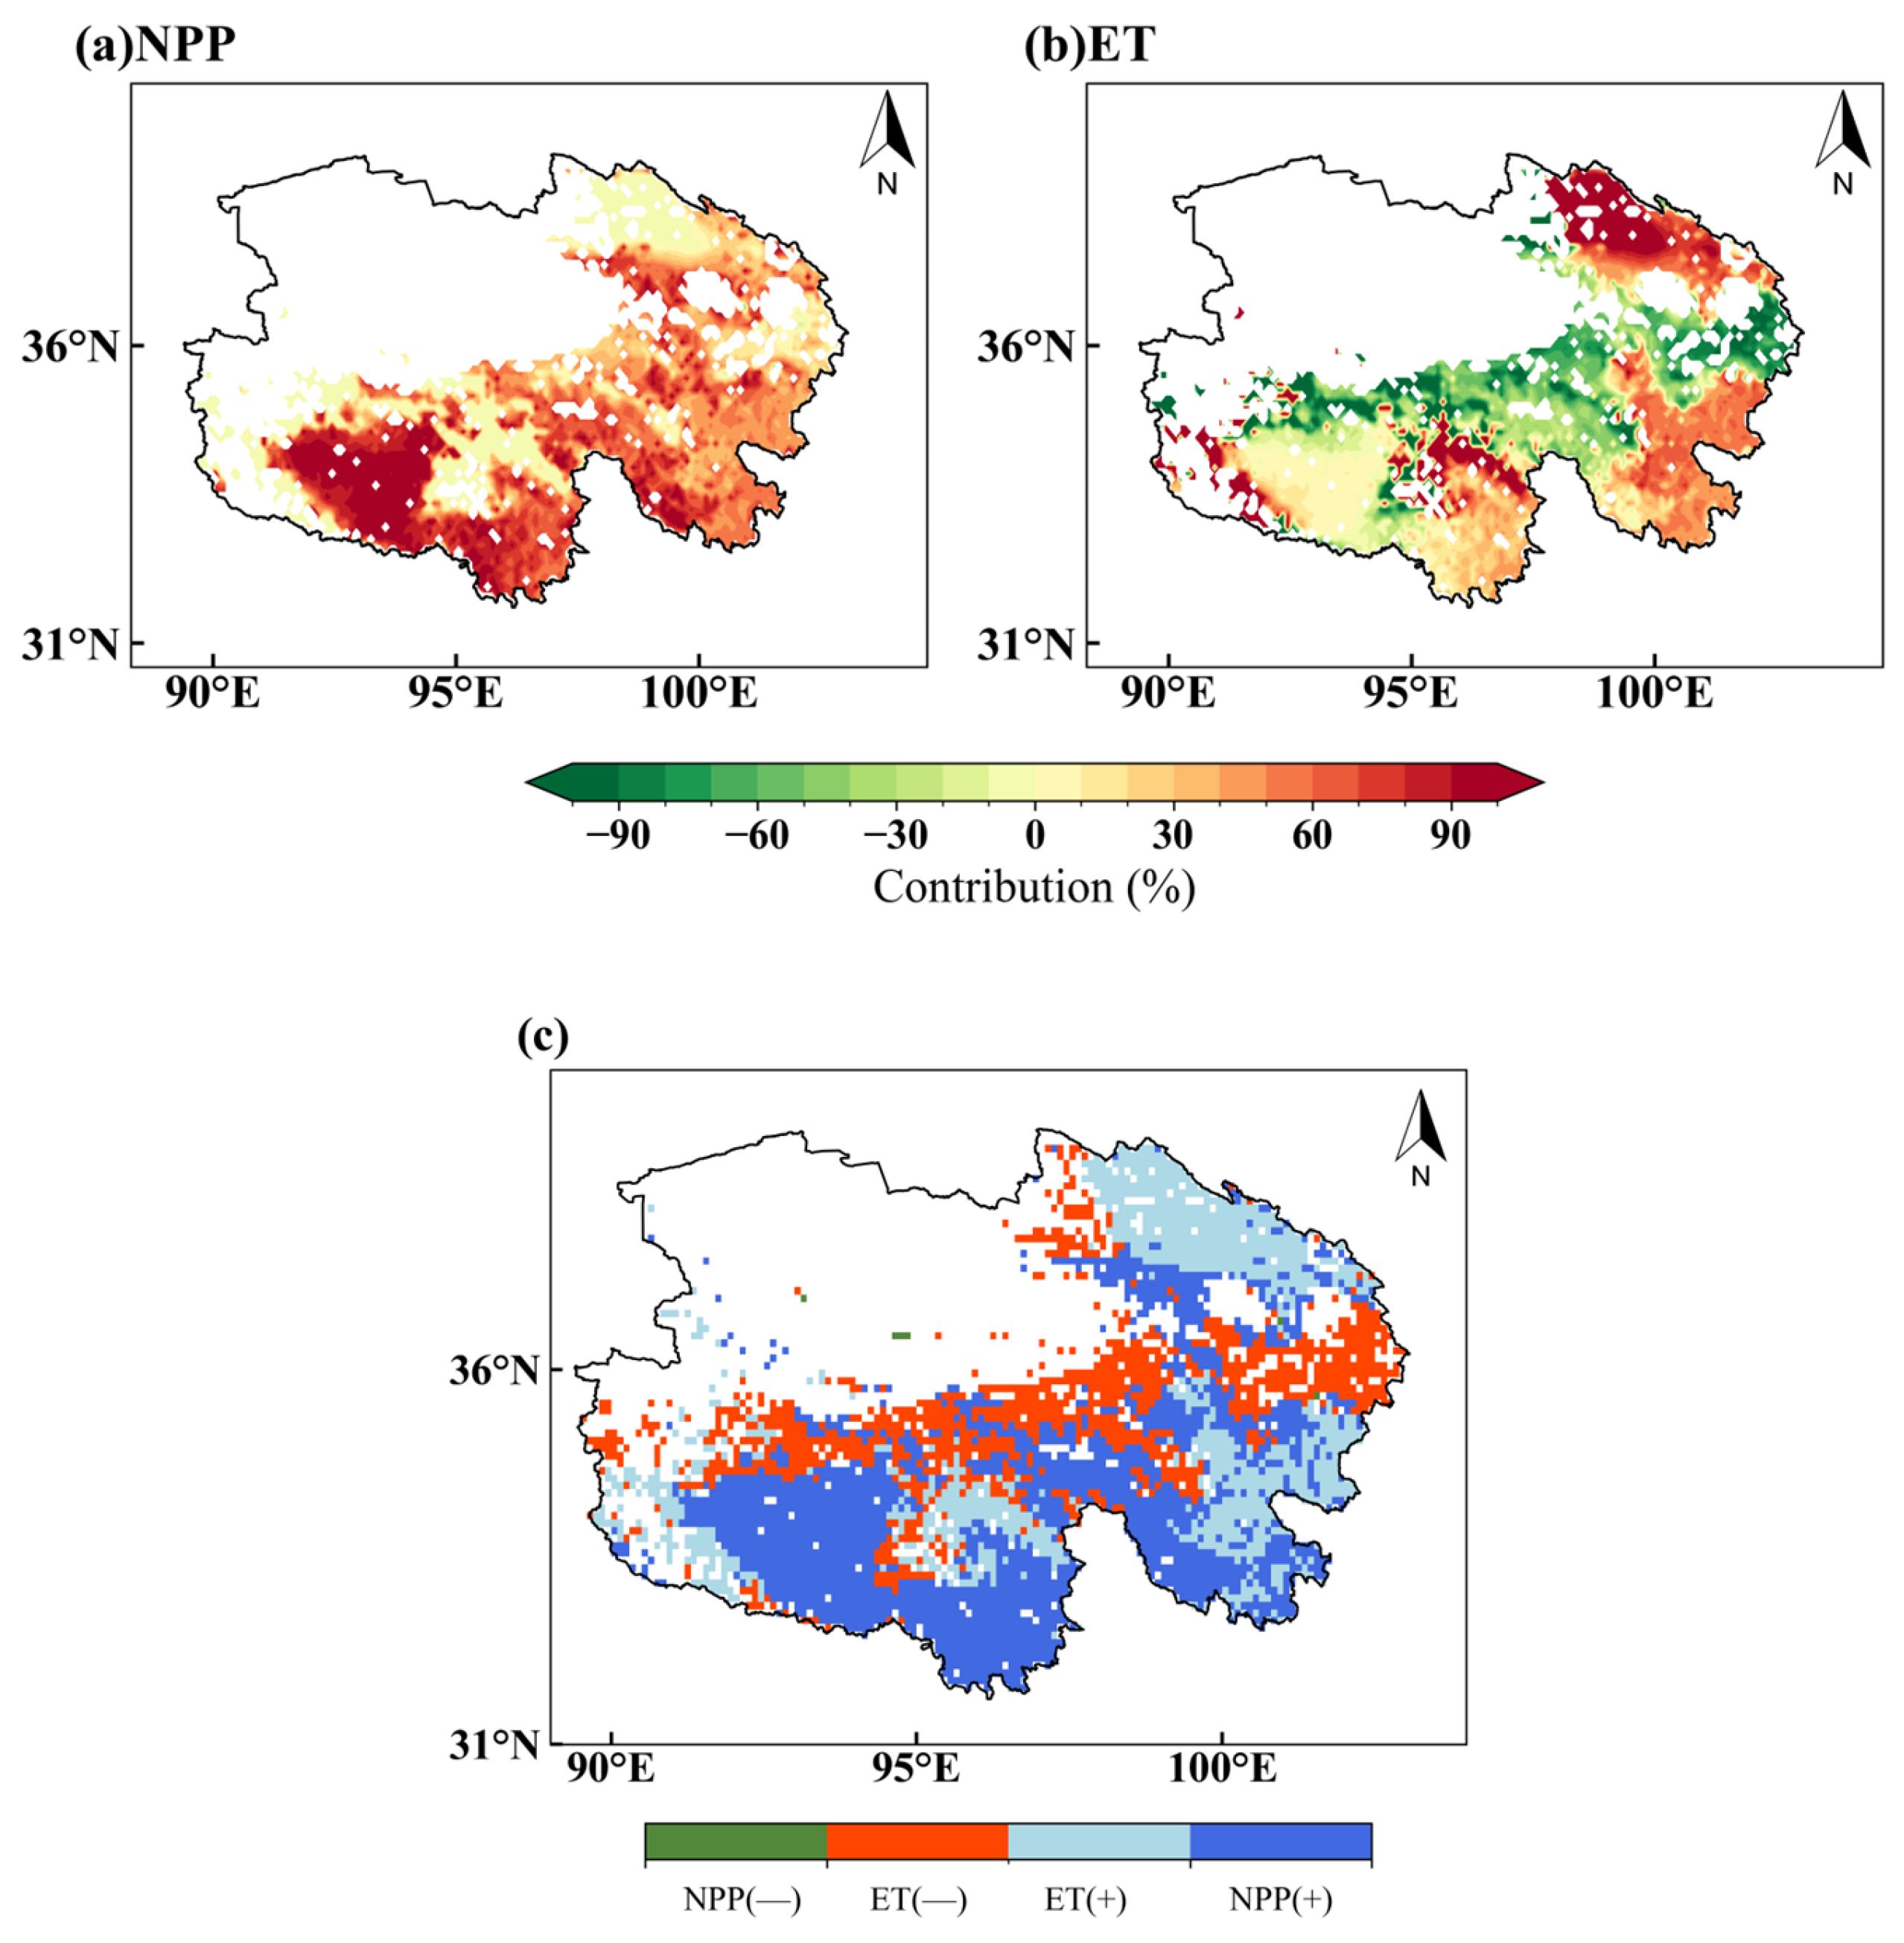
3.4.3. Results of Contribution Rate Analysis

In this study, we quantified the contribution of NPP and ET to WUE during the growing season of alpine grassland from 2001 to 2018 using the contribution rate calculation method, and the spatial distribution of the contribution rate of NPP to the change in WUE is shown in Figure 15a. The results showed that the contribution of NPP to the change in WUE during the growing season was mostly positive, with 56.76% of the regions having a contribution rate of more than 50%. The regions with higher NPP contribution rates were mainly located in the northeast of the Tanggula Mountain Range and near the Lancangjiang River source area, with contribution rates of up to 95% or more, while those with lower NPP contribution rates were mainly located in the east of the Yangtze River source, the southeast of the Qinghai Lake, and the northwest of the Qilian Mountains, The contribution of ET to WUE in the growing season was spatially heterogeneous, with 23.71% of the area having a positive ET contribution, mainly located in the northeastern region of the Yangtze River source area, and 19.73% of the area with negative ET contribution, mainly located in the southern side of the Qinghai Lake, as shown in Figure 15b.
In this study, areas with an NPP or ET greater than 50% (less than −50%) were identified as these being the dominant factors influencing WUE changes based on the magnitude of the contribution of NPP and ET to WUE, and the results are shown in Figure 15c. In terms of spatial distribution, the areas negatively dominated by ET were mainly concentrated in the central and southern parts of the study area, indicating that the increase in ET in this region had a significant negative effect on WUE, which might be related to enhanced evapotranspiration and increased water consumption. And the ET positive dominant region was mainly distributed in the eastern and northern local areas, indicating that the reduction in ET contributed to an increase in WUE. In addition, the areas positively dominated by NPP were in the northeastern Tanggula Mountain region, the Lancang River source area, and the northwestern Qinghai Lake region, indicating that the increase in NPP contributed significantly to WUE. In contrast, there were fewer areas negatively dominated by NPP, indicating that the negative impact of NPP reduction on WUE was relatively weak. Overall, changes in WUE in the region are more evenly distributed across the regions affected by ET and NPP, with increases in ET in the south and center of the region having the most prominent suppressive effect on WUE, while the positive effect of NPP was mainly seen in the southeast.
In this study, the overall contribution of NPP and ET to the change in WUE in alpine grassland during the growing season from 2001 to 2018 was counted in three elevation zones, <3000 m, 3000–3700 m, and >3700 m, and the results are shown in Figure 16. Below 3000 m elevation, the contribution of WUE change driven by NPP and ET was 17.60% and −82.5%, respectively, indicating that ET negatively dominated the contribution to WUE change and NPP showed a positive contribution. At the elevation of 3000–3700 m, the contribution of the change in WUE driven by NPP and ET was 42.10% and 57.90%, respectively, indicating that the contribution of ET to the change in WUE is positively dominant in this elevation sub-region. At elevations greater than 3700 m, the contribution of changes in WUE driven by NPP and ET was 54.71% and 45.28%, respectively, indicating that NPP was positively dominant in contributing to the changes in WUE under this elevation partition, while ET showed a positive contribution.

4. Discussion

This study showed that the multi-year mean values of NPP and WUE in alpine grassland showed a spatial pattern of gradual increase from northwest to southeast during 2001–2018, with an overall upward trend. This change was mainly driven by the spatial heterogeneity of hydrothermal conditions, which is consistent with the results of existing studies [51]. The variation in WUE along the elevation gradient exhibits a clear phased pattern. The study have shown that WUE reaches its peak at approximately 3700 m, and then gradually decreases with increasing elevation, which is in line with the previous study [52,53]. This trend reflects the increasing limiting effect of hydrothermal conditions on WUE, especially in high-altitude regions [41]. With the increase in elevation, vegetation growth was more limited by temperature, on the one hand, and with the increase in temperature, NPP had a tendency to increase; but on the other hand, the increase in temperature also led to an increase in ET. The increasing trend of both NPP and ET resulted in an insignificant overall increasing trend of WUE.
In this study, we further explored the responses of alpine grassland vegetation WUE to climatic factors such as water, heat, and light. during the growing season under three elevation zones (below 3000 m, 3000–3700 m, and above 3700 m). Partial correlation analysis was utilized to quantify the independent driving effects of climatic factors on NPP, ET, and WUE in alpine grassland across different elevation gradients. At elevations below 3000 m, the dominant role of SM in driving NPP (R around 0.30–0.45) and the significant effects of VPD on ET (R around −0.50) and WUE (R around 0.28) might be related to the relatively higher proportion of C4 plants in this region. C4 plants possess a higher water-use efficiency and a stronger tolerance to heat and drought, enabling them to maintain a high photosynthetic capacity under water-limited and high-VPD conditions. As a result, when VPD increased, ET was suppressed, but carbon fixation remained relatively stable, leading to an improvement in WUE. This also supported the conclusion that vegetation growth in low-elevation areas was more dependent on water availability than on heat conditions [54]. At elevations between 3000 and 3700 m, ST became a key factor influencing NPP (R = 0.23) and WUE (R = 0.39), further emphasizing the importance of heat in the growing season of alpine grassland [55], while the negative dominant effect of VPD on ET (R = −0.38) still persisted, reflecting the limitation of evapotranspiration by the vegetation under atmospheric drought. Above 3700 m elevation, the dominance of ST and VPD on NPP remained unchanged despite a slight weakening of its influence, while the sensitivity of WUE to both ST and VPD increased, suggesting that soil heat supply and atmospheric moisture stress in high-elevation regions plays a key role in maintaining WUE. This might be due to the stronger response of C3 vegetation to soil temperature and VPD in high-elevation areas [43,56]. This response mechanism of spatial heterogeneity was consistent with the water–heat coupling limitation pattern previously found in the Tibetan Plateau ecosystem [57].
The response of WUE to hydrothermal and light factors was mainly related to the response of grassland productivity and vegetation evapotranspiration to hydrothermal factors. According to the results of SEM, there were significant differences in the driving mechanisms of water, heat, and light factors on the coupling process of carbon–water in alpine grassland under different elevation zones. At elevations lower than 3000 m, NPP was mainly driven by ST directly, with a path coefficient of 0.87, while Temp and Prec acted on NPP and ET mainly through indirect effects on the intermediary factors (ST and VPD). The higher the proportion of C4 plants in this zone, with their strong heat- and drought-tolerance, could maintain a high photosynthetic efficiency under hot and dry conditions. Thus, temperature and precipitation impact vegetation more by regulating soil temperature and atmospheric dryness rather than directly affecting NPP. As the elevation increased to 3000–3700 m, the direct effect of Temp on NPP and ET increased, reflecting that the thermal factor gradually became the dominant factor, while that of VPD on ET increased, and the inhibitory effect of VPD on ET remained significant. After the elevation exceeded 3700 m, the direct positive effects of Temp (with direct path coefficients of 0.31 and 0.34) and ST (with direct path coefficients of 0.54 and 0.65) on NPP and WUE were further strengthened, reflecting that in the high-elevation freezing and thawing zone, the increase in temperature helped soil thawing and improved water availability, which in turn promoted vegetation growth and water-use efficiency. At this elevation, C3 plants dominated and were more sensitive to temperature changes, with warming significantly enhancing their photosynthesis and growth; in contrast, the proportion of heat-tolerant C4 plants was lower, and their response to temperature changes was weaker. This was consistent with existing findings that vegetation activity in alpine grasslands was more sensitive to heat changes [58,59]. In addition, VPD generally had a significant negative effect on ET at all elevation intervals, suggesting that drought stress had a sustained inhibitory effect on evapotranspiration processes.
WUE was determined by the combined effects of ecosystem productivity and evapo-transpiration. For different regions, the factors that played a decisive role may vary significantly [60]. The spatial heterogeneity of ET and NPP in WUE changes and the shift characteristics of their dominant factors were revealed by analyzing the contribution of WUE changes at different elevation intervals. The study showed that the negative effect of ET on WUE was dominant at elevations lower than 3000 m, with a contribution rate of −82.50%. Higher temperatures and more intense evapotranspiration at lower elevations result in high evaporative losses of water, leading to insufficient water supply, which in turn leads to a decrease in WUE [61]. In this region, the proportion of C4 plants is relatively high. Due to their specialized carbon assimilation pathway, C4 plants can reduce photorespiration losses more effectively, possess higher water-use efficiency, and exhibit greater drought tolerance, allowing them to maintain a relatively high carbon-fixation efficiency even under moisture limitation [42]. At elevations higher than 3700 m, NPP became the main controlling factor of WUE change, with a contribution rate of 54.71%. With decreasing temperature and harsher climatic conditions, C3 plants dominate; their carbon assimilation pathway was sensitive to low temperatures, which restricted plant growth and made NPP’s influence on WUE more significant [62]. At this time, plant growth was restricted and changes in NPP directly determined the performance of WUE, while ET still played a positive contributing role to some extent, but its influence was more secondary. This phenomenon suggests that the response of plants to climate change at high elevation is more dependent on the capacity of photosynthesis, while the effect of water is relatively weakened [63].
This study systematically investigated the response mechanisms of the WUE of alpine grassland vegetation in Qinghai Province to multiple factors such as water, heat, and light across different elevation zones, revealing the adaptive characteristics of the ecosystem under hydrothermal coupling regulation. The results are generally consistent with existing studies and provide new scientific insights into ecosystem resilience under climate change [51,56]. Due to the complexity of ecosystems and the limitations of data and methodologies, the sources of uncertainty in this study mainly include the following aspects: (1) The data used in this study were derived from multiple sources with inconsistent spatial and temporal resolutions. The interpolation methods used to unify the resolutions may introduce a certain degree of uncertainty. (2) The SEM framework was based on a priori assumptions. However, in real ecosystems, causal relationships are often complex and involve feedback mechanisms, making it difficult to fully capture the system using a single SEM. (3) This study primarily focused on the influence of climatic factors such as water, heat, and light on vegetation growth. In recent years, the increasing frequency of extreme climate events and intensified human disturbances (e.g., grazing and land-use changes) might have altered the response patterns of vegetation WUE. Therefore, future research should incorporate extreme climate indices and human activity variables, and combine them with higher-resolution data and field observations, in order to deepen the comprehensive understanding of carbon–water coupling mechanisms in alpine grassland ecosystems and provide more robust scientific support for regional ecological conservation and climate adaptation strategies.

5. Conclusions

This study revealed that the seasonal dynamics of WUE in alpine grasslands were strongly regulated by elevation-sensitive hydrothermal interactions. By integrating partial correlation analysis, SEM, and contribution rate decomposition, we elucidated both direct and mediated pathways through which hydrothermal and radiative factors regulate seasonal WUE dynamics.
A distinct triphasic WUE pattern emerged along the elevation gradient, with a peak near 3700 m—indicative of a threshold-driven ecosystem response. The analysis reveals that VPD is the primary driver at lower elevations, with a partial correlation coefficient of 0.28 and a direct path coefficient of 0.52, while both VPD and ST jointly control WUE at mid to high elevations, with partial correlation coefficients of 0.39 and 0.38, and direct path coefficients of 0.84 and 0.33, respectively. The influence of both factors intensified with increasing elevation. The SEM results highlight that temperature and precipitation primarily affect WUE indirectly, mediated through VPD and ST. The total effect of temperature on WUE increased from 0.51 to 0.95, while the total effect of precipitation on WUE rose from −0.36 to −0.18. In high-elevation areas, the effect of Temp on WUE through ST was 0.61, and through VPD it was 0.24. Notably, the positive indirect effect of temperature increases with elevation, with the path coefficient shifting from negative to 0.18, suggesting an enhanced temperature sensitivity of alpine vegetation under colder conditions, whereas precipitation consistently suppresses WUE, likely due to its negative impact on radiation availability or stomatal regulation.
In addition to climatic drivers, the relative contributions of NPP and ET to WUE variation exhibited clear spatial shifts. ET dominated at lower altitudes where evaporative demand was high, with a contribution rate of −82.50%, while NPP played a more central role at higher elevations, with a contribution rate of 54.71%, where vegetation growth became a limiting factor. This shift underscored the changing balance between carbon acquisition and water loss under varying hydrothermal constraints.
These findings have significant implications for understanding alpine ecosystem function and resilience under a changing climate. The observed nonlinearity and spatial heterogeneity in WUE response emphasize the need for adaptive, elevation-specific management strategies in fragile mountainous regions. WUE responses to hydrothermal and light factors vary with elevation, reflecting differences between C3 and C4 plants. At high altitudes (>3700 m), C3 plants dominate, and WUE is mainly driven by NPP, so conserving cold-adapted C3 species is vital. At low altitudes (<3000 m), C4 plants prevail, with evapotranspiration strongly influencing WUE; thus, improving soil moisture and supporting drought-tolerant C4 plants is important. Medium elevations (3000–3700 m) see joint control by soil temperature and vapor pressure deficit, requiring diverse plant communities for stability. These patterns support elevation-specific management to enhance ecosystem resilience under climate change.

Author Contributions

Conceptualization, Y.T. and B.Z.; methodology, Y.T. and B.Z.; software, W.Z.; validation, X.X., X.C. and B.Q.; formal analysis, Y.T. and W.Z.; investigation, X.X.; resources, Y.T.; data curation, W.Z.; writing—original draft preparation, W.Z.; writing—review and editing, Y.T. and X.X.; visualization, W.Z.; supervision, B.Z.; project administration, X.C. and B.Q.; funding acquisition, Y.T. All authors have read and agreed to the published version of the manuscript.

Funding

This research was jointly supported by The National Natural Science Foundation of China (No. U21A2021); Beijing and The Water Science and Technology Open Program Funding (2024).

Data Availability Statement

All data used in this study were obtained from publicly available sources. The processed dataset is available from the authors upon reasonable request.

Conflicts of Interest

The authors declare no conflicts of interest.

References

  1. Lin, S.; Wang, G.; Feng, J.; Dan, L.; Sun, X.; Hu, Z.; Chen, X.; Xiao, X. A Carbon Flux Assessment Driven by Environmental Factors Over the Tibetan Plateau and Various Permafrost Regions. J. Geophys. Res. Biogeosci. 2019, 124, 1132–1147. [Google Scholar] [CrossRef]
  2. Du, Q.; Sun, Y.; Guan, Q.; Pan, N.; Wang, Q.; Ma, Y.; Li, H.; Liang, L. Vulnerability of Grassland Ecosystems to Climate Change in the Qilian Mountains, Northwest China. J. Hydrol. 2022, 612, 128305. [Google Scholar] [CrossRef]
  3. Jin, J.; Wang, Y.; Zhang, Z.; Magliulo, V.; Jiang, H.; Cheng, M. Phenology Plays an Important Role in the Regulation of Terrestrial Ecosystem Water-Use Efficiency in the Northern Hemisphere. Remote Sens. 2017, 9, 664. [Google Scholar] [CrossRef]
  4. Shen, M.; Tang, Y.; Chen, J.; Zhu, X.; Zheng, Y. Influences of Temperature and Precipitation before the Growing Season on Spring Phenology in Grasslands of the Central and Eastern Qinghai-Tibetan Plateau. Agric. For. Meteorol. 2011, 151, 1711–1722. [Google Scholar] [CrossRef]
  5. Cuo, L.; Zhang, Y.; Ri, X.; Zhou, B. Decadal Change and Inter-Annual Variability of Net Primary Productivity on the Tibetan Plateau. Clim. Dyn. 2021, 56, 1837–1857. [Google Scholar] [CrossRef]
  6. Gao, Q.; Zhu, W.; Schwartz, M.W.; Ganjurjav, H.; Wan, Y.; Qin, X.; Ma, X.; Williamson, M.A.; Li, Y. Climatic Change Controls Productivity Variation in Global Grasslands. Sci. Rep. 2016, 6, 26958. [Google Scholar] [CrossRef]
  7. Yisilayili, G.; He, B.; Song, Y.; Luo, X.; Yang, W.; Chen, Y. Simulation of Vegetation NPP in Typical Arid Regions Based on the CASA Model and Quantification of Its Driving Factors. Land 2025, 14, 371. [Google Scholar] [CrossRef]
  8. Yan, D.; Yang, Y.; Hao, H.; Zhu, J.; Fu, Y.; Meng, N.; Li, Z.; Dai, X.; Li, R.; Zheng, H. Quantifying the Variation in Water Use Efficiency across Climates and Biomes on the Qinghai-Tibetan Plateau. Ecol. Indic. 2023, 157, 111274. [Google Scholar] [CrossRef]
  9. Khalifa, M.; Elagib, N.A.; Ribbe, L.; Schneider, K. Spatio-Temporal Variations in Climate, Primary Productivity and Efficiency of Water and Carbon Use of the Land Cover Types in Sudan and Ethiopia. Sci. Total Environ. 2018, 624, 790–806. [Google Scholar] [CrossRef]
  10. Zhang, X.; Chen, Y.; Zhang, Q.; Xia, Z.; Hao, H.; Xia, Q. Potential Evapotranspiration Determines Changes in the Carbon Sequestration Capacity of Forest and Grass Ecosystems in Xinjiang, Northwest China. Glob. Ecol. Conserv. 2023, 48, e02737. [Google Scholar] [CrossRef]
  11. USGCRP. 2018: Second State of the Carbon Cycle Report (SOCCR2): A Sustained Assessment Report; Cavallaro, N., Shrestha, G., Birdsey, R., Mayes, M.A., Najjar, R.G., Reed, S.C., Romero-Lankao, P., Zhu, Z., Eds.; U.S. Global Change Research Program: Washington, DC, USA, 2018; p. 878. Available online: https://carbon2018.globalchange.gov/ (accessed on 26 May 2025).
  12. Yang, S.; Li, Y.; Zhao, Y.; Lan, A.; Zhou, C.; Lu, H.; Zhou, L. Changes in Vegetation Ecosystem Carbon Sinks and Their Response to Drought in the Karst Concentration Distribution Area of Asia. Ecol. Inform. 2024, 84, 102907. [Google Scholar] [CrossRef]
  13. Tang, X.; Li, H.; Desai, A.R.; Nagy, Z.; Luo, J.; Kolb, T.E.; Olioso, A.; Xu, X.; Yao, L.; Kutsch, W.; et al. How Is Water-Use Efficiency of Terrestrial Ecosystems Distributed and Changing on Earth? Sci. Rep. 2014, 4, 7483. [Google Scholar] [CrossRef] [PubMed]
  14. Wang, H.; Liu, H.; Cao, G.; Ma, Z.; Li, Y.; Zhang, F.; Zhao, X.; Zhao, X.; Jiang, L.; Sanders, N.J.; et al. Alpine Grassland Plants Grow Earlier and Faster but Biomass Remains Unchanged over 35 Years of Climate Change. Ecol. Lett. 2020, 23, 701–710. [Google Scholar] [CrossRef]
  15. Franks, P.J.; Adams, M.A.; Amthor, J.S.; Barbour, M.M.; Berry, J.A.; Ellsworth, D.S.; Farquhar, G.D.; Ghannoum, O.; Lloyd, J.; McDowell, N.; et al. Sensitivity of Plants to Changing Atmospheric CO2 Concentration: From the Geological Past to the next Century. New Phytol. 2013, 197, 1077–1094. [Google Scholar] [CrossRef]
  16. Qu, Q.; Jian, S.; Chen, A.; Xiao, C. Investigating the Dynamic Change and Driving Force of Vegetation Carbon Sink in Taihang Mountain, China. Land 2024, 13, 1348. [Google Scholar] [CrossRef]
  17. Chen, N.; Zhang, Y.; Song, C.; Xu, M.; Zhang, T.; Li, M.; Cong, N.; Zu, J.; Zheng, Z.; Ma, G.; et al. The Chained Effects of Earlier Vegetation Activities and Summer Droughts on Ecosystem Productivity on the Tibetan Plateau. Agric. For. Meteorol. 2022, 321, 108975. [Google Scholar] [CrossRef]
  18. Xi, X.; Yuan, X. Remote Sensing of Atmospheric and Soil Water Stress on Ecosystem Carbon and Water Use during Flash Droughts over Eastern China. Sci. Total Environ. 2023, 868, 161715. [Google Scholar] [CrossRef]
  19. Wall, S.; Cockram, J.; Vialet-Chabrand, S.; Van Rie, J.; Gallé, A.; Lawson, T. The Impact of Growth at Elevated [CO2] on Stomatal Anatomy and Behavior Differs between Wheat Species and Cultivars. J. Exp. Bot. 2023, 74, 2860–2874. [Google Scholar] [CrossRef]
  20. Martínez-Goñi, X.S.; Miranda-Apodaca, J.; Pérez-López, U. Enhanced Photosynthesis, Transpiration Regulation, Water Use-Efficiency and Growth in Buckwheat Outperforms Wheat Response to High [CO2], High Temperature and Drought. Environ. Exp. Bot. 2024, 222, 105756. [Google Scholar] [CrossRef]
  21. Pernicová, N.; Urban, O.; Čáslavský, J.; Kolář, T.; Rybníček, M.; Sochová, I.; Peñuelas, J.; Bošeľa, M.; Trnka, M. Impacts of Elevated CO2 Levels and Temperature on Photosynthesis and Stomatal Closure along an Altitudinal Gradient Are Counteracted by the Rising Atmospheric Vapor Pressure Deficit. Sci. Total Environ. 2024, 921, 171173. [Google Scholar] [CrossRef]
  22. Zhao, P.; Zeng, X.; Peng, S.; Sun, G. Daily variation of gas exchange, stomatal conductance and water use efficiency in summer leaves of Ormosia pinnata. J. Trop. Subtrop. Bot. 2000, 8, 35–42. [Google Scholar]
  23. Grossiord, C.; Buckley, T.N.; Cernusak, L.A.; Novick, K.A.; Poulter, B.; Siegwolf, R.T.W.; Sperry, J.S.; McDowell, N.G. Plant Responses to Rising Vapor Pressure Deficit. New Phytol. 2020, 226, 1550–1566. [Google Scholar] [CrossRef] [PubMed]
  24. Seleiman, M.F.; Al-Suhaibani, N.; Ali, N.; Akmal, M.; Alotaibi, M.; Refay, Y.; Dindaroglu, T.; Abdul-Wajid, H.H.; Battaglia, M.L. Drought Stress Impacts on Plants and Different Approaches to Alleviate Its Adverse Effects. Plants 2021, 10, 259. [Google Scholar] [CrossRef]
  25. Bai, Y.; Wu, J.; Xing, Q.; Pan, Q.; Huang, J.; Yang, D.; Han, X. Primary Production and Rain Use Efficiency Across a Precipitation Gradient on the Mongolia Plateau. Ecology 2008, 89, 2140–2153. [Google Scholar] [CrossRef]
  26. Lu, X.; Zhuang, Q. Evaluating Evapotranspiration and Water-Use Efficiency of Terrestrial Ecosystems in the Conterminous United States Using MODIS and AmeriFlux Data. Remote Sens. Environ. 2010, 114, 1924–1939. [Google Scholar] [CrossRef]
  27. Marenco, R.A.; Nascimento, H.C.S.; Magalhães, N.S. Stomatal Conductance in Amazonian Tree Saplings in Response to Variations in the Physical Environment. Photosynthetica 2014, 52, 493–500. [Google Scholar] [CrossRef]
  28. Urban, J.; Ingwers, M.; McGuire, M.A.; Teskey, R.O. Stomatal Conductance Increases with Rising Temperature. Plant Signal. Behav. 2017, 12, e1356534. [Google Scholar] [CrossRef]
  29. Ma, L.; Liu, Y.; Zhao, J. The Relationship between Environmental Change and Stable Carbon Isotopes Records from Tree-Ring in Mt. Helan. Huan Jing Ke Xue = Huanjing Kexue 2003, 24, 49–53. [Google Scholar]
  30. Sun, Y.; Piao, S.; Huang, M.; Ciais, P.; Zeng, Z.; Cheng, L.; Li, X.; Zhang, X.; Mao, J.; Peng, S.; et al. Global Patterns and Climate Drivers of Water-Use Efficiency in Terrestrial Ecosystems Deduced from Satellite-Based Datasets and Carbon Cycle Models. Glob. Ecol. Biogeogr. 2016, 25, 311–323. [Google Scholar] [CrossRef]
  31. Xu, X.; Jiao, F.; Gong, H.; Xue, P.; Lin, N.; Liu, J.; Zhang, K.; Qiu, J.; Lin, D.; Yang, Y.; et al. Observed Divergence in the Trends of Temperature Controls on Chinese Ecosystem Water Use Efficiency. Ecol. Indic. 2023, 157, 111241. [Google Scholar] [CrossRef]
  32. Shao, W.; Guan, Q.; Liu, H.; Sun, W.; Sun, Y. Temporal and Spatial Dynamics of Carbon and Water Use Efficiency on the Qinghai-Tibet Plateau and Their Ecosystem Responses. J. Clean. Prod. 2024, 475, 143581. [Google Scholar] [CrossRef]
  33. Chen, J.; Pu, J.; Li, J.; Zhang, T. Response of Carbon- and Water-Use Efficiency to Climate Change and Human Activities in China. Ecol. Indic. 2024, 160, 111829. [Google Scholar] [CrossRef]
  34. Ma, L.; Zhang, Z.; Yao, B.; Ma, Z.; Huang, X.; Zhou, B.; Xu, M.; Guo, J.; Zhou, H. Effects of Drought and Heat on the Productivity and Photosynthetic Characteristics of Alpine Meadow Plants on the Qinghai-Tibetan Plateau. J. Mt. Sci. 2021, 18, 2079–2093. [Google Scholar] [CrossRef]
  35. Cheng, M.; Jin, J.; Jiang, H. Strong Impacts of Autumn Phenology on Grassland Ecosystem Water Use Efficiency on the Tibetan Plateau. Ecol. Indic. 2021, 126, 107682. [Google Scholar] [CrossRef]
  36. Wang, Q.; Fan, X.; Wang, M. Recent Warming Amplification over High Elevation Regions across the Globe. Clim. Dyn. 2014, 43, 87–101. [Google Scholar] [CrossRef]
  37. Lu, S.; Chen, F.; Zhou, J.; Hughes, A.C.; Ma, X.; Gao, W. Cascading Implications of a Single Climate Change Event for Fragile Ecosystems on the Qinghai-Tibetan Plateau. Ecosphere 2020, 11, e03243. [Google Scholar] [CrossRef]
  38. Zhang, S.; Wu, T.; Guo, L.; Zhao, Y. Assessing Ecological Risk on the Qinghai-Tibet Plateau Based on Future Land Use Scenarios and Ecosystem Service Values. Ecol. Indic. 2023, 154, 110769. [Google Scholar] [CrossRef]
  39. Zhang, Y.; Bao, G.; Bao, Y.; Yuan, Z.; Rina, W.; Tong, S. Altitudinal Differences in Decreasing Heat Deficit at the End of the Growing Season of Alpine Grassland on the Qinghai–Tibetan Plateau from 1982 to 2022. Land 2025, 14, 758. [Google Scholar] [CrossRef]
  40. Sun, J.; Zhou, T.-C.; Liu, M.; Chen, Y.-C.; Liu, G.-H.; Xu, M.; Shi, P.-L.; Peng, F.; Tsunekawa, A.; Liu, Y.; et al. Water and Heat Availability Are Drivers of the Aboveground Plant Carbon Accumulation Rate in Alpine Grasslands on the Tibetan Plateau. Glob. Ecol. Biogeogr. 2020, 29, 50–64. [Google Scholar] [CrossRef]
  41. Liu, M.; Jiao, J.; Pan, J.; Song, J.; Che, Y.; Li, L. Spatial and Temporal Patterns of Planting NPP and Its Driving Factors in Qinghai Province. Acta Ecol. Sin. 2020, 40, 5306–5317. [Google Scholar]
  42. Li, M.C.; Zhu, J.J.; Li, L.X. Occurrence and Altitudinal Pattern of C4 Plants on Qinghai Plateau, Qinghai Province, China. Photosynthetica 2009, 47, 298–303. [Google Scholar] [CrossRef]
  43. Zhou, Y.; Fan, J.; Zhong, H.; Zhang, W. Relationships between Altitudinal Gradient and Plant Carbon Isotope Composition of Grassland Communities on the Qinghai-Tibet Plateau, China. Sci. China Earth Sci. 2013, 56, 311–320. [Google Scholar] [CrossRef]
  44. He, J.; Yang, K.; Tang, W.; Lu, H.; Qin, J.; Chen, Y.; Li, X. The First High-Resolution Meteorological Forcing Dataset for Land Process Studies over China. Sci. Data 2020, 7, 25. [Google Scholar] [CrossRef]
  45. Li, Q.; Shi, G.; Shangguan, W.; Nourani, V.; Li, J.; Li, L.; Huang, F.; Zhang, Y.; Wang, C.; Wang, D.; et al. A 1 Km Daily Soil Moisture Dataset over China Using in Situ Measurement and Machine Learning. Earth Syst. Sci. Data 2022, 14, 5267–5286. [Google Scholar] [CrossRef]
  46. Tang, W.; Qin, J.; Yang, K.; Jiang, Y.; Pan, W. Mapping Long-Term and High-Resolution Global Gridded Photosynthetically Active Radiation Using the ISCCP H-Series Cloud Product and Reanalysis Data. Earth Syst. Sci. Data 2022, 14, 2007–2019. [Google Scholar] [CrossRef]
  47. Ding, J.; Yang, T.; Zhao, Y.; Liu, D.; Wang, X.; Yao, Y.; Peng, S.; Wang, T.; Piao, S. Increasingly Important Role of Atmospheric Aridity on Tibetan Alpine Grasslands. Geophys. Res. Lett. 2018, 45, 2852–2859. [Google Scholar] [CrossRef]
  48. Zhang, Q.; Kong, D.; Shi, P.; Singh, V.P.; Sun, P. Vegetation Phenology on the Qinghai-Tibetan Plateau and Its Response to Climate Change (1982–2013). Agric. For. Meteorol. 2018, 248, 408–417. [Google Scholar] [CrossRef]
  49. Yang, L.; Shen, F.; Zhang, L.; Cai, Y.; Yi, F.; Zhou, C. Quantifying Influences of Natural and Anthropogenic Factors on Vegetation Changes Using Structural Equation Modeling: A Case Study in Jiangsu Province, China. J. Clean. Prod. 2021, 280, 124330. [Google Scholar] [CrossRef]
  50. Zhang, M.; Yuan, N.; Lin, H.; Liu, Y.; Zhang, H. Quantitative Estimation of the Factors Impacting Spatiotemporal Variation in NPP in the Dongting Lake Wetlands Using Landsat Time Series Data for the Last Two Decades. Ecol. Indic. 2022, 135, 108544. [Google Scholar] [CrossRef]
  51. Guo, B.; Zang, W.; Yang, F.; Han, B.; Chen, S.; Liu, Y.; Yang, X.; He, T.; Chen, X.; Liu, C.; et al. Spatial and Temporal Change Patterns of Net Primary Productivity and Its Response to Climate Change in the Qinghai-Tibet Plateau of China from 2000 to 2015. J. Arid Land 2020, 12, 1–17. [Google Scholar] [CrossRef]
  52. Zheng, Z.; Zhu, W.; Zhang, Y. Seasonally and Spatially Varied Controls of Climatic Factors on Net Primary Productivity in Alpine Grasslands on the Tibetan Plateau. Glob. Ecol. Conserv. 2020, 21, e00814. [Google Scholar] [CrossRef]
  53. Tang, Z.; Zhang, Y.; Lei, M.; Li, Z.; Zhao, G.; Chen, Y.; Zhu, W. Climate-Driven Effects on NPP in the Tibetan Plateau Alpine Grasslands Diminish with Increasing Elevation. Remote Sens. 2024, 16, 4754. [Google Scholar] [CrossRef]
  54. Lv, G.; Jin, J.; He, M.; Wang, C. Soil Moisture Content Dominates the Photosynthesis of C3 and C4 Plants in a Desert Steppe after Long-Term Warming and Increasing Precipitation. Plants 2023, 12, 2903. [Google Scholar] [CrossRef]
  55. Li, Y.; Zhang, C.; Li, Z.; Yang, L.; Jin, X.; Gao, X. Analysis on the Temporal and Spatial Characteristics of the Shallow Soil Temperature of the Qinghai-Tibet Plateau. Sci. Rep. 2022, 12, 19746. [Google Scholar] [CrossRef]
  56. Gandin, A.; Koteyeva, N.K.; Voznesenskaya, E.V.; Edwards, G.E.; Cousins, A.B. The Acclimation of Photosynthesis and Respiration to Temperature in the C3–C4 Intermediate Salsola Divaricata: Induction of High Respiratory CO2 Release under Low Temperature. Plant Cell Environ. 2014, 37, 2601–2612. [Google Scholar] [CrossRef]
  57. Piao, S.; Nan, H.; Huntingford, C.; Ciais, P.; Friedlingstein, P.; Sitch, S.; Peng, S.; Ahlström, A.; Canadell, J.G.; Cong, N.; et al. Evidence for a Weakening Relationship between Interannual Temperature Variability and Northern Vegetation Activity. Nat. Commun. 2014, 5, 5018. [Google Scholar] [CrossRef]
  58. Xu, W.; Gu, S.; Zhao, X.; Xiao, J.; Tang, Y.; Fang, J.; Zhang, J.; Jiang, S. High Positive Correlation between Soil Temperature and NDVI from 1982 to 2006 in Alpine Meadow of the Three-River Source Region on the Qinghai-Tibetan Plateau. Int. J. Appl. Earth Obs. Geoinf. 2011, 13, 528–535. [Google Scholar] [CrossRef]
  59. Guo, L.; Chen, J.; Luedeling, E.; He, J.-S.; Cheng, J.; Wen, Z.; Peng, C. Early-Spring Soil Warming Partially Offsets the Enhancement of Alpine Grassland Aboveground Productivity Induced by Warmer Growing Seasons on the Qinghai-Tibetan Plateau. Plant Soil 2018, 425, 177–188. [Google Scholar] [CrossRef]
  60. Su, S.-L.; Ji, H.-J.; Zhang, D.; Zhang, S.-Q.; Li, S.-D.; Su, W.-J. Characteristics of Water Use Efficiency and Its Influencing Factors of Grassland Ecosystem in Qinghai Province. Acta Agrestia Sin. 2023, 31, 2814. [Google Scholar] [CrossRef]
  61. Liu, P.; Tong, X.; Meng, P.; Zhang, J.; Li, J.; Zhang, J.; Zhou, Y. Biophysical Controls on Water Use Efficiency of Six Plantations under Different Sky Conditions. Agric. For. Meteorol. 2022, 320, 108938. [Google Scholar] [CrossRef]
  62. Chen, X.; Zhang, Y. Impacts of Climate, Phenology, Elevation and Their Interactions on the Net Primary Productivity of Vegetation in Yunnan, China under Global Warming. Ecol. Indic. 2023, 154, 110533. [Google Scholar] [CrossRef]
  63. Lin, S.; Wang, G.; Hu, Z.; Huang, K.; Sun, J.; Sun, X. Spatiotemporal Variability and Driving Factors of Tibetan Plateau Water Use Efficiency. J. Geophys. Res. Atmos. 2020, 125, e2020JD032642. [Google Scholar] [CrossRef]
Figure 1. Study area.
Land 14 01173 g001
Figure 2. Schematic diagram of the SEM between hydrothermal–radiative factors and NPP.
Land 14 01173 g002
Figure 3. Interannual monthly variation in key climate factors: (a) precipitation, (b) temperature, (c) soil moisture, (d) soil temperature, (e) saturation vapor pressure deficit, (f) photosynthetically active radiation.
Land 14 01173 g003aLand 14 01173 g003b
Figure 4. Spatial distribution map of mean annual net primary productivity (NPP): (a) year, (b) growing season.
Land 14 01173 g004
Figure 5. Interannual variation in net primary productivity: (a) time series, (b) monthly average values over multiple years.
Land 14 01173 g005
Figure 6. Spatial distribution of mean annual evapotranspiration: (a) annual, (b) growing season.
Land 14 01173 g006
Figure 7. Interannual variation in evapotranspiration: (a) time series, (b) multi-year average monthly ET.
Land 14 01173 g007
Figure 8. Spatial distribution map of mean vegetation water-use efficiency (WUE): (a) annual, (b) growing season.
Land 14 01173 g008
Figure 9. Interannual variation in WUE: (a) time series, (b) multi-year monthly average.
Land 14 01173 g009
Figure 10. Distribution characteristics of vegetation NPP, ET, and WUE with elevation: (a) NPP, (b) ET, (c) WUE.
Land 14 01173 g010
Figure 11. Correlation of vegetation NPP, ET, and WUE with water, heat, and light factors at different elevation gradients: (a) vegetation NPP, (b) ET, and (c) WUE.
Land 14 01173 g011
Figure 12. Structural equation modeling of NPP: (a) <3000 m, (b) 3000–3700 m, and (c) >3700 m elevation zones; path coefficients that pass the significance test of p < 0.05 are shown.
Land 14 01173 g012
Figure 13. SEM of ET: (a) <3000 m, (b) 3000–3700 m, and (c) >3700 m elevation zones; path coefficients that pass the significance test of p < 0.05 are shown.
Land 14 01173 g013
Figure 14. Structural equation modeling of WUE: (a) <3000 m, (b) 3000–3700 m, and (c) >3700 m elevation zones; path coefficients that pass the significance test of p < 0.05 are shown.
Land 14 01173 g014
Figure 15. Spatial distribution of NPP and ET contribution to WUE change: (a) NPP contribution to WUE, (b) ET contribution to WUE, (c) spatial distribution of dominant factors.
Land 14 01173 g015
Figure 16. Contribution rates of NPP and ET to WUE under different elevation zones.
Land 14 01173 g016
Disclaimer/Publisher’s Note: The statements, opinions and data contained in all publications are solely those of the individual author(s) and contributor(s) and not of MDPI and/or the editor(s). MDPI and/or the editor(s) disclaim responsibility for any injury to people or property resulting from any ideas, methods, instructions or products referred to in the content.

