Abstract
Understanding the complex and evolving interactions between ecosystem services and socio-economic development is crucial for addressing ecological challenges and achieving harmony between humans and nature. However, multi-objective nexus optimization models that reveal the interdependencies of socio-ecological systems have received little attention. This study therefore aims to propose a species–carbon–water–food–economy functional nexus and explore trade-offs and synergies across China’s provinces from 2000 to 2020, using the InVEST model, correlation analysis, and redundancy analysis. The results revealed that the species protection function exhibited an “increase–decrease” trend, while the carbon sink, water conservation, food supply, and economic development functions increased. Both ecosystem functions and economic development functions exhibited spatial differences. Although synergies dominated the functional nexus, a trade-off was observed between species protection and food supply, with functional interactions showing spatial heterogeneity at the provincial scale. Complex interactions between social systems and ecosystems were observed in 2000, 2010, and 2020, with explanatory powers of 52.5%, 59.7%, and 59.1%, respectively. Functional policy goals exhibited both trade-offs and synergies. To achieve the sustainable development of the socio-ecological system, a “multi-goals driven, multi-sectoral linkage, and multi-policies synergy” framework should be implemented to balance the species–carbon–water–food–economy functional nexus.
1. Introduction
The natural ecosystems and human social systems are interlinked. The natural ecosystems contribute substantially to human well-being through their various material and non-material contributions [1]. However, human activities have led to environmental changes that affect the quality and stability of ecosystems, reducing the reliability and durability of ecosystem services [2]. A recent “comprehensive planetary health assessment” revealed that six out of nine observed indicators of the Earth’s environmental stability had already surpassed “safe boundaries” [3]. Concurrently, trade-offs between socio-economic development and ecosystem quality enhancement are increasingly prominent. Issues linked to climate change [4], biodiversity loss [5], ecosystem degradation [6], declining ecosystem regulation [7], regional water scarcity [8], and increased risks to food and ecological safety [9] have received much attention. This global pattern is also evident in China, where inputs for staple crop production have driven a burden shift in water and carbon footprints that have already exceeded some provincial Earth’s boundaries [10], and the blue water footprint is expected to exceed the sustainable boundary by 2025 [11].
The socio-ecological system (SES) provides an essential framework for understanding the complex interactions among human beings, social systems, and the environment [12]. Initial studies primarily addressed single elements, such as the impact of biodiversity on ecosystems [13] and the internal functions of the water system [14]. As human disturbance to natural ecosystems has increased, the multi-objective nexus optimization model [15] and the mutual feedback relationships within SES research have provided critical insights toward realizing harmony between human beings and nature, including “water–energy–carbon” [16], “water–energy–food–ecology” [17], and “energy–food–water–air” [18]. In terms of the study area, this has gradually expanded from typical regions [19], watersheds [20] and urban clusters [21] to national and global scales [22,23]. Meanwhile, research methods have also evolved from the early historical reconstruction, in-depth interviews, and questionnaire surveys [24] to interdisciplinary approaches, such as structural equation modelling [25], life-cycle assessment [26], and input-output analysis [27]. Overall, researchers have utilized interdisciplinary approaches at the national scale to conduct research utilizing multi-objective nexus studies, but there is a lack of research combining ecology and economics. Given that socio-economic development derives from the services and products provided by ecosystems, and is also the driver of changes in ecosystem functions and services [28]. Therefore, it is necessary to integrate ecological functions and socio-economic functions and fully explore the trade-offs and synergies within the species–carbon–water–food–economy functional nexus. This will enable economic growth and ecological improvement to be coupled, promoting sustainable regional development.
In response to intensifying ecological problems and the growing demand for natural resources, the three dimensions of development involved, social, economic, and environmental, need to be thoroughly addressed. The United Nations (UN) adopted 17 Sustainable Development Goals (SDGs) in 2015 [29]. However, the latest UN study points out that humankind has seriously deviated from the intended path to achieving the SDGs and is facing serious challenges in several areas, including the economy and ecology, thus indicating the need to realize synergies among the multiple goals [30]. Since species–carbon–water–food–economy are important elements that align with specific SDGs, it is therefore imperative to study the species–carbon–water–food–economy functional nexus from a SES perspective to promote the synergistic achievement of the SDGs [31].
Since 2016, China has combined the implementation of the SDGs with ecosystem governance and high-quality socio-economic development [18]. Remarkable achievements in the SDGs have been made, such as completing the task of poverty alleviation on schedule, maintaining steady economic growth, and continuously improving environmental quality [32]. At present, China is still facing a contradiction between the people’s growing need for a better life and unbalanced and inadequate development [33]. Therefore, there is an urgent need to develop a friendly economy based on ecosystem quality, to change the traditional resource-dependent mode of economic development, and to establish the friendly economy as an important form of national economic development [34]. However, due to China’s vast territory and regional disparities in natural resources and socio-economic development, the coupling degrees between provincial ecosystem quality and economic growth vary considerably [35].
Accordingly, we conducted a multi-functional nexus analysis at provincial level from a SES perspective. The present study aims to (1) construct an evaluation index system of the species protection–carbon sink–water conservation–food supply–economic development functional nexus from a SES perspective to reveal its spatio-temporal patterns and evolutionary characteristics; (2) clarify the trade-offs and synergies among these five types of functions at the provincial level; (3) and propose strategies for their coordinated development based on the analysis of the interactions among policy goals. Overall, these findings can support China’s goals of enhancing ecosystem quality and achieving high-quality economic development.
2. Materials and Methods
2.1. Functional Nexus Linkage Mechanisms
Ecosystems provide essential benefits to human society, including healthy and beneficial organisms, green and renewable energy, clean freshwater, diverse food, fibers and medicinal plants [36]. In particular, human socio-economic development benefits from the species protection, carbon sink, water conservation, and food supply functions. The species protection function is the core and foundation of all ecosystem functions and values, serving as the biological basis for both ecosystem functions and socio-economic development. Moreover, the carbon sink function regulates climate change within the SES, while the water conservation and food supply functions support the development of human society by providing essential and irreplaceable resources for human survival [37].
The ecosystem component–structure–process–function–service relationships and factor–system–environment feedback mechanisms determine the coupling between ecosystems and social systems [34]. Ecosystems are multifunctional, and their functions of species protection, carbon sink, water conservation, and food supply are closely linked to the development of an eco-friendly economy through the flow and consumption of ecosystem products and services to meet human social needs. Finally, the high-quality development and sustainability of socio-economic systems require healthy ecosystems as support, and ecological investments are needed to restore and repair damaged or lost ecosystem services and products, thereby enhancing ecosystem quality and ecological benefits and promoting sustainable socio-economic development (Figure 1).
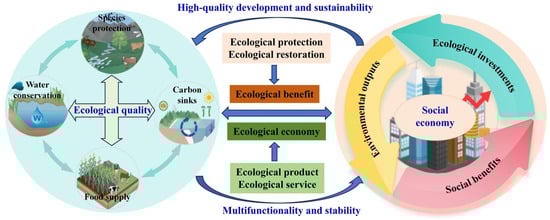
Figure 1.
A framework of functional linkage mechanisms from a SES perspective.
2.2. Ecosystem Functions Evaluation
The evaluation of ecosystem services, such as species protection, carbon sink, water conservation, and food supply, is crucial to human well-being. In general, ecosystem services evaluation methods mainly involve physical quantity and value assessment. The methods for physical quantity evaluation mainly include the energy value method and model-based approaches such as Invest and SoLVES, while value methods mainly used the equivalence factors and functional value methods [38].
Species protection, carbon sink, water conservation, and food supply functions were evaluated based on previous studies and existing methods (Table 1). Specifically, habitat quality was evaluated to reflect biodiversity and represent the species protection function [39]. Vegetation carbon sequestration and oxygen release were evaluated to assess carbon sequestration and represent the carbon sink function [40]. Water retention capacity was evaluated to represent the water conservation function [41], while Normalized Difference Vegetation Index (NDVI) data were used to estimate food supply capacity, representing the food supply function [42].

Table 1.
Evaluation of the four types of ecosystem functions.
2.3. Economic Development Functions Evaluation
2.3.1. Evaluation Indicator System
The economic development involves three aspects of ecological investments, environmental outputs and social benefits [34]. Government investment in ecological restoration aims to produce positive environmental outcomes, such as biodiversity conservation, water security, carbon reduction, and stable food production. These environmental outputs are essential for ensuring sustainable socio-economic development, while social benefits reflect the value of these outputs and the coupling of ecological and social capital. Therefore, to stabilize ecosystem functions like species protection, carbon sink, water conservation, and food supply, an evaluation index system for the economic development functions was constructed based on the “investment–output–benefit” perspective [43].
In terms of ecological investments, indicators such as investment in ecological construction and protection, expenditure on energy conservation and environmental protection, investment in drainage and pollution control, and the growth rate of investment in agriculture, forestry, animal husbandry and fishery were selected to characterize inputs into ecosystem functions, including species protection, carbon sink, water conservation, and food supply. For environmental outputs, forest and grass cover, carbon emission intensity, the proportion of Classes I–III water quality sections, and the growth rate of primary industry output were selected. Meanwhile, per capita GDP, per capita disposable income, Gini coefficient, and urban–rural consumption ratio were selected to characterize the differences in socio-economic development (Table 2).
Table 2.
Evaluation of the economic development functions.
2.3.2. Measurement of Economic Development Functions
The entropy method is commonly used in multi-indicator evaluations to determine weights based on data entropy [21]. To address the varied dimensions of the indicators, this study applied range standardization for normalization.
where represents the evaluation value for each indicator, and represent the maximum and minimum values for the indicator, and represents the standardized value for each indicator.
The entropy method determined the weights (Table 2), quantifying the levels of ecological investments, environmental outputs, and social benefits. Their weighted summation characterizes the economic development function of social systems.
where represent the levels of ecological investments, environmental outputs, and social benefits, represents the weights of each indicator, represents the standardized values of each indicator, represents the economic development function, and represents the weights of the three dimensions. In this study, we set the weights of the three dimensions equally.
2.4. Functional Nexus Trade-Offs and Synergies
The Pearson analysis method is widely used to study trade-offs and synergies in ecological research [44]. This study analyzed the trade-offs and synergies between species–carbon–water–food–economy functions at the provincial level using Pearson correlation.
where represents the correlation coefficient, and represent the two factors, and represents the number of samples. When is positive, it indicates a synergy between the two functions; when is negative, it indicates a trade-off between them.
Bivariate spatial autocorrelation analysis has been widely applied to reveal the clustering and differentiation relationships between variables [45]. This study applied bivariate local Moran’s I to analyze the spatial distribution characteristics of trade-offs and synergies among provincial functions.
where represents the local Moran’s I, represents the number of spatial units, and represent function values, and represents the spatial weight matrix.
2.5. Redundancy Analysis
Redundancy analysis (RDA) can identify correlations between response variables and explanatory variables [46]. In a two-dimensional ordination, smaller angles indicate stronger correlations, and longer projections suggest more significant impacts. Angles of less than 90° indicate positive correlations, angles of more than 90° indicate negative correlations, and angles of around 90° indicate weak relationships. This study used Canoco software (Version 5.0) to analyze the relationships between economic development functions (ecological investments, environmental outputs, and social benefits) and the ecosystem functions of species–carbon–water–food.
2.6. Functional Policy Goals
China’s governmental model of “compartmentalization relationship” determines the top-down and territorial management strategies for species protection, carbon sink, water conservation, food supply, and economic development [47]. The intersection of sectoral functions and policies inevitably leads to synergies or trade-off effects between policy goals.
Based on the summarization of important national and sectoral policy documents, policy sub-goals under the functional nexus were identified from the perspectives of species protection, carbon sink, water conservation, food supply and economic development (Appendix A Table A1). In terms of the species protection function, the corresponding policies mainly focus on monitoring and protecting endangered species, managing invasive species, promoting technological progress, and improving ecosystem quality. In terms of the carbon sink function, the corresponding policies mainly focus on energy transition, green consumption, and carbon sequestration. In terms of the water conservation function, the corresponding policies mainly focus on water resource protection and allocation, utilization efficiency, and pollution prevention. In terms of the food supply function, the corresponding policies mainly focus on farmland protection, food security, agricultural technology application, and waste recycling. In terms of the economic development function, the corresponding policies mainly focus on green finance, smart tourism, ecological value realization, and the new energy industry (Appendix A Table A1).
2.7. Data Sources
The data used in this study included land use, vegetation, meteorological, soil, and statistical data (Table 3). All raster data were resampled to 1000 m spatial resolution and projected using the China Albers Equal Area Conic system.
Table 3.
Data description and sources.
3. Results
3.1. Temporal Variation
From 2000 to 2020, the ecosystem species protection function showed an increased and then decreased trend, while the carbon sink, water conservation, and food supply functions showed an overall upward fluctuation (Figure 2a). Specifically, the carbon sink function increased by a total of 7.70 × 10⁸ t, with an average increase rate of 16.78%. The water conservation and food supply functions increased by 7.10 × 10¹⁰ m3 and 5.10 × 10⁸ t, respectively, with average increase rates of 10.27% and 48.57%, respectively (Figure 2a).
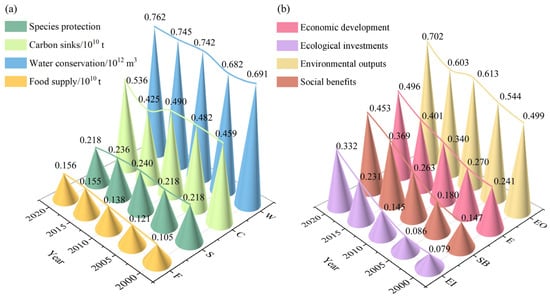
Figure 2.
Temporal variations in ecosystem functions (a) and economic development functions (b) from 2000 to 2020. Note: S: Species protection, C: Carbon sink, W: Water conservation, F: Food supply; E: Economic development, EI: Ecological investments, EO: Environmental outputs, SB: Social benefits.
From 2000 to 2020, the economic development function, as well as its ecological investments, environmental outputs, and social benefits, all showed an upward trend (Figure 2b). In particular, the economic development function increased from 0.241 to 0.496, with an increase of 1.06 times. Ecological investments, environmental outputs, and social benefits increased from 0.079 to 0.332, from 0.499 to 0.702, and from 0.147 to 0.453, respectively, representing increases of 3.20, 0.41, and 2.08 times, respectively (Figure 2b).
3.2. Spatio-Temporal Patterns
3.2.1. Spatio-Temporal Patterns of Ecosystem Functions
From 2000 to 2020, the ecosystem functions differed significantly across the Hu Huanyong Line (Hu Line), which connects Heihe City in Heilongjiang Province and Tengchong City in Yunnan Province (Figure 3). The species protection function showed a pattern of “higher in northwest, and lower in southeast,” while the carbon sink, water conservation, and food supply functions showed a trend of “higher in southeast, and lower in northwest” (Figure 3).
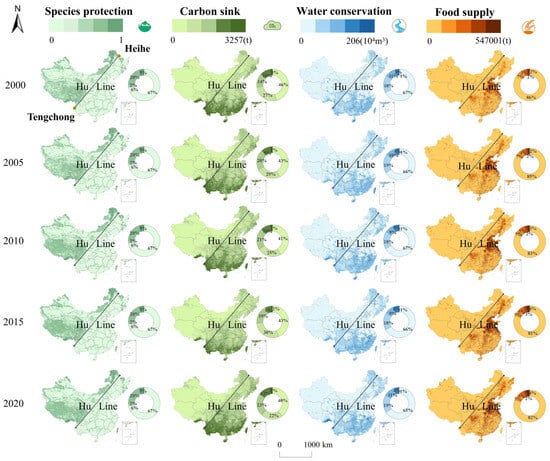
Figure 3.
Spatio-temporal patterns of ecosystem functions from 2000 to 2020.
In particular, the areas with high-value of the species protection function accounted for 25%, were primarily located in the “Three-North Shelter Forest” and the Tibetan Plateau, while 73% of the areas with low-value were mainly located in the eastern coastal region (Figure 3). High-value areas for the carbon sink function fluctuated around 10%, and were mainly concentrated in Yunnan, Inner Mongolia, and Heilongjiang provinces, whereas low-value areas accounted for about 70% and were mainly concentrated in Shanghai, Tianjin, and Ningxia provinces (Figure 3). The water conservation function in high-value areas covered approximately 15%, mainly located in Heilongjiang, Guizhou, and Yunnan provinces, while low-value areas fluctuated around 70%, mainly appeared in the Tibetan Plateau, Ningxia, Xinjiang, and Gansu provinces (Figure 3). The food supply function in high-value areas fluctuated around 7%, and was mainly concentrated in the traditional main grain-producing areas, such as the Huang-Huai-Hai Plain, the Northeast Plain, the Jianghan Plain, the Sichuan Basin, and some areas in the western oases (Figure 3).
3.2.2. Spatio-Temporal Patterns of Economic Development Functions
From 2000 to 2020, the economic development functions improved with significant spatio-temporal differences (Figure 4). The economic development function and its ecological investments and social benefits showed a pattern of “higher in southeast, and lower in northwest,” while the level of environmental outputs shifted towards “higher in southwest, and lower in central-east” (Figure 4). The proportion of provinces with high-value economic development function and its ecological investments, environmental outputs, and social benefits increased from 0% to 84%, 0% to 23%, 10% to 58%, and 0% to 55%, respectively. Conversely, the proportion of provinces with low-value economic development function and its ecological investments, environmental outputs, and social benefits decreased from 81% to 0%, 100% to 19%, 71% to 26%, and 100% to 13%, respectively (Figure 4).
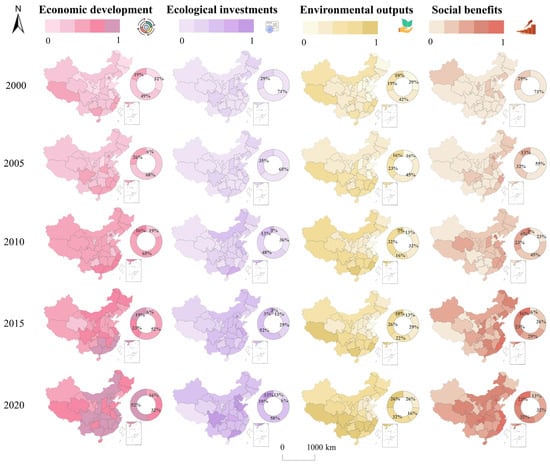
Figure 4.
Spatio-temporal patterns of economic development functions from 2000 to 2020.
The high-value regions of the economic development function were concentrated in southern provinces such as Hunan, Guangxi, and Zhejiang, while the low-value regions were found in western provinces such as Ningxia, Gansu, and Xinjiang (Figure 4). The high-value regions of ecological investments were concentrated in provinces like Sichuan, Guangdong, Shandong, and Hebei, while low-value regions of ecological investments were concentrated on the Tibetan Plateau (Figure 4). The environmental outputs peaked in southwestern provinces such as Guangxi and Sichuan, while they were lower in eastern provinces such as Shandong, Jiangsu, and Beijing (Figure 4). The social benefits were highest in provinces like Shanghai and Beijing, and lowest in the western Xinjiang and Tibet provinces (Figure 4).
3.3. Trade-Offs and Synergies Among Different Functions
From 2000 to 2020, in terms of the interrelationships among ecosystem functions, synergies between species protection and each of carbon sink and water conservation were strengthened, with correlation coefficients exceeding 0.3 and 0.4, respectively (Figure 5a,b). In contrast, trade-off between species protection and food supply was weakened. Carbon sink was synergized with water conservation and food supply, with correlation coefficients exceeding 0.8 for water conservation. Water conservation shifted from a trade-off to a synergistic relationship with food supply (Figure 5a,b).
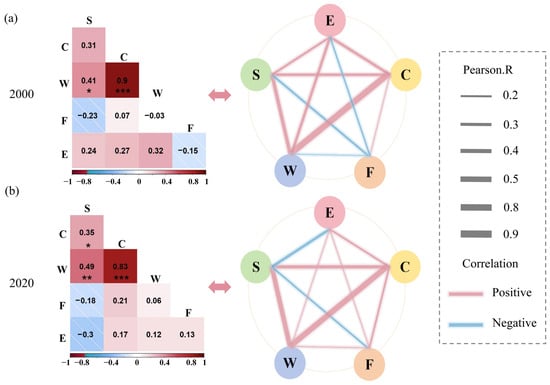
Figure 5.
Trade-offs and synergies among different functions from 2000 (a) to 2020 (b) (* p < 0.05; ** p < 0.01; *** p < 0.001). Note: S: Species protection, C: Carbon sink, W: Water conservation, F: Food supply, E: Economic development.
In terms of the interrelationship between ecosystem and economic development functions, a shift from synergy to trade-off was found between species protection and economic development (Figure 5a,b). Conversely, the relationship between food supply and economic development was shifted from trade-off to synergy. In addition, weakened synergies were found between economic development and each of carbon sink and water conservation (Figure 5a,b).
Spatially, in terms of the interrelationships among ecosystem functions, trade-offs between species protection and each of carbon sink, water conservation, and food supply were observed mainly in Xinjiang and Hubei provinces, while synergies were concentrated in Chongqing Municipality (Figure 6). Synergies between carbon sink and each of water conservation and food supply occurred in Gansu, Inner Mongolia, Heilongjiang, Guangdong, Fujian, and Zhejiang provinces, while trade-offs occurred in Ningxia and Shanxi provinces. Synergies between water conservation and food supply were most significant in Yunnan Province (Figure 6).
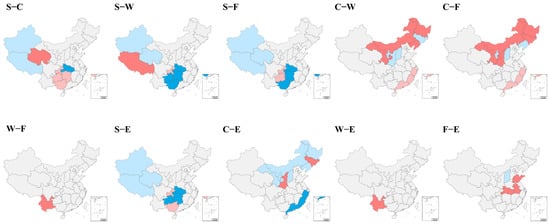
Figure 6.
Spatial distribution of functional trade-offs and synergies from 2000 to 2020. Note: S: Species protection, C: Carbon sink, W: Water conservation, F: Food supply, E: Economic development; S–C: Trade-offs and synergies between species protection and carbon sink, and so on.
In terms of the interrelationships between ecosystem and economic development functions, trade-offs between species protection and economic development occurred mainly in Xinjiang, Tibet, and Hunan provinces, while synergies occurred in Chongqing Municipality and Guangxi Province (Figure 6). Trade-offs between carbon sink and economic development appeared mainly in Gansu, Inner Mongolia, and Guangdong provinces, while synergies appeared in Shaanxi and Jilin provinces. In addition, synergies between water conservation and economic development occurred in Yunnan Province, and synergies between food supply and economic development occurred in Hubei, Shandong, and Anhui provinces (Figure 6).
3.4. Redundancy Analysis of SES
The RDA explanatory power of social systems over ecosystems was 52.5%, 59.7%, and 59.1% in 2000, 2010, and 2020, respectively (Figure 7). From 2000 to 2020, ecological investments had a positive effect on food supply, but had negative effects on species protection and carbon sink. Environmental outputs had positive effects on species protection, carbon sink, and water conservation, with the largest impact on water conservation, while a negative impact on food supply was found. Social benefits had a positive effect on food supply, but had negative impacts on species protection, carbon sink, and water conservation (Figure 7).
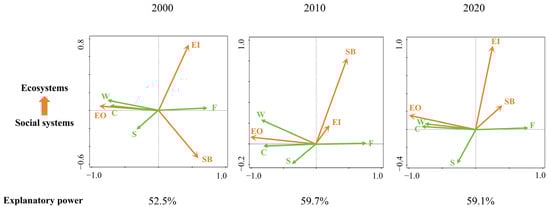
Figure 7.
Redundancy analysis of SES from 2000 to 2020. Note: S: Species protection, C: Carbon sink, W: Water conservation, F: Food supply; EI: Ecological investments, EO: Environmental outputs, SB: Social benefits.
3.5. Trade-Offs and Synergies Among Policy Goals
The interactions among policy goals showed synergies, trade-offs, or both positive and negative effects (Figure 8). Overall, the relationships between the policy goals were mainly characterized by synergies. Trade-offs were mainly found between water conservation and each of carbon sink and economic development, as well as between species protection and food supply. Specifically, water utilization (W3, W4) traded off with carbon sequestration capacity enhancement (C4), water utilization and development (W3) traded off with new energy industry development (E4), and species protection (S2) traded off with farmland protection (F1). Within the food supply function, trade-offs occurred between farmland protection (F1) and grain for green (F2) (Figure 8).
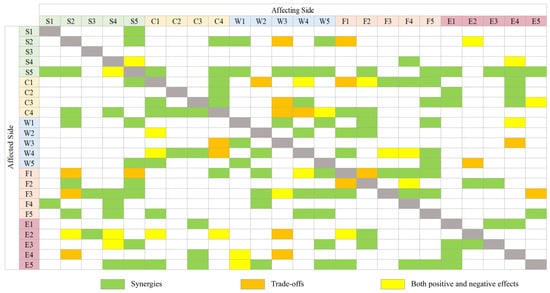
Figure 8.
The interrelationship among the policy goals of the five functions. Note: S1–S5: The policy goals of species protection; C1–C4: The policy goals of carbon sink; W1–W5: The policy goals of water conservation; F1–F5: The policy goals of food supply; E1–E5: The policy goals of economic development.
4. Discussion
4.1. Functional Evolution Characteristics
In terms of ecosystem functions, previous studies have indicated that human activities, including urbanization, agriculture, industry, mining, and energy use, have severely impacted the Earth’s critical zone, accelerated biodiversity loss, and caused fluctuations in the species protection function [48]. The fluctuating trend of increased and then decreased species protection function was also found in our study (Figure 2a). China has invested heavily in protecting and restoring natural capital since 2000, and has strengthened the regional supply of ecosystem services [49]. We also found similar results, with increases in the carbon sink, water conservation, and food supply functions from 2000 to 2020 (Figure 2a). It is worth noting that ecosystem functions exhibited significant spatial heterogeneity across the Hu Line (Figure 3). This is closely linked to the regional disparities in resource endowments. It is widely known that species protection and carbon sink are related to land cover types [50]. Grasslands in China’s northwest enhance species protection, while forests in the south, particularly in Yunnan Province, exhibit stronger carbon sink capabilities. Water conservation is primarily influenced by precipitation and evapotranspiration [51], which results in the high-value areas being located in the tropical-subtropical monsoon regions, including provinces such as Heilongjiang, while low-value areas occur in the arid Tibetan Plateau and temperate regions, including provinces such as Ningxia. Topographic conditions and farmland distribution affect food supply [44]. The southeast with plains and hills supporting agricultural production, maintains superior farmland resources that sustain main grain-producing areas, while the northwest exhibits limited agricultural suitability due to arid climates, mountainous terrain, and fragmented farmland distribution.
In terms of economic development functions, an increasing trend was found in all three aspects of ecological investments, environmental outputs, and social benefits (Figure 2b). The increased issuance of green finance, such as ecological investments, from 2001 to 2020 has increased funding for eco-friendly initiatives [52]. Ecological investments have shown positive trends in favor of preserving natural wealth [53], accompanied by increases in environmental outputs such as forest and grass cover. At the same time, social benefits have increased along with the level of investments and outputs, such as improved community livelihoods from tree planting and agroforestry restoration [54]. In addition, the “higher in southeast, and lower in northwest” spatial distribution pattern of China’s economic development, ecological investments, and social benefits (Figure 4) is consistent with the spatial pattern of ecosystem service value [55]. For instance, Yunnan Province has enhanced its economic development functions by increasing the ecological service value generated by the Grain for Green Program [56]. Meanwhile, ecosystem services play a critical role in shaping the distribution of environmental outputs with a pattern of “higher in southwest, and lower in the central-east” (Figure 4). This finding is supported by previous results showing that high ecological quality areas are predominantly located in the southwestern region [57]. In regions such as Shandong Province, the supply-demand relationship for ecosystem services is strained, resulting in suboptimal environmental output levels [58].
4.2. Functional Trade-Offs and Synergies
At the provincial scale, the relationships between ecosystem functions and social system functions tended to be synergistic, but trade-offs still existed (Figure 5). Before 2000, China’s large-scale economic development caused serious SES problems, such as environmental pollution and significant regional disparities in socio-economic growth. However, with a shift in government focus and the successive implementation of ecological restoration projects, ecosystem protection and economic development have been balanced to some extent [59]. Programs such as the Western Development Initiative, which began in 2000, and the targeted poverty alleviation carried out in recent years have promoted regional ecological protection and high-quality socio-economic development [60]. However, conflicts within ecosystem functions and between ecological conservation and economic growth still persist [61]. In this study, the trade-offs between food supply and species protection, water conservation, and economic development were most evident (Figure 5). This suggests that food production in China has resulted in certain socio-ecological problems. Specifically, although investment in agriculture has increased food supply, it has also led to environmental impacts [62], and continued agricultural expansion and intensification have accelerated habitat loss and led to biodiversity decline [63].
In Xinjiang and Hubei provinces, species protection showed trade-offs with carbon sink, water conservation, food supply, and economic development, while Chongqing Municipality exhibited synergies (Figure 6). Chongqing’s complex topography and abundance of natural resources facilitate synergistic socio-ecological system functions [64]. However, the trade-offs of ecosystem services in Xinjiang Province result from urbanization, ecological engineering, and climate change, especially as economic development has accelerated grassland degradation and habitat loss, leading to a decline in biodiversity and highlighting these trade-offs [65]. Additionally, the trade-offs in Hubei, Ningxia, and Shanxi provinces (Figure 6) highlight the conflict between resource utilization and protection, requiring a balance between ecological preservation and economic development to enhance ecosystem service efficiency.
4.3. Coordinate the Five-Pool Functional Nexus of SES
The trade-offs and synergies between species protection, carbon sink, water conservation, food supply, and economic development functions reflect the interconnectedness of the SES, and, in particular, the significant impact of economic development functions on ecosystem functions (Figure 5 and Figure 7). The species–carbon–water–food–economy functional nexus is a cross-sectoral methodological approach for the sustainable development of SES [66]. There existed a trade-off and synergistic relationship among the policy goals of the five functions (Figure 8). Recognizing these trade-offs and promoting targeted policy coordination can promote the synergistic development of the ecosystem functions and social system functions [67].
Natural ecosystems are pools of biological genes and species of the Earth’s living systems, as well as pools of green organic carbon and clean freshwater resources. Biologically healthy ecosystems with a suitable climate, clean water, and fertile soil serve as the pools for supplying human beings with the means of subsistence and food resources [36]. Through the comprehensive management and operation of the ecosystem’s “species pool, carbon pool, water pool and food pool,” the development of a friendly economy will increase the economic pool and realize the goal of “lucid waters and lush mountains are invaluable assets” [37]. The integration of the species–carbon–water–food–economy pool functions provides a comprehensive and coordinated response to the major challenges of global biodiversity protection, global climate change, global water crisis, global food crisis and global poverty alleviation [68] (Figure 9).
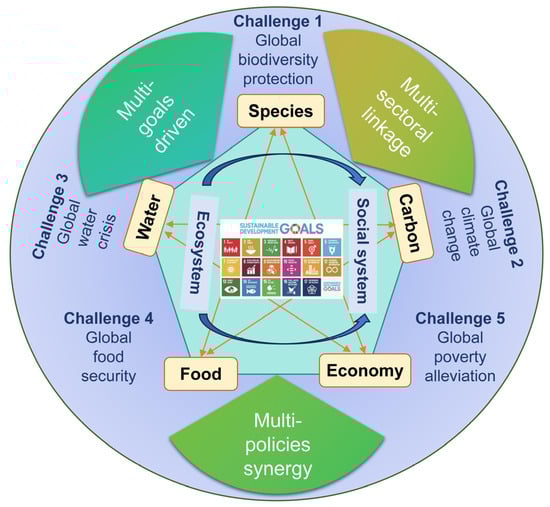
Figure 9.
Coordination framework of the species–carbon–water–food–economy pool functions.
China’s government has set a number of development goals to address the socio-ecological challenges facing humanity [69]. This requires economic development and ecological quality improvement to go hand in hand in order to realize the coordinated development of the five-pool functions. As the policies related to the five-pool functions fall under different sectors, a framework of “multi-goals driven, multi-sectoral linkage, and multi-policies synergy” is proposed to manage the species–carbon–water–food–economy functional nexus (Figure 9). Under multi-goals guidance, collaboration among the National Development and Reform Commission, the Ministry of Agriculture and Rural Affairs, the Ministry of Ecology and Environment, the Ministry of Natural Resources, the National Energy Administration, and the National Forestry and Grassland Administration is necessary [70]. Specifically, the Ministry of Agriculture promotes green agriculture and waste resource utilization [71], the Ministry of Natural Resources focuses on land resource allocation and ecological protection [72], and the National Food and Strategic Reserves Administration ensures food security and supports the green transformation of food production [73]. Various sectors collaborate within their functions to promote the formulation and implementation of policies on the protection of ecological red lines, the optimal allocation of soil and water resources, green transformation and development, and food security [74]. The trade-offs and circumventions between policy goals are conducive to the promotion of cross-sectoral policies that complement and coordinate each other, maximizing the efficacy of resource utilization, and promote the sustainable development of the species–carbon–water–food–economy pool functions [75] (Figure 9).
Guided by the integrated five-pool framework, differentiated provincial strategies are proposed for regions at different stages of development to achieve sustainable development of the SES. In provinces dominated by trade-offs, such as Xinjiang, Hubei, Ningxia, and Shanxi (Figure 6), institutional reforms are needed to ease sectoral interest conflicts, reduce resource allocation pressures, build ecological property rights and compensation systems, enhance cross-regional governance, and apply policy tools that reconcile or circumvent goal conflicts, thereby achieving a balance between industrial transition and ecological protection [76]. For example, in Xinjiang Province, the trade-offs between upstream and downstream ecosystem services along the Tarim River highlight the need for equitable ecological compensation and governance strategies to achieve cross-regional balance [65]. In provinces showing both trade-offs and synergies, such as Tibet, Qinghai, and Guizhou (Figure 6), an institutional framework for ecological value realization and benefit sharing should be developed by linking the public good attributes of ecological products to market mechanisms, advancing land property rights reform, improving green industry incentives, and enabling stakeholders to secure equitable returns from functional synergies [77]. In Guizhou Province, relocation for poverty alleviation promotes benefit-sharing between origin and destination areas, achieving sustainable socio-ecological development [78]. In provinces primarily characterized by synergies, such as Chongqing, Yunnan, Anhui, and Shandong (Figure 6), regional specialization and institutional integration are required to promote the coordinated reproduction of the five pools, remove allocation barriers, refine property rights systems, industrialization mechanisms, benefit-sharing arrangements, and cross-regional factor flow rules to enhance system-wide synergies [79].
5. Conclusions
This study analyzed the spatio-temporal patterns and interrelationships of ecosystem and economic development functions across China’s provinces from a SES perspective, and proposed a “multi-goals driven, multi-sectoral linkage, and multi-policies synergy” framework for coordinated management. Key findings summarize that ecosystem functions and economic development functions exhibited distinct spatial distributions across provinces, reflecting regional differences in ecological capacity and socio-economic development. Synergies predominated among most functions, while trade-offs, particularly between species protection and food supply, existed and varied across regions. Coupling analysis indicated mutual constraints between SES. The observed interactions emphasized the necessity of integrated management of multiple functions to balance ecological conservation and economic development. Recognizing trade-offs and promoting coordinated policies can further enhance the sustainability of SES. These findings advance the theoretical understanding of functional linkages within SES, demonstrating the importance of coordinated management across ecological and socio-economic domains. Nevertheless, the mechanisms driving these interdependencies remain insufficiently understood. Future research should focus on elucidating the dynamic mechanisms underlying the five-pool functions and explicitly incorporate political economy perspectives to evaluate the influence of policy trade-offs on ecological and economic outcomes. Such insights will inform the development of integrated policies that reconcile competing objectives, optimize resource allocation, and promote sustainable development at national and global scales.
Author Contributions
Conceptualization, Y.W.; Methodology, Y.L., Y.W. and P.L.; Software, Y.L.; Validation, Y.L.; Formal analysis, Y.L.; Resources, Y.W.; Data curation, Y.L. and P.L.; Writing—original draft, Y.L. and Y.W.; Writing—review & editing, Y.W. and P.L.; Supervision, Y.W.; Funding acquisition, Y.W. All authors have read and agreed to the published version of the manuscript.
Funding
This research was funded by National Natural Science Foundation of China, grant number 42271275.
Data Availability Statement
Data are contained within the article.
Conflicts of Interest
The authors declare no conflicts of interest.
Appendix A
Table A1.
The policy goals of the five functions.
Table A1.
The policy goals of the five functions.
| Functions | Dimensions | Policy Goals |
|---|---|---|
| Species protection | S1 | Improve biodiversity monitoring and establish the regulatory system |
| S2 | Protect wild, rare, and endangered species | |
| S3 | Enhance the management and control of invasive alien species | |
| S4 | Improve the biotechnological level of germplasm resource variety improvement | |
| S5 | Protect natural resources, reduce environmental pollution, and enhance ecosystem quality and stability | |
| Carbon sink | C1 | Promote clean production and the transformation of traditional energy industries |
| C2 | Significant improvement in utilization efficiency | |
| C3 | Promote green and low-carbon consumption patterns | |
| C4 | Enhance the carbon sequestration capacity of ecosystems | |
| Water conservation | W1 | Ensure the safety of centralized drinking water sources |
| W2 | Optimize the water resource allocation pattern and improve allocation efficiency | |
| W3 | Control the total water resource utilization and development intensity | |
| W4 | Improve the utilization efficiency | |
| W5 | Strengthen water pollution prevention and control | |
| Food supply | F1 | Strictly adhere to the farmland red line and build high-standard farmland |
| F2 | Convert farmland back to forests and grasslands | |
| F3 | Ensure stable food supply and prices | |
| F4 | Implement the “Technology-Driven Grain” initiative | |
| F5 | Enhance the capacity for agricultural waste recycling | |
| Economic development | E1 | Increase fiscal and tax support and develop green finance |
| E2 | Develop smart tourism | |
| E3 | Strengthen the management of natural resource assets and improve the mechanism for realizing the value of ecological products | |
| E4 | Vigorously develop the new energy industry | |
| E5 | Increase the added value of agricultural products |
References
- Huynh, L.T.M.; Gasparatos, A.; Su, J.; Lam, R.D.; Grant, E.I.; Fukushi, K. Linking the nonmaterial dimensions of human-nature relations and human well-being through cultural ecosystem services. Sci. Adv. 2022, 8, eabn8042. [Google Scholar] [CrossRef]
- Hautier, Y.; Tilman, D.; Isbell, F.; Seabloom, E.W.; Borer, E.T.; Reich, P.B. Anthropogenic environmental changes affect ecosystem stability via biodiversity. Science 2015, 348, 336–340. [Google Scholar] [CrossRef]
- Richardson, K.; Steffen, W.; Lucht, W.; Bendtsen, J.; Cornell, S.E.; Donges, J.F.; Drüke, M.; Fetzer, I.; Bala, G.; von Bloh, W.; et al. Earth beyond six of nine planetary boundaries. Sci. Adv. 2023, 9, eadh2458. [Google Scholar] [CrossRef]
- Zhang, W.X.; Zhou, T.J.; Wu, P.L. Anthropogenic amplification of precipitation variability over the past century. Science 2024, 385, 427–432. [Google Scholar] [CrossRef]
- Weiskopf, S.R.; Isbell, F.; Arce-Plata, M.I.; Di Marco, M.; Harfoot, M.; Johnson, J.; Lerman, S.B.; Miller, B.W.; Morelli, T.L.; Mori, A.S.; et al. Biodiversity loss reduces global terrestrial carbon storage. Nat. Commun. 2024, 15, 4354. [Google Scholar] [CrossRef]
- Zhou, G.Y.; Eisenhauer, N.; Terrer, C.; Eldridge, D.J.; Duan, H.M.; Guirado, E.; Berdugo, M.; Zhou, L.Y.; Liu, S.G.; Zhou, X.H.; et al. Resistance of ecosystem services to global change weakened by increasing number of environmental stressors. Nat. Geosci. 2024, 17, 882–888. [Google Scholar] [CrossRef]
- Pereira, H.M.; Martins, I.S.; Rosa, I.M.D.; Kim, H.J.; Leadley, P.; Popp, A.; van Vuuren, D.P.; Hurtt, G.; Quoss, L.; Arneth, A.; et al. Global trends and scenarios for terrestrial biodiversity and ecosystem services from 1900 to 2050. Science 2024, 384, 458–465. [Google Scholar] [CrossRef] [PubMed]
- Liu, J.; Li, D.L.; Chen, H.; Wang, H.; Wada, Y.; Kummu, M.; Gosling, S.N.; Yang, H.; Pokhrel, Y.; Ciais, P. Timing the first emergence and disappearance of global water scarcity. Nat. Commun. 2024, 15, 7129. [Google Scholar] [CrossRef]
- Li, K.K.; Yang, J.Y.; Wang, J.Y.; Wang, Z.; Zeng, Y.; Borrelli, P.; Hubacek, K.; Hu, Y.C.; Xu, B.D.; Fang, N.F.; et al. Human-altered soil loss dominates nearly half of water erosion in China but surges in agriculture-intensive areas. One Earth 2024, 7, 2008–2018. [Google Scholar] [CrossRef]
- Feng, B.B.; Zhuo, L.; Mekonnen, M.M.; Marston, L.T.; Yang, X.; Xu, Z.H.; Liu, Y.L.; Wang, W.; Li, Z.B.; Li, M.; et al. Inputs for staple crop production in China drive burden shifting of water and carbon footprints transgressing part of provincial planetary boundaries. Water Res. 2022, 221, 118803. [Google Scholar] [CrossRef] [PubMed]
- Shi, S.H.; Zhou, S.W.; Lei, Y.D.; Harrison, M.T.; Liu, K.; Chen, F.; Yin, X.G. Burgeoning food demand outpaces sustainable water supply in China. Agric. Water Manag. 2024, 301, 108936. [Google Scholar] [CrossRef]
- Zhang, H.; Deng, W.; Zhang, S.Y.; Wang, Z.Y. Multiscale geospatial transitions and sustainable strategies for mountainous urban agglomerations: From the perspective of social–ecological systems. Cities 2025, 169, 106560. [Google Scholar] [CrossRef]
- Hooper, D.U.; Adair, E.C.; Cardinale, B.J.; Byrnes, J.E.K.; Hungate, B.A.; Matulich, K.L.; Gonzalez, A.; Duffy, J.E.; Gamfeldt, L.; O’Connor, M.I. A global synthesis reveals biodiversity loss as a major driver of ecosystem change. Nature 2012, 486, 105–108. [Google Scholar] [CrossRef] [PubMed]
- de Graaf, I.E.M.; Gleeson, T.; van Beek, L.P.H.; Sutanudjaja, E.H.; Bierkens, M.F.P. Environmental flow limits to global groundwater pumping. Nature 2019, 574, 90–94. [Google Scholar] [CrossRef] [PubMed]
- Yue, Q.; Wu, H.; Wang, Y.Z.; Guo, P. Achieving sustainable development goals in agricultural energy-water-food nexus system: An integrated inexact multi-objective optimization approach. Resour. Conserv. Recycl. 2021, 174, 105833. [Google Scholar] [CrossRef]
- Li, R.S.; Zhao, R.Q.; Xie, Z.X.; Xiao, L.G.; Chuai, X.W.; Feng, M.Y.; Zhang, H.F.; Luo, H.L. Water-energy-carbon nexus at campus scale: Case of North China University of Water Resources and Electric Power. Energy Policy 2022, 166, 113001. [Google Scholar] [CrossRef]
- Yu, Y.; Bo, Y.; Castelletti, A.; Dumas, P.; Gao, J.Y.; Cai, X.M.; Liu, J.G.; Kahil, T.; Wada, Y.; Hu, S.R.; et al. Transboundary cooperation in infrastructure operation generates economic and environmental co-benefits in the Lancang-Mekong River Basin. Nat. Water 2024, 2, 589–601. [Google Scholar] [CrossRef]
- Zhang, S.; Chen, W.Y.; Zhang, Q.; Krey, V.; Byers, E.; Rafaj, P.; Nguyen, B.; Awais, M.; Riahi, K. Targeting net-zero emissions while advancing other sustainable development goals in China. Nat. Sustain. 2024, 7, 1107–1119. [Google Scholar] [CrossRef]
- Wu, X.T.; Wei, Y.P.; Fu, B.J.; Wang, S.A.; Zhao, Y.; Moran, E.F. Evolution and effects of the social-ecological system over a millennium in China’s Loess Plateau. Sci. Adv. 2020, 6, eabd0276. [Google Scholar] [CrossRef]
- Ji, Q.L.; Feng, X.M.; Sun, S.Q.; Zhang, J.Z.; Li, S.Y.; Fu, B.J. Cross-scale Coupling of Ecosystem Service Flows and Socio-Ecological Interactions in the Yellow River Basin. J. Environ. Manag. 2024, 367, 122071. [Google Scholar] [CrossRef]
- Chen, L.; Yao, Y.; Xiang, K.M.; Dai, X.A.; Li, W.Y.; Dai, H.; Lu, K.; Li, W.L.; Lu, H.; Zhang, Y.; et al. Spatial-temporal pattern of ecosystem services and sustainable development in representative mountainous cities: A case study of Chengdu-Chongqing Urban Agglomeration. J. Environ. Manag. 2024, 368, 122261. [Google Scholar] [CrossRef] [PubMed]
- Li, F.; Yin, X.; Shao, M. Natural and anthropogenic factors on China’s ecosystem services: Comparison and spillover effect perspective. J. Environ. Manag. 2022, 324, 116064. [Google Scholar] [CrossRef] [PubMed]
- Li, G.D.; Fang, C.L.; Watson, J.E.M.; Sun, S.; Qi, W.; Wang, Z.B.; Liu, J.G. Mixed effectiveness of global protected areas in resisting habitat loss. Nat. Commun. 2024, 15, 8389. [Google Scholar] [CrossRef] [PubMed]
- de Vos, A.; Biggs, R.; Preiser, R. Methods for understanding social-ecological systems: A review of place-based studies. Ecol. Soc. 2019, 24, 16. [Google Scholar] [CrossRef]
- Li, S.; Yu, D.; Li, X. Exploring the impacts of ecosystem services on human well-being in Qinghai Province under the framework of the sustainable development goals. J. Environ. Manag. 2023, 345, 118880. [Google Scholar] [CrossRef]
- Zhang, Y.J.; Wang, Q.S.; Tian, S.; Xu, Y.; Yuan, X.L.; Ma, Q.; Xu, Y.; Yang, S.; Zhang, H.B.; Liu, C.Q. Evaluation and optimization of five straw energy utilization modes based on the improved emergy-based life cycle assessment (EmLCA-II) method. Energy Convers. Manag. 2023, 298, 117764. [Google Scholar] [CrossRef]
- Wang, X.Z.; Zhang, W.L.; Li, Y.; Tong, J.X.; Yu, F.; Ye, Q.L. Impacts of water constraints on economic outputs and trade: A multi-regional input-output analysis in China. J. Clean. Prod. 2024, 434, 140345. [Google Scholar] [CrossRef]
- Qiu, J.Q.; Yu, D.Y.; Huang, T. Influential paths of ecosystem services on human well-being in the context of the sustainable development goals. Sci. Total Environ. 2022, 852, 158443. [Google Scholar] [CrossRef]
- Xiao, H.J.; Bao, S.; Ren, J.Z.; Xu, Z.C.; Xue, S.; Liu, J.G. Global transboundary synergies and trade-offs among Sustainable Development Goals from an integrated sustainability perspective. Nat. Commun. 2024, 15, 500. [Google Scholar] [CrossRef]
- Huang, L.; Swain, R.B.; Jeppesen, E.; Cheng, H.; Zhai, P.M.; Gu, B.J.; Barceló, D.; Lu, J.H.; Wei, K.; Luo, L.; et al. Harnessing science, technology, and innovation to drive synergy between climate goals and the SDGs. Innovation 2024, 5, 100693. [Google Scholar] [CrossRef]
- Wu, X.T.; Fu, B.J.; Wang, S.; Song, S.; Li, Y.J.; Xu, Z.C.; Wei, Y.P.; Liu, J.G. Decoupling of SDGs followed by re-coupling as sustainable development progresses. Nat. Sustain. 2022, 5, 452–459. [Google Scholar] [CrossRef]
- Fu, B.J.; Zhang, J.Z. Progress and challenges of Sustainable Development Goals (SDGs) in the World and in China. Bull. Chin. Acad. Sci. 2024, 39, 804–808. [Google Scholar] [CrossRef]
- Zhang, J.S. A survey on income inequality in China. J. Econ. Lit. 2021, 59, 1191–1239. [Google Scholar] [CrossRef]
- Wang, Y.S.; Yu, G.R. Ecosystem quality-based management and the development of a new eco-friendly economy. Innovation 2023, 4, 100491. [Google Scholar] [CrossRef]
- Zhang, Y.K.; Wang, Y.S. How does urbanization evolve heterogeneously in urbanized, urbanizing, and rural areas of China? Insights from ecosystem service value. Geogr. Sustain. 2024, 6, 100254. [Google Scholar] [CrossRef]
- Yu, G.R.; Wang, Y.S.; Yang, M. Discussion on the ecological theory and technological approaches of ecosystem quality improvement and stability enhancement. Chin. J. Appl. Ecol. 2023, 34, 1–10. [Google Scholar] [CrossRef]
- Yu, G.R.; Yang, M.; Hao, T.X. Coordinate the five-pool functions of ecosystem and build strong national ecological infrastructures-Ecological construction ideology, tasks and goals in the new developing era of China. Bull. Chin. Acad. Sci. 2022, 37, 1534–1538. [Google Scholar] [CrossRef]
- Ma, Y.; Yang, J. A review of methods for quantifying urban ecosystem services. Landscape Urban Plan. 2025, 253, 105215. [Google Scholar] [CrossRef]
- Terrado, M.; Sabater, S.; Chaplin-Kramer, B.; Mandle, L.; Ziv, G.; Acuña, V. Model development for the assessment of terrestrial and aquatic habitat quality in conservation planning. Sci. Total Environ. 2016, 540, 63–70. [Google Scholar] [CrossRef] [PubMed]
- Wang, J.L.; Zhou, W.Q.; Pickett, S.T.A.; Yu, W.J.; Li, W.F. A multiscale analysis of urbanization effects on ecosystem services supply in an urban megaregion. Sci. Total Environ. 2019, 662, 824–833. [Google Scholar] [CrossRef]
- Ouyang, Z.Y.; Song, C.S.; Zheng, H.; Polasky, S.; Xiao, Y.; Bateman, I.J.; Liu, J.G.; Ruckelshaus, M.; Shi, F.Q.; Xiao, Y.; et al. Using gross ecosystem product (GEP) to value nature in decision making. Proc. Natl. Acad. Sci. USA 2020, 117, 14593–14601. [Google Scholar] [CrossRef] [PubMed]
- Zhang, X.R.; Wang, Y.S.; Yuan, X.F.; Shao, Y.J.; Bai, Y. Identifying ecosystem service supply-demand imbalance for sustainable land management in China’s Loess Plateau. Land Use Policy 2022, 123, 106423. [Google Scholar] [CrossRef]
- Zhang, W.; Xu, D. Benefits evaluation of ecological restoration projects based on value realization of ecological products. J. Environ. Manag. 2024, 352, 120139. [Google Scholar] [CrossRef]
- Xia, H.; Yuan, S.F.; Prishchepov, A.V. Spatial-temporal heterogeneity of ecosystem service interactions and their social-ecological drivers: Implications for spatial planning and management. Resour. Conserv. Recycl. 2023, 189, 106767. [Google Scholar] [CrossRef]
- Ouyang, X.; Tang, L.S.; Wei, X.; Li, Y.H. Spatial interaction between urbanization and ecosystem services in Chinese urban agglomerations. Land Use Policy 2021, 109, 105587. [Google Scholar] [CrossRef]
- Li, G.Y.; Jiang, C.H.; Gao, Y.; Du, J. Natural driving mechanism and trade-off and synergy analysis of the spatiotemporal dynamics of multiple typical ecosystem services in Northeast Qinghai-Tibet Plateau. J. Clean. Prod. 2022, 374, 134075. [Google Scholar] [CrossRef]
- Xiao, S.Y.; Hou, Y.L.; Lovely, M. Top-Down Central Inspection and Subnational Discretion in Policymaking. Governance 2025, 38, e70013. [Google Scholar] [CrossRef]
- Zhou, Y.; Gu, B.J. The impacts of human activities on Earth Critical Zone. Earth Crit. Zone 2024, 1, 100004. [Google Scholar] [CrossRef]
- Ouyang, Z.Y.; Zheng, H.; Xiao, Y.; Polasky, S.; Liu, J.G.; Xu, W.H.; Wang, Q.; Zhang, L.; Xiao, Y.; Rao, E.M.; et al. Improvements in ecosystem services from investments in natural capital. Science 2016, 352, 1455–1459. [Google Scholar] [CrossRef]
- Fang, Z.; Ding, T.H.; Chen, J.Y.; Xue, S.; Zhou, Q.; Wang, Y.D.; Wang, Y.X.; Huang, Z.D.; Yang, S.L. Impacts of land use/land cover changes on ecosystem services in ecologically fragile regions. Sci. Total Environ. 2022, 831, 154967. [Google Scholar] [CrossRef] [PubMed]
- Zhou, L.Y.; Cui, W.L.; Yang, F. Spatiotemporal variations and driving forces analysis of ecosystem water conservation in coastal areas of China. Ecol. Indic. 2024, 162, 112019. [Google Scholar] [CrossRef]
- Sadiq, M.; Chau, K.Y.; Ha, N.T.T.; Phan, T.T.H.; Ngo, T.Q.; Huy, P.Q. The impact of green finance, eco-innovation, renewable energy and carbon taxes on CO2 emissions in BRICS countries: Evidence from CS ARDL estimation. Geosci. Front. 2024, 15, 101689. [Google Scholar] [CrossRef]
- Seidl, A.; Mulungu, K.; Arlaud, M.; van den Heuvel, O.; Riva, M. The effectiveness of national biodiversity investments to protect the wealth of nature. Nat. Ecol. Evol. 2021, 5, 530–539. [Google Scholar] [CrossRef] [PubMed]
- Wang, J.; Liu, C.N.; Liu, B.Y.; Lee, T.M. Integrated outcomes of large-scale ecological restoration projects on biodiversity–eco-environment–society in China. Geogr. Sustain. 2025, 6, 100243. [Google Scholar] [CrossRef]
- Xiong, C.S.; Ren, H.Y.; Xu, D.; Gao, Y.M. Spatial scale effects on the value of ecosystem services in China’s terrestrial area. J. Environ. Manag. 2024, 366, 121745. [Google Scholar] [CrossRef] [PubMed]
- Jia, M.J.; Xu, T.Y.; Li, H.J. Ecosystem Services Value of the Grain for Green Program in China—A Case Study of Five Representative Provinces. Forests 2025, 16, 1671. [Google Scholar] [CrossRef]
- Xin, J.X.; Yang, J.; Yu, H.S.; Ren, J.Y.; Yu, W.B.; Cong, N.; Xiao, X.M.; Xia, J.H.; Li, X.M.; Qiao, Z. Towards ecological civilization: Spatiotemporal heterogeneity and drivers of ecological quality transitions in China (2001–2020). Appl. Geogr. 2024, 173, 103439. [Google Scholar] [CrossRef]
- Su, R.; Duan, C.C.; Chen, B. The shift in the spatiotemporal relationship between supply and demand of ecosystem services and its drivers in China. J. Environ. Manag. 2024, 365, 121698. [Google Scholar] [CrossRef]
- Fang, C.L.; Fan, Y.P.; Bao, C.; Li, G.D.; Wang, Z.B.; Sun, S.; Ma, H.T. China’s improving total environmental quality and environment-economy coordination since 2000: Progress towards sustainable development goals. J. Clean. Prod. 2023, 387, 135915. [Google Scholar] [CrossRef]
- Ge, Y.; Hu, S.; Song, Y.Z.; Zheng, H.; Liu, Y.S.; Ye, X.Y.; Ma, T.; Liu, M.X.; Zhou, C.H. Sustainable poverty reduction models for the coordinated development of the social economy and environment in China. Sci. Bull. 2023, 68, 2236–2246. [Google Scholar] [CrossRef]
- Zhang, H.; Wang, Y.W.; Wang, C.; Yang, J.M.; Yang, S.W. Coupling analysis of environment and economy based on the changes of ecosystem service value. Ecol. Indic. 2022, 144, 109524. [Google Scholar] [CrossRef]
- Sun, T.; Feng, X.M.; Lal, R.; Cao, T.H.; Guo, J.R.; Deng, A.X.; Zheng, C.Y.; Zhang, J.; Song, Z.W.; Zhang, W.J. Crop diversification practice faces a tradeoff between increasing productivity and reducing carbon footprints. Agric. Ecosyst. Environ. 2021, 321, 107614. [Google Scholar] [CrossRef]
- Fan, S.X.; Newbold, T.; Tscharntke, T.; Tang, W.H.; Yu, Z.R.; Liu, Y.H. Impact of crop type on biodiversity globally. Global Change Biol. 2024, 30, e70005. [Google Scholar] [CrossRef]
- Gao, Y.; Wang, Z.; Li, C. Assessing spatio-temporal heterogeneity and drivers of ecosystem services to support zonal management in mountainous cities. Sci. Total Environ. 2024, 954, 176328. [Google Scholar] [CrossRef] [PubMed]
- Han, Y.L.; Chang, C.; Wu, S.; Edwin, I.E.; Wang, Y.H.; Yan, W.; Liu, J.; Ma, X.F. Cross-scale spillover of ecosystem services reveals pathways for equitable ecological compensation in inland river basins. J. Environ. Manag. 2025, 394, 127448. [Google Scholar] [CrossRef]
- Hong, W.Y.; Li, Y.L.; Guo, R.Z.; Chen, B.; Zhang, W.J.; Li, F.X.; Yang, S.W.; Liu, Y.K.; Zhao, Y.M.; Li, Y.R.; et al. Empowering China’s sustainable development through social-ecological networks. npj Urban Sustain. 2025, 5, 45. [Google Scholar] [CrossRef]
- Liu, H.M.; Xiong, J.Y.; Hong, S.F.; Zhou, B.B. Social, economic, and environmental development in China through the lens of synergies and trade-offs. J. Clean. Prod. 2025, 509, 145634. [Google Scholar] [CrossRef]
- Jay, M.; Plieninger, T. Addressing landscape multifunctionality in conservation and restoration. Nat. Rev. Biodivers. 2025, 1, 717–732. [Google Scholar] [CrossRef]
- Li, C.G.; Chen, Z.L.; Jiang, Q.T.; Yue, M.; Wu, L.; Bao, Y.H.; Huang, B.; Wang, A.B.; Tan, Y.Y.; Xu, Z.C. Impacts of government attention on achieving Sustainable Development Goals: Evidence from China. Geogr. Sustain. 2025, 6, 100233. [Google Scholar] [CrossRef]
- Zhu, S.Y.; Wang, H.S.; Zhang, P. Beyond tradeoffs: How do local governments synergize multiple complementary goals? Public Perform. Manag. 2025, 5, 1–26. [Google Scholar] [CrossRef]
- Wang, M.; Wan, D.; Xie, X.; Bai, Z.H.; Wang, R.; Zhang, X.M.; Gao, Y.Z.; Tan, Z.L.; Yin, Y.L. Crop-livestock integration: Implications for food security, resource efficiency and greenhouse gas mitigation. Innov. Life 2024, 2, 100103. [Google Scholar] [CrossRef]
- Yang, Z.J.; Ding, H.; Zhu, W.B. Environmental regulation and land resource allocation in China: Empirical evidence from micro-level land transaction data. Land Use Policy 2024, 140, 107126. [Google Scholar] [CrossRef]
- Biswas, A.; Maddocks, I.; Dhar, T.; Dube, L.; Dutta, A.; Talukder, B.; Ponnambalam, K. Guiding sustainable transformations in food systems. Nat. Rev. Earth Environ. 2024, 5, 607–608. [Google Scholar] [CrossRef]
- Wang, Y.H.; Chen, X.N. River chief system as a collaborative water governance approach in China. Int. J. Water Resour. Dev. 2020, 36, 610–630. [Google Scholar] [CrossRef]
- Sun, Z.N.C.; Chen, N.K.; Dong, J.W.; Jia, M.M.; Xu, Z.C. Enabling new sustainability opportunities from integrated blue sustainable development. Innov. Geosci. 2025, 3, 100171. [Google Scholar] [CrossRef]
- Chen, M.K.; Xu, X.B.; Tan, Y.; Lin, Y.Y. Integrating ecosystem service spillovers and environmental justice in ecological compensation: A pathway to effective ecological protection in China. Ecol. Indic. 2025, 174, 113455. [Google Scholar] [CrossRef]
- Perschke, M.J.; Harris, L.R.; Sink, K.J.; Lombard, A.T. Systematic conservation planning for people and nature: Biodiversity, ecosystem services, and equitable benefit sharing. Ecosyst. Serv. 2024, 68, 101637. [Google Scholar] [CrossRef]
- Tang, F.; Zhou, Z.F.; Li, Y.B.; Jing, Y.T. Policy for poverty alleviation and relocation promotes synergistic development of the cross-regional social-ecological system: A case study of Guizhou, China. Habitat Int. 2025, 167, 103666. [Google Scholar] [CrossRef]
- Kimengsi, J.N.; Buchenrieder, G.; Pretzsch, J.; Balgah, R.A.; Mallick, B.; Haller, T.; Gebara, M.F. Institutional jelling in socio-ecological systems: Towards a novel theoretical construct? Land Use Policy 2025, 157, 107681. [Google Scholar] [CrossRef]


Disclaimer/Publisher’s Note: The statements, opinions and data contained in all publications are solely those of the individual author(s) and contributor(s) and not of MDPI and/or the editor(s). MDPI and/or the editor(s) disclaim responsibility for any injury to people or property resulting from any ideas, methods, instructions or products referred to in the content. |
© 2025 by the authors. Licensee MDPI, Basel, Switzerland. This article is an open access article distributed under the terms and conditions of the Creative Commons Attribution (CC BY) license (https://creativecommons.org/licenses/by/4.0/).