Abstract
Studying the response of urban functions to residents’ spatiotemporal activity patterns is essential for understanding urban functions and guiding resource allocation. Unlike previous studies constrained by fixed intervals and static functional spaces, this study has developed an analytical framework to examine urban functional responses to residents’ activity patterns under dynamic spatiotemporal combinations. Tensor decomposition was employed to identify key temporal activity patterns of residents and dynamic urban functional patterns, while a Random Forest model was used to evaluate the contributions of five POI (Points of Interest) groups—Transportation, Organizations, Leisure, Habitation, and Basic Facilities—derived from a reclassification of 17 original POI categories, and the Elasticity Index (EI) quantifies functional responsiveness to activity changes. Results indicated that (1) four temporal patterns (sleeping, commuting, daytime, and leisure) and four spatial function types (the basic living area, the residential areas with mixed functions, residential areas with commercial functions and bustling business districts) characterized Beijing’s urban dynamics; (2) the five types of urban function varied with spatiotemporal context, with basic living POIs dominating daytime activities in residential zones and transportation POIs prevailing during commuting in mixed-use areas; (3) EI revealed significant spatial heterogeneity in adaptive capacities to activity transitions, which helped to accurately identify the key areas for improving urban functions. These findings provide new methodological insights and scientific evidence for resilient urban planning and resource optimization, supporting data-driven decision-making for spatial planning, infrastructure allocation, and emergency response management.
1. Introduction
Cities are complex and ever-changing systems [1]. They are composed of not only space, functions and human movements, but also the relationships among them [2]. Building more resilient and sustainable cities is currently the main focus of urban construction [3], refers to a city’s ability to maintain structural and functional stability, quickly absorb shocks, and adapt to changes during natural disasters, public health crises, or economic shocks [4]. The United Nations’ 2030 Agenda for Sustainable Development has identified resilient and sustainable cities as a key development goal [5], and China’s 14th Five-Year Plan has for the first time explicitly proposed the construction of “resilient cities,” urging all regions to strengthen urban governance and improve risk prevention and control [3]. Cities can facilitate adaptive cycles of urban resilience through resource allocation, providing structural support for enhancing overall urban resilience [6]. However, Rapid urbanization has diversified resident activity patterns. At the same time, urban spatial functions as carriers of these activities have become increasingly complex [7,8]. This complexity creates new challenges for urban resource allocation, monitoring and governance [9]. In this context, it is essential to explore urban spatial dynamics and the response to residents’ spatiotemporal activity patterns using large-scale refined data. Such analysis provides critical insights into residents’ needs and the rationality of resource allocation. It also offers important implications for sustainable urban development.
To allocate resources effectively, it is necessary to understand how residents behave and what resources they require. Residents’ regular collective activity patterns provide insights into the dynamic functions of urban spaces [10]. Previous research on urban residents’ activity patterns was based on limited surveys and statistical datasets. Such methods were constrained by small sample sizes and could not adequately capture high-resolution temporal dynamics or fine-grained spatial patterns. In recent years, with the development of information and communication technologies, datasets such as smart card records [11,12], taxi trip records [13,14,15], mobile signaling data [16,17,18,19] and location-based big data have been widely used to study the spatiotemporal activity patterns of urban residents [20,21,22,23].
Despite the progress made in data sources, several methodological limitations remain. Primarily reflected in two aspects: traditional studies are limited to conventional time periods and static spatial representations of urban space, and studies that mine spatiotemporal patterns from big data often lack linked to relevant urban development policies or planning strategies in a practical and evidence-based manner.
Many studies have used big data to analyze residents’ activity intensity in static urban spaces over regular time intervals [24,25,26]. They identify peak and off-peak periods and map spatial hotspots and coldspots using clustering methods, revealing the spatiotemporal patterns of daily urban activities [27,28,29,30,31]. Previous research defined regular time intervals either by fixed periods (morning, afternoon, evening, night) or equal-length segments. Li et al. [32] examined residents’ activities in Xi’an across morning (7:00–13:00), afternoon (13:00–18:00), evening (18:00–22:00), and night (22:00–24:00), refs. [24,25,26] also employed similar temporal divisions. Wang et al. [33] divided a day into twelve 2-h intervals to examine residents’ activity patterns in Beijing. Besides, static urban spaces are typically represented by grids, streets, or functional zones. Wu et al. [34] used 1 km × 1 km grids in Shenzhen to analyze temporal heterogeneity, but ignored functional links between grids. Administrative boundaries, such as streets or districts, capture activity patterns within units but overlook cross-unit functional connections. To better reflect urban functionality and its correlation with residents’ activities, many studies now use urban functional zones, investigating influences from green spaces and parks [35,36,37,38,39], historical districts [40,41,42], and multi-functional areas [43,44].
Notably, residents display different activity patterns throughout the day: office clusters activities prevail during peak hours, while recreational activities dominate leisure periods [45]. These temporal differences are reflected not only in activity types but also in urban spatial functions. During commuting peaks, office clusters and transport hubs become hotspots of urban activity, whereas leisure periods see increased activity in parks and other recreational areas. However, residents’ activity periods are difficult to fully capture through researchers’ subjective divisions, which may affect the study of activity patterns and urban spatial functions. Due to limitations in the use of fixed time intervals and static spatial representations of urban functions, previous studies on the interactions between residents’ activities and urban spaces have been unable to fully capture the dynamic variations in residents’ activities.
To address this, researchers have extracted latent spatiotemporal patterns of residents’ activities from high-dimensional big data. For example, Cai et al. [46] constructed and decomposed tensors based on Tencent location data to identify four daily patterns, five hourly patterns, and six spatial patterns of residents within Beijing’s Fifth Ring Road, revealing significant variations across dates, hours, and locations. Methods such as principal component analysis (PCA) or eigenvalue decomposition [47] and geographic flow models [48] have also proven effective in uncovering spatiotemporal characteristics of resident activities. These approaches provide valuable tools for exploring the features and regularities of urban activity. However, these approaches provide valuable tools for exploring the features and regularities of urban activity [49]. While paying limited attention to how changes in residents’ activities generate dynamic demands on urban spaces, such as the responsiveness or elasticity of urban facilities. As a result, these studies cannot be directly linked to relevant urban development policies or planning strategies in a practical and evidence-based manner.
Based on this, the present study aims to address three core questions: (1) How can the driving factors of the interactions between residents’ activity patterns and urban spatial functions be explored through novel spatiotemporal combinations? (2) What are residents’ activity demands under the spatiotemporal combinations of activity periods and dynamic urban functional spaces? (3) How do urban facilities respond to changes in residents’ activity demands within functional spaces?
To answer these questions, this paper constructed an analysis framework. This study not only characterized temporal and spatial patterns of residents’ activities and revealed their dynamic interactions with urban functions, but also provided insights into how spatio-temporal responsiveness of urban functions could inform evidence-based urban planning and optimized resource allocation.
2. Study Area and Datasets
2.1. Study Area
This paper focused on Beijing, China (39°28′ N to 41°05′ N, 115°20′ E to 117°30′ E), as shown in Figure 1. According to the statistical data released by the People’s Government of Beijing Municipality (source: https://www.beijing.gov.cn/, accessed on 4 July 2024), By the end of 2023, the city’s permanent resident population was 21.858 million. Beijing consists of 16 districts and covers a total area of 16,410 square kilometers. It is the center for the country’s politics, culture, and economy. Beijing has gathered a large number of high-end service industries and cultural resources, and its urban development has important demonstration significance and research value. To analyze the spatiotemporal characteristics of urban function and its response to resident activities in Beijing, the study area was divided into 1 km × 1 km grids, totalizing 16,970 grids.
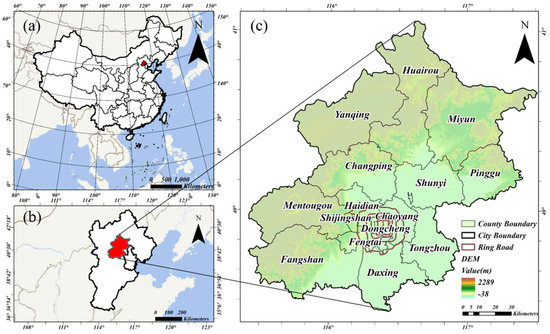
Figure 1.
Geographical location and topography of the study area. (a) Location of Beijing in China; (b) Location of Beijing in the North China region; (c) Administrative divisions and topography of Beijing.
2.2. Datasets
2.2.1. POI Data
POIs serve as proxies for resident activities. Different types of POI data provide facilities for resident activities and can reflect the actual demands of such activities. The POIs used in this study were obtained from Baidu Maps (https://map.baidu.com/, accessed on 3 July 2024), totalizing 809,488 POIs (Table 1). In this study, POI data in Beijing were classified into five categories: CPOI, OPOI, TPOI, HPOI, and BPOI. Specifically: TPOI mainly represented transportation-related categories; OPOI primarily included organizational entities; CPOI denoted leisure and entertainment categories; HPOI covered habitation categories; BPOI denoted basic facilities, comprised science, education, culture, healthcare, and medical service categories.

Table 1.
Groups of POI types.
2.2.2. Baidu Heat Map
The Baidu Heatmap data was derived from the Baidu Huiyan Online Platform (https://huiyan.baidu.com, accessed on 25 March 2025). Baidu is the largest integrated internet service company in China, with a focus on information and knowledge. In 2019, the number of Baidu users exceeded 1 billion, and the daily active users of the Baidu App reached 200 million [50,51], and its information flow ranked first in China. Baidu Heat Map data obtains location information of mobile devices through the radio communication networks of operators such as China Mobile and China Telecom, or through external positioning when users access Baidu products. It can reflect the degree of population aggregation.
The data used in this study cover the location requests in the study area over two days (28–29 May 2023) with a temporal resolution of 1 h and a spatial resolution of 150 m, covering the period from 00:00 to 23:00, serving as the key foundational data for this study.
3. Methodology
The analytical framework proposed in this study employed tensor decomposition, random forest methods (Run the code in MATLAB R2018b) and clustering analysis (Arcgis pro3.0) to investigate the response of urban function to residents’ activity patterns under spatiotemporal combinations of activity periods and dynamic urban functions. Key temporal activity patterns of residents and dynamic urban functions were first extracted from big data using tensor decomposition. The new classification of urban functions was then investigated across multiple spatiotemporal combinations of activity periods and urban functional spaces. Finally, the responsiveness of these urban functions to residents’ demands was analyzed. As illustrated in Figure 2, the analysis comprised three main components: (1) the spatiotemporal patterns of residents’ activities and dynamic urban functions; (2) the analysis of interaction mechanisms between urban function and residents’ activities across multiple temporal combinations; and (3) the assessment of urban spatial function elasticity. The key methods applied in this study are described in detail in the following sections.
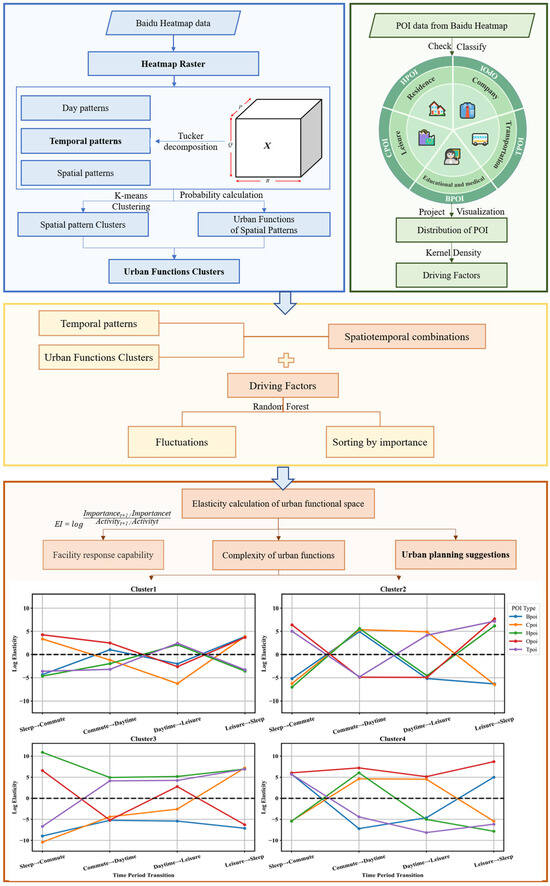
Figure 2.
The flowchart of this paper.
3.1. Tucker Decomposition
Tucker decomposition is a high-order principal component analysis method that decomposes a tensor into a core tensor and multiple factor matrices. Tucker decomposition is a widely used tensor decomposition algorithm [52]. As a higher-order generalization of principal component analysis (PCA), it decomposes an original tensor into a lower-dimensional core tensor, which is multiplied by a factor matrix along each mode [8]. Besides, NMF is commonly used for two-dimensional data [53], which is why Tucker decomposition was chosen in this study The factor matrix of each mode is called the basis matrix or principal component of the tensor. In this study, Tucker decomposition was applied to a three-way tensor (Figure 3).
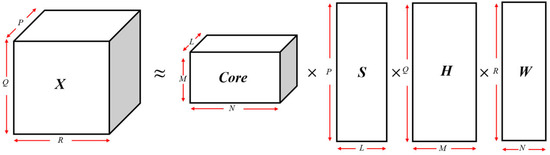
Figure 3.
The Tucker decomposition for three-way data.
was the three-dimensional tensor constructed in this paper, P = 16,970 represents the number of grids in study area, Q = 2 represents the observed days (a workday and a restday, two days in total), and R = 24 represents 24 h in a day. Each unit represents the number of location requests in the p-th grid, q-th day, and r-th hour. After tucker decomposition, the three-dimensional tensor was divided into a core tensor and three factor matrices. The three factor matrices are , and the core tensor is . Three factor matrices store compressed information in different modes, core tensor stored the relationship between patterns. For temporal and spatial modes, this paper tested temporal modes in the range [1, 6] and spatial modes in the range [1, 10]. The parameter combination corresponding to the point where the loss curve first stabilizes was selected as the final decomposition parameters. The loss curve has been included in the Supplementary Materials Table S3 and Figure S2. This paper drew on sparse nonnegative Tucker decomposition (SN-TUKER) proposed by [54]. The core calculation formula is as follows:
is the original tensor, is the tensor reconstructed from the generated core tensor and three factor matrices, represents the lengths of each dimension (Formula (1)).
3.2. Inferring Functions of Residents’ Activities Clustering Regions
The core tensor concludes the interaction relationship between data from different dimensions. Calculating the conditional probability of the hourly pattern given a geographical pattern allows us to determine the likelihood of an activity occurring during a specific time period (e.g., leisure or work period) within different geographical activity patterns. By analyzing variations in the conditional probabilities of geographical patterns for a given hourly pattern, the likelihood of the activity occurring in different geographical patterns during that time period can be inferred. By comparing the differences in the conditional probabilities of hourly patterns for a given geographical pattern under two different daily modes (working day and rest day), as well as the differences in the conditional probabilities of geographical patterns under a given hourly pattern, the meaning of the decomposed geographical patterns can be inferred, thereby determining the main functions of the urban spaces.
Take workday as an example, i represents the ith spatial pattern (i = 1, 2, ⋯, 6), and j represents the jth temporal pattern (j = 1, 2, 3, 4). Formula (2) can calculate the conditional probability of the hourly pattern given the geographic pattern, and Formula (3) can calculate the conditional probability of the geographic pattern given the hourly pattern.
3.3. K-Means Clustering
To identify spatial patterns of dynamic urban functions, the derived resident activity profiles were clustered using the K-means algorithm, a widely adopted unsupervised machine learning technique for partitioning data into distinct functional categories [46,55]. K-means aims to partition n observations into K clusters in which each observation belongs to the cluster with the nearest mean, minimizing the intra-cluster variance. Elbow Method Curve for Determining Optimal K in K-means Clustering has been shown in Supplementary Materials Figure S3 and Table S6. In this study, the K-means clustering was applied to the tensor-decomposed spatial mode matrix, where each spatial unit is characterized by its temporal activity features.
is the feature vector of the spatial pattern, is the cluster, and is the centroid of cluster .
3.4. The Features’ Importance Calculated by Random Forest
Random Forest is an ensemble learning method that is widely used in classification and regression tasks [56,57]. As for random forests perform excellently in handling high-dimensional data because they can effectively assess the importance of all features without being affected by the high dimensionality of the data. This is especially important for complex datasets with a large number of features [58]. RFR has a number of advantages over other data-driven methods, including easy offline training, efficiency, interpretability and built-in feature importance metrics (quantitative measures of how much influence a particular input variable has on the model’s output prediction [57]. Its feature importance assessment is achieved by analyzing the contribution of each feature to the prediction ability of the model. The SHAP algorithm is a tool for model interpretability that helps gain deeper insights into the decision-making process of a model [59]. In this study, we also used SHAP to analyze the coupling effects among the influencing factors, as illustrated in Equation (10). Basic principles related to random forest’s calculation of feature importance can be formulated as follows:
represents the marginal contribution of features i and j when they are both included in the model during the calculation of SHAP values.
Based on the random forest feature importance algorithm, the contribution degrees of POIs during different time periods in different urban functional spaces were calculated. Thereby, the interactive relationship between residents’ activities and urban functional spaces was analyzed. The ratio of the training data to the prediction data was set to 7:3. This paper tested values in the range [100, 1000] with increments of 100. Maximum depth of trees: Values were set from [5, 30] to balance model complexity and overfitting. Minimum samples per leaf: Values were tested from [1, 5] to ensure stable feature importance estimates. This information has been shown in Supplementary Materials Tables S4 and S5.
3.5. Elasticity Index
To capture the dynamic responsiveness of urban spatial functions to temporal behavioral shifts of residents, this study introduced the Elasticity Index (EI) as a quantitative metric. In economics, the elasticity index (or elasticity coefficient) refers to the ratio of the growth rates of two interrelated economic indicators over a given period [60], The elasticity index is widely used in policy evaluation (such as tax elasticity), market forecasting (such as product pricing), and risk management (such as energy security). For example, the tax elasticity coefficient reflects the relationship between tax revenue and national income [61,62,63]. EI is adapted to evaluate the relative change in functional importance of Points of Interest (POIs) with respect to observed changes in human activity intensity across time periods in this paper. To mitigate the impact of extreme values, a signed logarithmic transformation is further applied. Where is the sign function, returning 1 for positive values, −1 for negative values, and 0 for zero.
denotes the functional importance of POI type in cluster at time , derived from feature contribution scores. is the aggregate activity intensity within cluster at time . and represent temporal changes in functional importance and activity intensity, respectively.
4. Results
4.1. Spatiotemporal Patterns of Resident Activities and Urban Space Functions
By running Tucker decomposition, 4 temporal patterns and 6 spatial patterns were extracted, as shown in Figure 4 and Supplementary Figure S1. The temporal heterogeneity of residents’ activities reflects the diversity of residents’ daily behaviors. First peak period of the hourly pattern of residents’ activities occurred from 22:00 in the evening to 06:00 in the early morning. This time period coincided with the sleeping time, so it was named the Sleeping hour and denoted as T1. The second peak period, from 06:00 to 10:00, aligned with the Morning rush hour. The fourth peak period, with similar types of Morning rush hour, occurred from 18:00 to 20:00, coinciding with the Evening rush hour. These two periods were collectively referred to as the Commuting hour and denoted as T2. The third peak, spanning from 10:00 to 18:00, was designated as the daytime activity period, denoted as T3. The fifth peak period of residents’ activities occurred from 20:00 to 22:00. Although this period was short, there was a distinct peak in the pattern value. It followed the Evening rush hour and preceded the Sleeping hour. It was likely the time when residents engage in leisure activities, dining, and exercise after finishing their daytime activities, so this period was named the Leisure hour.
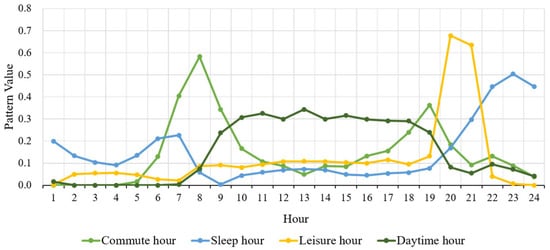
Figure 4.
Distribution of hourly patterns in Beijing.
The spatial heterogeneity of residents’ activities can reflect the spatial distribution of their daily activities. Based on the temporal patterns of residents’ activities, the spatial patterns of urban residents’ activities can be summarized. This paper calculated the interaction relationship between the geographical pattern vectors and the hourly pattern vectors for the six geographical patterns obtained through decomposition according to Formula (2) and Formula (3), as shown in Tables S1 and S2. M1 was named the leisure-geographical pattern, M2 was the work-residence geographical pattern, M3 was the mixed geographical pattern, M4 was the commercial-business geographical pattern, M5 was the residence-commuting geographical pattern, and M6 was named the residence-commercial geographical pattern.
With these informative residents’ spatial patterns, each grid was expressed as a vector of spatial patterns containing the temporal information of the positioning data. These vector representations can be used to measure the similarity of grids and conduct comparative analysis. The K-means clustering method was used to cluster and visualize six types of residential spatial patterns, obtaining the dynamic functions of the entire urban space in Beijing (Figure 5). As shown in Figure 5a, Cluster 1 exhibited a peak in M2. Cluster 2 was primarily composed of M2, M4, and M5 (Figure 5b). Cluster 3 mainly consisted of M1, M5, and M6 (Figure 5c), while Cluster 4 was primarily made up of M2 and M4 (Figure 5d). Cluster 1 was defined as the Basic living areas, Cluster 2 as the Residential areas with mixed functions, Cluster 3 as the Residential areas with commercial functions, and Cluster 4 as the Bustling business districts.
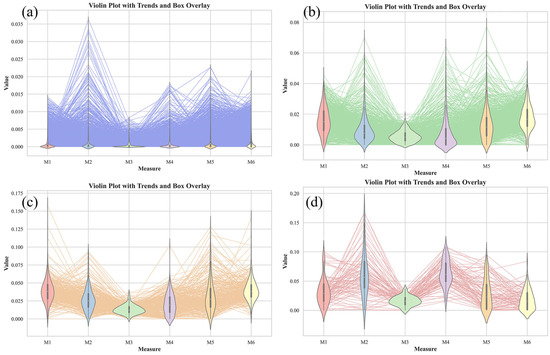
Figure 5.
Spatial patterns in four cluster. Cluster 1 (a), Cluster 2 (b), Cluster 3 (c), Cluster 4 (d).
Figure 6a shows the Basic living areas are primarily distributed outside the 5th Ring Road of Beijing. In these areas, residents mainly engage in basic activities such as sleeping and working, with relatively few commercial and business activities. Most parts of Miyun district in Beijing fall into this category, as shown in Figure 6b. The residential areas with mixed functions are mainly distributed between the 4th Ring Road and the 5th Ring Road, including large industrial parks like Yizhuang Corporate Culture Park and entertainment parks such as Universal Beijing Resort. The residential areas with commercial functions are mainly located between the 2nd the 4th Ring Road of Beijing, including the Changping district, National Stadium, the Olympic Sports Center, as well as the surrounding commercial and residential communities (Figure 6c). The bustling business districts are mainly distributed within the 2nd Ring Road, including Financial Street and Wangfujing Street, etc., as shown in Figure 6d.
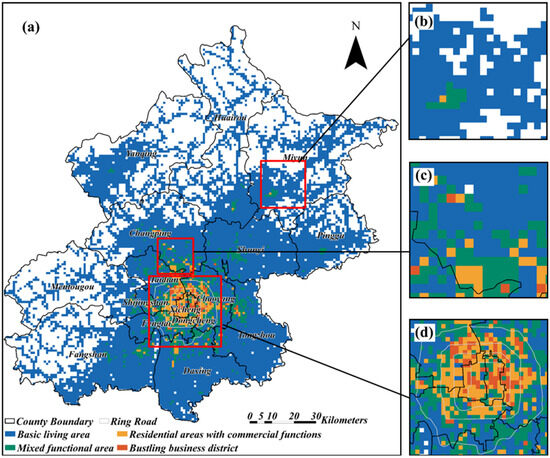
Figure 6.
Dynamic urban spatial functions. all Beijing region (a), Miyun district (b), Changping district (c), City center—within the 5th Ring Road (d).
4.2. Spatiotemporal Comprehensive Analysis of the Interaction Between Urban Functions and Resident Activities
Based on the results of the interaction between residential activities and urban spatial functions derived from big data, this study used the Random Forest feature importance algorithm to compute the five types of urban function in four types of urban spaces and four residential activity time periods. The interaction between each type of spatiotemporal urban function and human activity was analyzed, and the model accuracy was shown in Table 2. In Cluster 2, which represented the residential areas with mixed functions, the data distribution was more complex and exhibits significant fluctuations, making it difficult for the model to capture the overall trend during fitting, thereby reducing the goodness of fit. RMSE (Root Mean Square Error) represents the difference between predicted and actual values [64]. The high RMSE in Cluster 4 was mainly due to the smaller sample size in this cluster, leading to larger prediction errors due to insufficient data.
Table 2.
Evaluation indicators for random forest model.
Upon observing the semantic features of residential activities across different time periods in Figure 7, it was found that the variations in activity semantic features were significant and regular in Cluster 1 (the basic living area), Cluster 3 (the residential areas with commercial functions), and Cluster 4 (the bustling business districts area). However, the variations in Cluster 2 (the residential areas with mixed functions) were not as pronounced across time periods. The reason for this was that the residential activity types in mixed-function residential areas were diverse, and the changes in single activity semantic features had a smaller overall impact. Overall, Cpoi (commercial POI) exhibits the most significant and consistent influence across all clusters, with notably high values during Daytime and Sleep periods in Cluster 4 (0.3540 and 0.3531, respectively) and Cluster 3 (0.2783 and 0.2777). This indicates that commercial functions play a dominant role in shaping both daytime and nighttime activity intensities, particularly in areas characterized by mixed-use or high-density commercial development.
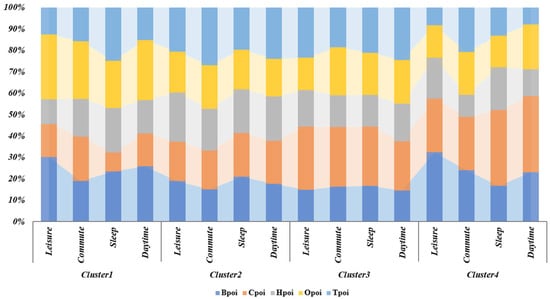
Figure 7.
Stacked graph of the importance percentage of influencing factor features.
In contrast, Bpoi (basic service POI) and Opoi (office POI) show moderate contributions, particularly during the Leisure and Daytime periods of Cluster 1 (0.3006 and 0.2585) and Cluster 2 (0.2806 and 0.2692), reflecting their relevance to daily service and work-related behaviors. Hpoi (residential POI) presents relatively stable but lower importance across clusters, suggesting a more background influence on activity distribution. Tpoi (transportation POI) exhibits distinct temporal variability, peaking during the Commute period in Cluster 2 (0.2697) and Sleep period in Cluster 1 (0.2496), implying its contextual importance to commuting and nighttime mobility patterns.
Additionally, this study found that the POIs’ features of residential activities differed significantly in different urban dynamic functional spaces across time periods, revealing the impact of urban spatial functions on residential activities. For example, during the commuting period, the TPOI values were high in mixed-function residential areas and residential areas with commercial functions. Major transportation hubs in Beijing, such as Beijing Capital Airport, Beijing West Railway Station, Tiantongyuan, and several metro stations, were located in these areas, providing the primary transportation functions for residents, which explained the prominence of transportation-related activities. In contrast, areas such as Fangzhuang, which were located in basic residential areas and mixed-function residential areas, saw residents primarily resting at home during the sleep period, thus highlighting the habitation (HPOI) features in these two areas. During daytime activities, organizations (OPOI) and leisure and entertainment (CPOI) features were more prominent in the basic residential area and bustling business district, indicating that these two areas were the main places for residents’ work activities. Furthermore, during the daytime in the basic residential area, the basic facilities (BPOI) feature was more prominent, while in the bustling business district, the (CPOI) feature was more pronounced during the same period. This suggested that daytime activities in basic living areas were centered around basic services like education and healthcare, while the bustling business district provided more commercial functions for residents. These findings demonstrated that the functional characteristics of urban spaces constrained the types of residential activities.
To more intuitively illustrate the variations of different POI features across spatiotemporal patterns, this study plotted radar charts for five POI feature changes (Figure 8). It could be observed that residential activities significantly impact the dynamic functions of urban spaces. Specifically, in the four types of spaces, the BPOI peak was most pronounced in the basic living area, while the CPOI peak was most notable in residential areas with commercial functions and in the bustling business district. The residential areas with mixed functions, excepted for a slightly more prominent TPOI, showed a generally balanced distribution of features.
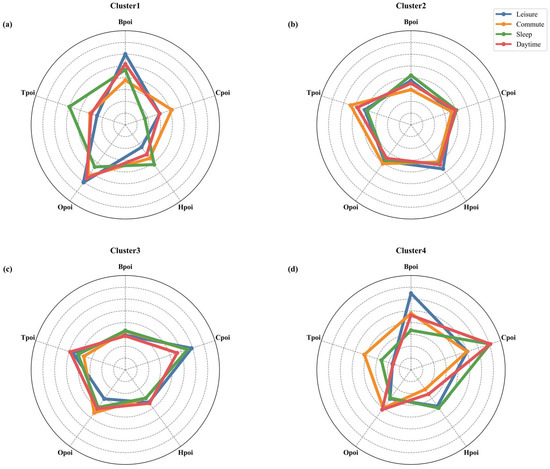
Figure 8.
Radar map of changes in urban population influenced by POI types. (a) basic Living Area; (b) residential area with mixed functions; (c) residential area with commercial attributes; (d) bustling business district.
Upon observing Figure 8a,d, it was evident that the TPOI radar charts for the basic living area and the bustling business district differed significantly. Specifically, the commuting period features were most prominent in the bustling business district, while the sleep period features were most prominent in the basic living area. This discrepancy might arise because, during the work peak in the bustling business district, a large influx of residents led to prominent transportation-related semantic features during the commuting period. On the other hand, many areas in the basic living area were involved in nighttime logistics and delivery activities, making the transportation-related features more prominent during the sleep period. In Figure 8b,d, the company office features in the radar charts for the residential areas with mixed functions and residential areas with commercial functions were similar. However, during the daytime, the residential areas with commercial functions showed more prominent company office features than the residential areas with mixed functions, indicating that the residential activity patterns of work gave these areas a more significant commercial function. These findings suggested that residential activities also played a role in shaping the dynamic functions of urban spaces.
This paper conducts an in-depth analysis of the intrinsic relationships between five types of Points of Interest (POIs) across four types of urban functional spaces using the SHAP algorithm. This paper also calculated the impact for model of 5POI in commute time, the results shown as Figure S4. It shown that different urban clusters respond distinctly to POI configurations. In the Basic Living Area and Mixed-Use Residential Area, significant coupling relationships are observed between BPOI (basic living facilities), CPOI (commercial and entertainment facilities), and TPOI (transportation facilities). This suggests that in areas responsible for providing basic living functions for urban residents, the functional interactions between transportation, commercial facilities, and basic living infrastructure are closely related. These interactions are the main driving factors behind the fluctuations in activity heatmaps of residents in these areas. This indicates that in non-central urban areas, the intensity of residents’ activities is highly dependent on the services they require on a daily basis, as well as on convenient transportation. Strengthening infrastructure development in these two regions is therefore crucial.
Furthermore, the paper also observes that in Residential Commercial Areas, although the coupling between BPOI, CPOI, and TPOI is noticeably lower than in the Basic Living Area and Mixed-Use Residential Area, residents in these areas are more likely to access leisure and commercial facilities. Basic living spaces, such as schools and hospitals, are not the key drivers of residents’ activities in this region. In the bustling Business District, the paper finds a significant coupling relationship between TPOI and HPOI, shown in Figure 9d. This area is a major business district in the city, with a large flow of people. During workdays, there is a strong need for convenient transportation to reach business centers.
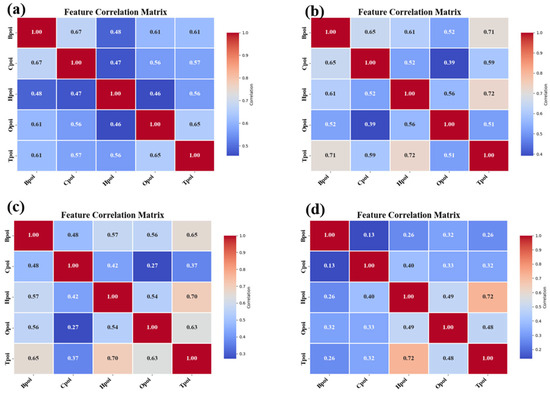
Figure 9.
POI Correlation Heatmap, (a) basic Living Area; (b) residential area with mixed functions; (c) residential area with commercial attributes; (d) bustling business district.
4.3. Assessing the Elasticity of Urban Spatial Functions
This study introduced the Elasticity Index (EI) to quantitatively compare the rate of change in POI functional importance with variations in residents’ activity intensity across different time periods and urban functional zones. By evaluating the magnitude, direction, and fluctuations of EI values, the complexity of urban spatial functions and the responsiveness of different facility types to behavioral shifts could be effectively assessed.
The fluctuations in EI reflected the degree of functional balance and adaptability of urban space. As shown in Figure 10, the elasticity trajectories of different POI types during four periods exhibited distinct patterns across functional zones. The basic living areas displayed the most stable behavior, with smooth elasticity curves and minimal variation between time periods. This indicated a high level of alignment between functional supply and residents’ daily activity rhythms. In the residential areas with mixed functions, elasticity curved demonstrate moderate fluctuations with regular patterns, which slighted variations during commuting and sleeping transitions, and relative stability between daytime and leisure periods. These observations suggested robust spatial adaptability and flexible functional responses in such areas.
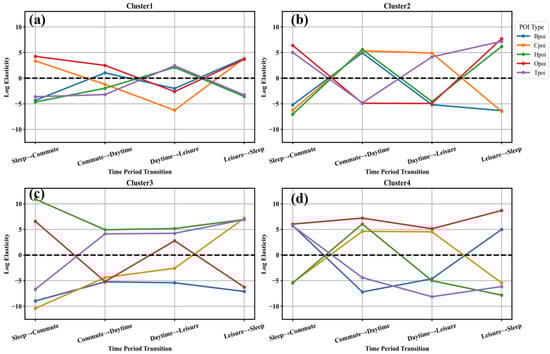
Figure 10.
Elasticity factor plots for each area: (a) basic Living Area; (b) residential area with mixed functions; (c) residential area with commercial attributes; (d) bustling business district.
In contrast, the residential areas with commercial functions and the bustling business districts showed greater volatility, particularly during the transition from leisure to sleep, suggesting heightened temporal sensitivity. These patterns indicated more specialized and less balanced functional structures in these zones.
Further analysis of the five main POI categories across 4 periods was conducted to assess their responsiveness to resident activity shifts. BPOI showed stable elasticity in both basic living areas and residential areas with mixed functions, while lower or negative values in the bustling business districts and residential areas with commercial functions suggested possible underutilization or mismatched resources. In particular, BPOI elasticity values were positive during the daytime period in the first two zones, with only small fluctuations across time transitions—implying well-allocated infrastructure that supports routine activities with low sensitivity to temporal changes. In the bustling business districts, BPOI showed positive elasticity in the Sleep-Commute and Leisure-Sleep transitions but exhibited high overall volatility. This indicated commuter-oriented infrastructure with lower utility during non-peak hours. In the Residential areas with commercial functions, BPOI values were consistently negative across all time transitions, pointing to insufficient infrastructure utilization. For example, areas such as Sanlitun, known for their entertainment functions, were relatively lacking in basic services like healthcare and education.
CPOI appeared underutilized in basic living areas, whereas they were more reasonably distributed in residential areas with mixed functions and bustling business districts. Additionally, in the residential areas with commercial functions, CPOI showed low usage during daytime but significantly increased in activity at night, characterizing a typical nighttime economy. In basic living areas, the negative elasticity from Daytime to Leisure indicated a mismatch between the timing of commercial activity and residents’ needs. In contrast, CPOI in the residential areas with mixed functions and the bustling business districts showed positive elasticity during Commute-Daytime and Daytime-Leisure transitions and negative values at other times, demonstrating alignment with resident rhythms and effective resource allocation. Notably, in the residential areas with commercial functions, CPOI was the only POI category with positive elasticity in the Leisure-Sleep period, confirming strong nighttime activity and adaptability.
OPOI showed strong temporal concentration. In the bustling business districts, OPOI maintained consistently high positive elasticity, even potentially extending into nighttime, which highlighting its role as a dense and efficient business hub. In basic living areas (Commute-Daytime) and residential areas with commercial functions (Daytime-Leisure), OPOI also showed positive elasticity, indicating some regularity of use, though possible shortages in resource availability. However, in the residential areas with mixed functions, OPOI elasticity was negative during both Commute-Daytime and Daytime-Leisure periods, suggesting weaker office functions or dilution due to mixed land uses.
TPOI demonstrated signs of insufficient allocation during the Sleep-Commute transition in both basic living areas and residential areas with commercial functions, while showing better responsiveness in residential areas with mixed functions and bustling business districts. Habitation (HPOI) displayed significantly positive elasticity in the Daytime-Leisure period within basic living areas, and in the Leisure-Sleep period in both residential areas with mixed functions and residential areas with commercial functions. These trends align with residents’ daily rest patterns, suggesting appropriate housing distribution. By contrast, in the bustling business districts, HPOI showed negative elasticity across most transitions, except for Commute-Daytime, which may reflect temporary use of housing as office space. This implied a lack of residential functions in the business core, with an absence of adequate housing infrastructure.
Based on the Elasticity Index (EI) results for the five types of facilities across different urban functional zones, this study proposed the following resource allocation strategies. (1) In basic living areas, the layout of commercial facilities should be optimized by increasing the number of convenience stores and community shops to meet residents’ needs during commuting and peak hours. In addition, public transportation infrastructure should be improved for commuting periods, such as by introducing earlier subway services. (2) In residential areas with mixed functions, the utilization of corporate and enterprise facilities should be enhanced to reinforce the multifunctionality of these areas. (3) In residential areas with commercial functions, basic infrastructure construction should be strengthened. At the same time, while maintaining vibrant nighttime commercial activity, efforts should be made to improve noise control and provide better transportation support. (4) In bustling business districts, the provision of basic living and residential facilities should be increased to ensure spatial vitality during non-daytime periods.
5. Discussion
5.1. Innovations of the Proposed Framework
In recent years, spatiotemporal big data have been widely applied in urban function identification and activity analysis, with growing research outputs. Compared with existing studies about the response of urban function to residents’ activities, this paper presents a deeper perspective. This paper extracted key activity periods and dynamic urban functions from big data using tensor decomposition, and combined them into new spatiotemporal patterns for interaction analysis. This avoided the limitations of conventional studies that rely on subjective spatiotemporal divisions. To provide a clearer comparison, residents’ activities in Beijing on 29 May were analyzed using different scales proposed in prior studies: a 1 km × 1 km spatial scale [34], a Morning period (7:00–12:00) [32], and 2-h intervals [33]. The random forest algorithm was then applied to calculate the feature importance of TPOI under these different temporal combinations (Table 3).
Table 3.
Calculation results at different spatiotemporal scales.
Although [32,33] examined the response of urban function to residents’ activities, their temporal–spatial divisions remained subjective. By comparing the TPOI features under this study’s identified activity periods (daytime, commuting, leisure, and sleeping) with those defined by [32] and the 2-h intervals used by [33], this paper found that the urban function identified here are more significant. In addition, comparing the urban spatial functions obtained in this study with [34], who analyzed TPOI importance within a single grid during commuting periods, further confirmed that our results better reflect actual activity demands. This enabled a deeper analysis of the underlying mechanisms. Unlike most data-mining studies of activity patterns, this study combined random forest with spatiotemporal combinations to quantify the role of different POI categories. The results revealed more complex and differentiated mechanisms behind resident behavior, enhancing interpretability. Furthermore, the elasticity index (EI) was introduced to evaluate the responsiveness of urban facilities during activity transitions, capturing the adaptability and capacity of urban spaces in meeting dynamic demands.
Ecological resilience is the ability of an ecosystem to preserve its essential functions, structures, identity, and feedback mechanisms following disturbances, and to recover or shift to a new stable state. Compared with previous studies that often use per capita resource availability to represent infrastructure resilience [65], this study further analyzes the elasticity of urban facilities. By fully accounting for the heterogeneity of residents’ activities and urban functional spaces, we construct temporally sensitive urban facility elasticity indicators, enabling more precise and targeted resource allocation strategies.
5.2. Nighttime Economy Development Planning Recommendations Based on Results
The development of the nighttime economy enhances urban vitality and promotes economic growth. It is a crucial approach for stimulating post-pandemic consumption recovery and building sustainable cities [66]. This study calculated the feature importance and elasticity factor of POIs on resident activity intensity during the sleep period across various urban functional spaces in Beijing. Through analysis of the response relationships between urban spatial functions and resident activities during nighttime (including leisure and sleep hours), this research provided new insights for nighttime economy development.
According to the elasticity factor results (Figure 9), CPOI in residential areas with commercial functions (Cluster 3) and basic living areas (Cluster 1) showed significant positive elasticity during the transition from leisure to sleep periods. Meanwhile, bustling business districts (Cluster 4) exhibited a high CPOI feature importance of 0.353, but the residential areas with mixed functions display negative elasticity and low feature importance, and thus were not considered suitable for nighttime economy development in this context. This study also analyzed the distribution of typical nighttime commercial facilities (e.g., bars and 24-h convenience stores) across four urban area types (Table 4). The positive elasticity in Cluster 1 and Cluster 3 indicated these two areas had higher nighttime commercial attributes and could serve as key carriers for nighttime economic activities.
Table 4.
Statistical Table of the Quantity of Some Nighttime Economic Facilities.
However, compared the results from random forest feature importance and nighttime commercial facility statistics revealed that, although the feature importance in the residential areas with commercial functions (Cluster 3) was 0.278, the value in basic living areas (Cluster 1) was only 0.087. This suggests that while the commercial facilities in Cluster 1 had some degree of nighttime adaptability, the limited number of such facilities weakened their impact on residents’ activities, thus restricting the development of the nighttime economy in these areas. In addition, bustling business districts (Cluster 4) have the highest share of nighttime commercial facilities (3.43%) and high feature importance (0.353), but the negative elasticity indicates a possible mismatch between the facility types and residents’ nighttime preferences.
Based on the above analysis, this study proposed the following nighttime economy development strategies for the three functional areas. (1) In basic living areas, priority should be given to the development of convenience stores, small-scale dining establishments, and night market stalls. Optimizing the spatial distribution of such facilities could enhance accessibility and convenience for nighttime consumption among residents. (2) Residential areas with commercial functions should be positioned as the key zones for nighttime economy development. Efforts should be made to improve environmental safety through measures such as enhanced lighting and nighttime patrols, thereby ensuring a secure and vibrant nighttime consumption environment. (3) In bustling business districts, more attention should be directed toward enriching nighttime cultural and entertainment functions. By introducing diverse leisure activities and expanding entertainment options, the attractiveness and vitality of these areas during non-working hours can be significantly improved.
5.3. Limitations of This Study and Future Work
In this study, Baidu Heat Map was selected to explore the characteristics of residents’ activities in Beijing on working day and rest day, and on this basis, the response of urban function to residents’ activities were studied. However, there are deficiencies in data representativeness and methodology. As this study focuses only on these two days, the analysis is limited in temporal scope. In future research, we plan to extend the study period to include more dates, covering typical holidays and different seasons (e.g., winter and spring), to further enrich the analysis. Firstly, the Baidu Heat Map data is limited to Baidu’s user group, and it inadequately represents the spatiotemporal behaviors of the elderly population and low-income groups [67]. In addition, as crowdsourced data, POI data has commercial preferences and regional differences. This leads to comprehensive representation of facilities with commercial attributes by POI data, while it may insufficiently represent public service facilities that are non-profit facilities.
Mobile signaling data can represent the real-time distribution of the urban population, reveal the spatiotemporal characteristics of human activities, and contain information such as the age and gender of users. Currently, many scholars have explored the spatiotemporal distribution and flow of residents’ activities based on mobile signaling data [68,69]. Due to limitations in data acquisition methods, this study failed to incorporate this data into the research. In future work, it is planned to combine mobile signaling data to correct the sample bias of Baidu Heat Map data, clean and inspect the POI data by combining field surveys and land use data, and select a longer observation period to study the periodic patterns of residents’ activities and their influencing factors.
6. Conclusions
Residents’ activity patterns shape the dynamic functions of urban spaces, while the dynamic characteristics of urban spaces in turn constrain the features of resident activities. Investigating the interaction between residents’ activities and urban spaces holds significant implications for urban planning and management. According to the framework proposed in this study, building upon large-scale data mining of residents’ key activity period patterns and the dynamic functions of urban spaces, this study thoroughly examined the responsiveness of various urban functions to resident activities across spatiotemporal combinations.
Through the spatiotemporal decomposition of the analytical framework, resident activity patterns in Beijing could be categorized into four temporal segments: Sleep (22:00–6:00), Commuting (6:00–10:00, 18:00–20:00), Daytime Activity (10:00–18:00), and Leisure (20:00–22:00). Concurrently, four resident activity clustering regions were identified: basic living areas, residential areas with mixed functions, residential areas with commercial functions, and bustling business districts.
Building upon these functional variations, the urban spatiotemporal comprehensive function exhibited significant variation across different urban spaces and resident activity periods, indicating that resident activities were constrained by urban spatial functions while simultaneously shaping these functions. Specifically, in basic living areas, basic facilities related features dominate during daytime activity periods, whereas residential features prevail during sleep periods. During commuting periods, transportation-related features were prominent in the residential areas with mixed functions area, while organizations-related features were more significant in basic living areas.
Delving deeper into these elasticity patterns, the elasticity indices of different functional areas showed marked differences, reflecting the degree of balance in urban spatial functions and the responsiveness of various facilities to residents’ temporal activity shifts. basic living areas and residential areas with mixed functions area exhibited relatively small fluctuations in elasticity indices, indicating more balanced functional structures. Conversely, residential areas with commercial functions and bustling business districts demonstrated larger elasticity fluctuations, suggesting more singular functional structures. Further analysis of specific elasticity indices reveals that basic living facilities tended to be stable in basic living areas and residential areas with mixed functions area, whereas resource utilization deficiencies or inadequate allocation were evident in bustling business districts and residential areas with commercial functions.
In summary, the proposed framework not only elucidated the intrinsic relationship between residents’ spatiotemporal activity patterns and dynamic urban spatial functions but also quantitatively characterized their interactive dynamics. In summary, the proposed framework not only elucidates the intrinsic relationship between residents’ spatiotemporal activity patterns and dynamic urban space functions, but also quantitatively depicts their interactive dynamics. The findings provide a scientific basis for urban resource allocation and functional zoning planning decisions. In the future, the framework’s application will be explored over longer time periods and in other cities and datasets, to support evidence-based urban planning and resilience assessment.
Supplementary Materials
The following supporting information can be downloaded at: https://www.mdpi.com/article/10.3390/land14112235/s1.
Author Contributions
D.H., Formal analysis, Methodology, Validation, Writing—original draft, Writing—review & editing. D.F., Formal analysis, Writing—original draft, Writing—review & editing. J.Z., Validation, Formal analysis, Conceptualization, Writing—review & editing. X.Z., Conceptualization, Funding acquisition, Supervision, Writing—review & editing. H.W., Visualization, Writing—original draft, Writing—review & editing. All authors have read and agreed to the published version of the manuscript.
Funding
This work was supported by National Natural Science Foundation of China: [grant No. 42371412, 41930650].
Data Availability Statement
The raw data supporting the conclusions of this article will be made available by the authors on request.
Acknowledgments
The authors would like to thank the editor and anonymous reviewers for their helpful and constructive comments to improve this article.
Conflicts of Interest
The authors declare no conflicts of interest.
References
- Batty, M. Cities as Complex Systems: Scaling, Interaction, Networks, Dynamics and Urban Morphologies. In Encyclopedia of Complexity and Systems Science; Meyers, R.A., Ed.; Springer: New York, NY, USA, 2009; pp. 1041–1071. [Google Scholar]
- Natapov, A.; Czamanski, D.; Fisher-Gewirtzman, D. Can visibility predict location? Visibility graph of food and drink facilities in the city. Surv. Rev. 2013, 45, 462–471. [Google Scholar] [CrossRef]
- Yu, J.; Hu, W.; Hou, L. Towards more resilient cities-analyzing the impact of new-type urbanization on urban resilience: Considering spatial spillover boundaries. Sustain. Cities Soc. 2024, 114, 105735. [Google Scholar] [CrossRef]
- Amirzadeh, M.; Sobhaninia, S.; Sharifi, A. Urban resilience: A vague or an evolutionary concept? Sustain. Cities Soc. 2022, 81, 103853. [Google Scholar] [CrossRef]
- Biswas, S.S.; Ahad, M.A.; Nafis, M.T.; Alam, M.A.; Biswas, R. Introducing “α-Sustainable Development” for transforming our world: A proposal for the 2030 agenda. J. Clean. Prod. 2021, 321, 129030. [Google Scholar] [CrossRef]
- Zhao, D.; Song, Y.; Zhang, M. Research on the resilience enhancement and spatial spillover effect of urban agglomeration construction. Sustain. Cities Soc. 2025, 134, 106964. [Google Scholar] [CrossRef]
- Halás, M.; Klapka, P. The timescape of the city: Example of spatial interactions based on big data. Habitat Int. 2023, 131, 102736. [Google Scholar] [CrossRef]
- Lv, Y.; Yang, J.; Xu, J.; Guan, X.; Zhang, J. High-dimensional urban dynamic patterns perception under the perspective of human activity semantics and spatiotemporal coupling. Sustain. Cities Soc. 2025, 121, 106192. [Google Scholar] [CrossRef]
- Acuto, M.; Parnell, S.; Seto, K.C. Building a global urban science. Nat. Sustain. 2018, 1, 2–4. [Google Scholar] [CrossRef]
- Du, F.; Wang, J.; Mao, L.; Kang, J. Daily rhythm of urban space usage: Insights from the nexus of urban functions and human mobility. Humanit. Soc. Sci. Commun. 2024, 11, 49. [Google Scholar] [CrossRef]
- Lv, S.; Yang, H.; Lu, X.; Zhang, F.; Wang, P. Exploring the Spatiotemporal Patterns of Passenger Flows in Expanding Urban Metros: A Case Study of Shenzhen. ISPRS Int. J. Geo-Inf. 2024, 13, 267. [Google Scholar] [CrossRef]
- Shi, Z.; Pun-Cheng, L.S.C.; Liu, X.; Lai, J.; Tong, C.; Zhang, A.; Zhang, M.; Shi, W. Analysis of the Temporal Characteristics of the Elderly Traveling by Bus Using Smart Card Data. ISPRS Int. J. Geo-Inf. 2020, 9, 751. [Google Scholar] [CrossRef]
- Chen, R.; Liu, L.; Gao, Y. The Association between Rainfall and Taxi Travel Activities: A Case Study from Wuhan, China. J. Adv. Transp. 2024, 2024, 1404168. [Google Scholar] [CrossRef]
- Shen, J.; Xintao, L.; Chen, M. Discovering spatial and temporal patterns from taxi-based Floating Car Data: A case study from Nanjing. GISci. Remote Sens. 2017, 54, 617–638. [Google Scholar] [CrossRef]
- Sun, M.; Xue, C.; Cheng, Y.; Zhao, L.; Long, Z. Analyzing Spatiotemporal Daily Travel Source Carbon Emissions Based on Taxi Trajectory Data. IEEE Access 2021, 9, 107012–107023. [Google Scholar] [CrossRef]
- Jiang, J.; Chen, M.; Zhang, J. How does residential segregation affect the spatiotemporal behavior of residents? Evidence from Shanghai. Sustain. Cities Soc. 2021, 69, 102834. [Google Scholar] [CrossRef]
- Shi, Y.; Yang, J.; Shen, P. Revealing the Correlation between Population Density and the Spatial Distribution of Urban Public Service Facilities with Mobile Phone Data. ISPRS Int. J. Geo-Inf. 2020, 9, 38. [Google Scholar] [CrossRef]
- Sun, H.; Chen, Y.; Lai, J.; Wang, Y.; Liu, X. Identifying Tourists and Locals by K-Means Clustering Method from Mobile Phone Signaling Data. J. Transp. Eng. Part. A 2021, 147, 04021070. [Google Scholar] [CrossRef]
- Xia, X.; Zhang, Y.; Zhang, Y.; Rao, T. The spatial pattern and influence mechanism of urban vitality: A case study of Changsha, China. Front. Environ. Sci. 2022, 10, 942577. [Google Scholar] [CrossRef]
- Huang, B.; Wang, J. Big spatial data for urban and environmental sustainability. Geo-Spat. Inf. Sci. 2020, 23, 125–140. [Google Scholar] [CrossRef]
- Zhang, J.; Zhang, R.; Zhang, X.; Yuan, X. Polycentric Spatial Structure Evolution and Influencing Factors of the Kunming–Yuxi Urban Agglomeration: Based on Multisource Big Data Fusion. Land 2023, 12, 1340. [Google Scholar] [CrossRef]
- Liu, Z.; Xia, H.; Zhang, T. A review of research methods on the coupling relationship between urban rail transit and urban space: Revealing spatiotemporal relationships through big data. Int. J. Digit. Earth 2024, 17, 2339363. [Google Scholar] [CrossRef]
- Yi, C.; Nam, J.; Kim, J.; Lee, J.-S. Comparison of the distributions of centrality indices: Using spatial big data to understand urban spatial structure. Cities 2024, 150, 105046. [Google Scholar] [CrossRef]
- Celan, M.; Lep, M. Bus-arrival time prediction using bus network data model and time periods. Future Gener. Comput. Syst.-Int. J. eSci. 2020, 110, 364–371. [Google Scholar] [CrossRef]
- Liu, S.; Long, Y.; Zhang, L.; Liu, H. Quantifying and Characterizing Urban Leisure Activities by Merging Multiple Sensing Big Data: A Case Study of Nanjing, China. Land 2021, 10, 1214. [Google Scholar] [CrossRef]
- Liu, J.; Meng, B.; Yang, M.; Peng, X.; Zhan, D.; Zhi, G. Quantifying spatial disparities and influencing factors of home, work, and activity space separation in Beijing. Habitat Int. 2022, 126, 102621. [Google Scholar] [CrossRef]
- Bai, X.; Jiao, X.; Zhang, P.; Sakai, T.; Xu, H. Public Perception of City Image Hotspots Based on Social Media: A Case Study of Nanjing, China. IEEE Access 2024, 12, 116678–116692. [Google Scholar] [CrossRef]
- Shi, H.; Huang, H.; Ma, D.; Chen, L.; Zhao, M. Capturing urban recreational hotspots from GPS data: A new framework in the lens of spatial heterogeneity. Comput. Environ. Urban Syst. 2023, 103, 101972. [Google Scholar] [CrossRef]
- Peng, J.; Liu, H.; Tang, J.; Peng, C.; Yang, X.; Deng, M.; Xu, Y. Exploring Crowd Travel Demands Based on the Characteristics of Spatiotemporal Interaction between Urban Functional Zones. ISPRS Int. J. Geo-Inf. 2023, 12, 225. [Google Scholar] [CrossRef]
- Fan, L.; Zhang, D. Study on the hotspots of urban tourism spaces based on Instagram-Worthy locations data: Taking Beijing as an example. Environ. Plan. B-Urban Anal. City Sci. 2023, 50, 1822–1837. [Google Scholar] [CrossRef]
- Bi, S.; Xu, R.; Liu, A.; Wang, L.; Wan, L. Mining Taxi Pick-Up Hotspots Based on Grid Information Entropy Clustering Algorithm. J. Adv. Transp. 2021, 2021, 1–25. [Google Scholar] [CrossRef]
- Li, J.; Li, J.; Yuan, Y.; Li, G. Spatiotemporal distribution characteristics and mechanism analysis of urban population density: A case of Xi’an, Shaanxi, China. Cities 2019, 86, 62–70. [Google Scholar] [CrossRef]
- Wang, X.; Zhang, Y.; Yu, D.; Qi, J.; Li, S. Investigating the spatiotemporal pattern of urban vibrancy and its determinants: Spatial big data analyses in Beijing, China. Land Use Policy 2022, 119, 106162. [Google Scholar] [CrossRef]
- Wu, C.; Ye, X.Y.; Ren, F.; Du, Q.Y. Check-in behaviour and spatio-temporal vibrancy: An exploratory analysis in Shenzhen, China. Cities 2018, 77, 104–116. [Google Scholar] [CrossRef]
- Liang, H.; Yan, Q.; Yan, Y.; Zhang, L.; Zhang, Q. Spatiotemporal Study of Park Sentiments at Metropolitan Scale Using Multiple Social Media Data. Land 2022, 11, 1497. [Google Scholar] [CrossRef]
- Kupfer, J.A.; Li, Z.; Ning, H.; Huang, X. Using Mobile Device Data to Track the Effects of the COVID-19 Pandemic on Spatiotemporal Patterns of National Park Visitation. Sustainability 2021, 13, 9366. [Google Scholar] [CrossRef]
- Chen, D.; Long, X.; Li, Z.; Liao, C.; Xie, C.; Che, S. Exploring the Determinants of Urban Green Space Utilization Based on Microblog Check-In Data in Shanghai, China. Forests 2021, 12, 1783. [Google Scholar] [CrossRef]
- Ullah, H.; Wan, W.; Haidery, S.A.; Khan, N.U.; Ebrahimpour, Z.; Luo, T. Analyzing the Spatiotemporal Patterns in Green Spaces for Urban Studies Using Location-Based Social Media Data. ISPRS Int. J. Geo-Inf. 2019, 8, 506. [Google Scholar] [CrossRef]
- Kovacs-Gyoeri, A.; Ristea, A.; Kolcsar, R.; Resch, B.; Crivellari, A.; Blaschke, T. Beyond Spatial Proximity-Classifying Parks and Their Visitors in London Based on Spatiotemporal and Sentiment Analysis of Twitter Data. ISPRS Int. J. Geo-Inf. 2018, 7, 378. [Google Scholar] [CrossRef]
- Yu, B.; Sun, J.; Wang, Z.; Jin, S. Influencing Factors of Street Vitality in Historic Districts Based on Multisource Data: Evidence from China. ISPRS Int. J. Geo-Inf. 2024, 13, 277. [Google Scholar] [CrossRef]
- Jover, J.; Diaz-Parra, I. Who is the city for? Overtourism, lifestyle migration and social sustainability. Tour. Geogr. 2022, 24, 9–32. [Google Scholar] [CrossRef]
- Zeng, F.; Shen, Z. Study on the Impact of Historic District Built Environment and Its Influence on Residents’ Walking Trips: A Case Study of Zhangzhou Ancient City’s Historic District. Int. J. Environ. Res. Public Health 2020, 17, 4367. [Google Scholar] [CrossRef]
- Tang, S.; Ta, N. How the built environment affects the spatiotemporal pattern of urban vitality: A comparison among different urban functional areas. Comput. Urban Sci. 2022, 2, 39. [Google Scholar] [CrossRef]
- Zhou, H.; Yuan, J.; Yi, D.; Jin, S.; Zhao, Y.; Zhang, Z.; Zhao, Z.; Zhang, J. A novel dynamic quantification model for diurnal urban land use intensity. Cities 2024, 148, 104861. [Google Scholar] [CrossRef]
- Balsas, C.J.L. Walkable Cities: Revitalization, Vibrancy, and Sustainable Consumption; State University of New York Press: Albany, NY, USA, 2019. [Google Scholar]
- Cai, L.; Xu, J.; Liu, J.; Ma, T.; Pei, T.; Zhou, C. Sensing multiple semantics of urban space from crowdsourcing positioning data. Cities 2019, 93, 31–42. [Google Scholar] [CrossRef]
- Güller, C.; Varol, C. Unveiling the daily rhythm of urban space: Exploring the influence of built environment on spatiotemporal mobility patterns. Appl. Geogr. 2024, 170, 103366. [Google Scholar] [CrossRef]
- Yang, M.; Zhou, M.; He, X.; Wang, Y.; Chen, Z.; Xia, J. Incremental spatiotemporal flow colocation quotient: A new spatiotemporal association analysis method for geographical flows. Int. J. Geogr. Inf. Sci. 2025, 39, 1296–1319. [Google Scholar] [CrossRef]
- Zhong, Q.; Li, B.; Dong, T. Building sustainable slow communities: The impact of built environments on leisure-time physical activities in Shanghai. Humanit. Soc. Sci. Commun. 2024, 11, 828. [Google Scholar] [CrossRef]
- Fang, L.; Huang, J.; Zhang, Z.; Nitivattananon, V. Data-driven framework for delineating urban population dynamic patterns: Case study on Xiamen Island, China. Sustain. Cities Soc. 2020, 62, 102365. [Google Scholar] [CrossRef] [PubMed]
- Bao, W.; Gong, A.; Zhang, T.; Zhao, Y.; Li, B.; Chen, S. Mapping Population Distribution with High Spatiotemporal Resolution in Beijing Using Baidu Heat Map Data. Remote Sens. 2023, 15, 458. [Google Scholar] [CrossRef]
- Bhatt, V.; Kumar, S.; Saini, S. Tucker decomposition and applications. Mater. Today 2021, 46, 10787–10792. [Google Scholar] [CrossRef]
- Peng, S.; Yang, Z.; Ling, B.W.-K.; Chen, B.; Lin, Z. Dual semi-supervised convex nonnegative matrix factorization for data representation. Inf. Sci. 2022, 585, 571–593. [Google Scholar] [CrossRef]
- Mørup, M.; Hansen, L.K.; Arnfred, S.M. Algorithms for Sparse Nonnegative Tucker Decompositions. Neural Comput. 2008, 20, 2112–2131. [Google Scholar] [CrossRef] [PubMed]
- Xu, J.; Liu, J.; Xu, Y.; Lv, Y.; Pei, T.; Du, Y.; Zhou, C. Identification of spatial and functional interactions in Beijing based on trajectory data. Appl. Geogr. 2022, 145, 102744. [Google Scholar] [CrossRef]
- Zhang, J.; Zhao, X.; Han, D. Assessing the impact of COVID-19 on residents’ activities using baidu heat map data: From the lockdown era to the post-pandemic era. Int. J. Digit. Earth 2025, 18, 2454381. [Google Scholar] [CrossRef]
- Brown, M.G.L.; Peterson, M.G.; Tezaur, I.K.; Peterson, K.J.; Bull, D.L. Random forest regression feature importance for climate impact pathway detection. J. Comput. Appl. Math. 2025, 464, 116479. [Google Scholar] [CrossRef]
- Genuer, R.; Poggi, J.-M.; Tuleau-Malot, C.; Villa-Vialaneix, N. Random Forests for Big Data. Big Data Res. 2017, 9, 28–46. [Google Scholar] [CrossRef]
- Nohara, Y.; Matsumoto, K.; Soejima, H.; Nakashima, N. Explanation of machine learning models using shapley additive explanation and application for real data in hospital. Comput. Methods Programs Biomed. 2022, 214, 106584. [Google Scholar] [CrossRef]
- Reilly, E.E. The Use of the Elasticity Concept in Economic Theory. Can. J. Econ. Political Sci. 1940, 6, 39–55. [Google Scholar] [CrossRef]
- Nievergelt, Y. The Concept of Elasticity in Economics. SIAM Rev. 1983, 25, 261–265. [Google Scholar] [CrossRef]
- Faqi, S. The Preliminary Analysis of Change of Elasticity Coefficient of Energy Consumption and the Relevant Causes of China. Stat. Res. 2005, 5, 8–11. [Google Scholar] [CrossRef]
- Wang, Y.; Zeng, W.; Wu, S.; Jia, J. Elastic Coefficient-Based Warning System for the Environment-economic System of Daxing District. China Popul. Resour. Environ. 2011, S1, 562–565. [Google Scholar]
- Shamshirband, S.; Keivani, A.; Mohammadi, K.; Lee, M.; Hamid, S.H.A.; Petkovic, D. Assessing the proficiency of adaptive neuro-fuzzy system to estimate wind power density: Case study of Aligoodarz, Iran. Renew. Sustain. Energy Rev. 2016, 59, 429–435. [Google Scholar] [CrossRef]
- Jiang, N.; Jiang, W. How does regional integration policy affect urban resilience? Evidence from urban agglomeration in China. Environ. Impact Assess. Rev. 2024, 104, 107298. [Google Scholar] [CrossRef]
- Yan, G.; Zou, L.; Liu, Y. The Spatial Pattern and Influencing Factors of China’s Nighttime Economy Utilizing POI and Remote Sensing Data. Appl. Sci. 2024, 14, 400. [Google Scholar] [CrossRef]
- Song, Y.; Lyu, Y.; Qian, S.; Zhang, X.; Lin, H.; Wang, S. Identifying urban candidate brownfield sites using multi-source data: The case of Changchun City, China. Land Use Policy 2022, 117, 106084. [Google Scholar] [CrossRef]
- Liu, Y.; Lu, A.; Yang, W.; Tian, Z. Investigating factors influencing park visit flows and duration using mobile phone signaling data. Urban For. Urban Green. 2023, 85, 127952. [Google Scholar] [CrossRef]
- Li, J.; Zhao, P.; Zhang, M.; Deng, Y.; Liu, Q.; Cui, Y.; Gong, Z.; Liu, J.; Tan, W. Exploring collective activity space and its spatial heterogeneity using mobile phone signaling Data: A case of Shenzhen, China. Travel Behav. Soc. 2025, 38, 100920. [Google Scholar] [CrossRef]
Disclaimer/Publisher’s Note: The statements, opinions and data contained in all publications are solely those of the individual author(s) and contributor(s) and not of MDPI and/or the editor(s). MDPI and/or the editor(s) disclaim responsibility for any injury to people or property resulting from any ideas, methods, instructions or products referred to in the content. |
© 2025 by the authors. Licensee MDPI, Basel, Switzerland. This article is an open access article distributed under the terms and conditions of the Creative Commons Attribution (CC BY) license (https://creativecommons.org/licenses/by/4.0/).