Article

Effects of Riparian Zone Width and Soil Depth: Soil Environmental Factors Drive Changes in Soil Enzyme Activity

1
State Key Laboratory of Water Engineering Ecology and Environment in Arid Area, Xi’an University of Technology, Xi’an 710048, China
2
Yellow River Engineering Consulting Co., Zhengzhou 450003, China
3
Power China Northwest Engineering Corporation Limited, Xi’an 710065, China
4
Shaanxi Union Research Center of University and Enterprise for River and Lake Ecosystems Protection and Restoration, Xi’an 710065, China
*
Author to whom correspondence should be addressed.
Land 2025, 14(10), 2056; https://doi.org/10.3390/land14102056
Submission received: 1 September 2025 / Revised: 3 October 2025 / Accepted: 5 October 2025 / Published: 15 October 2025

Abstract

Functioning as a critical ecotone between terrestrial and aquatic ecosystems, riparian zones exhibit soil enzyme activities that serve as key biomarkers of their nutrient cycling processes. However, despite considerable focus on riparian soil properties, the dynamics and underlying drivers of these enzymatic activities are not yet fully characterized. To this end, soils were systematically sampled across varying widths and depths from three representative riparian zones to quantify the driving forces of physicochemical properties on enzyme activity dynamics. The results showed that the soil enzyme activity was highest in the forest riparian zone and lowest in the farmland riparian zone, with average enzyme activities of 37.95 (μmol·g−1·h−1) and 26.85 (μmol·g−1·h−1), respectively. The width of the riparian zone changes the spatial distribution of soil enzyme activity. The soil enzyme activity is higher in the land edge area far from the river (profile-1) and lower in the water edge area near the river (profile-4), with average enzyme activities of 47.4384 (μmol·g−1·h−1) and 17.0017 (μmol·g−1·h−1), respectively. Moreover, soil water content (SWC) has a strong impact on enzyme activity changes. The increase in soil depth reduces soil enzyme activity, with enzyme activity in the 0–20 cm soil layer being 1.5 times higher than in the 20–50 cm soil layer. Meanwhile, the primary factors influencing changes in soil enzyme activity have gradually shifted from total nitrogen (TN), nitrate nitrogen (NO3-N), and soil organic carbon (SOC) to the sole control of SOC. Research has shown that human influence strongly interferes with soil enzyme activity in riparian zones. The width of the riparian zone and soil depth serve as key drivers of the spatial distribution of soil enzyme activity by modulating soil environmental factors. The patterns revealed in this study indicate that maintaining appropriate riparian zone width and reducing anthropogenic disturbances can enhance nutrient cycling dynamics at the micro-scale by increasing soil enzyme activity. This process is crucial for strengthening the riparian zone’s macro-level ecosystem services, particularly by effectively enhancing its capacity to sequester and transform nutrients like nitrogen and phosphorus from agricultural nonpoint sources, thereby safeguarding downstream water quality. Consequently, soil enzyme activity serves as a key indicator, providing essential scientific basis for assessing riparian health and guiding ecological restoration efforts.

1. Introduction

Riparian zones are important components of river ecosystems [1]. Riparian zones provide important environmental services to watersheds by acting as biofilters, capturing and transforming pollutants, and influencing nutrient cycling processes in the soil system, which is important for river water quality protection [2]. The most important service function of riparian zones is to promote ecosystem diversity and ensure water ecological security of watersheds [3]. Therefore, exploring soil geochemical processes in riparian zones can help managers to develop riparian zone protection measures.
As products of plant root secretions and microbial activities [4], soil enzymes are pivotal in decomposing organic matter and driving nutrient cycles, thereby playing a crucial role in ecosystem functioning and restoration. Unlike soil physicochemical properties, which respond sluggishly to environmental disturbances [5], enzyme activities react rapidly, making them sensitive early indicators for assessing soil ecosystem changes [6]. Significant correlations exist between these activities and the bioavailability and cycling of carbon, nitrogen, and phosphorus [7]. Key examples include cellulase and glucosidase in carbon cycling, phosphatase in organophosphorus decomposition, and urease in nitrogen transformation [8,9,10]. Since enzyme dynamics are closely linked to soil physicochemical conditions [11], understanding their variation patterns and drivers is essential for predicting soil quality.
Riparian zones typically range, extending from hydrologic pulsing areas near the river to upland areas away from the river [12]. In riparian zone areas close to rivers, river hydrologic pulsing can exacerbate the exchange of materials between soil and river, which can affect soil physicochemical properties and microbial environment [13]. It has been suggested that changes in river levels, frequency of flooding during the flood season, and duration of flooding can affect soil enzyme activities [14]. In upland areas away from rivers, vegetation and soil can form small systems that affect the cycling of nutrients in the soil [15]. Horizontal distance in riparian zones can lead to differences in soil physicochemical properties and microbial community structure, which can affect the decomposition and transformation of organic matter [16]. In addition to changes in the horizontal direction of the riparian zone, the effect of its soil depth on soil enzyme activity is also of interest. In general, soil enzyme activity decreases significantly with increasing soil depth, mainly due to the existence of a stratification gradient in soil nutrients [17]. At the same time, the accumulation and biological characteristics of organic matter in the surface soil, which makes microbial activity significantly higher in the surface soil than in the deeper soil, affect to some extent the microbial secretion for enzyme activity [18]. However, it has been noted that soil enzyme activities are higher in deeper soils than in surface soils. Certain enzymes retain activity on clay minerals and in deeper soil layers, aided by substrate availability at depth [19]. Although soil enzymes are present throughout the soil profile, most studies on soil enzymes have focused on surface soils (above 20 cm depth), and our knowledge of enzyme activity at different soil depths remains inadequate.
In summary, the riparian zone is a complex ecosystem with a soil environment that is subject to many external disturbances. A lot of research has been done on riparian zone soil ecosystems. For example, the effects of flood inundation at different frequency fields on the carbon, nitrogen and phosphorus cycling processes in riparian zone soils [20], the effects of dividing riparian zone buffer zones on the water quality of the river, and the process of soil enzyme changes in the process of dry and wet alternation in riparian zones [21]. Although there have been many studies on riparian zone soils, soil-vegetation systems, and nutrient changes and transport transformations between soils and streams [22], few studies have systematically assessed the effects of riparian zone width and soil depth on soil environmental conditions. Particularly, how soil physicochemical properties govern enzyme activity.
The Weihe River Basin is a relatively developed economic basin in the northwest region of China, and has an important strategic position in the national regional economic pattern. The Xi’an-Weinan section of the main stream of the Weihe River selected in this study is the most economically developed and densely populated river section in the entire basin, and is an important water system for the survival of residents in the Guanzhong Plain. Meanwhile, the rapid urbanization process has also posed a significant threat to the ecological environment of the watershed. As an important part of watershed water quality protection and functional application, the monitoring of the soil environment in riparian zones is particularly important. Therefore, we took the typical riparian zone of the main stream of the Weihe River as the research site, revealing the spatial variation characteristics and influencing factors of soil enzyme activity under the joint drive of riparian zone width and soil depth. This study had three primary objectives: (1) to elucidate the effect of riparian zone width on the spatial distribution of soil enzyme activity; (2) to examine the relationship between soil depth and changes in enzyme activity; and (3) to clarify the effect of soil physicochemical properties on enzyme activity at the riparian zone scale. This study can provide scientific recommendations for river water quality control and watershed ecological protection.

2. Materials and Methods

2.1. Overview of the Study Area

The riparian zone sample sites we selected are located in the Xianyang-Weinan section of the mainstem of the Weihe River (WHR), which is highly urbanized and densely populated in the watershed [23]. The WHR is an important water system in the loess hills and gullies and the Guanzhong Plain, providing important ecosystem services for human life, industry and agriculture in the region (Figure 1a,b). The riparian zone sample site has a slope of approximately 3° and the soil parent material is predominantly loess. The land use types adjacent to the riparian zone are mainly town land, woodland and arable land. The arable riparian zone is mainly planted with maize, wheat and canola. The predominant tree species in the woodland riparian zone is willow. Due to the drastic impacts of urbanization and anthropogenic activities, the retention and purification of pollutants in the riparian zone have been affected to a certain extent, affecting the ecological functions in the watershed [24].

2.2. Sample Collection

Based on preliminary field research, we designed three types of urban riparian zones (URZ, U), forested riparian zones (FRZ, F), and agricultural riparian zones (CRZ, C) for soil sample collection (Figure 1c). Firstly, the sampling area was set up as a riparian zone with a width of 70 m and a length of 60 m, while attention should be paid to the similarity of vegetation types and coverage within the selected riparian zone sample plots. Secondly, sampling sites were set up in the selected three types of riparian zones and soil samples were collected in the areas of 0–10 m, 10–30 m, 30–50 m and 50–70 m, respectively. Due to practical constraints, this study employed the lateral distance along the riverbank as a proxy for the hydrological gradient. This approach was adopted based on prior research and confirmed through preliminary surveys observing vegetation and terrain homogeneity. Although direct inundation frequency data were unavailable, the subsequently measured soil water content (SWC) gradient (Section 3—Results,) effectively validated that this spatial gradient accurately represents the continuous variation in hydrological conditions. Among them, the 0–10 m and 10–30 m sampling areas are susceptible to hydrologic pulsing from the river and have higher soil moisture content than the 30–50 m and 50–70 m sampling areas. Soil sampling sites were defined as profiles 4, 3, 2, and 1. For each soil profile, we collected two parallel samples at a distance of 40 m apart (Figure 1d). Two soil samples were collected at each sampling site, one mixed sample from 0–20 cm soil depth and another mixed sample from 20–50 cm soil depth. Soil was collected by removing stone impurities and plant roots, and two parallel samples were mixed well and brought back to the laboratory for measurement of soil physicochemical properties and soil enzyme activities. In addition, two water samples, defined as A and B, were collected at each riparian zone sample site, with sampling points A and B 40 m apart. Water samples were used to monitor river water quality.

2.3. Laboratory Analysis

2.3.1. Physical and Chemical Properties of River

The determination of river water quality is divided into in-situ monitoring and laboratory testing. pH, dissolved oxygen (DO), electrical conductivity (Econd), and redox potential (ORP) were measured using a handheld multi-parameter water quality analyzer (Hach, HQ40d) [25]. During the measurement, it was ensured that the electrode was submerged in the water and avoided contact with river sediment, rocks, or aquatic vegetation. At the same time, measure each point three times to reduce the error of in-situ monitoring. The concentrations of dissolved organic carbon (DOC) and total nitrogen (TN) were determined with a TOC analyzer (TOC-l analyzer, Shimadzu, Japan), while total phosphorus (TP), nitrate nitrogen (NO3-N), nitrite nitrogen (NO2-N), and ammonia nitrogen (NH4-N) were analyzed using a UV-visible spectrophotometer (UV-2550, Shimadzu, Tokyo, Japan).

2.3.2. Physical and Chemical Properties of Soil

Soil pH was measured with a water quality multi-parameter spectrometer (HQ4300) using the glass electrode method in a 1:2.5 (mass:volume) soil–water suspension following 3 min of stirring and 30 min of settling [26]. Soil organic carbon (SOC) was quantified by potassium dichromate titration, where 0.3–0.6 g of air-dried, 100-mesh soil was digested with concentrated sulphuric acid (18.4 mol/L) at 180 °C for 5 min, then titrated with FeSO4 (0.2 mol/L) after cooling. Concentrations of soil total nitrogen (TN), total phosphorus (TP), nitrate nitrogen (NO3-N), nitrite nitrogen (NO2-N), and ammonia nitrogen (NH4-N) were analyzed using a UV-visible spectrophotometer (UV-2550, Shimadzu, Japan) [27]. For these analyses, soil samples were extracted with deionized water at a 1:5 (mass:volume) ratio, then shaken, centrifuged, and filtered through a 0.45 μm membrane before measurement within 24 h. Finally, SWC was determined by drying samples at 105–110 °C until a constant weight was achieved [28].

2.3.3. Soil Enzyme Activity

Soil enzyme activity was measured using a microplate fluorescence assay. Fresh soil samples were employed for the determination. After collection, samples were stored at 4 °C and briefly equilibrated at 4 °C prior to measurement to prevent artificial effects on extracellular enzyme activity caused by microbial cell lysis. We determined six soil enzymes, namely P-acquisition enzyme, alkaline phosphatase (AP). N-acquisition enzyme, leucine aminopeptidase (LAP), and β-1,4-N-acetylglucosaminidase (NAG). C-acquisition enzyme, β-1,4-glucosidase (BG), β-xylose glucosidase (EC), and cellulase (EG), by means of an enzyme marker. The primary reasons for selecting these enzymes are twofold. First, these six enzymes are closely associated with microbial metabolic activities and serve as important indicators of microbial nutritional requirements [29]. Second, in previous studies, these six enzymes have been repeatedly used as indicators of C-, N-, and P-uptake enzymes [30,31]. Therefore, we selected the aforementioned six enzymes as the enzyme activity indicators in our study.
Following homogenization of fresh soil samples with sodium acetate buffer, the mixture was combined with specific enzyme substrates in a calibration plate using a pipette. The plates were then incubated at a constant temperature, with incubation times of 2 h for AP and LAP, and 4 h for NAG, BG, EC, and EG. Enzyme activities were measured in an enzyme lab immediately after the incubation period [32]. The sediment enzyme activity (Ab, in μmol·g−1·h−1) was determined using the following parameters:
A b = F V e V 1 t m
F = f f b q f s
e = f r C s V 2
q = f q f b f r
  • F: Corrected fluorescence;
  • q: Quenching coefficient;
  • e: Fluorescence release coefficient;
  • V: Total sediment suspension volume = 125 mL;
  • V1: Sample suspension volume per well = 0.2 mL;
  • t: Dark incubation time = 4 h;
  • m: Dry mass of sediment (equivalent to 1 g fresh sample);
  • f, fb: Fluorescence of sample and blank wells;
  • fs, fr: Fluorescence of negative control and reference standard wells;
  • Cs, V2: Concentration (10 μmol·L−1) and volume (0.00005 L) of reference standard;

2.4. Data Analysis and Statistics

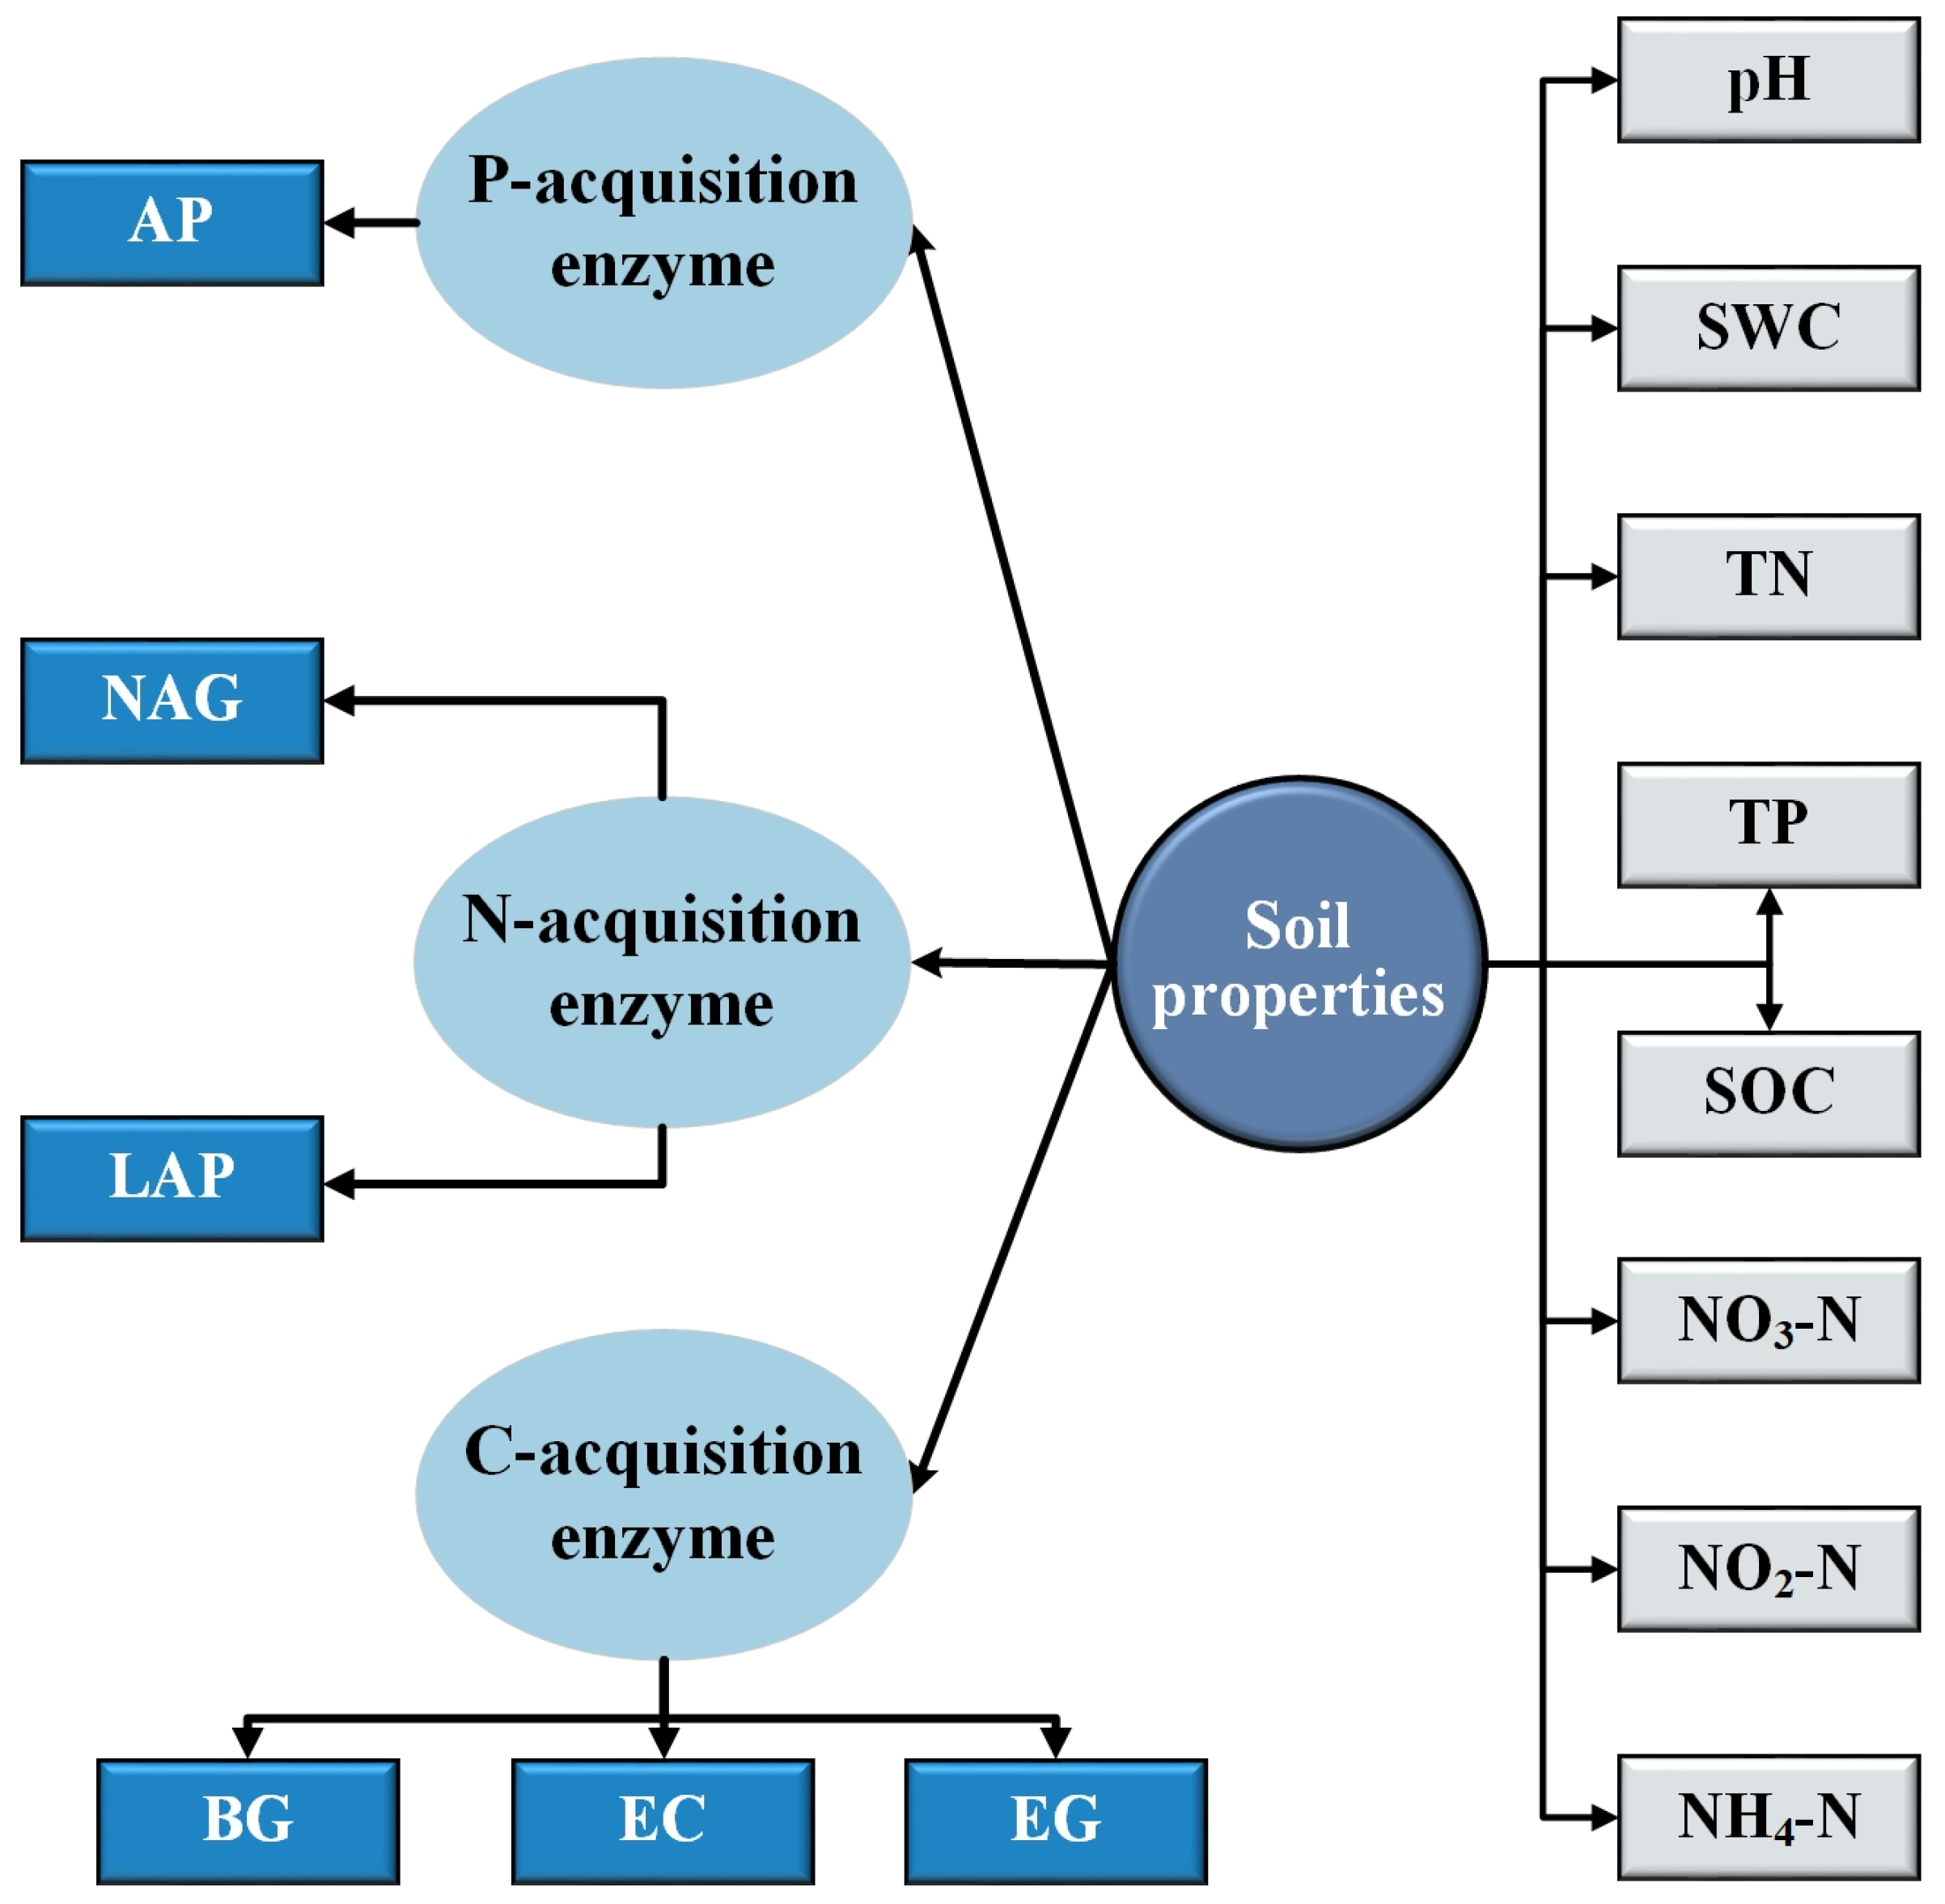
This study employed a suite of statistical methods to analyze the data. One-way ANOVA assessed differences in water/soil properties and enzyme activities among urban, forest, and cropland riparian zones. A two-way ANOVA examined the individual and interactive effects of riparian width and soil depth on enzyme activities. Discriminant function analysis (DFA) visualized how riparian type and width influenced enzyme activity at two soil depths, while principal component analysis (PCA) identified the dominant enzymes driving these changes. Pearson correlation analysis revealed relationships between enzyme activities and soil properties across different widths [33]. Furthermore, the partial least squares structural equation model (PLS-SEM) was used to quantify the drivers of enzyme activity changes at different soil depths. PLS-SEM, a second-generation multivariate technique, establishes logical relationships among multiple variables through its structural model, with path coefficients (β) indicating the strength and direction of effects [34,35]. The significance threshold was set at p < 0.05. The weight coefficient of a measurement variable measures the relative contribution of each measurement variable to its corresponding latent variable. A larger absolute value indicates a greater contribution of that measurement variable to the formation of the latent variable. In the model, GOF is used to evaluate the superiority of the structural equation model and R2 is used to evaluate the explanatory power of the model [36]. In this study, we hypothesized that soil physicochemical properties would have a direct effect on P-, N- and C-acquisition enzymes (Figure 2). The above statistical analyses were performed using Excel 2021, SPSS 25, Canoco 5 and SmartPLS 4 software [37,38].

3. Results

3.1. Physical-Chemical Properties of River in Different Riparian Zones

The physicochemical properties of river water varied significantly among the riparian zones (Figure 3). The cropland riparian zone had the lowest pH (ave = 8.06) and the urban riparian zone had the highest pH (ave = 8.58). DO was highest in the forestland riparian zone (ave = 11.2 mg/L) and EC was highest in the cropland riparian zone (ave = 853 µs/cm). ORP varied less under different riparian zones. It was found that TN, TP and DOC were lowest in the forestland riparian zone (ave = 5.7 mg/L, 0.28 mg/L, 8.23 mg/L, respectively) and highest in the cropland riparian zone (ave = 9.5 mg/L, 0.46 mg/L, 14.69 mg/L, respectively). NO3-N and NO2-N were the highest in the forestland riparian zone, with mean values of 3.3 mg/L and 0.63 mg/L, respectively. NH4-N in the cropland riparian zone was much higher than that in the urban and forestland riparian zones. In addition, the concentrations of all water quality parameters except pH, DO and ORP were higher in profile A than in profile B, which may be related to the accumulation of pollutants during the flow of river water.

3.2. Physical-Chemical Properties of Soil in Different Riparian Zones

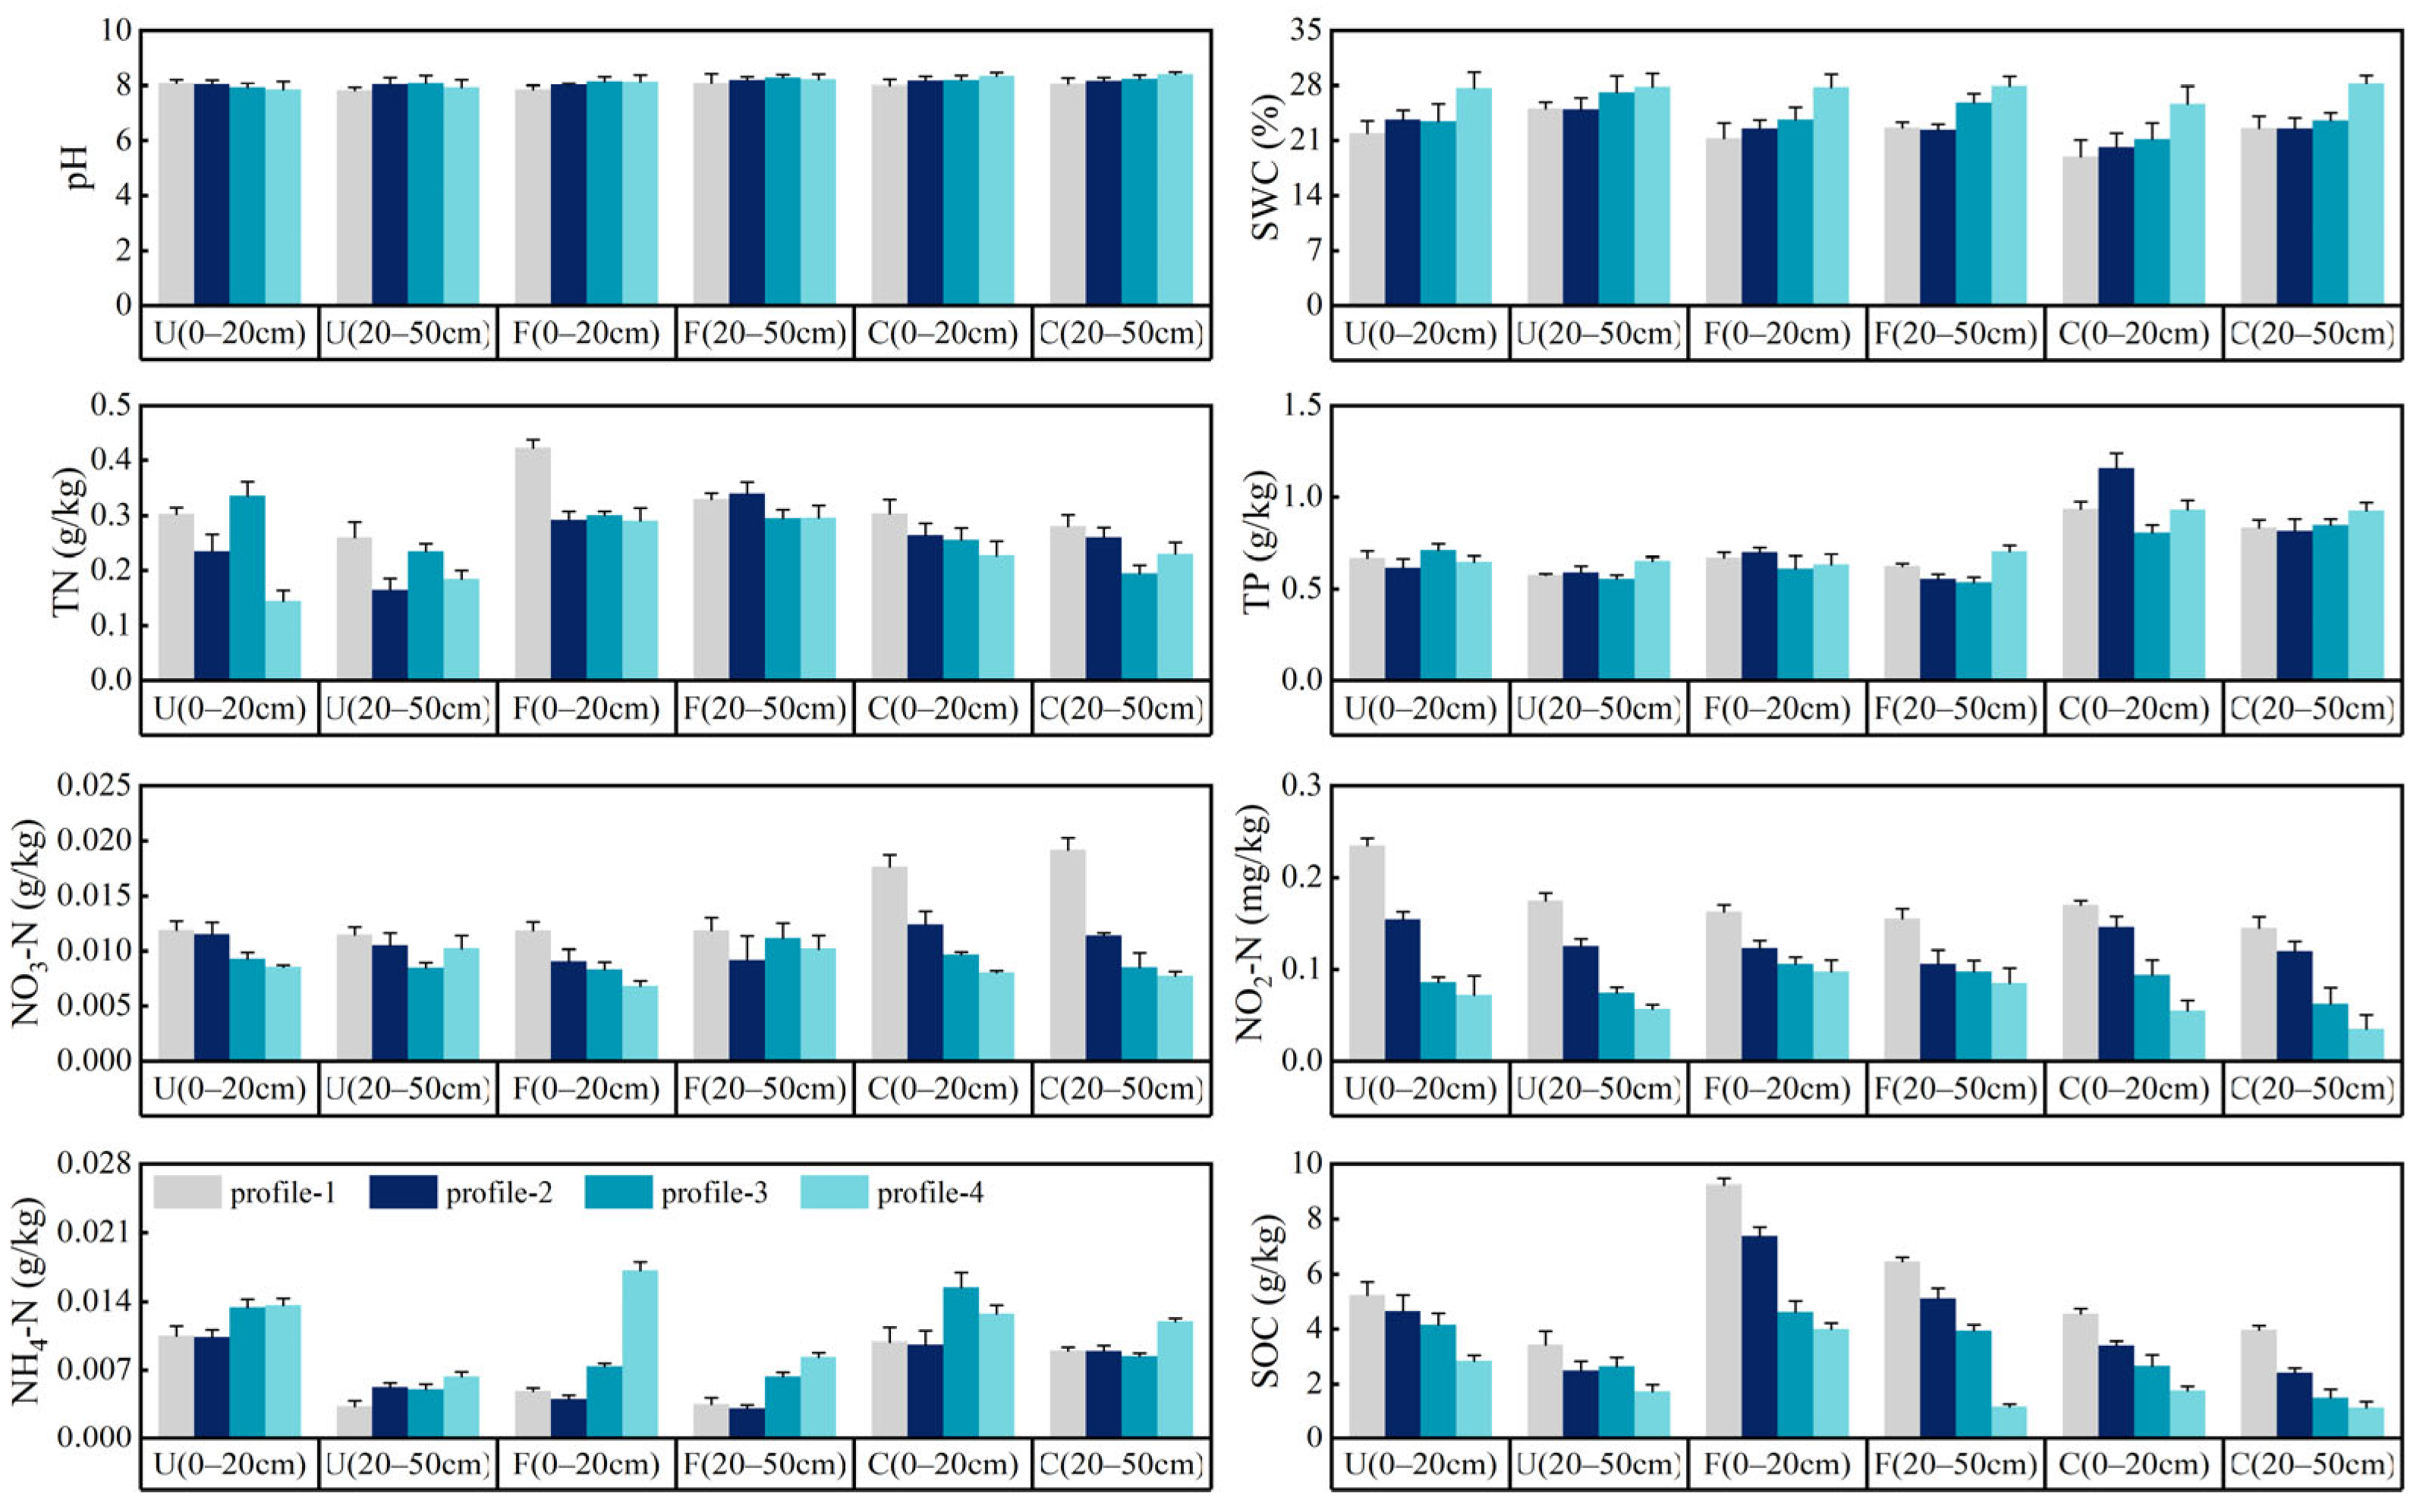
The physicochemical properties of riparian soils exhibited significant spatial heterogeneity (Figure 4). Soil pH of different riparian zones ranged from 7.83~9.40. The pH of the urban riparian zone showed lower values close to the river. Forestland and cropland riparian zones showed opposite trends in pH. SWC showed a trend of higher values closer to the river in all the different riparian zones, with higher SWC in the urban and forestland riparian zones. TN was higher in the forestland riparian zone, spatially exhibiting high content in profile 4 and low content in profiles 1 and 2. TP was higher in the riparian zone of the cropland and its content did not change significantly at the two soil depths. NO3-N and NH4-N showed opposite spatial trends, with NO3-N being higher in riparian zone areas away from the river and NH4-N being higher in riparian zone areas close to the river. SOC content in the riparian zone exhibited a clear trend, decreasing with proximity to the river. Among them, the SOC in the riparian zone of the forestland was the highest. Taken together, the soil physicochemical properties in the riparian zone showed obvious stratification characteristics, with the nutrient content under the 0–20 cm soil depth being higher than that under the 20–50 cm. Meanwhile, at the same soil depth, the soil physicochemical properties of the profiles showed a spatial characteristic of lower content the closer they were to the river, which excluded NH4-N and pH.

3.3. Soil Enzyme Activities in Different Riparian Zones

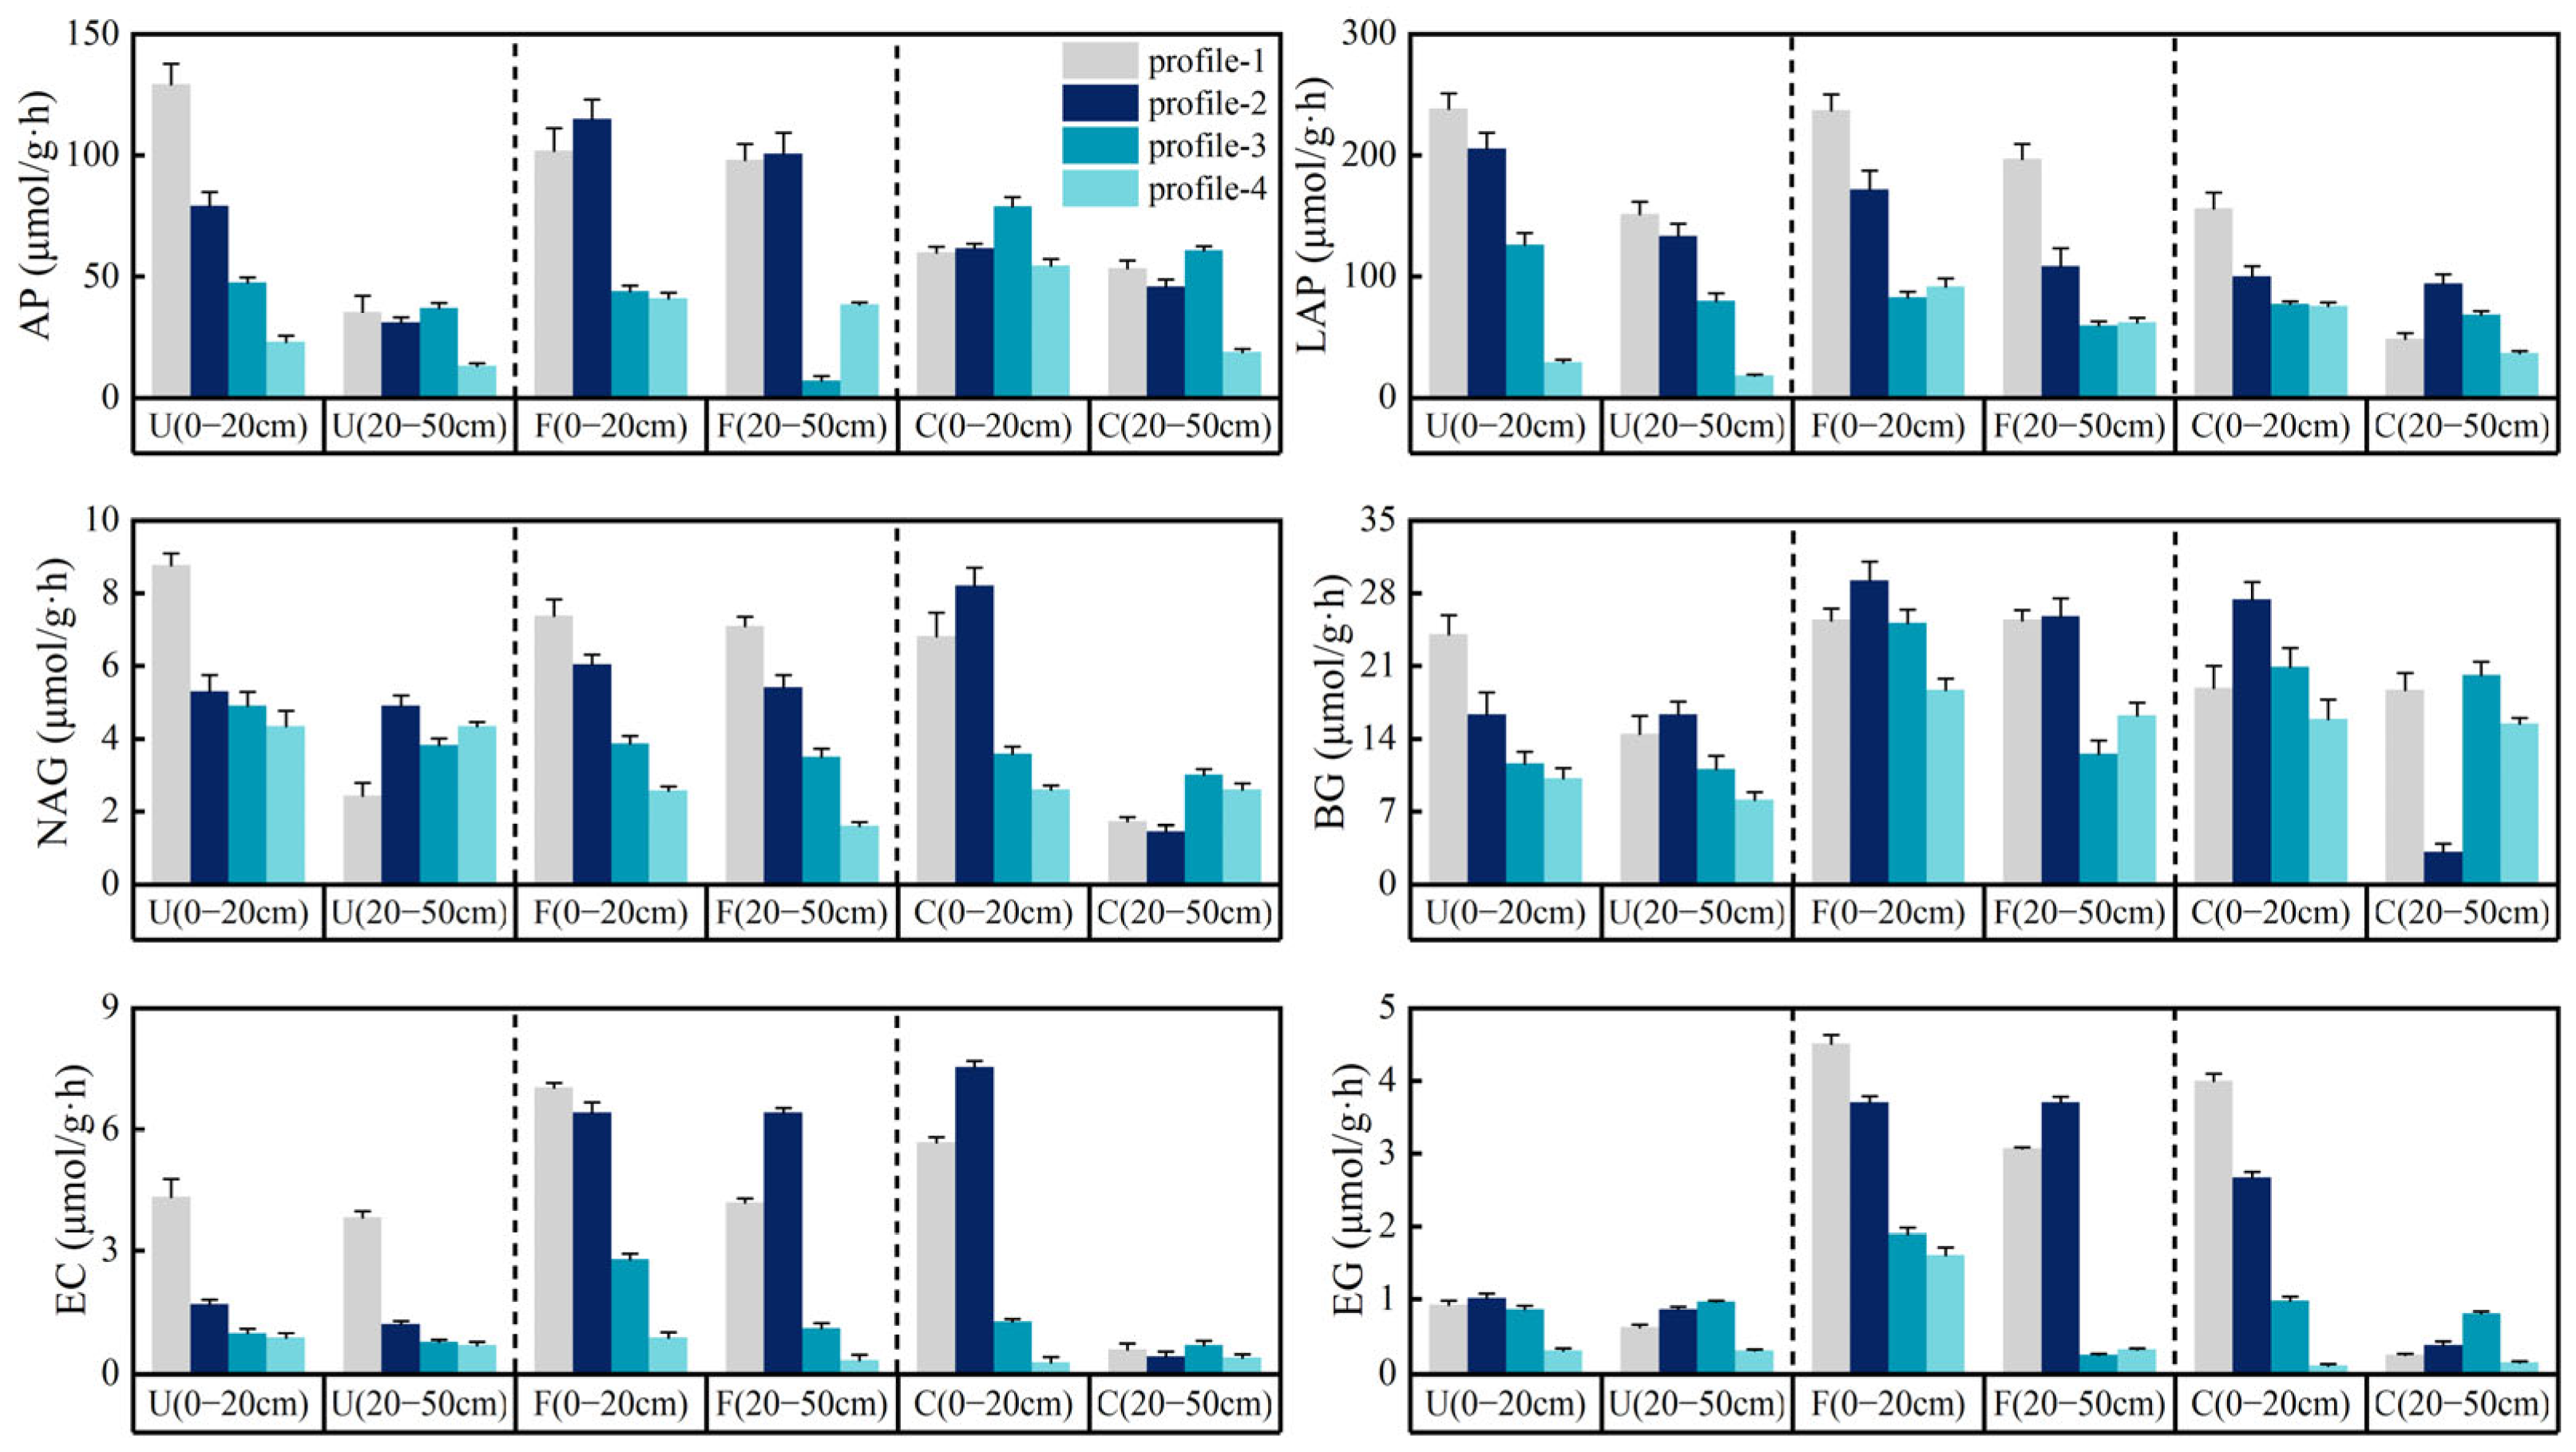
Riparian zone width and soil depth were key determinants shaping the spatial distribution of enzyme activity (Figure 5). For the P-acquisition enzyme, AP activity varied considerably under different profiles in the urban and forestland riparian zone, as evidenced by much higher AP activity in profiles 1 and 2 than in profiles 3 and 4, and smaller differences under the four profiles in the cropland riparian zone. For N-acquisition enzymes, LAP showed the lowest activity in profile 4 near the river and the highest activity in profile 1 away from the river in all the different riparian zones. This phenomenon was consistent across both soil depths. NAG activity showed a spatial distribution pattern of reduced enzyme activity close to the river in the 0–20 cm soil depth. However, a distinct pattern emerged at the 20–50 cm depth compared to the 0–20 cm layer: under urban and cropland riparian zones, enzyme activity was higher in profiles farther from the river. Across the three riparian types, the forestland exhibited the highest activities for C-acquisition enzymes, notably for BG. EC activity was much higher in profiles 1 and 2 than in profiles 3 and 4. EG activity varied considerably between soil depths in the cropland riparian zone, and there was a smaller difference between the two soil depths in the urban riparian zone. In summary, soil enzyme activity peaked in the forestland riparian zone and was consistently higher in the topsoil (0–20 cm) compared to the subsoil (20–50 cm).
A two-way ANOVA was performed to disentangle the individual and interactive effects of riparian zone width and soil depth on soil enzyme activity (Table 1). LAP and EC were significantly affected by the width of the riparian zone, with large differences in soil enzyme activities at different profile points as width varied. AP, NAG, and BG exhibited significant depth-dependent variation, while EG was influenced by the interaction between riparian zone width and soil depth.

3.4. DFA and PCA Analyses of Soil Enzyme Activities

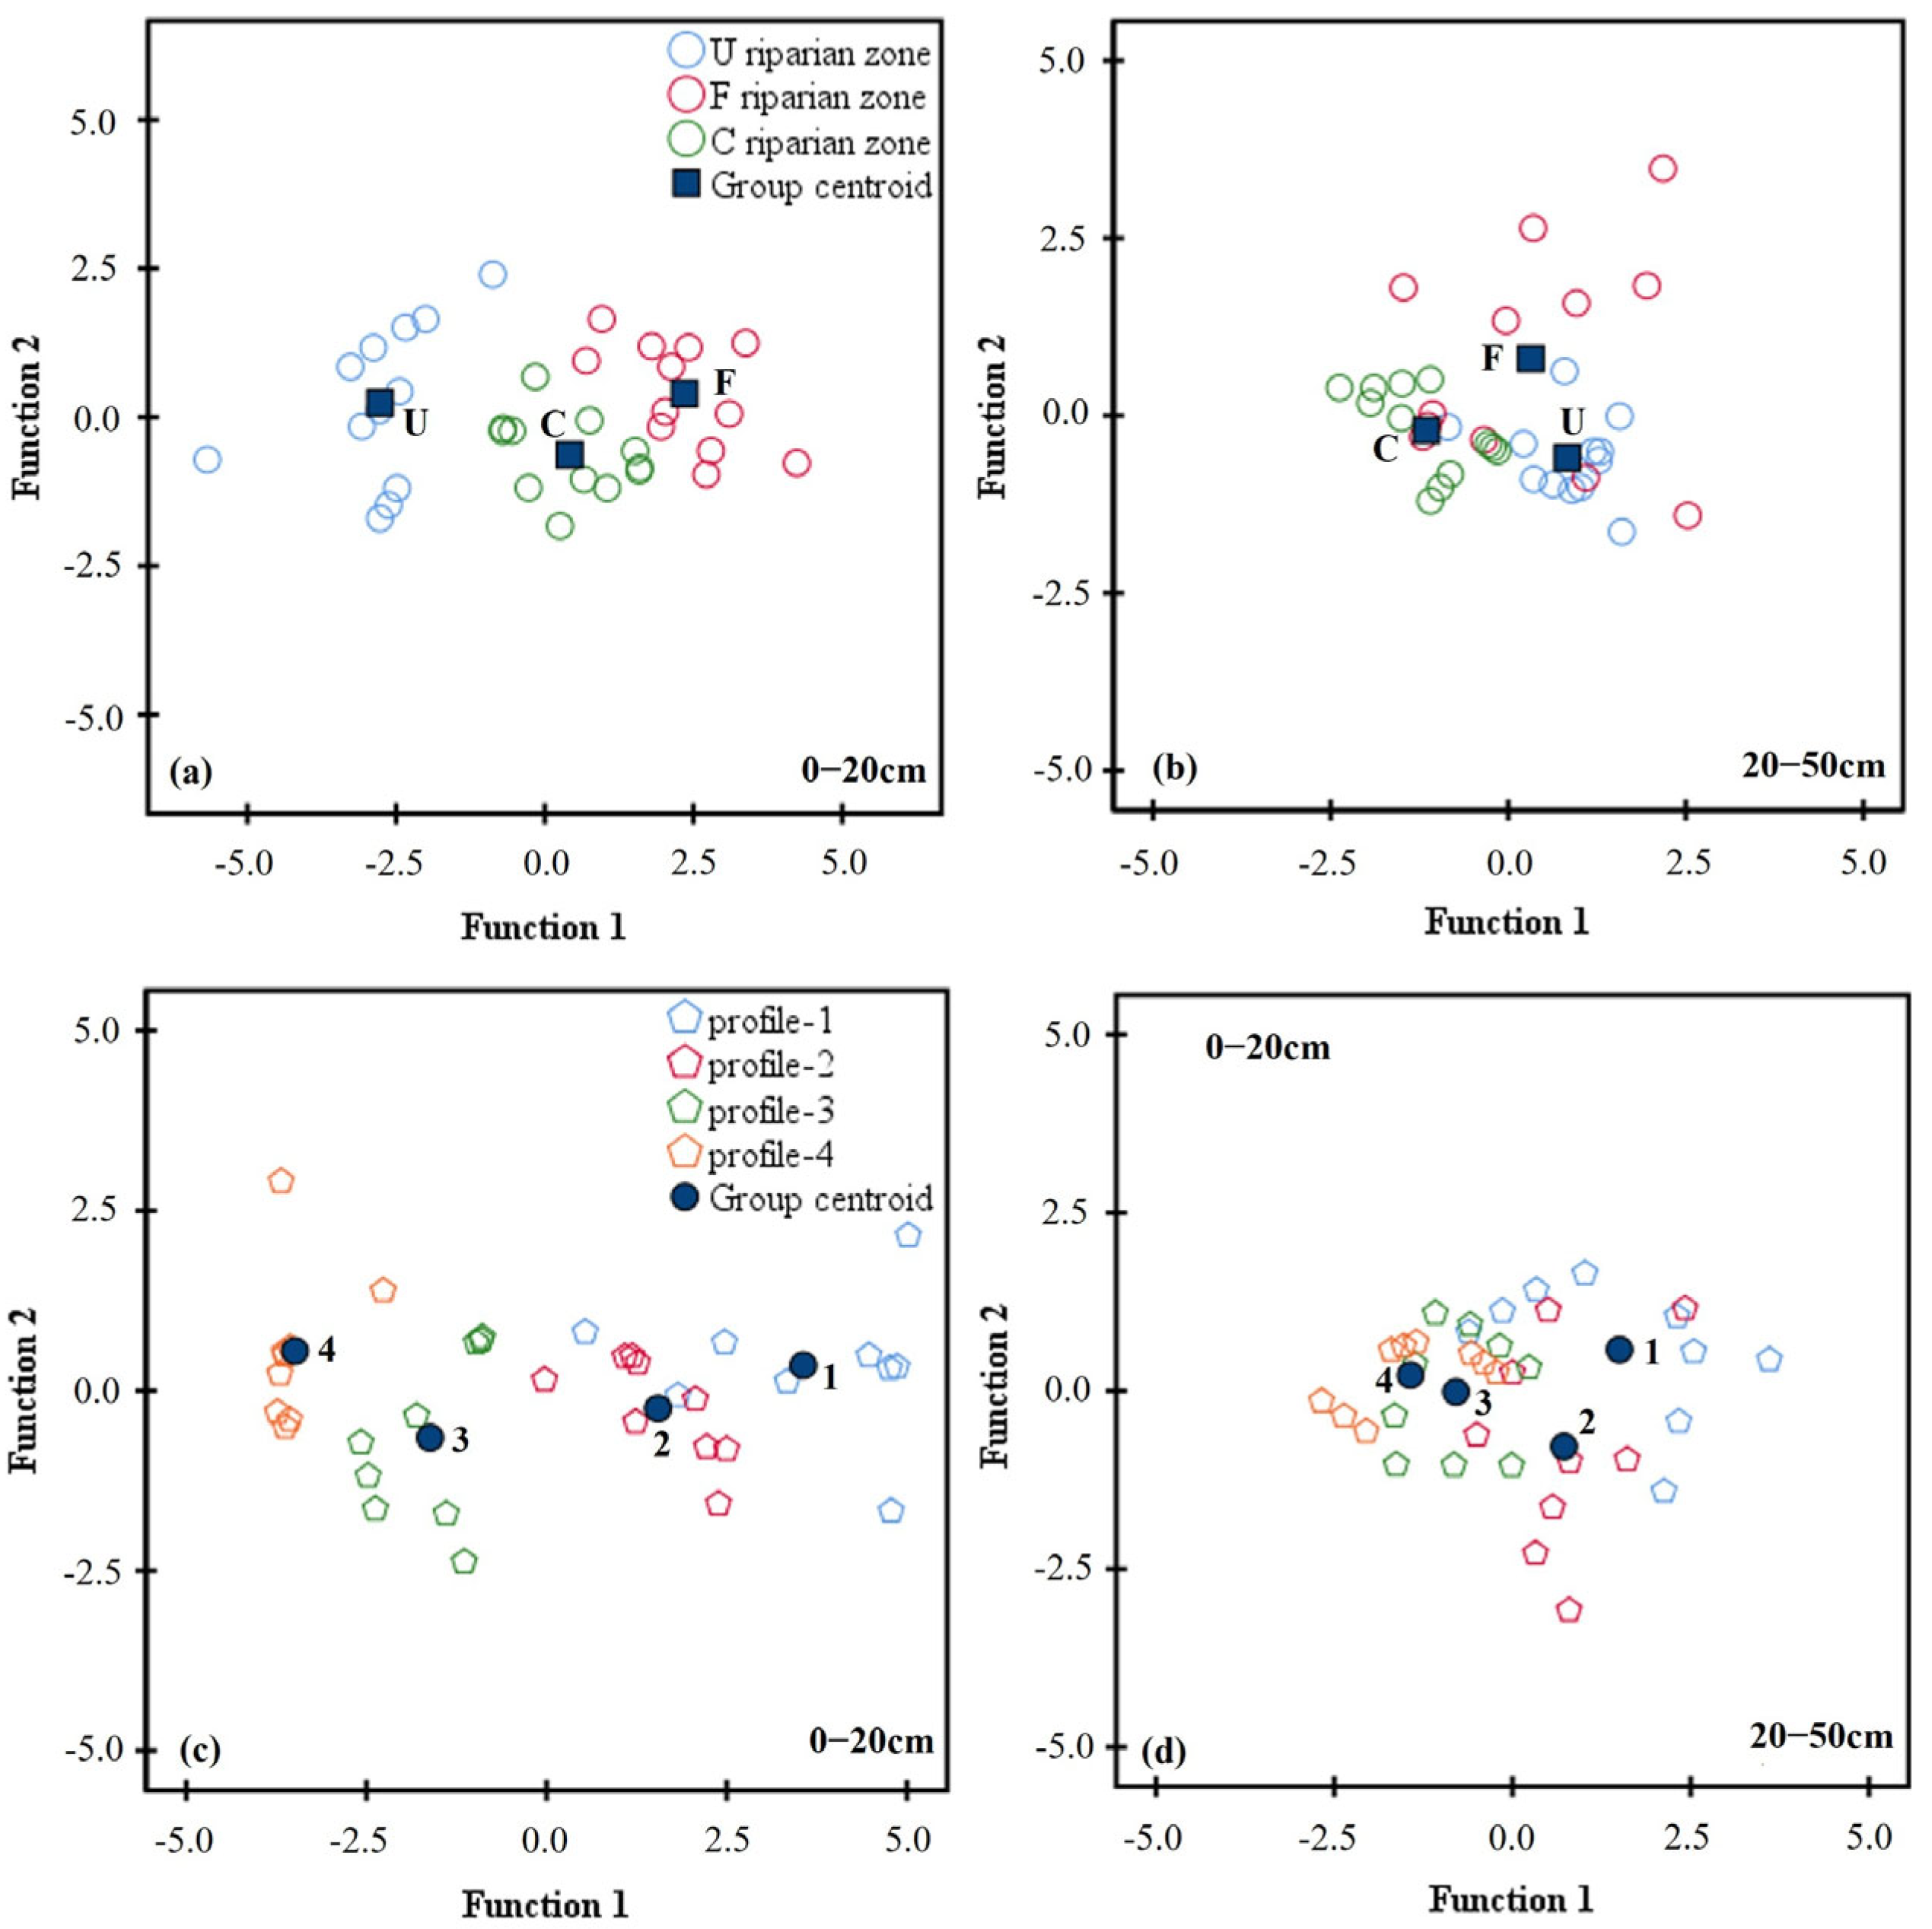
We used DFA to classify soil enzyme activities, identifying the degree of variation in soil enzyme activities across riparian zone types and riparian zone widths (Figure 6). Taking the type of riparian zone as a variable, we found that the three types of riparian zone enzyme activities were more aggregated under 20–50 cm than under 0–20 cm, which suggests that the differences between different types of riparian zones in surface soils gradually decrease with soil depth. Under the riparian zone width as a variable, soil enzyme activities were more dispersed on the four profiles at 0–20 cm soil depth than at 20–50 cm, while profiles 3 and 4 were more aggregated at 20–50 cm depth. In addition, analyzing the coefficients of the discriminant function showed that changes in soil enzyme activities were dominated by N- and C-acquisition enzymes at 0–20 cm depth, and by P-acquisition enzymes at 20–50 cm depth. As for the riparian zone width as a variable, N-acquisition enzymes were dominated by N-acquisition enzymes at 0–20 cm depth, and C- and N-acquisition enzymes were dominated by C- and N-acquisition enzymes at 20–50 cm depth. This suggests that there is variability in the type and width of riparian zones affecting changes in enzyme activity. At the same time, variation in soil depth eliminates differences in environmental conditions brought about by surface soil.
PCA was employed to identify the dominant C-, N-, and P-acquiring enzymes at both soil depths. The first principal component (PC1), which explained 44.86% and 46.33% of the total variance in the 0–20 cm and 20–50 cm layers, respectively, was analyzed to determine key enzymes. The scoring functions revealed distinct dominant enzymes: EC and EG characterized the shallow layer (0–20 cm), whereas LAP and NAG prevailed in the deeper layer (20–50 cm). At 0–20 cm soil depth, PC1 = 0.148 AP + 0.208 LAP + 0.237 BG + 0.304 EC + 0.291 EG + 0.268 NAG. At 20–50 cm soil depth, PC1 = 0.193 AP + 0.238 LAP + 0.225 BG + 0.215 EC + 0.241 EG + 0.250 NAG.

3.5. Analysis of Drivers of Riparian Zone Width Affecting Soil Enzyme Activity

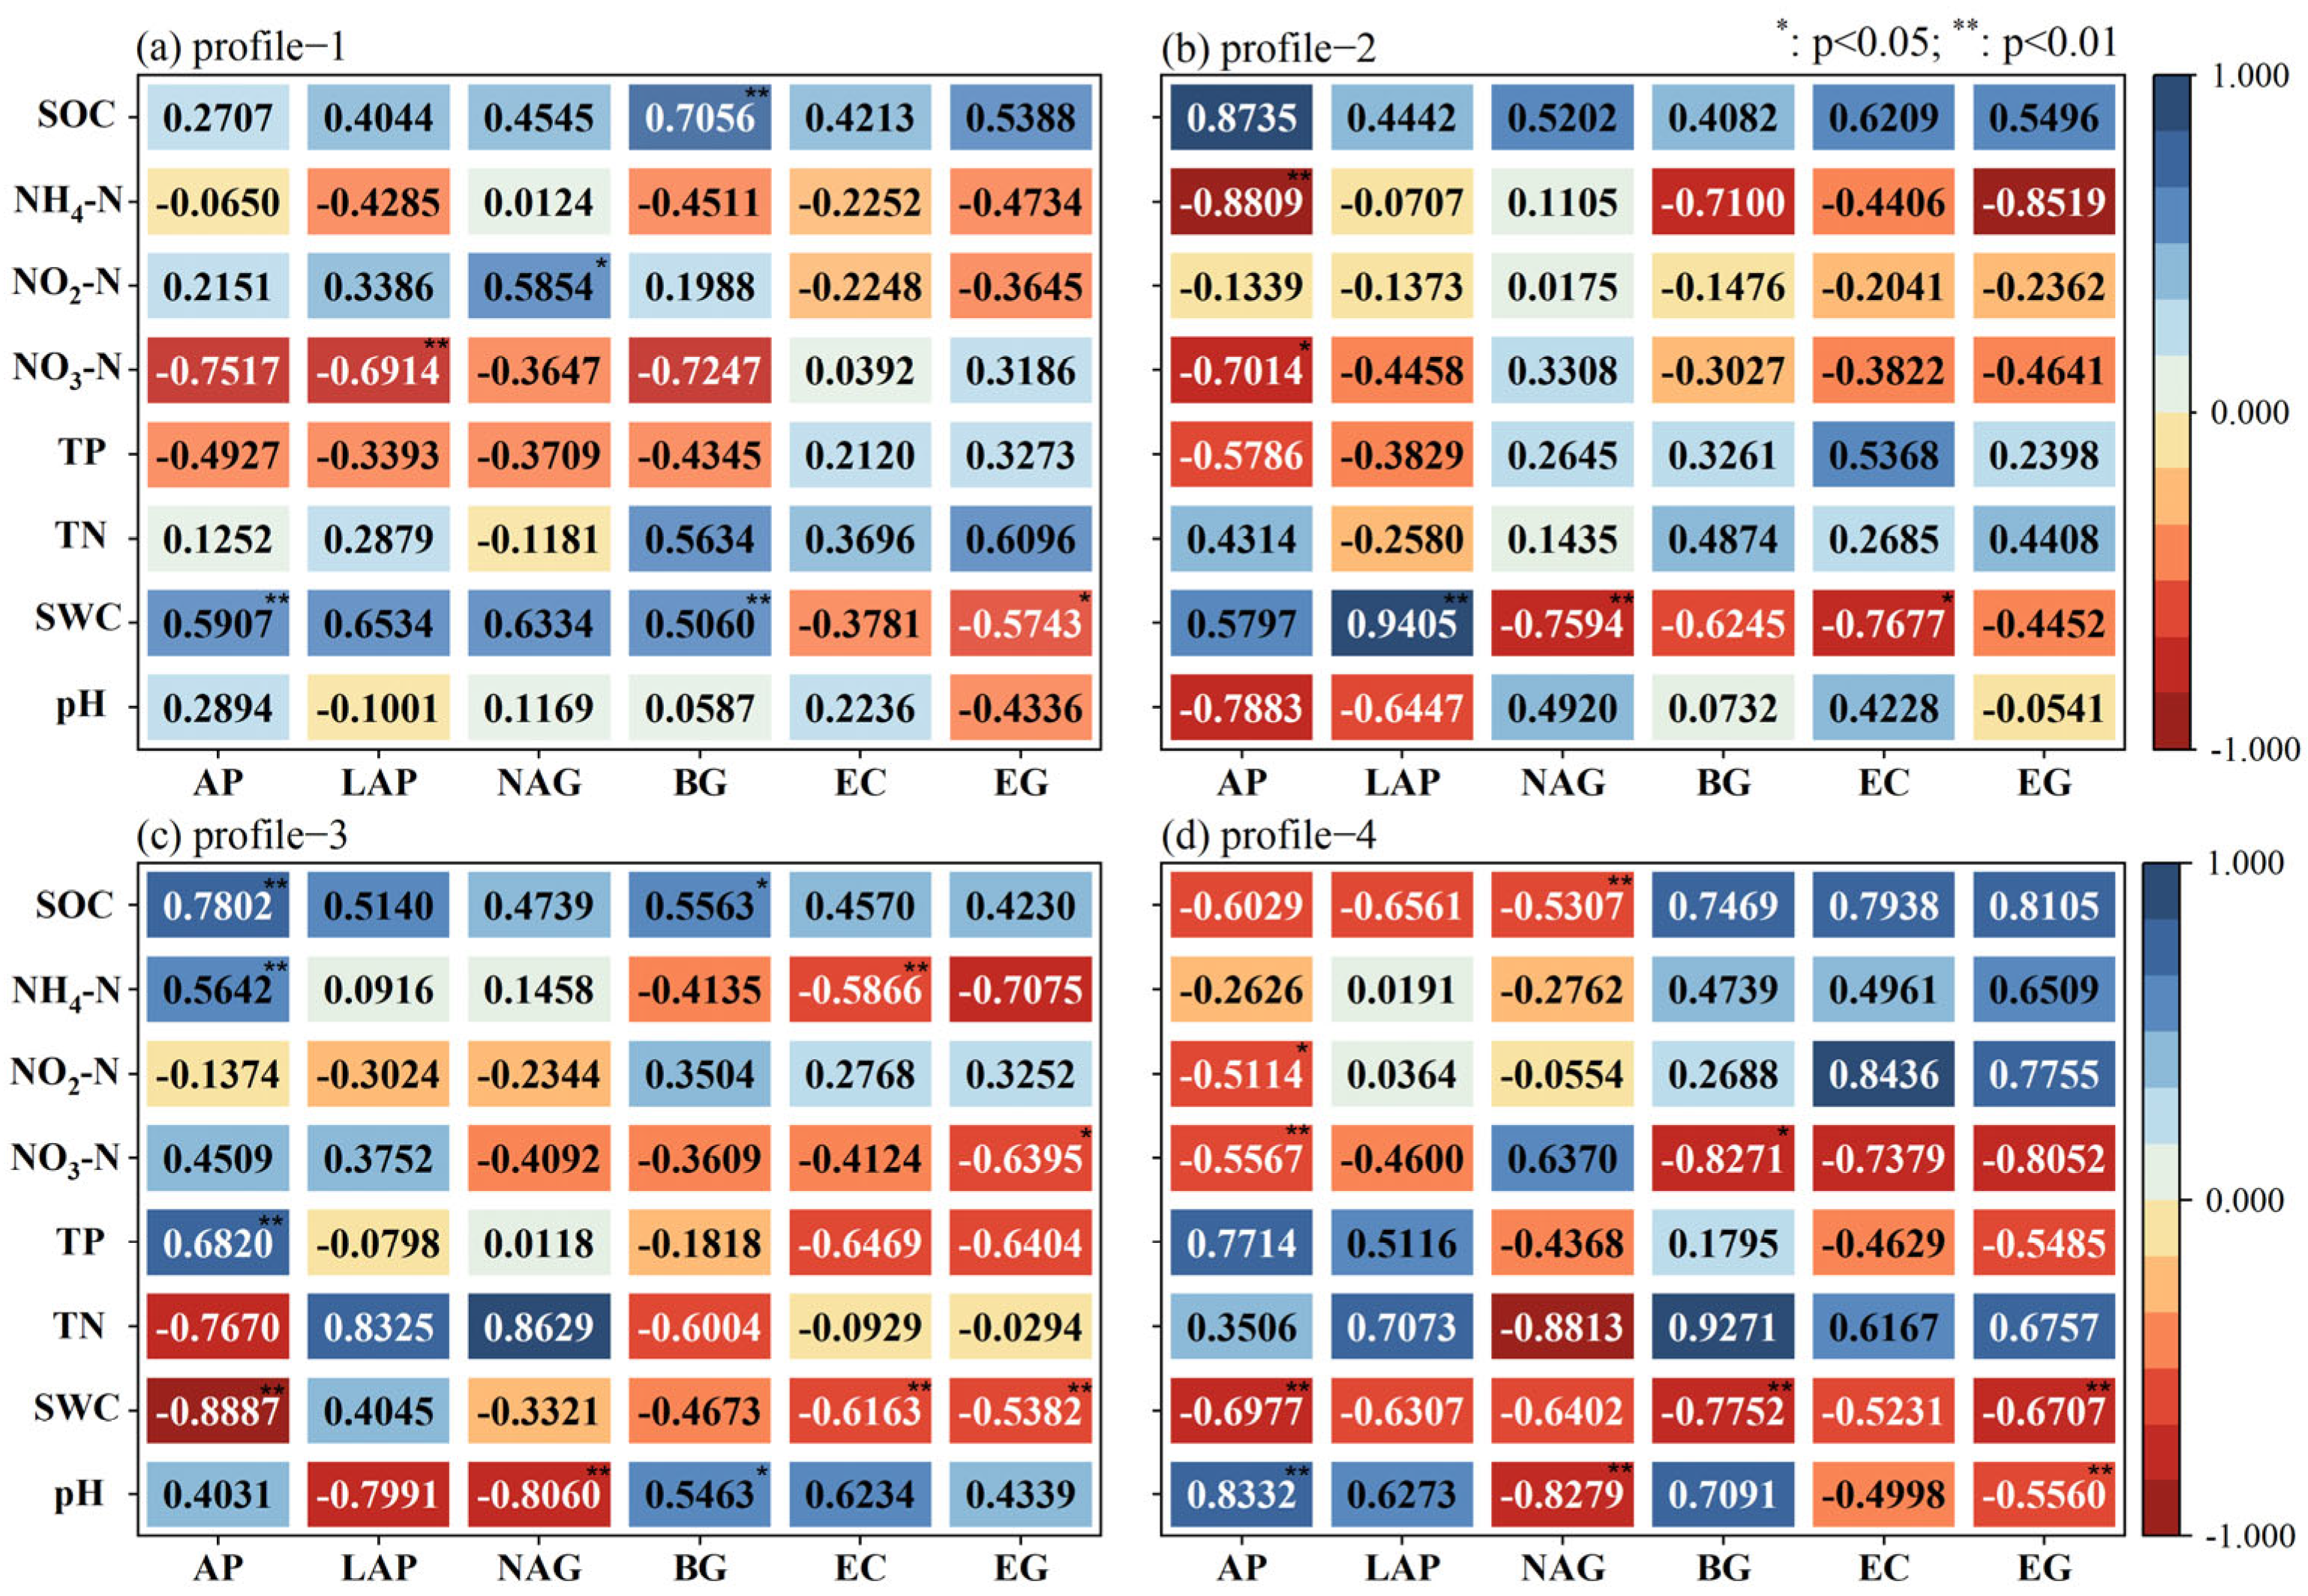
Figure 7 illustrates that the correlations between soil physicochemical properties and enzyme activities varied with riparian zone width. In profile 1, SWC had the highest correlation with soil enzyme activity, followed by SOC. SWC was mainly positively correlated with P- and N-acquisition enzymes and negatively correlated with C-acquisition enzymes. SOC showed a positive correlation with all types of enzymes. In profile 2, SWC and SOC continued to be the main factors influencing changes in enzyme activity. Not used in profile 1, SWC was negatively correlated with NAG in C-acquisition and N-acquisition enzymes and positively correlated with P-acquisition enzymes. The correlation of other indicators with soil enzyme activities did not change significantly. In profile 3, pH, SWC, TN and SOC all showed strong correlations with changes in soil enzyme activities. Among them, pH had the strongest correlation with soil enzyme activities and all showed positive correlation. In profile 4, SWC showed a negative correlation with soil enzyme activities. In addition, TN, NO3-N and SOC all had strong correlations with soil enzymes. In summary, both SWC and SOC were strongly correlated with enzyme activity at different widths. As one gets closer to the river, the effect of SWC on the change of enzyme activity changed from positive to negative, at the same time, the riparian zone area close to the river was no longer strongly affected by SWC alone, and the rest of the soil physicochemical indicators (pH, TN, and NO3-N) were also strongly correlated with the change of enzyme activity.

3.6. Analysis of the Effect of Soil Depth on Soil Enzyme Activity in Riparian Zones

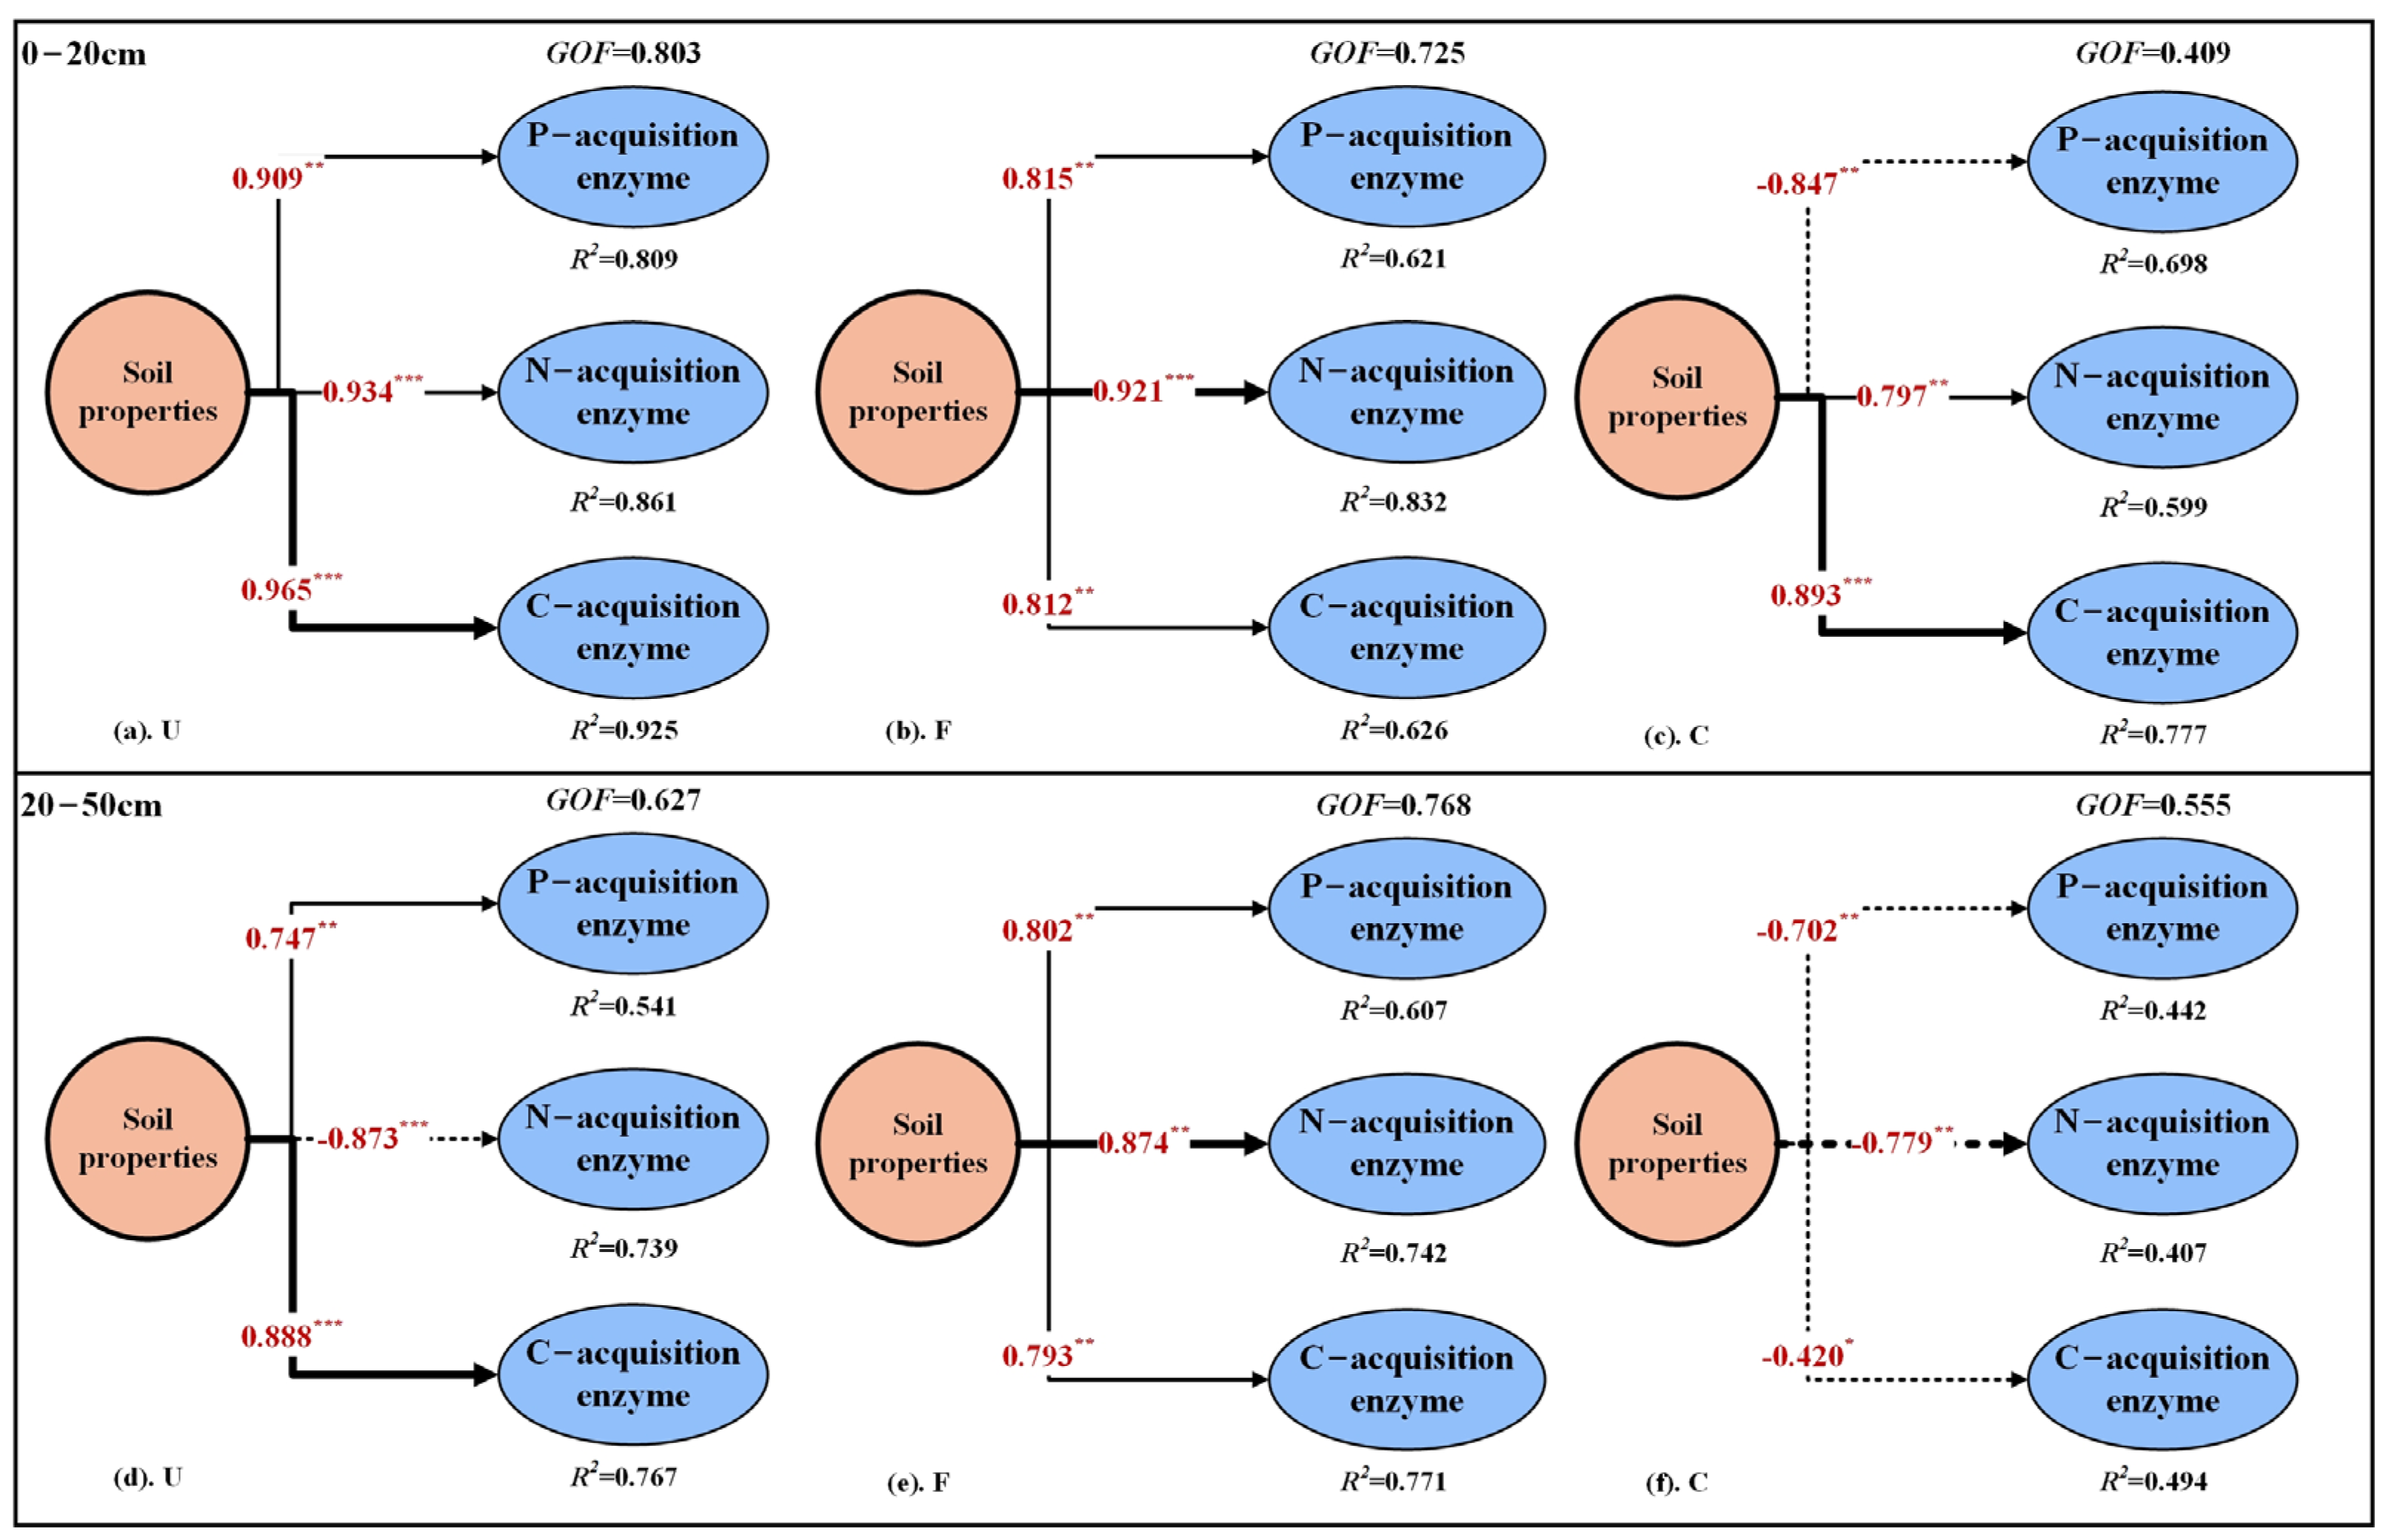
To quantify the differential effects of soil physicochemical properties on enzyme activities between the two soil depths, we employed PLS-SEM (Figure 8). In the urban riparian zone, soil physicochemical properties at both soil depths had highly significant positive effects on C-acquisition enzymes (β = 0.965, p < 0.001; β = 0.888, p < 0.001). For N-acquiring enzymes, soil physicochemical properties showed a highly significant positive effect (β = 0.934, p < 0.001) at 0–20 cm and a highly significant negative effect (β = −0.873, p < 0.001) at 20–50 cm. In the cropland riparian zone, there were differences in the effects of soil physicochemical properties on enzyme activities at the two soil depths. Soil physicochemical properties in 0–20 cm showed a significant negative effect on p-acquisition enzyme (β = −0.847, p < 0.01) and a significant positive effect on N- and C-acquisition enzymes (β = 0.797, p < 0.01; β = 0.893, p < 0.001). In 20–50 cm the effects of soil physicochemical properties on enzyme activities were all negative. It is noteworthy that the path coefficients of soil physicochemical properties on the activities of different enzyme species were higher at 0–20 cm soil depth than at 20–50 cm, and that changes in the activities of C- and N-acquisition enzymes were strongly influenced by soil physicochemical properties.
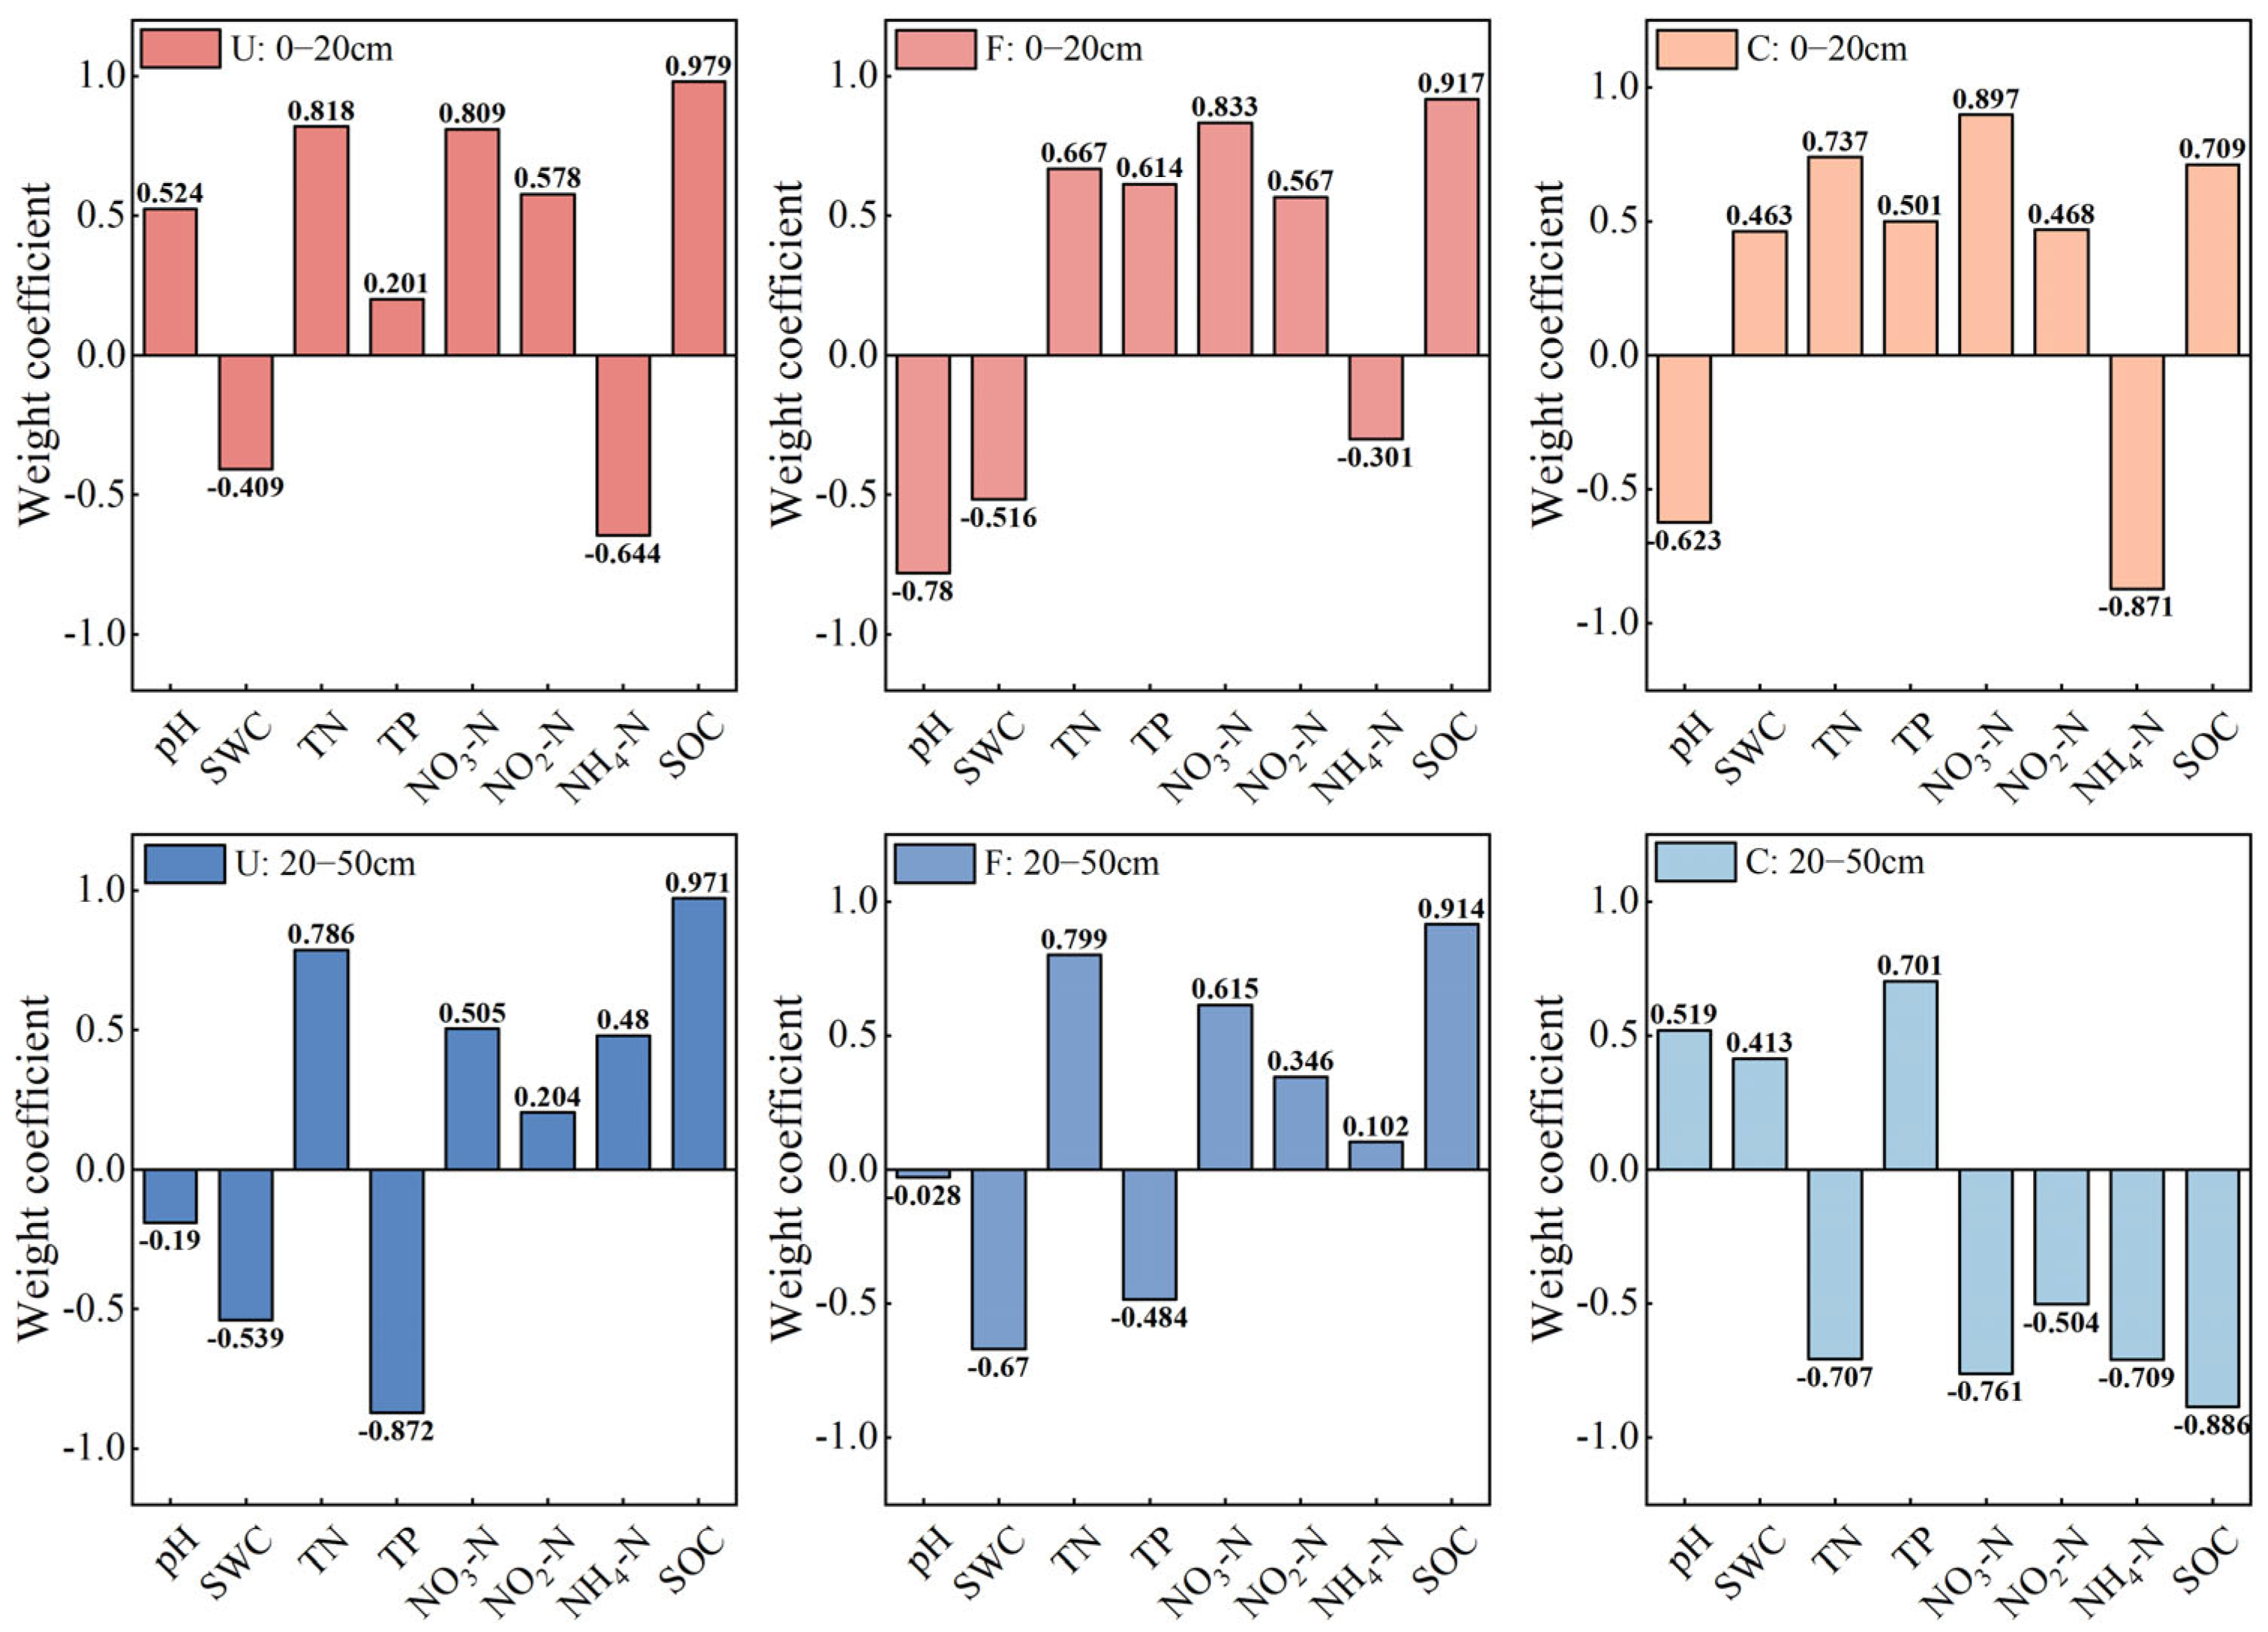
The key drivers of enzyme activity shifted with both soil depth and riparian zone type (Figure 9). In the 0–20 cm layer, TN, NO3-N, and SOC were the primary drivers in both urban and forestland zones. However, at 20–50 cm depth, the main drivers diversified: TN, TP, and SOC in the urban zone; NO3-N and SOC in the forestland; and SOC alone in the cropland. Notably, the cropland riparian zone was uniquely strongly influenced by nitrogen availability, with NO3-N and NH4 +-N governing enzyme activity in the surface layer. These patterns collectively demonstrate that soil depth significantly alters the explanatory variables controlling enzyme activity.

4. Discussion

4.1. Effect of Riparian Zone Width on Soil Enzyme Activities

The ecosystem of riparian zones is relatively complex, and there is a significant difference in soil environment between the water edge area near the river and the land edge area far away from the river, which to some extent affects the spatial distribution characteristics of soil enzyme activity [39]. Differences in the hydrological gradient exist within the riparian zone, such as vegetation types, soil nutrients, etc. In this study, SWC dominated the changes in soil enzyme activity compared to nutrients. Previous studies have shown that the enzyme activities of NAG, BGL, and AP are significantly lower in moist conditions compared to adjacent dry soils [40]. Increased soil moisture content negatively impacts enzyme activity, whereas dry conditions promote enzyme activation and accumulation, positively influencing soil quality. This is primarily attributed to physicochemical effects induced by drought: reduced moisture leads to the concentration of substrates and enzyme molecules in the soil solution, increasing reaction opportunities; simultaneously, the degradation rate of enzyme proteins slows, resulting in the accumulation of historical enzyme pools. Furthermore, microorganisms may initiate stress responses during the early stages of water stress, increasing enzyme production to access resources [41,42]. However, studies have also shown that enzyme activity is lower in dry soil conditions and higher in moderately moist soil conditions [21]. This indicates that soil enzyme activity has a strong response to SWC. Generally speaking, dry conditions to some extent limit the water supply for microbial activity, thereby disrupting enzymatic processes, especially hydrolytic enzymes [43,44]. Meanwhile, lower SWC can inhibit nutrient transport and affect its cycling processes in soil vegetation ecosystems [45]. In this study, the main sources of soil moisture in riparian zones of arid and semi-arid regions were rainfall and hydrological pulsing from rivers. However, irregular and low rainfall results in the majority of soil moisture in riparian zones coming from hydrological pulsing processes in rivers. Our results indicate that soil enzyme activity in different riparian zones exhibits a spatial distribution pattern of lower activity near the river’s edge and higher activity away from the river’s edge. This indicates that the differences in SWC have a significant impact on the changes in soil enzyme activity. Within the range of 0 to 10 m, the width of the riparian zone is more strongly influenced by the flow of river water. At this width, the SWC of profile 4 is higher than the other three profiles, resulting in soil enzyme activity at this point being much lower than at other locations. From a mechanistic perspective, although rainfall is scarce and soil moisture content is low, microorganisms that survive under drought conditions for a long time release more resources to produce enzymes in order to obtain nutrients from soil processes, especially nitrogen and phosphorus [46]. In addition, long-term dry conditions promote microorganisms to exhibit strong drought tolerance; therefore, soil also has strong degradation ability under low humidity or drought conditions. Consequently, spatial variations in SWC are a primary driver of the observed soil enzyme activity patterns in these arid and semi-arid riparian zones.
It is worth noting that when dry soil environments become moist, soil microbial respiration is enhanced, but this respiration is not only dependent on SWC levels, but also influenced by soil nutrients [47]. Our results show that the closer to the river, the lower the content of NO3-N and SOC, but the content of NH4-N increases. This indicates that there is a significant difference in the transformation of N between the land edge zone and the water edge zone in the riparian zone. Correspondingly, there is a significant spatial difference in the activity of the N acquisition enzyme in profiles 4 and 3. In addition, the distance between riparian soil and river water significantly affects the content of soil TN, NO3-N, and SWC. The elevated SWC restricts oxygen diffusion, creating an anaerobic microenvironment. This anaerobic condition inhibits aerobic microbial activity, promoting the long-term accumulation of SOC. Simultaneously, it shifts microbial metabolic pathways toward anaerobic respiration using nitrate (NO3) as the terminal electron acceptor, thereby enhancing the growth and reproduction of denitrifying microorganisms and collectively boosting soil denitrification activity [1].
Additionally, the forest riparian zone was characterized by relatively high soil enzyme activity, which may be due to strong human interference in urban and agricultural riparian zones, affecting the natural vegetation communities in the riparian zone. Although the vegetation types on the three types of riparian zones we selected are the same, human influence can still lead to differences in vegetation coverage in different riparian zones, resulting in lower vegetation coverage in areas near the river than in areas far away from the river. Vegetation promotes soil nutrient cycling, and roots are the main site for enzyme production [47]. Therefore, differences in vegetation cover may also affect the spatial distribution of soil enzyme activity in riparian zones.

4.2. Effect of Soil Depth on Soil Enzyme Activity in Riparian Zones

In the present study, enzyme activity was higher at 0–20 cm soil depth than at 20–50 cm for the same riparian zone width. Changes in soil depth can more significantly affect or alter microbial characteristics, and thus enzyme activity, than climate change at the soil surface [48]. Most soil enzyme activity studies have focused on the top 0–20 cm soil layer, which is the layer with the highest organic matter and microbial content. For soil enzymes, enzyme activity usually decreases significantly with soil depth due to oxygen limitation, temperature variations, nutrient deficiencies and less substrate energy in deeper soils [49], which greatly limits microbial populations. When the carbon source in deep soils is relatively stable, it takes longer to be converted. These factors lead to reduced enzyme activity in deep soils [50].
DFA results showed that soil enzyme activities differed at the two soil depths. In the surface soil layer of 0–20 cm, the distribution of plasmodesmata within the group of soil enzyme activities was relatively dispersed. However, with the increase of soil depth, the distribution of intragroup plasmodesmata under 20–50 cm was aggregated and the degree of separation was lower than that in the 0–20 cm soil layer. This suggests that the variability in the spatial distribution of soil enzyme activities in the riparian zone decreases with increasing soil depth, and that the increase in soil depth removes to a certain extent the differences in surface soils due to environmental factors. Enzyme activity is reduced in deeper soils, mainly due to limitations in substrate content, energy sources and microbial activity. However, some studies have also shown relatively high enzyme activities and even higher levels of microbial activity in deeper soils compared to surface soils. These studies were based on deeper soils (>1 m) [51]. The PCA results demonstrated the dominant enzyme classifications at different soil depths. enzymes related to the control of the carbon cycle (EC and EG) dominated under the 0–20 cm soil layer, while enzymes related to the control of the nitrogen cycle (LAP and NAG) dominated under the 20–50 cm soil layer. This further corroborates the results of the DFA analysis. Taken together, surface soils are more affected by environmental factors, and changes in C-acquisition enzymes, which act to break down organic matter and provide a source of energy for microbial activity, can affect other enzyme activities. In deep soils with reduced organic matter content, nitrogen’s importance as the primary substrate for soil nitrification and denitrification becomes increasingly prominent. This is primarily because nitrogen (especially nitrate, NO3) exhibits higher mobility within soil profiles compared to organic carbon. Dissolved NO3 readily leaches downward with gravitational water, enabling it to reach deep soil layers more easily. Conversely, complex organic carbon compounds serving as substrates for carbon acquisition enzymes—such as cellulose and lignin—possess large molecular weights and low water solubility. They primarily rely on plant root input and in situ microbial synthesis, making deep migration via leaching difficult. Furthermore, complex organic matter exhibits chemical stability in the anaerobic, low-temperature conditions of deep soils, resisting rapid decomposition. This leads to prolonged “carbon limitation” in deep soil layers. Therefore, in carbon-depleted deep soils, microbial communities may prioritize limited energy resources toward acquiring relatively abundant and readily available nitrogen sources. Consequently, nitrogen-acquiring enzymes (e.g., LAP, NAG) dominate metabolic functions. This finding is corroborated by our PCA results, which indicate nitrogen-cycling enzymes as the dominant enzymes in deep soils [18]. In summary, soil depth not only changes the fundamental properties of the soil, but also strongly influences changes in soil enzyme activities and their main drivers. Limitations of surface soil studies limit our ability to identify changes in soil enzyme activities and also affect our ability to identify soil nutrient transformation processes.

4.3. Mechanisms Driving Changes in Soil Enzyme Activity in Riparian Zones

In the riparian zone areas close to the river, the hydrologic pulsing allows for regular alternation of wet and dry conditions and high soil moisture content, whereas in the riparian zone areas away from the river, the soil moisture is mainly derived from rainfall and the vegetation cover has a strong influence on the soil. Soil environmental conditions vary considerably across riparian zone widths, which complicates the variability of soil nutrients within riparian zones [52]. The results of the PLS-SEM showed that there were differences in the relationship between soil physicochemical properties and enzyme activities. SOC is the main carbon source for soil microbial activity [53] and is input to the soil in the form of plant litter or root exudates, which provide the substrate and energy base for enzymatic reactions [54]. In the present study, SOC was positively correlated with enzyme activity, especially prominent in the 0–20 cm soil layer, which is in agreement with the results of previous field experiments [55]. Differences in SOC across riparian zones were the main drivers of soil enzyme activity. SOC was highest in the forestland riparian zone and lowest in the cropland riparian zone. On the one hand, plant residues are the main source of SOC [56]. On the other hand, frequent ploughing and cropping activities lead to decomposition and loss of SOC [57]. It should be noted that although we kept the differences in vegetation cover among the three types of riparian zones small in our sample selection, it should not be overlooked that the riparian zones in agricultural fields have relatively small vegetation cover due to the excessive anthropogenic activities. This can increase soil erosion and reduce SOC [58].
Our findings, supported by PLS-SEM, identified NO3-N and NH4-N levels as key determinants of enzyme activity dynamics, particularly in cropland riparian zones. These zones receive substantial exogenous nitrogen from agricultural practices, leading to elevated NO3-N loads that shape enzymatic spatial distribution [59]. Enzyme activities proved highly sensitive to nitrogen forms and concentrations, evidenced by strong correlations between NO3-N and LAP, NAG, and AP activities, consistent with existing reports [60]. This regulation occurs as microbes modulate the secretion of C-, N-, and P-acquiring enzymes in response to soil nutrient conditions [61]. Thus, elucidating how soil properties control enzyme activities is fundamental to deciphering the mechanisms of nutrient cycling in riparian zones [27,62].

4.4. Prospect and Follow-Up Studies

This study investigated the spatial variation of soil enzyme activities across different widths and depths of three riparian zone types, elucidating the influence of key soil environmental factors. While our findings provide insights into the spatial patterns and drivers of enzyme activities at the riparian scale, limitations remain. Firstly, the microbial mechanisms underlying enzyme dynamics were not explored using metagenomics, a powerful tool that has been widely applied in forest and lake ecosystems to link functional genes with enzyme activities and their roles in nutrient cycling. Secondly, the contribution of vegetation—through root exudates and litter input—to extracellular enzyme pools was not addressed, despite evidence that plant cover significantly enhances phosphatase activity and functional gene abundance. Future studies should therefore integrate long-term environmental monitoring with advanced biological techniques, such as metagenomics, to better reveal the micro-scale mechanisms regulating soil enzyme activities in riparian zones.

5. Conclusions

Exploring the differences in changes in soil enzyme activity in riparian zones and the influence of soil environmental factors can help establish protection and management models for riparian zones. The width of the riparian zone and its soil depth alter the spatial distribution pattern of soil enzyme activity and affect the driving factors of soil enzyme activity in different regions of the riparian zone. Research has found that soil enzyme activity in the riparian zone is significantly lower than that in the terrestrial zone. Meanwhile, the increase in soil depth also reduces soil enzyme activity. The PLS-SEM results indicate that TN, NO3-N, and organic carbon are the driving factors affecting enzyme activity changes in the 0–20 cm soil layer, with SOC being the main controlling factor in the 20–50 cm soil layer. There are differences in soil enzyme activity among the riparian zones of the three types of land use, and the enzyme activity in the natural state of forestland riparian zones is significantly higher than that in urban and cropland, indicating that maintaining or restoring natural vegetation in riparian zones is an effective management approach However, the spatial distribution characteristics and main driving forces of soil enzyme activity under different riparian zones remain consistent. For arid and semi-arid riparian zones, SWC inhibits the growth of soil enzyme activity in the longitudinal direction of the riparian zone, while soil nutrients limit the vertical changes in enzyme activity. Research findings clearly indicate that soil enzyme activity serves as a key biological indicator of riparian nutrient cycling efficiency and soil health. Reducing human disturbance to riparian zones and establishing vegetated buffer strips to stabilize hydrological conditions will positively promote increased soil enzyme activity. In addition, clarifying the microbial driving mechanisms of soil enzyme activity in riparian zones is of great significance for understanding nutrient cycling processes. Subsequent research can use microbial technology to enhance the understanding of abiotic properties driving changes in soil enzyme activity, providing new ideas for the assessment and protection of soil environmental quality in riparian zones.

Author Contributions

Z.Y.: Conceptualization, Writing—original draft, Software, Methodology, Data analysis. P.L.: Supervision, Writing—review & editing, Resources, Funding acquisition, Project administration. C.F.: Resources, Writing. Y.C.: Resources, Writing. K.L.: Field monitoring, C.Z.: Field monitoring. Z.L.: Field monitoring. All authors have read and agreed to the published version of the manuscript.

Funding

This research was supported by the Doctoral Dissertation Innovation Fund of Xi’an University of Technology (Grant No. 104-252072306); The Key Research and Development Program of Shaanxi province (No. 2024SF-ZDCYL-05-10); The Doctoral Dissertation Innovation Fund of Xi’an University of Technology (Grant No. 104-252072311).

Institutional Review Board Statement

All authors have read, understood, and have complied as applicable with the statement on “Ethical responsibilities of Authors” as found in the Instructions for Authors.

Data Availability Statement

Data will be made available on request. The data are not publicly available due to privacy.

Conflicts of Interest

Chaohong Feng is employed by Yellow River Engineering Consulting Co. Yongxiang Cao and Kunming Lu are employed by Power China Northwest Engineering Corporation Limited. The authors declare no conflicts of interest.

References

  1. Ye, M.M.; Hu, H.Z.; Wu, P.L.; Xie, Z.Y.; Hu, Y.C.; Lu, X.X. Ecological responses to hydrological connectivity in grassland riparian zones: Insights from vegetation and ground-dwelling arthropods. Sci. Total Environ. 2024, 922, 171196. [Google Scholar] [CrossRef] [PubMed]
  2. Lim, T.J.Y.; Sargent, R.; Henry, R.; Fletcher, T.D.; Coleman, R.A.; Mccarthy, D.T.; Lintern, A. Riparian buffers: Disrupting the transport of e coli from rural catchments to streams. Water Res. 2022, 222, 118897. [Google Scholar] [CrossRef]
  3. Yorlano, M.; Demetrio, P.; Rimoldi, F. Riparian strips as attenuation zones for the toxicity of pesticides in agricultural surface runoff: Relative influence of herbaceous vegetation and terrain slope on toxicity attenuation of 2,4-d. Sci. Total Environ. 2022, 807, 150655. [Google Scholar] [CrossRef] [PubMed]
  4. Wang, S.; Hoang, D.T.T.; Luu, A.T.; Mostafa, T.; Razavi, B.S. Environmental memory of microbes regulates the response of soil enzyme kinetics to extreme water events: Drought-rewetting-flooding. Geoderma 2023, 437, 116593. [Google Scholar] [CrossRef]
  5. Qiao, J.; Zhu, Y.; Jia, X.; Shao, M. Multifractal characteristics of particle size distributions (50–200 m) in soils in the vadose zone on the Loess Plateau, China. Soil Tillage Res. 2021, 205, 104786. [Google Scholar] [CrossRef]
  6. Chen, Y.; Wei, T.; Sha, G.; Zhu, Q.; Liu, Z.; Ren, K.; Yang, C. Soil enzyme activities of typical plant communities after vegetation restoration on the loess plateau, China. Appl. Soil Ecol. 2022, 170, 104292. [Google Scholar] [CrossRef]
  7. Xu, H.; Qu, Q.; Lu, B.; Li, P.; Xue, S.; Liu, G. Response of soil specific enzyme activity to vegetation restoration in the loess hilly region of China. CATENA 2020, 191, 104564. [Google Scholar] [CrossRef]
  8. Curtright, A.J.; Tiemann, L.K. Intercropping increases soil extracellular enzyme activity: A meta-analysis. Agric. Ecosyst. Environ. 2021, 319, 107489. [Google Scholar] [CrossRef]
  9. Margalef, O.; Sardans, J.; Fernández-Martínez, M.; Molowny-Horas, R.; Janssens, I.A.; Ciais, P.; Goll, D.; Richter, A.; Obersteiner, M.; Asensio, D.; et al. Global patterns of phosphatase activity in natural soils. Sci. Rep. 2017, 7, 1337. [Google Scholar] [CrossRef]
  10. Xu, H.; Qu, Q.; Chen, Y.; Liu, G.; Xue, S. Responses of soil enzyme activity and soil organic carbon stability over time after cropland abandonment in different vegetation zones of the Loess Plateau of China. CATENA 2021, 196, 104812. [Google Scholar] [CrossRef]
  11. Yang, X.; Sun, Q.; Yuan, J.; Fu, S.F.; Lan, Y.; Jiang, X.M.; Meng, J.; Han, X.R.; Chen, W.F. Successive corn stover and biochar applications mitigate N2O emissions by altering soil physicochemical properties and N-cycling-related enzyme activities: A five-year field study in Northeast China. Agric. Ecosyst. Environ. 2022, 340, 108183. [Google Scholar] [CrossRef]
  12. Stutter, M.; Costa, F.B.; Ó’hUallacháin, D. The interactions of site-specific factors on riparian buffer effectiveness across multiple pollutants: A review. Sci. Total Environ. 2021, 798, 149238. [Google Scholar] [CrossRef] [PubMed]
  13. Brumberg, H.; Beirne, C.; Broadbent, E.N.; Zambrano, A.M.A.; Zambrano, S.L.A.; Gil, C.A.Q.; Gutierrez, B.L.; Eplee, R.; Whitworth, A. Riparian buffer length is more influential than width on river water quality: A case study in southern Costa Rica. J. Environ. Manag. 2021, 286, 112132. [Google Scholar] [CrossRef]
  14. Wang, C.L.; Henry, H.A.L.; Miao, X.Z.; Shi, B.K.; Song, Y.Y.; Liang, Q.; Sun, W. Seasonal variation modifies the spatial patterns of soil microbial community structure and enzyme activity in a meadow steppe. Appl. Soil Ecol. 2023, 182, 104686. [Google Scholar] [CrossRef]
  15. Zhang, M.Y.; O’Connor, P.J.; Zhang, J.J.; Ye, X.X. Linking soil nutrient cycling and microbial community with vegetation cover in riparian zone. Geoderma 2021, 384, 114801. [Google Scholar] [CrossRef]
  16. Jia, W.T.; Huang, P.; Zhu, K.; Gao, X.; Chen, Q.; Chen, J.L.; Ran, Y.G.; Chen, S.S.; Ma, M.H.; Wu, S.J. Zonation of bulk and rhizosphere soil bacterial communities and their covariation patterns along the elevation gradient in riparian zones of three Gorges reservoir, China. Environ. Res. 2024, 249, 118383. [Google Scholar] [CrossRef]
  17. Jing, X.; Chen, X.; Fang, J.Y.; Ji, C.J.; Shen, H.H.; Zheng, C.Y.; Zhu, B. Soil microbial carbon and nutrient constraints are driven more by climate and soil physicochemical properties than by nutrient addition in forest ecosystems. Soil Biol. Biochem. 2020, 141, 107667. [Google Scholar] [CrossRef]
  18. Długosz, J.; Piotrowska-Długosz, A. Changes in carbon-degrading enzyme activities and microbial biomass content–The effect of soil depth and soil-forming processes. Appl. Soil Ecol. 2022, 180, 104629. [Google Scholar] [CrossRef]
  19. Marinari, S.; Marabottini, R.; Falsone, G.; Vianello, G.; Antisari, L.V.; Agnelli, A.; Massaccesi, L.; Cocco, S.; Cardelli, V.; Serrani, D.; et al. Mineral weathering and lessivage affect microbial community and enzyme activity in mountain soils. Appl. Soil Ecol. 2021, 167, 104024. [Google Scholar] [CrossRef]
  20. Zhao, S.; Zhang, B.J.; Sun, X.H.; Yang, L.M. Hot spots and hot moments of nitrogen removal from hyporheic and riparian zones: A review. Sci. Total Environ. 2021, 762, 144168. [Google Scholar] [CrossRef]
  21. Geng, Y.Q.; Wang, D.M.; Yang, W.B. Effects of different inundation periods on soil enzyme activity in riparian zones in Lijiang. Catena 2017, 149, 19–27. [Google Scholar] [CrossRef]
  22. Liu, D.; Liu, Y.; Li, J.J.; Mo, Q.; Tang, J.Y.; Liu, W.H.; Batyrbek, M.; Liu, T.N.; Zhang, X.D.; Han, Q.F. Shaping the succession patterns of different soil nutrients, enzyme stoichiometry, and microbial communities through rotation systems. Catena 2024, 236, 107740. [Google Scholar] [CrossRef]
  23. Zhao, C.X.; Liu, Y.L.; Yan, Z.X. Effects of land-use change on carbon emission and its driving factors in Shaanxi province from 2000 to 2020. Environ. Sci. Pollut. Res. 2023, 30, 68313–68326. [Google Scholar] [CrossRef] [PubMed]
  24. Yan, Z.X.; Li, P.; Li, Z.B.; Xu, Y.T.; Zhao, C.X.; Cui, Z.W. Effects of land use and slope on water quality at multi-spatial scales: A case study of the Weihe River Basin. Environ. Sci. Pollut. Res. 2023, 30, 57599–57616. [Google Scholar] [CrossRef]
  25. Castellano, S. Using multiparameter meters to monitor estuarine water quality. Nat. Rev. Earth Environ. 2024, 5, 162. [Google Scholar] [CrossRef]
  26. Bargrizan, S.; Smernik, R.J.; Mosley, L.M. Spectrophotometric measurement of the pH of soil extracts using a multiple indicator dye mixture. Eur. J. Soil Sci. 2018, 70, 411–420. [Google Scholar] [CrossRef]
  27. Wang, J.; Lin, C.Y.; Han, Z.M.; Fu, C.B.; Huang, D.; Cheng, H.G. Dissolved nitrogen in salt-affected soils reclaimed by planting rice: How is it influenced by soil physicochemical properties? Sci. Total Environ. 2022, 824, 153863. [Google Scholar] [CrossRef] [PubMed]
  28. Kool, D.; Agam, N. Multi-spectral surface emissivity as an indicator of soil water content and soil water content changes in arid soils. Remote Sens. Environ. 2024, 305, 114064. [Google Scholar] [CrossRef]
  29. Sinsabaugh, R.L.; Shah, J.J.F. Ecoenzymatic stoichiometry and ecological theory. Annu. Rev. Ecol. Evol. Syst. 2012, 43, 313–343. [Google Scholar] [CrossRef]
  30. Waring, B.G.; Weintraub, S.R.; Sinsabaugh, R.L. Ecoenzymatic stoichiometry of microbial nutrient acquisition in tropical soils. Biogeochemistry 2014, 117, 101–113. [Google Scholar] [CrossRef]
  31. Sinsabaugh, R.L.; Lauber, C.L.; Weintraub, M.N.; Ahmed, B.; Allison, S.D.; Crenshaw, C.; Contosta, A.R.; Cusack, D.; Frey, S.; Gallo, M.E.; et al. Stoichiometry of soil enzyme activity at global scale. Ecol. Lett. 2008, 11, 1252–1264. [Google Scholar] [CrossRef]
  32. Abay, P.; Gong, L.; Luo, Y.; Zhu, H.Q.; Ding, Z.L. Soil extracellular enzyme stoichiometry reveals the nutrient limitations in soil microbial metabolism under different carbon input manipulations. Sci. Total Environ. 2024, 913, 169793. [Google Scholar] [CrossRef]
  33. Jiang, Q.H.; Jin, G.Q.; Tang, H.W.; Xu, J.Z.; Jiang, M.M. Ammonium (NH4+) transport processes in the riverbank under varying hydrologic conditions. Sci. Total Environ. 2022, 826, 154097. [Google Scholar] [CrossRef]
  34. Liu, C.; Zhang, F.; Wang, X.; Chan, N.W.; Rahman, H.A.; Yang, S.; Tan, M.L. Assessing the factors influencing water quality using environment water quality index and partial least squares structural equation model in the Ebinur Lake watershed, Xinjiang, China. Environ. Sci. Pollut. Res. 2022, 29, 29033–29048. [Google Scholar] [CrossRef]
  35. Ringle, C.M.; Sarstedt, M.; Sinkovics, N.; Sinkovics, R.R. A perspective on using partial least squares structural equation modelling in data articles. Data Brief 2023, 48, 109074. [Google Scholar] [CrossRef]
  36. Na, M.; Liu, X.P.; Tong, Z.J.; Sudu, B.; Zhang, J.Q.; Wang, R. Analysis of water quality influencing factors under multi-source data fusion based on PLS-SEM model: An example of East-Liao River in China. Sci. Total Environ. 2024, 907, 168126. [Google Scholar] [CrossRef] [PubMed]
  37. Zhao, C.X.; Liu, Y.L.; Yan, Z.X.; Zhao, W.B.; Sun, J.Y. Ecological impacts of vermiculite and submerged macrophytes on sediment enzyme activity in lake restoration: Insights from the mesocosm study. J. Water Process Eng. 2024, 67, 106222. [Google Scholar] [CrossRef]
  38. Lyu, C.J.; Li, X.J.; Yu, H.B.; Song, Y.H.; Gao, H.J.; Yuan, P. Insight into the microbial nitrogen cycle in riparian soils in an agricultural region. Environ. Res. 2023, 231, 116100. [Google Scholar] [CrossRef]
  39. Ji, K.Y.; Ouyang, W.; Lin, C.Y.; He, M.C.; Liu, X.T. Eco-hydrological processes regulate lake riparian soil organic matter under dryness stress. Water Res. 2024, 260, 121938. [Google Scholar] [CrossRef]
  40. Chacon, N.; Dezzeo, N.; Flores, S. Effect of particle-size distribution, soil organic carbon content and organo-mineral aluminium complexes on acid phosphatases of seasonally flooded forest soils. Biol. Fertil. Soils 2005, 41, 69–72. [Google Scholar] [CrossRef]
  41. Ladwig, L.M.; Sinsabaugh, R.L.; Collins, S.L.; Thomey, M.L. Soil enzyme responses to varying rainfall regimes in Chihuahuan Desert soils. Ecosphere 2015, 6, 1–10. [Google Scholar] [CrossRef]
  42. Ochoa-Hueso, R.; Collins, S.L.; Delgado-Baquerizo, M.; Hamonts, K.; Pockman, W.T.; Sinsabaugh, R.L.; Smith, M.D.; Knapp, A.K.; Power, S.A. Drought consistently alters the composition of soil fungal and bacterial communities in grasslands from two continents. Glob. Change Biol. 2018, 24, 2818–2827. [Google Scholar] [CrossRef] [PubMed]
  43. Bogati, K.; Walczak, M. The impact of drought stress on soil microbial community, enzyme activities and plants. Agronomy 2022, 12, 189. [Google Scholar] [CrossRef]
  44. Zuccarini, P.; Sardans, J.; Asensio, L.; Penuelas, J. Altered activities of extracellular soil enzymes by the interacting global environmental changes. Glob. Change Biol. 2023, 29, 2067–2091. [Google Scholar] [CrossRef]
  45. Asensio, D.; Zuccarini, P.; Sardans, J.; Marañón-Jiménez, S.; Mattana, S.; Ogaya, R.; Mu, Z.B.; Llusià, J.; Peñuelas, J. Soil biomass-related enzyme activity indicates minimal functional changes after 16 years of persistent drought treatment in a Mediterranean holm oak forest. Soil Biol. Biochem. 2024, 189, 109281. [Google Scholar] [CrossRef]
  46. Szejgis, J.; Carrillo, Y.; Jeffries, T.; Dijkstra, F.A.; Chieppa, J.; Horn, S.; Bristol, D.; Maisnam, P.; Eldridge, D.; Nielsen, U.N. Altered rainfall greatly affects enzyme activity but has limited effect on microbial biomass in Australian dryland soils. Soil Biol. Biochem. 2024, 189, 109277. [Google Scholar] [CrossRef]
  47. Zhao, Y.N.; Wang, H.W.; Guo, T.D.; Li, Z.L.; Mi, W.B.; Cao, Z. Response of soil C-, N-, and P-acquisition enzymes to moisture pulses in desert grassland to shrubland state transition. Sci. Total Environ. 2023, 861, 160569. [Google Scholar] [CrossRef]
  48. He, H.R.; Xu, M.Z.; Li, W.T.; Chen, L.; Chen, Y.N.; Moorhead, D.L.; Brangarí, A.C.; Liu, J.; Cui, Y.X.; Zeng, Y.; et al. Linking soil depth to aridity effects on soil microbial community composition, diversity and resource limitation. Catena 2023, 232, 107393. [Google Scholar] [CrossRef]
  49. Piotrowska-Długosz, A.; Długosz, J.; Gryta, A.; Frac, M. Responses of N-cycling enzyme activities and functional diversity of soil microorganisms to soil depth, pedogenic processes and cultivated plants. Agronomy 2022, 12, 264. [Google Scholar] [CrossRef]
  50. Poffenbarger, H.; Olk, D.C.; Cambardella, C.; Kersey, J.; Liebman, M.; Mallarino, A.P.; Six, J.; Castellano, M.J. Whole-profile soil organic matter content, composition, and stability under cropping systems that differ in belowground inputs. Agric. Ecosyst. Environ. 2020, 291, 106810. [Google Scholar] [CrossRef]
  51. Piotrowska-Długosz, A.; Kobierski, M.; Długosz, J. Enzymatic activity and physico chemical properties of soil profiles of Luvisols. Materials 2021, 14, 6364. [Google Scholar] [CrossRef]
  52. Kumwimba, M.N.; Akter, S.; Li, X.Y.; Dzakpasu, M.; Ifon, B.E.; Manirakiza, B.; Muyembe, D.K.; Zhang, Y.F.; Huang, J.L.; Guadie, A. Nutrient and sediment retention by riparian vegetated buffer strips: Impacts of buffer length, vegetation type, and season. Agric. Ecosyst. Environ. 2024, 369, 109050. [Google Scholar] [CrossRef]
  53. Sokol, N.W.; Slessarev, E.; Marschmann, G.L.; Nicolas, A.; Blazewicz, S.J.; Brodie, E.L.; Firestone, M.K.; Foley, M.M.; Hestrin, R.; Hungate, B.A.; et al. Life and death in the soil microbiome: How ecological processes influence biogeochemistry. Nat. Rev. Microbiol. 2022, 20, 415–430. [Google Scholar] [CrossRef] [PubMed]
  54. Zhu, H.; Gong, L.; Luo, Y.; Tang, J.; Ding, Z.; Li, X. Effects of litter and root manipulations on soil bacterial and fungal community structure and function in a Schrenk’s spruce (Picea schrenkiana) forest. Front. Plant Sci. 2022, 13, 849483. [Google Scholar] [CrossRef] [PubMed]
  55. Ai, L.; Wu, F.; Fan, X.; Yang, Y.; Zhang, Y.; Zheng, X.; Zhu, J.; Ni, X. Different effects of litter and root inputs on soil enzyme activities in terrestrial ecosystems. Appl. Soil Ecol. 2023, 183, 104764. [Google Scholar] [CrossRef]
  56. Xu, H.; Qu, Q.; Li, G.; Liu, G.; Geissen, V.; Ritsema, C.J.; Xue, S. Impact of nitrogen addition on plant-soil-enzyme C-N–P stoichiometry and microbial nutrient limitation. Soil Biol. Biochem. 2022, 170, 108714. [Google Scholar] [CrossRef]
  57. Verma, G.; Dhaka, A.K.; Singh, B.; Kumar, A.; Choudhary, A.K.; Kumar, A.; Kamboj, N.K.; Hasanain, M.; Singh, S.; Bhupenchandra, I.; et al. Productivity, soil health, and carbon management index of soybean-wheat cropping system under double zero-tillage and natural-farming based organic nutrient management in north-Indian plains. Sci. Total Environ. 2024, 917, 170418. [Google Scholar] [CrossRef]
  58. Liu, X.C.; Li, S.Y.; Wang, S.; Bian, Z.X.; Zhou, W.; Wang, C.Q. Effects of farmland landscape pattern on spatial distribution of soil organic carbon in Lower Liaohe Plain of northeastern China. Ecol. Indic. 2022, 145, 109652. [Google Scholar] [CrossRef]
  59. Yi, J.; Zeng, Q.; Mei, T.; Zhang, S.; Li, Q.; Wang, M.; Tan, W. Disentangling drivers of soil microbial nutrient limitation in intensive agricultural and natural ecosystems. Sci. Total Environ. 2022, 806, 150555. [Google Scholar] [CrossRef]
  60. Cui, Y.; Zhang, Y.; Duan, C.; Wang, X.; Zhang, X.; Ju, W.; Chen, H.; Yue, S.; Wang, Y.; Li, S.; et al. Ecoenzymatic stoichiometry reveals microbial phosphorus limitation decreases the nitrogen cycling potential of soils in semi-arid agricultural ecosystems. Soil Tillage Res. 2020, 197, 104463. [Google Scholar] [CrossRef]
  61. Guan, H.L.; Fan, J.W.; Lu, X. Soil specific enzyme stoichiometry reflects nitrogen limitation of microorganisms under different types of vegetation restoration in the karst areas. Appl. Soil Ecol. 2022, 169, 104253. [Google Scholar] [CrossRef]
  62. Benitez, M.S.; Ewing, P.M.; Osborne, S.L.; Lehman, R.M. Rhizosphere microbial communities explain positive effects of diverse crop rotations on maize and soybean performance. Soil Biol. Biochem. 2021, 159, 108309. [Google Scholar] [CrossRef]
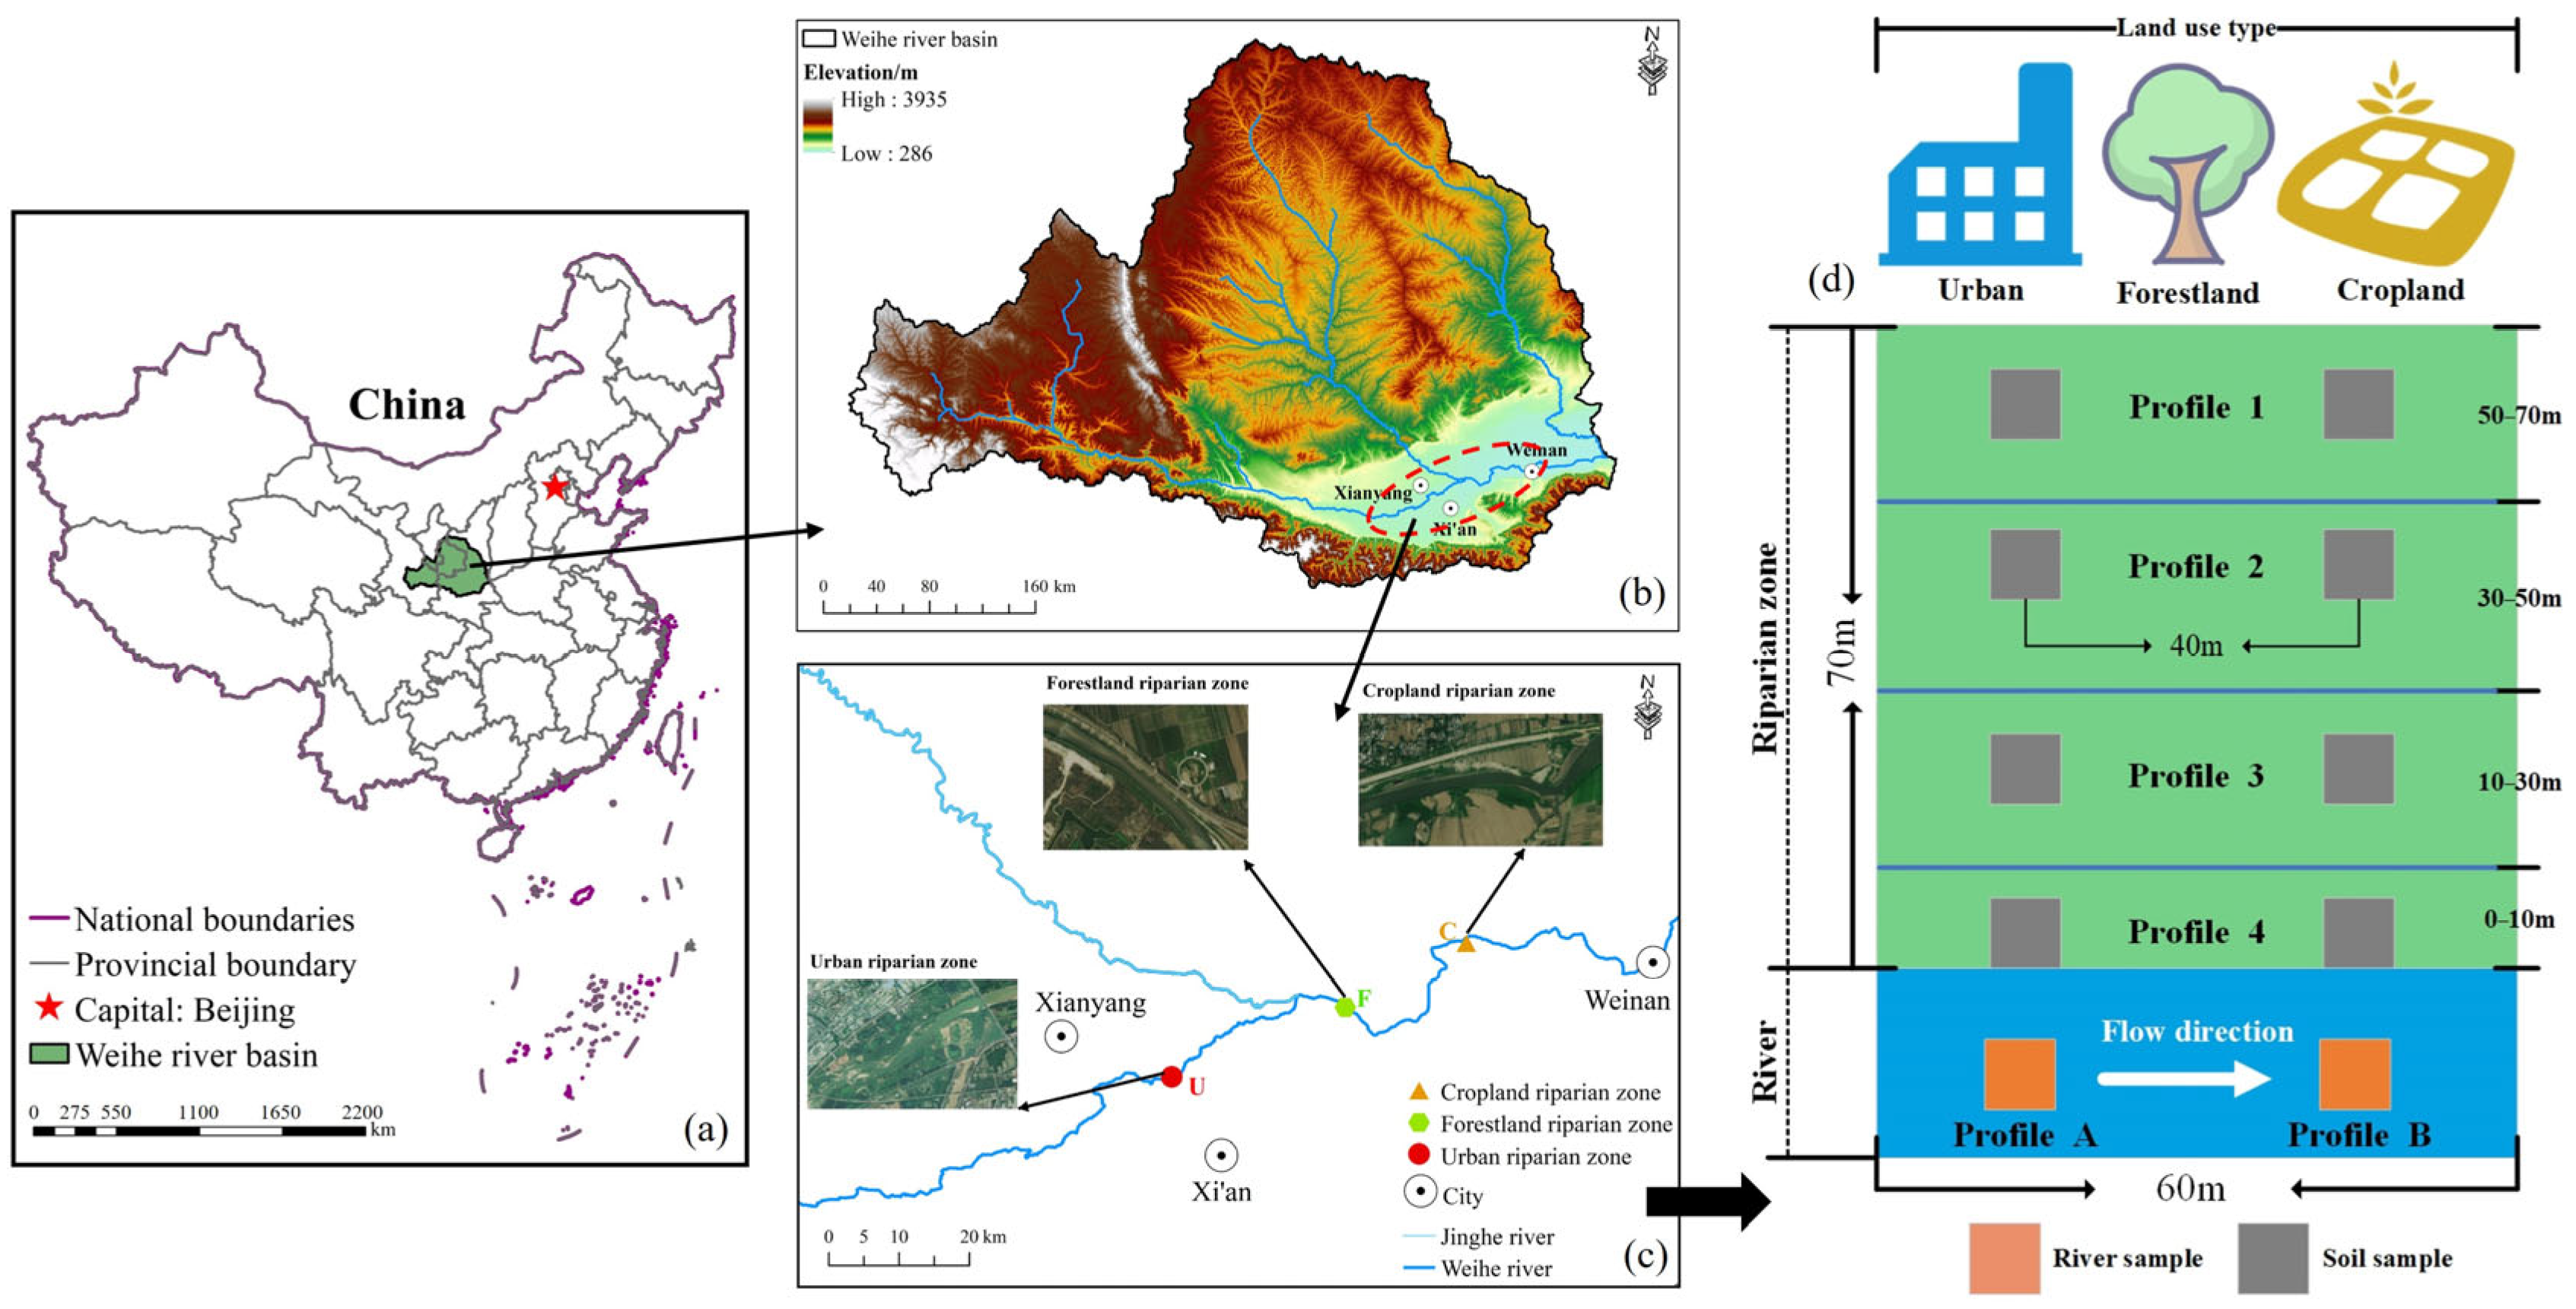
Figure 1. Overview of the study area. (a) Geographic location of the Weihe River basin. (b) Location of the study river section. (c) Types of riparian zone sample plots. (d) Soil and water sample collection scheme in the riparian zone.
Land 14 02056 g001
Figure 2. Conceptual model of PLS-SEM.
Land 14 02056 g002
Figure 3. Physicochemical properties of river in different riparian zones.
Land 14 02056 g003
Figure 4. Physicochemical properties of soil in different riparian zones.
Land 14 02056 g004
Figure 5. Soil enzyme activities in different riparian zones.
Land 14 02056 g005
Figure 6. DFA analysis of soil enzyme activities in riparian zones. (a,b) different riparian zones; (c,d) different sampling points.
Land 14 02056 g006
Figure 7. Thermogram of correlation between soil physicochemical properties and soil enzyme activities at different widths of riparian zones.
Land 14 02056 g007
Figure 8. Path coefficients and significance test results. *** p < 0.001, ** p < 0.01, * p < 0.05.
Land 14 02056 g008
Figure 9. Weighting coefficients of explanatory variables in PLS−SEM.
Land 14 02056 g009
Table 1. Two-way ANOVA of soil enzyme activities in riparian zones.
FactorAPLAPNAGBGECEG
Riparian zone width (Rzw)4.14 *10.03 ***3.73 *1.42 6.16 *2.83
Soil depth (Sd)4.99 *6.96 **8.37 *3.21 * 4.46 *3.21
Interaction (Rzw & Sd)0.13 0.53 1.68 *0.39 0.72 4.39 *
Notes: Categorical factors are riparian zone width (profile-1, profile-2, profile-3 and profile-4) and soil depth (0–20 cm and 20–50 cm) and their interactions. The data are presented as f-values with their significance levels (***: p < 0.001; **: p < 0.01; *: p < 0.05). Riparian zone width (Rzw) indicates significant differences between sampling sites in different riparian zone profiles. Soil depth (Sd) indicates a significant difference between different soil depth conditions. The interaction indicates a significant difference between riparian zone width and soil depth together.
Disclaimer/Publisher’s Note: The statements, opinions and data contained in all publications are solely those of the individual author(s) and contributor(s) and not of MDPI and/or the editor(s). MDPI and/or the editor(s) disclaim responsibility for any injury to people or property resulting from any ideas, methods, instructions or products referred to in the content.