Abstract
The quality risks of land trusteeship services are increasingly prominent, leading to reduced crop yields for farmers and land degradation; however, relevant research remains insufficient. This paper aims to identify and evaluate the quality risk level of land trusteeship services. It comprehensively adopts a field survey, web crawler technology, and expert consultation methods to identify quality risk types, and then uses the fuzzy comprehensive evaluation method to assess the risk level based on survey data from Chinese farmers. The main conclusions are as follows: (1) Overall, the quality risk level of land trusteeship services is at a relatively high risk level. In terms of spatio-temporal patterns, the quality risk level shows an upward trend, and the quality risk level of mid-production services is increasing at the fastest rate. There are significant variations in service quality risk across prefecture-level cities in the Shandong Province of China. (2) In terms of risk heterogeneity, the quality risk level of small-scale pure farmers is higher than that of part-time farmers and large professional farmers, in that order. The quality risk level of the “farmer + service organization” model is higher than that of the “farmer + intermediary + service organization” model. According to the order of the quality risk level of different crops, the ranking (from highest to lowest) is cash crops, wheat, and corn. (3) The high quality risks of land trusteeship services will impact the multifunctionality of land systems. It exacerbates the land pollution and fertility degradation because of excessive application of chemical inputs like pesticides, fertilizers, and mulch by service organizations. It consequently destroys ecological systems, hinders sustainable agricultural development, and impacts farmers’ income and national food security by reducing yields. The research findings contribute to controlling the quality risks of land trusteeship services and protecting land.
1. Introduction
As the main form of agricultural socialized services, land trusteeship practice has a long history. Due to the low comparative profitability of agriculture, the structure of the rural labor force is constantly being adjusted, leading to a flow of young laborers to non-agricultural sectors []. In the past, land trusteeship addressed the question of “who will farm and how to farm” by replacing labor with agricultural machinery []. It is now the mainstream route to large-scale agricultural service provision in China. Land trusteeship is a way of integrating farmers into the modern agricultural production and division of labor system, which in turn promotes the modernization of Chinese agriculture and the construction of a strong agricultural country. Land trusteeship has significant economic benefits, including saving agricultural production costs, increasing output, and improving farmers’ incomes. Land trusteeship can not only increase the net income of farms []; it can also reduce the relative poverty level of farmers []. However, risk and reward go hand in hand. There are also quality risks associated with land trusteeship services that cannot be ignored. Specifically, they are manifested in plowing, sowing, pest control, and harvesting links, such as insufficient plowing depth, inappropriate sowing density, uneven or untimely pesticide application, and high loss rates in mechanical harvesting []. In practice, the service quality of service organizations often fails to meet farmers’ expectations, leading to land trusteeship disputes. The quality risks of land trusteeship services will exacerbate land pollution and soil fertility degradation, reduce crop yields, and thereby affect both farmers’ income and national food security. So, quality risk identification, assessment, and control of land trusteeship services have become an urgent and realistic problem.
Existing research on land trusteeship mainly focuses on the formation logic, development status, and comprehensive impact. With regard to the formation logic, land trusteeship services can be explained by the theory of labor division [], and labor migration can promote small-scale farmers’ demand for land trusteeship, especially by increasing the demand for the service type, intensity, and organization degree of service providers []. Regarding the development status, land trusteeship is dominated by cross-regional socialized services in China, and the advantages of data systems can be utilized to achieve dynamic monitoring []. Accordingly, the land trusteeship service platform was designed using cloud computing, and its service effect was evaluated through neural networks []. In practice, land trusteeship is more conducive to improving green technology inputs than independent investments in agricultural machines, and can bring higher profits to small-scale farmers []. As for the comprehensive impact, the first is the economic impact. Land trusteeship services indirectly promote the growth of food production through large-scale operations [] and significantly boosted farmers’ income [,], and help to reduce the income gap between farmers []. Meanwhile, land trusteeship services have a facilitating effect on the labor transfer of corn farmers; the effect on the labor transfer of flatland farmers and pure farmers is obvious compared with that of other topographic conditions and part-time farmers []. Second, the social impact: land trusteeship services have a positive impact on collective action in irrigated commons governance, and can mitigate the negative effects of the rural labor force transfer []. Third, the environment impact: land trusteeship reduces chemical fertilizer use [] and positively affects farmers’ green production behaviors, such as adoption of no-tillage technology, organic fertilizer application technology, and straw-returning technology, by promoting non-farm employment and expanding the size of cultivated land []. In addition, land trusteeship services can promote the improvement of agricultural carbon efficiency []. In summary, it can be seen that the existing research only focuses on the positive role of land trusteeship, but little of the literature has focused on the issue of quality risks in land trusteeship service.
Based on the above practical problems and the literature gaps, this paper comprehensively utilizes the methods of field survey, expert consultation, and network crawler to identify the land trusteeship service quality risks from the land trusteeship operation process. Based on the results of risk identification, we construct the land trusteeship service quality risk assessment index system, and determine the weights of assessment indexes by combining subjective and objective methods, such as the network analysis method and the entropy value method. Then, we make a comprehensive assessment of the quality risk level in land trusteeship services by using the fuzzy comprehensive evaluation method to analyze the spatial and temporal characteristics.
The innovations of this paper are as follows. First, unlike previous studies focusing on the positive effects of land trusteeship, this paper identifies and evaluates quality risks in land trusteeship service for the first time, based on micro-level household survey data. Second, unlike single-method risk identification, this study employs textual analysis, field surveys, and expert consultation to comprehensively identify quality risks of land trusteeship. Third, this paper adopts network analysis to account for the interdependent relationships among evaluation indicators, thereby avoiding the requirement for indicator independence in traditional evaluation methods.
2. Methodology and Data
2.1. Risk Identification and Assessment Index
This study first identifies the quality risks of the types of land trusteeship services from the data, via textual analysis; second, it identifies such risks from practical contexts through field surveys; and finally, it synthesizes the risk types identified from both data and practice and confirms the final quality risks of types of land trusteeship services through expert consultation. This three-step approach reflects the integration of data, practice, and theory in the risk identification process, making the risk identification results more scientific and systematic. The risk identification process is as follows.
(1) The field survey process on quality risks. First, a farmer survey was conducted. Interviews were conducted with land trusteeship farmers in the Shandong Province of China and other places, to list as many types of quality risks in land trusteeship services as possible following a brainstorming procedure. The second is to conduct a survey of well-known domestic service organizations, such as “JinFengGongShe” in Shandong and identify the quality risks of types of land trusteeship services from practice cases.
(2) The process of textual analysis of quality risks. The first step is to construct a quality risk dataset of land trusteeship services. With the help of Python3.13 web crawler technology, news reports, government documents, the academic literature, and other materials are mined using the keywords of land trusteeship, trusteeship risk, trusteeship quality risk and trusteeship service quality. On this basis, data cleaning is carried out to remove data noise, identify highly correlated data, realize the unified coding of different types of data, and finally obtain the land trusteeship service quality risk text dataset. In the second step, the feature vectors of quality risk in land trusteeship service are extracted. Based on the text dataset of quality risk in land trusteeship services, feature vectors are extracted using a TF-IDF algorithm. Where TF is the frequency of the feature word in the document , which is calculated as , denotes the frequency of word i in document , and denotes the total frequency of occurrence of each word in the document . The IDF is calculated as , where is the total number of documents in the document set, and is the number of documents in the document set in which the word i occurs. Using the Sklearn machine learning toolkit in Python software, the text of the quality risks in land trusteeship services is converted into a weight vector, so as to obtain the textual feature weights of the quality risk. The TF-IDF algorithm operation process can be described as (1). The relevant API interfaces in Sklearn are called to train the aforementioned matrix for unsupervised learning, ultimately achieving the characterization of the behavioral characteristics of land trusteeship subjects. In order to enhance the reliability of the text analysis results, this paper confirms the quality risk types through the expert consultation method, and the specific process is described below.
(3) The expert consultation process on quality risks. According to the procedures and steps of the Delphi method, we invite 23 experts and scholars in the fields of land trusteeship and agricultural risk management, including 8 professors from universities, 5 researchers from research institutes, and 10 staff members from governmental agricultural management departments. The first round of the survey collects all potential types of land trusteeship service quality risks identified by experts. The second round of the survey allows experts to revise these risk types, while the third round enables experts to confirm the final quality risk types of land trusteeship services. Accordingly, the final quality risk types are derived.
Combining all the quality risks of types of land trusteeship services obtained from the text analysis, field survey, and expert consultation method above, the risks are categorized and refined according to their connotations and interpretations. Risks with different names but the same connotation are categorized as a single type of risk. Finally, according to the classification standard of agricultural production process, the quality risks of land trusteeship services can be divided into three categories: pre-production, mid-production and post-production service quality risks. This yields a systematic and comprehensive set of land trusteeship service quality risk types. From the perspective of the service process, the quality risks assessment index system for land trusteeship services is then constructed, as shown in Table 1.

Table 1.
System of indicators for assessing the quality risks of land trusteeship services.
2.2. Data Sources and Description
The data for the quality risk assessment of land trusteeship services are derived from rural surveys. Shandong Province was chosen as the research site, and the research was conducted according to the principle of combining random sampling and stratified sampling. According to the level of agricultural economic development and land trusteeship, 12 prefectural-level cities in Shandong Province, including Qingdao, Jinan, Zaozhuang, Rizhao, Jining, Dongying, Linyi, Dezhou, Binzhou, Liaocheng, Heze, and Weifang, were selected. A total of 20 counties with a large volume of land trusteeship service operations were selected as sample survey areas. Three to five sample townships were selected under each sample county, two to three sample villages were selected under each sample township, and 10 sample farmers were randomly selected from each administrative village, according to the difference in the number of farmers. For these sampled farmers, household surveys were conducted, with follow-up surveys carried out in two rounds by the research team in 2022 and 2023. The total number of valid farmers’ questionnaires for the two years is 1138.
Using the questionnaire data, a weighting method was applied to convert farmers’ evaluation data on the magnitude of quality risks into a “degree of membership”—a key concept in fuzzy comprehensive evaluation, which was measured based on membership frequency. The descriptive statistical results of the affiliation degree data of quality risk evaluation in land trusteeship services obtained from the survey are shown in Table 2.
Table 2.
Data on the quality risk level evaluation of land trusteeship services.
2.3. Risk Assessment Indicator Weight Calculations
(1) The entropy value method to determine objective weights. This study uses the entropy value method to determine the objective weights of the indicator system for evaluating the quality risks of land trusteeship services. By calculating the degree of dispersion of each indicator value, the entropy value method determines indicator weights, which effectively avoids the subjective biases associated with methods such as the Analytic Hierarchy Process (AHP) and direct scoring, thereby providing a more objective basis for comprehensive evaluation. The specific steps are as follows. The first step is indicator setting. With evaluation object m farmers or service organizations, and n indicators, the raw data matrix (Xij)mn is constructed, where Xij denotes the j indicator value of the i evaluation object. In the second step, the original data are normalized using the extreme value method. The third step is to calculate the weight of each indicator. The entropy value method is applied to objectively calculate the weight of each indicator to provide a basis for the comprehensive evaluation of the quality risks of land trusteeship services. Calculate the weight of the i mode under the j indicator with . Calculate the entropy value of the j indicator with . Calculate the coefficient of variation in the j indicator with . Calculate the weight of each indicator using Equation (2).
(2) The network analysis method to determine subjective weights. Given the interconnections among the quality risk evaluation indicators of land trusteeship services, the AHP cannot accurately calculate indicator weights. Therefore, this study adopts the Analytic Network Process (ANP) method to determine the subjective weights of the indicator system for quality risk assessment. The first step is data standardization. In order to eliminate differences in scale and the order of magnitude among different evaluation indicators, data standardization is performed. In this study, extreme value normalization is applied to scale raw data to the range of 0–1. In the second step, indicator weights are determined. The specific steps are as follows. Construct judgment matrix: A = (aij)n×n, where aij > 0, aij = 1/aji, aii = 1; i, j = 1, 2, …, n. Based on the aforementioned quality risk evaluation index system of land trusteeship services, the expert scoring method is used to construct pairwise comparison judgment matrices for all indicators, followed by consistency tests for these matrices. Construct the supermatrix, and then construct the weighted supermatrix, as shown in Equation (3). Calculate the limit of the supermatrix to obtain the weights of each quality risk evaluation indicator of land trusteeship services.
(3) The determination of comprehensive weights combining subjectivity and objectivity. The objective weights were obtained through the entropy value method above, while the subjective weights were obtained through the network analysis method. The comprehensive weights of the quality risk evaluation indicators of land trusteeship services, combined with the subjective and objective weights, are calculated using the linear weighting method shown in Equation (4). Where is the comprehensive weight of the quality risk evaluation indexes, is the weight of the quality risk evaluation indexes calculated by the network analysis method, and is the weight of the quality risk evaluation indexes calculated by the entropy value method. is the adjustment coefficient, set to 0.5 in this paper, considering that the subjective weight of quality risk evaluation indexes of land trusteeship service is of equal importance to the objective weight.
Using the aforementioned indicator of weight determination methods and data, the weights of each risk evaluation indicator calculated via the entropy value method and the network analysis method are obtained separately. The comprehensive weights of quality risk evaluation indicators are then derived by taking the arithmetic average of the weights from these two methods, as presented in Table 3.
Table 3.
Weights of indicators for assessing the quality risks of land trusteeship services.
2.4. Risk Assessment Method
The fuzzy comprehensive evaluation method decomposes a complex decision-making problem into a number of sub-problems and expresses the evaluation criteria of these sub-problems using fuzzy language, so that the decision-maker can assess the importance of each decision-making factor more objectively. The quality risks of land trusteeship services are influenced by multiple factors and cannot be evaluated using a simple binary standard of “good” or “bad”; instead, they represent a typical “cognitive uncertainty” problem. In this paper, we utilize the fuzzy comprehensive evaluation method to evaluate the quality risks of land trusteeship services, and the specific steps are as follows.
Firstly, the indicator set for evaluating the quality risks of land trusteeship services totals 16 tertiary indicators. Among them, is composed of the indicator layer indicator . The evaluation set of the quality risks of land trusteeship services, , represents the five evaluation levels of very small, small, average, large, and very large risks. From the evaluation results of the evaluation set, the evaluation matrix of each element layer can be obtained using . The weight set of each index is expressed as , which is determined according to the entropy value method and network analysis method described earlier. Based on the comprehensive quality risk evaluation index system of land trusteeship services, and by integrating the comprehensive weights of the indicators and questionnaire data, we can obtain the result that the evaluation indicator, , belongs to the evaluation set V, using the weighted average method to calculate the pre-production service quality risk RB1, as shown in Equation (5). Similarly, the judgment matrix of mid-production service quality risk RB2 and post-production service quality risk RB3 can be obtained.
Secondly, the evaluation vector B1 for pre-production service quality risk is obtained by applying the M(·,+) fuzzy operator to process the judgment matrix of the indicators at the elemental level, as presented in Equation (6). Similarly, evaluation vectors B2 (for mid-production service quality risk) and B3 (for post-production service quality risk) are derived using the same method. Based on the evaluation vectors at the elemental level, the evaluation vector B for overall service quality risk is obtained.
Finally, a defuzzification operation is performed to derive the comprehensive evaluation scores for each category of service quality risk. Based on the evaluation vector B1, the comprehensive evaluation score RiskB1 is obtained for the quality risk of pre-production services, as shown in Equation (7). Based on the evaluation vector B2, the comprehensive evaluation score RiskB2 for the quality risk of mid-production services is obtained, see Equation (8). Based on the evaluation vector B3, the overall quality risk evaluation score of post-production services is obtained as RiskB3, see Equation (9). Based on the overall quality risk evaluation vector A, the comprehensive quality risk evaluation score for land trusteeship services (denoted as RiskA) is obtained, as shown in Equation (10).
3. Results and Analysis
3.1. Overall Level of Service Quality Risk
Given the subjectivity and uncertainty inherent in quality risks of land trusteeship services, this study adopts the fuzzy comprehensive evaluation method to assess the quality risk level. Using the survey data and the aforementioned fuzzy comprehensive evaluation method, the results of the comprehensive quality risk evaluation for land trusteeship services are presented in Figure 1.
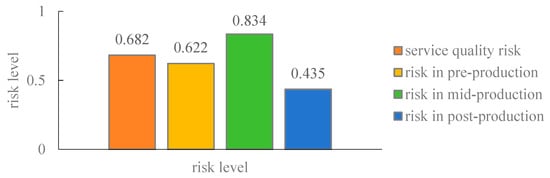
Figure 1.
Overall quality risk level of land trusteeship services.
First, the quality risk level: from the above calculation results, the fuzzy comprehensive evaluation scores are as follows: 0.682 for overall quality risk of land trusteeship services, 0.622 for quality risk of pre-production services, 0.834 for quality risk of mid-production services, and 0.435 for quality risk of post-production services.
Second, the quality risk rank: drawing on established risk classification standards, this study classifies the quality risk level of land trusteeship into five ranks: very low risk (0~0.2), low risk (0.2~0.4), moderate risk (0.4~0.6), high risk (0.6~0.8), and very high risk (0.8~1). Overall, the quality risk level of land trusteeship services is 0.682, which falls into the “high risk” rank. The quality risk of pre-production services is in a high risk rank, the quality risk of mid-production services is in a very high risk rank, the quality risk of post-production services is in a moderate risk rank, and the quality risk rank of mid-production services is greater than the quality risk rank of pre-production and post-production services, in that order. Detailed results are presented in Table 4.
Table 4.
Quality risk level assessment of land trusteeship service.
Third, the size of service quality risk: to further analyze the specific characteristics of quality risks in land trusteeship services, this study presents the questionnaire survey results for the tertiary indicators of quality risk evaluation in each city of Shandong Province, and the results of descriptive statistics are shown in Table 5.
Table 5.
Descriptive statistics results of the quality risk indicators of land trusteeship service.
In the pre-production link, as can be seen from Table 5, 70% of the farmers report that service organizations’ supply of agricultural materials is untimely, of poor quality, or of a high price. A total of 60% of the farmers think that the supply of agricultural machinery by the service organizations is insufficient, untimely, or of poor quality. A total of 90% of the farmers indicate that service organizations’ farmland preparation is inadequate or irrational, both of which lead to insufficient soil moisture. A total of 80% of farmers believe that crop seedlings are not sufficiently cultivated, or of poor quality. A total of 30% of farmers believe that the service organizations’ plowing operations are not deep enough, and that the soil is not compacted and mashed well. In the mid-production process, 80% of farmers believe that the service organization’s sowing is unreasonable, resulting in a low germination rate or inappropriate sowing density. A total of 90% of farmers believe that the service organization’s fertilizer application quantity and structure deviates from the crop’s growth needs. A total of 80% of farmers believe that the service organization’s irrigation is insufficient or uneven. A total of 90% of farmers believe that the service organization’s spreading of chemicals is unreasonable both in concentration and for time, or is uneven, resulting in the failure to eradicate pests and diseases. A total of 90% of the farmers think that the service organization does not remove the weeds in the farmland cleanly or they injure the crops. A total of 70% of the farmers think that the service organization’s machine harvesting leads to fruit damage or a higher loss rate. In the post-production link, 80% of the farmers think that the service organization does not dry the products adequately, resulting in high moisture content, which affects the storage life. A total of 70% of the farmers state that service organizations lack sufficient storage space for agricultural products, resulting in products rotting, becoming moldy, or being improperly stored. A total of 60% of the farmers think that the service organization’s processing quality, duration, and effectiveness affect the rate and quality of the finished products. A total of 90% of the farmers think that the service organization’s agricultural products are damaged or deteriorated in transportation. A total of 50% of the farmers think that the service organization does not remove weeds in the farmland, or they injure the crops. A total of 50% of the farmers report that service organizations face difficulties in selling farmers’ agricultural products on their behalf, leading to inventory backlogs or selling prices that are lower than expected.
In summary, sample farmers in the surveyed area generally agree that the quality risks of land trusteeship services are high. Among these, quality risks in trusteeship operation links—including sowing, farmland preparation, fertilizer application, pesticide application, weeding, drying, and transportation—are the most severe, with over 80% of farmers expressing dissatisfaction with the quality of these services. This indicates that while land trusteeship helps to realize agricultural production cost savings and efficiency improvements, it also carries non-negligible service quality risks. The quality risks of land trusteeship services are related to the personal interests of farmers and the sustainable development of land trusteeship, and it is a theoretical and practical problem that needs to be solved in the organic connection between small-scale farmers and modern agricultural development. Risk prevention is not only the bottom line of the cooperation of various parties involved in land trusteeship, but should also become a key concern of the local agricultural authorities.
(1) The temporal changes in quality risk levels. Following the same approach, farmers’ evaluation data are divided by year. Using the same evaluation method and calculation steps as above, we obtain the temporal trends of the quality risk level in land trusteeship services: the quality risk level of pre-production services, mid-production services, and post-production services from 2022 to 2023, as shown in Figure 2. As can be seen, the quality risk level of land trusteeship services grows rapidly, with a growth rate of 12.5% between 2022 and 2023. Among them, the quality risk level of pre-production services, the quality risk level of mid-production services, and the quality risk level of post-production services all show an increasing trend. The fastest growth rate was observed for the quality risk level of pre-production services (22.8%), followed by the quality risk level of post-production services (7.4%), and the slowest growth rate was observed for the quality risk level of mid-production services (2.9%). This may be due to the fact that the effects of operations in the mid-production segment are not only difficult to monitor and assess, but also highly risk-prone; their risk levels have already reached a high plateau, leaving little room for further growth. The quality risk level of pre-production has also increased rapidly, driven by farmers’ growing demand for pre-production trusteeship services in recent years.
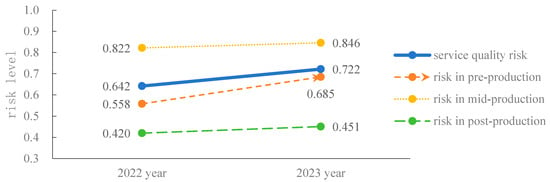
Figure 2.
Temporal changes in the quality risk level of land trusteeship services.
(2) The regional distribution of quality risk levels. The survey samples are divided based on regions to measure the service quality risk level of the prefecture-level city where the land trustee farmers are located. Using the comprehensive evaluation index system and combining it with the weights of the indicators, the measurement results of the quality risk levels of land trusteeship services for farmers, as well as the regional distribution of the quality risk levels of pre-production services, mid-production services, and post-production services were obtained, as shown in Figure 3. In terms of the quality risk level of land trusteeship services, the order of risk from highest to lowest is the following: Jining, Jinan, Linyi, Liaocheng, Heze, Binzhou, Qingdao, Dongying, Rizhao, Zaozhuang, Dezhou, and Weifang. This indicates that the quality of land trusteeship services in southwest Shandong Province is the riskiest; all of the areas are at a high level of risk, except for Weifang, which is at a moderate level of risk.
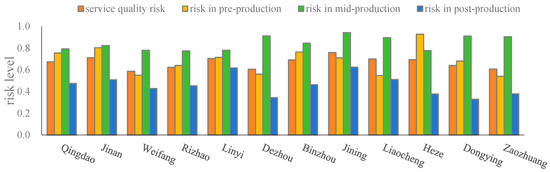
Figure 3.
Regional distribution of quality risk level of land trusteeship service.
3.2. Heterogeneity Analysis of Service Quality Risk
The above analysis examines the overall quality risk level of land trusteeship services and their spatiotemporal distribution characteristics as a whole, but the magnitude of quality risks varies across farmer types, crop types, trusteeship modes, and trusteeship links. The following section analyzes these risk differences across the four aforementioned dimensions.
(1) The quality risk level for different types of farmers. With the evolution of farm household differentiation, there may be differences in the quality risks of land trusteeship services faced by farmers. For this reason, this paper further analyzes the quality risk level of land trusteeship services of different farmer types. Based on farmers’ farming time input, the proportion of agricultural labor in household labor, and land operation scale, this study classifies farmers into three types: small-scale pure farmers, part-time farmers and large professional farmers. The overall service quality risk level of land trusteeship, the quality risk level of pre-production services, the quality risk level of mid-production services, and the quality risk level of post-production services under the perspective of different types of farmers are shown in Figure 4. As observed, large professional farmers have the highest quality risk level of land trusteeship services (0.710), small-scale pure farmers have the second highest quality risk level of land trusteeship services (0.688), and part-timer farmers have the lowest quality risk level of land trusteeship services (0.669). This may be due to the fact that large-scale professional farmers manage larger trusteeship areas and engage in more service links, and the larger the scale, the higher the risk. It can be seen that in the three types of pre-production, mid-production and post-production links, the service quality risk of large professional farmers, part-time farmers, and small-scale pure farmers is slightly different.
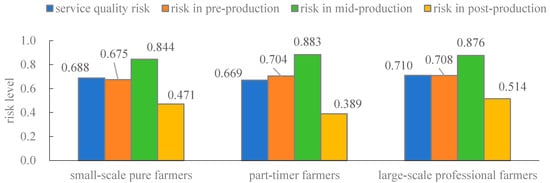
Figure 4.
Quality risk level for different types of farmers.
(2) The quality risk level in different trusteeship models. Two common land trusteeship models are identified: the “farmer + service organization” model and the “farmer + intermediary + service organization” model. In practice, village collectives typically act as intermediaries to organize and coordinate land trusteeship. The levels of service quality risks faced by farmers under different trusteeship models may vary, and compared with the model of farmers directly connecting to service organizations, land trusteeship services face a stronger level of supervision in the presence of intermediary organization coordination, and thus the quality risk level may be reduced. For this reason, this paper further explores the quality risk level for farmers in different trusteeship models. The quality risk levels of farmers under different trusteeship models are shown in Figure 5. As can be seen in Figure 5, the quality risk level of land trusteeship in the “farmer + service organization” model (0.723) is higher than that in the “farmer + intermediary + service organization” model (0.642). This may be due to the fact that intermediary organizations fulfill supervisory and coordinating functions, which help reduce the quality risk level of land trusteeship services. In addition, it can be seen that the pre-production, mid-production and post-production service quality risks of the “farmer + service organization” model are all higher than those of the “farmer + intermediary + service organization” model.
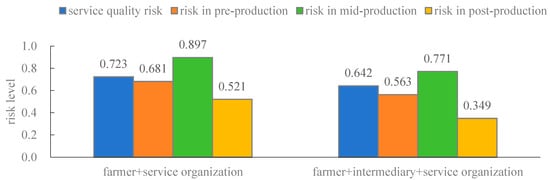
Figure 5.
Quality risk level for different trusteeship models.
(3) The quality risk level in different trusteeship links. With an increase in the number of land trusteeship links, more agricultural production links hosted by service organizations are added to the chain, and the likelihood of risks in these production links is also increasing, and thus the quality risk level in different trusteeship links may vary. For this reason, this paper further explores the service quality risk level of different trusteeship links. Generally, land trusteeship can be divided into partial-link trusteeship and full-link trusteeship, and partial-link trusteeship can be further divided into single-link trusteeship and multi-link trusteeship. The service quality risk levels of farmers under different trusteeship links are shown in Figure 6. As can be seen in Figure 6, the quality risk level is highest for farmers with multi-link trusteeship (0.715), second highest for farmers with single-link trusteeship (0.616), and lowest for farmers with full-link trusteeship (0.270). This result indicates that the quality risk level is increasing, with the increase in trusteeship single- and multi-link numbers, but it decreases again in full-link trusteeship. This may be due to the fact that in the full-link trusteeship, the service organization needs to guarantee agricultural yields. This yield guarantee inhibits the opportunistic behavior of the service organization to a certain extent, which reduces the quality risk. With regard to the quality risk level of pre-production service, multi-link trusteeship is greater than that of single-link trusteeship and full-link trusteeship, in that order. Regarding the quality risk level of mid-production service, the ranking from high to low is consistent with the overall trend: multi-link trusteeship (highest), followed by single-link trusteeship, and full-link trusteeship (lowest). Fourth, the quality risk level of full-link trusteeship is higher than that of single-link trusteeship and multi-link trusteeship, in that order.
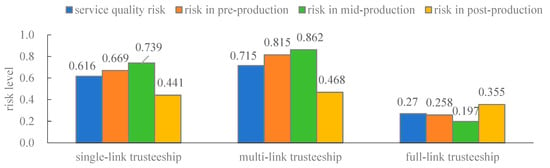
Figure 6.
Quality risk level of different trusteeship links.
(4) The quality risk level for different trusteeship crops. The quality risk level of trusteeship for different crop types may be different, as different crop types have distinct production chains, and the quality of operations within these chains exerts varying impacts on the output of the different crops. For this reason, this paper further analyzes the quality risk levels faced by farmers with different trusteeship crops. The main crops cultivated by farmers in the survey area include wheat, corn, and cash crops, such as vegetables and fruits. The quality risk levels of different trusteeship crops are shown in Figure 7. As shown in Figure 7, the quality risk levels of land trusteeships are ranked from highest to lowest, as follows: cash crops (0.759), wheat crops (0.649), and corn crops (0.638). The above results indicate that cash crops face a higher quality risk in land trusteeship. This is because cash crops involve more complex production links; the quality of trusteeship operations by service organizations have a more significant impact on their yield; and they have higher economic value—thus, if a service quality risk occurs, farmers will suffer greater losses.
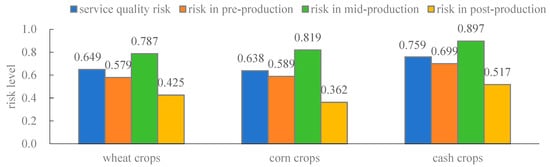
Figure 7.
Quality risk level for different trusteeship crops.
3.3. The Impact of Service Quality Risk on Land Systems
The quality risks of land trusteeship services exacerbate land pollution and fertility degradation. In segmented land trusteeship, farmers bear the cost of purchasing agricultural inputs such as seeds, fertilizers, pesticides, and plastic mulch. To guarantee contracted yields, service organizations often resort to excessive application of chemical inputs like pesticides, fertilizers, and mulch, which intensify land contamination. In full-link land trusteeship, since land contracting rights belong to farmers, while service organizations only hold operational rights, these organizations may engage in short-sighted practices to maximize yields. This often involves exhausting land fertility without prioritizing cultivation and conservation, ultimately damaging land productivity. On the other hand, service organizations may overuse chemical inputs, leading to land compaction, the disruption of ecological systems, and hindering sustainable agricultural development. Furthermore, when quality risks of land trusteeship services arise, farmers’ production costs increase. Deteriorating service quality impairs crop growth, leading to reduced yields that affect both farmers’ income and national food security.
4. Discussion
Risks exist across different sectors and countries, making risk identification and assessment a critical concern for all industries and nations. Therefore, this study on quality risks of land trusteeship services can serve as a reference for other countries and industries. Naturally, research on risk identification and assessment in other sectors also provides valuable insights for this paper.
For risk identification, scholars have identified that the risks are as follows: drought risk [], health risks in facility-based agriculture [], antibiotic risks [] and ecological risks [] in farmland soils, and environmental risks []. These risk identification studies provide a methodological basis for identifying the service quality risks of land trusteeship in this paper. Guo et al. constructed a climate risk perception index using natural language processing and text-mining techniques []. Similarly, this paper initially identifies the service quality risks of land trusteeship using text analysis techniques, but further refines and validates these preliminary risk identification results through field surveys and expert consultations to enhance accuracy. Based on risk identification, the risks must be categorized according to certain principles. For example, scholars categorized the health risks associated with urban agriculture into trace metal risks in urban farms, health risks from wastewater irrigation, zoonotic disease risks, and others []. However, the boundaries of this health risk classification are vague, and it remains unclear as to which principles this typology is based upon. Therefore, in this study, from the perspective of the agricultural production chain, the service quality risks of land trusteeship are categorized into pre-production, mid-production, and post-production risks.
In terms of risk assessment, scholars have conducted extensive research, laying the foundation for this paper. First, research has focused on natural risk assessment, including combined risks associated with drought and flood [], agricultural water scarcity risks caused by water quantity and quality issues [], drought risk in Thailand [], and the health risks of consuming metal-contaminated vegetables []. Second, studies have addressed ecological risk assessment [], including microplastic contamination risk in the soil of typical farmland in China [], and the risk of cadmium to crop safety []. Third, the resulting human health risks have been assessed []. This paper draws on the methods, models, and data used in these risk assessment studies. Based on the strengths and weaknesses of risk assessment tools and models [], this paper specifically selects the entropy method, combined with network analysis, to determine the weights of risk assessment indicators, and the fuzzy comprehensive evaluation method was selected to assess the quality risks of land trusteeship services. In addition, regarding data sources, Ding and Xu utilized a new dataset of high-resolution soil moisture satellite readings to measure climate risk based on soil moisture fluctuations []. In contrast, this paper uses farmer survey data and a five-point Likert scale to measure the service quality risks of land trusteeship.
Regarding the analysis of heterogeneity, Yang and Li pointed out that agricultural machinery socialization services have a facilitating effect on the labor transfer of maize farmers, with a more pronounced effect on that of pure farmers []. For pure farmer groups, the adoption of machinery socialization services has a more significant impact on the scale of land operation compared to other farmer groups []. The extent to which the cost-saving and yield-enhancing effects of land trusteeship can be realized depends on the resource endowments of different types of farmers []. This suggests that land trusteeship has a significant impact on different types of farmers, which therefore necessitates the classification and discussion of these farmer groups. Different types of farmers face different levels of land trusteeship service quality risk, and this study also draws on this idea of heterogeneity analysis, dividing farmers into three types: small-scale pure farmers, part-time farmers, and large professional farmers, analyzing their land trusteeship service quality risk and comparing them separately. On this basis, this paper also analyzes the heterogeneity of the trusteeship modes, service links, and crops.
The limitations and future directions are as follows. First, risks may have spillover effects [,], but this paper does not analyze the spillover effects of the quality risks of land trusteeship services. Future research could further explore the impacts of these risks on both farmers and service organizations. Second, in terms of risk prevention and control tools, scholars have analyzed the positive effects of government regulations [] and crop insurance [,]. However, this paper only identifies and evaluates the quality risk of farmers’ land trusteeship services, on the basis of which targeted risk prevention and control mechanisms, strategies, and policies for land trusteeship services can be proposed in the future.
5. Conclusions and Recommendations
5.1. Conclusions
This paper identifies the quality risks of land trusteeship services from the perspectives of the principal-agent theory and the land trusteeship operation processes. Based on the risk identification results, this paper constructs a quality risk assessment index system for land trusteeship service, determines the weights of these indices, and then conducts a comprehensive assessment of the quality risk level of land trusteeship services. The findings of this paper are as follows:
The quality risks of land trusteeship services include agricultural materials supply risk, machinery supply risk, farmland preparation risk, seedling cultivation risk, and plowing risk in the pre-production segment; sowing quality risk, fertilizer application risk, crop irrigation risk, disease and pest control risk, weed control risk, and harvesting risk in the mid-production segment; and product drying risk, product storage risk, product processing risk, product transportation risk, and product sales risk in the post-production segment.
Overall, the service quality risk level of farmers’ land trusteeship is 0.622, which is at a relatively high risk level. The quality risk of pre-production services is at a high level, the quality risk of mid-production services is at a very high level, and the quality risk of post-production services is at a moderate level. In terms of the spatio-temporal pattern, the quality risk level of farmers shows an increasing trend, and the quality risk level of mid-production services increases at the fastest rate. The quality risk level varies significantly across prefecture-level cities in Shandong Province. With regard to risk heterogeneity, the quality risk level of small-scale pure farmers is higher than that of part-time farmers and large professional farmers. The quality risk level of the “farmer + service organization” model is higher than that of the “farmer + intermediary + service organization” model. In terms of quality risk levels across different types of trusteeship links, the ranking (from highest to lowest) is full-link trusteeship, multi-link trusteeship, and single-link trusteeship. In terms of quality risk levels across different types of trustee crops, the ranking (from highest to lowest) is cash crops, wheat crops, and corn crops.
The high quality risks of land trusteeship services will impact the multifunctionality of land systems. It exacerbates the land pollution and fertility degradation because of excessive application of chemical inputs like pesticides, fertilizers, and mulch by service organizations. It consequently destroys ecological systems, hinders sustainable agricultural development, and impacts farmers’ incomes and national food security by reducing yields.
5.2. Recommendations
First, the government should formulate the Quality Standards for Land Trusteeship Services to clarify the service specifications and quality requirements for the pre-production, mid-production, and post-production links. Establish a supervision system integrating “government supervision + industry self-discipline + farmer supervision”. Conduct interviews, require rectification, or even revoke qualifications for non-compliant service organization.
Second, since risks in the mid-production link are the most severe, the mid-production service should be taken as the core of quality risk prevention and control. Promote the “Internet of Things + agricultural operation recording” system, and require service organizations to upload real-time data, such as sowing quantity, types and dosage of fertilizers, and disease and pest control agents, so as to realize “full-process traceability” in the mid-production service stage.
Third, small-scale farmers should be encouraged to purchase socialized services in groups to avoid quality risks. Encourage the development of the “small-scale farmers + intermediaries + service organizations” model and support intermediary entities such as rural collective economic organizations and agricultural professional cooperatives to play the role of “bridge and link”. Clarify the responsibilities of intermediaries in service connection and quality supervision and legally pursue their joint liability for service quality risks caused by intermediaries’ dereliction of duty.
Author Contributions
Conceptualization, Y.S. and L.Y.; Investigation, Y.S.; Data curation, L.Y.; Writing—review & editing, L.Y.; Supervision, L.Y.; Funding acquisition, L.Y. All authors have read and agreed to the published version of the manuscript.
Funding
This research was funded by the National Natural Science Foundation of China (72503011), China Postdoctoral Science Foundation (2024M76012), Project of Shandong Provincial Housing and Urban-Rural Development Science and Technology Plan (2025RKX-CZJS103), Scientific Research Fund of Shandong Jiaotong University (Z202344).
Data Availability Statement
The original contributions presented in the study are included in the article, further inquiries can be directed to the corresponding author.
Acknowledgments
Thanks to the anonymous reviewers for their pertinent suggestions.
Conflicts of Interest
The authors declare no conflicts of interest.
References
- Liu, G.; Wang, H.; Cheng, Y.; Zheng, B.; Lu, Z. The impact of rural out-migration on arable land use intensity: Evidence from mountain areas in Guangdong, China. Land Use Policy 2016, 59, 569–579. [Google Scholar] [CrossRef]
- Belton, B.; Win, M.T.; Zhang, X.; Filipski, M. The rapid rise of agricultural mechanization in Myanmar. Food Policy 2021, 101, 102095. [Google Scholar] [CrossRef]
- Baiyegunhi, L.J.S.; Majokweni, Z.P.; Ferrer, S.R.D. Impact of outsourced agricultural extension program on smallholder farmers’ net farm income in Msinga, KwaZulu-Natal, South Africa. Technol. Soc. 2019, 57, 1–7. [Google Scholar] [CrossRef]
- Qiu, H.; Feng, M.; Chi, Y.; Luo, M.; Caraher, M. Agricultural Machinery Socialization Service Adoption, Risks, and Relative Poverty of Farmers. Agriculture 2023, 13, 1787. [Google Scholar] [CrossRef]
- Xiao, J.; Fang, X. Risk Identification and Spatiotemporal Evolution in Rural Land Trusteeship. Land 2025, 14, 1132. [Google Scholar] [CrossRef]
- Zhou, Z.; Zhang, K.; Wu, H.; Liu, C.; Yu, Z. Land. Transfer or Trusteeship: Can. Agricultural Production Socialization Services Promote Grain Scale Management? Land 2023, 12, 797. [Google Scholar] [CrossRef]
- Li, Y.; Huan, M.; Jiao, X.; Chi, L.; Ma, J. The impact of labor migration on chemical fertilizer use of wheat smallholders in China—Mediation analysis of socialized service. J. Clean. Prod. 2023, 394, 136366. [Google Scholar] [CrossRef]
- Wu, C.; Li, D.; Zhang, X.; Pan, J.; Quan, L.; Yang, L.; Yang, W.; Ma, Q.; Su, C.; Zhai, W. China’s agricultural machinery operation big data system. Comput. Electron. Agric. 2023, 205, 107594. [Google Scholar] [CrossRef]
- Zhang, M.; Zhang, Y.; Weng, Z.; Chen, Z. Design and Service Effect Evaluation of Agricultural Social Service Platform Based on 5G and Cloud Computing. Wirel. Commun. Mob. Comput. 2022, 1, 4949242. [Google Scholar] [CrossRef]
- Shi, L.; Pang, T.; Peng, H.; Feng, X. Green technology outsourcing for agricultural supply chains with government subsidies. J. Clean. Prod. 2024, 436, 140674. [Google Scholar] [CrossRef]
- Wu, A.; Elahi, E.; Cao, F.; Yusuf, M.; Abro, M.I. Sustainable grain production growth of farmland—A role of agricultural socialized services. Heliyon 2024, 10, e26755. [Google Scholar] [CrossRef]
- Sang, X.; Luo, X.; Razzaq, A.; Huang, Y.; Erfanian, S. Can. agricultural mechanization services narrow the income gap in rural China? Heliyon 2023, 9, e13367. [Google Scholar] [CrossRef] [PubMed]
- Yang, S.; Li, W. The Impact of Socialized Agricultural Machinery Services on the Labor Transfer of Maize Growers. Agriculture 2023, 13, 1249. [Google Scholar] [CrossRef]
- Wang, Y.; Huan, M. The effects of socialized agricultural services on rural collective action in the irrigation commons: Evidence from China. Agric. Water Manag. 2023, 289, 108519. [Google Scholar] [CrossRef]
- Lin, Y.; Hu, R.; Zhang, C.; Chen, K. The role of public agricultural extension services in driving fertilizer use in rice production in China. Ecol. Econ. 2022, 200, 107513. [Google Scholar] [CrossRef]
- Qing, C.; Zhou, W.; Song, J.; Deng, X.; Xu, D. Impact of outsourced machinery services on farmers’ green production behavior: Evidence from Chinese rice farmers. J. Environ. Manag. 2023, 327, 116843. [Google Scholar] [CrossRef]
- Shi, R.; Shen, Y.; Du, R.; Yao, L.; Zhao, M. The impact of agricultural productive service on agricultural carbon efficiency—From urbanization development heterogeneity. Sci. Total Environ. 2024, 906, 167604. [Google Scholar] [CrossRef]
- Cui, Y.; Zhou, Y.; Jin, J.; Jiang, S.; Wu, C.; Ning, S. Spatiotemporal characteristics and obstacle factors identification of agricultural drought disaster risk: A case study across Anhui Province, China. Agric. Water Manag. 2023, 289, 108554. [Google Scholar] [CrossRef]
- Bai, X.; Pan, K.; Shoaib, N.; Sun, X.; Wu, X.; Zhang, L. Status of phthalate esters pollution in facility agriculture across China: Spatial distribution, risk assessment, and remediation measures. Sci. Total Environ. 2024, 908, 168416. [Google Scholar] [CrossRef]
- Bao, F.; Zhou, Y.; Zhang, Z.; Du, Y.; Zhang, H.; Huang, Y. A perspective of spatial variability and ecological risks of antibiotics in the agricultural-pastoral ecotone soils in eastern Inner Mongolia. Chemosphere 2024, 353, 141627. [Google Scholar] [CrossRef]
- Qin, Y.; Liu, J.; Han, L.; Ren, J.; Jing, C.; Lu, G.; Yang, X. Medium distribution, source characteristics and ecological risk of bisphenol compounds in agricultural environment. Emerg. Contam. 2024, 10, 100292. [Google Scholar] [CrossRef]
- Mergoni, A.; Dipierro, A.R.; Colamartino, C. European agricultural sector: The tortuous path across efficiency, sustainability and environmental risk. Socio-Econ. Plan. Sci. 2024, 92, 101848. [Google Scholar] [CrossRef]
- Guo, K.; Li, Y.; Zhang, Y.; Ji, Q.; Zhao, W. How are climate risk shocks connected to agricultural markets? J. Commod. Mark. 2023, 32, 100367. [Google Scholar] [CrossRef]
- Ganguli, N.; Subic, A.M.; Maheswaran, J.; Talukder, B. Planetary health risks in urban agriculture. Glob. Health J. 2024, 8, 4–10. [Google Scholar] [CrossRef]
- Tanir, T.; Yildirim, E.; Ferreira, C.M.; Demir, I. Social vulnerability and climate risk assessment for agricultural communities in the United States. Sci. Total Environ. 2024, 908, 168346. [Google Scholar] [CrossRef] [PubMed]
- Li, H.; Chen, Q.; Liu, G.; Lombardi, G.V.; Su, M.; Yang, Z. Uncovering the risk spillover of agricultural water scarcity by simultaneously considering water quality and quantity. J. Environ. Manag. 2023, 343, 118209. [Google Scholar] [CrossRef] [PubMed]
- Babel, M.S.; Chawrua, L.; Khadka, D.; Tingsanchali, T.; Shanmungam, M.S. Agricultural drought risk and local adaptation measures in the Upper Mun River Basin, Thailand. Agric. Water Manag. 2024, 292, 108655. [Google Scholar] [CrossRef]
- Chinnannan, K.; Somagattu, P.; Yammanuru, H.; Reddy, U.K.; Nimmakayala, P. Health risk assessment of heavy metals in soil and vegetables from major agricultural sites of Ohio and West Virginia. Biocatal. Agric. Biotechnol. 2024, 57, 103108. [Google Scholar] [CrossRef]
- Wang, T.; Zhang, H.; Huang, C.; Ben, Y.; Zhou, H.; Guo, H.; Han, Y.; Zhang, Y.; Tong, P. Occurrence and potential risks of organophosphate esters in agricultural soils: A case study of Fuzhou City, Southeast China. J. Environ. Sci. 2024, 149, 1–12. [Google Scholar] [CrossRef]
- Jia, Z.; Wei, W.; Wang, Y.; Chang, Y.; Lei, R.; Che, Y. Occurrence characteristics and risk assessment of microplastics in agricultural soils in the loess hilly gully area of Yan’an, China. Sci. Total Environ. 2024, 912, 169627. [Google Scholar] [CrossRef]
- Huang, X.; Li, X.; Zheng, L.; Zhang, Y.; Sun, L.; Feng, Y.; Du, J.; Lu, X.; Wang, G. Comprehensive assessment of health and ecological risk of cadmium in agricultural soils across China: A tiered framework. J. Hazard. Mater. 2024, 465, 133111. [Google Scholar] [CrossRef]
- Agrawal, M.; Hansen, A.V.; Colombel, J.-F.; Jess, T.; Allin, K.H. Association between early life exposure to agriculture, biodiversity, and green space and risk of inflammatory bowel disease: A population-based cohort study. EClinicalMedicine 2024, 70, 102514. [Google Scholar] [CrossRef] [PubMed]
- Mai, X.; Tang, J.; Tang, J.; Zhu, X.; Yang, Z.; Liu, X.; Zhuang, X.; Feng, G.; Tang, L. Research progress on the environmental risk assessment and remediation technologies of heavy metal pollution in agricultural soil. J. Environ. Sci. 2025, 149, 1–20. [Google Scholar] [CrossRef] [PubMed]
- Ding, Y.; Xu, J. Global vulnerability of agricultural commodities to climate risk: Evidence from satellite data. Econ. Anal. Policy 2023, 80, 669–687. [Google Scholar] [CrossRef]
- Yang, S.; Zhang, F. The Impact of Agricultural Machinery Socialization Services on the Scale of Land Operation: Evidence from Rural China. Agriculture 2023, 13, 1594. [Google Scholar] [CrossRef]
- Mi, Q.; Li, X.; Gao, J. How to improve the welfare of smallholders through agricultural production outsourcing: Evidence from cotton farmers in Xinjiang, Northwest China. J. Clean. Prod. 2020, 256, 120636. [Google Scholar] [CrossRef]
- Dai, Y.-S.; Dai, P.-F.; Zhou, W.-X. Tail dependence structure and extreme risk spillover effects between the international agricultural futures and spot markets. J. Int. Financ. Mark. Inst. Money. 2023, 88, 101820. [Google Scholar] [CrossRef]
- Zhou, W.-X.; Dai, Y.-S.; Duong, K.T.; Dai, P.-F. The impact of the Russia-Ukraine conflict on the extreme risk spillovers between agricultural futures and spots. J. Econ. Behav. Organ. 2024, 217, 91–111. [Google Scholar] [CrossRef]
- Mao, H.; Quan, Y.-r.; Fu, Y. Risk preferences and the low-carbon agricultural technology adoption: Evidence from rice production in China. J. Integr. Agric. 2023, 22, 2577–2590. [Google Scholar] [CrossRef]
- Ma, Q.; Zhou, Y.; Wang, J. The impact of climate change on credit risk of rural financial institutions: A threshold effect based on agricultural insurance. N. Am. J. Econ. Financ. 2024, 71, 102086. [Google Scholar] [CrossRef]
- T., M.; Makkithaya, K.; V.G., N. A trusted IoT data sharing and secure oracle based access for agricultural production risk management. Comput. Electron. Agric. 2023, 204, 107544. [Google Scholar]
Disclaimer/Publisher’s Note: The statements, opinions and data contained in all publications are solely those of the individual author(s) and contributor(s) and not of MDPI and/or the editor(s). MDPI and/or the editor(s) disclaim responsibility for any injury to people or property resulting from any ideas, methods, instructions or products referred to in the content. |
© 2025 by the authors. Licensee MDPI, Basel, Switzerland. This article is an open access article distributed under the terms and conditions of the Creative Commons Attribution (CC BY) license (https://creativecommons.org/licenses/by/4.0/).