Abstract
In recent years, with the sustained attention from academia and media to urban air quality and environmental issues, governments and scholars worldwide have been devoted to studying the relationship between air quality and green infrastructure (GI), seeking effective measures to address urban air pollution. This study aims to explore the impact of GI on urban air quality, focusing on analyzing data from Ulsan and Junpo cities in South Korea. Significant statistical significance has been found through correlation analysis between GI area and air pollutants such as nitrogen dioxide, carbon monoxide, particulate matter, and ozone. Specifically, when calculating GI using the Normalized Difference Vegetation Index (NDVI) data, for every 1% increase in GI area, nitrogen dioxide (NO2) decreases by approximately 0.000000001925 ppm. This finding offers important insights for future air quality research and provides empirical evidence for urban planning, emphasizing the significance of green space planning in improving air quality. Additionally, the study suggests that future research should be more diverse, incorporating data from more cities and conducting an in-depth analysis of GI distribution to understand its impact on air quality comprehensively.
1. Introduction
1.1. Background
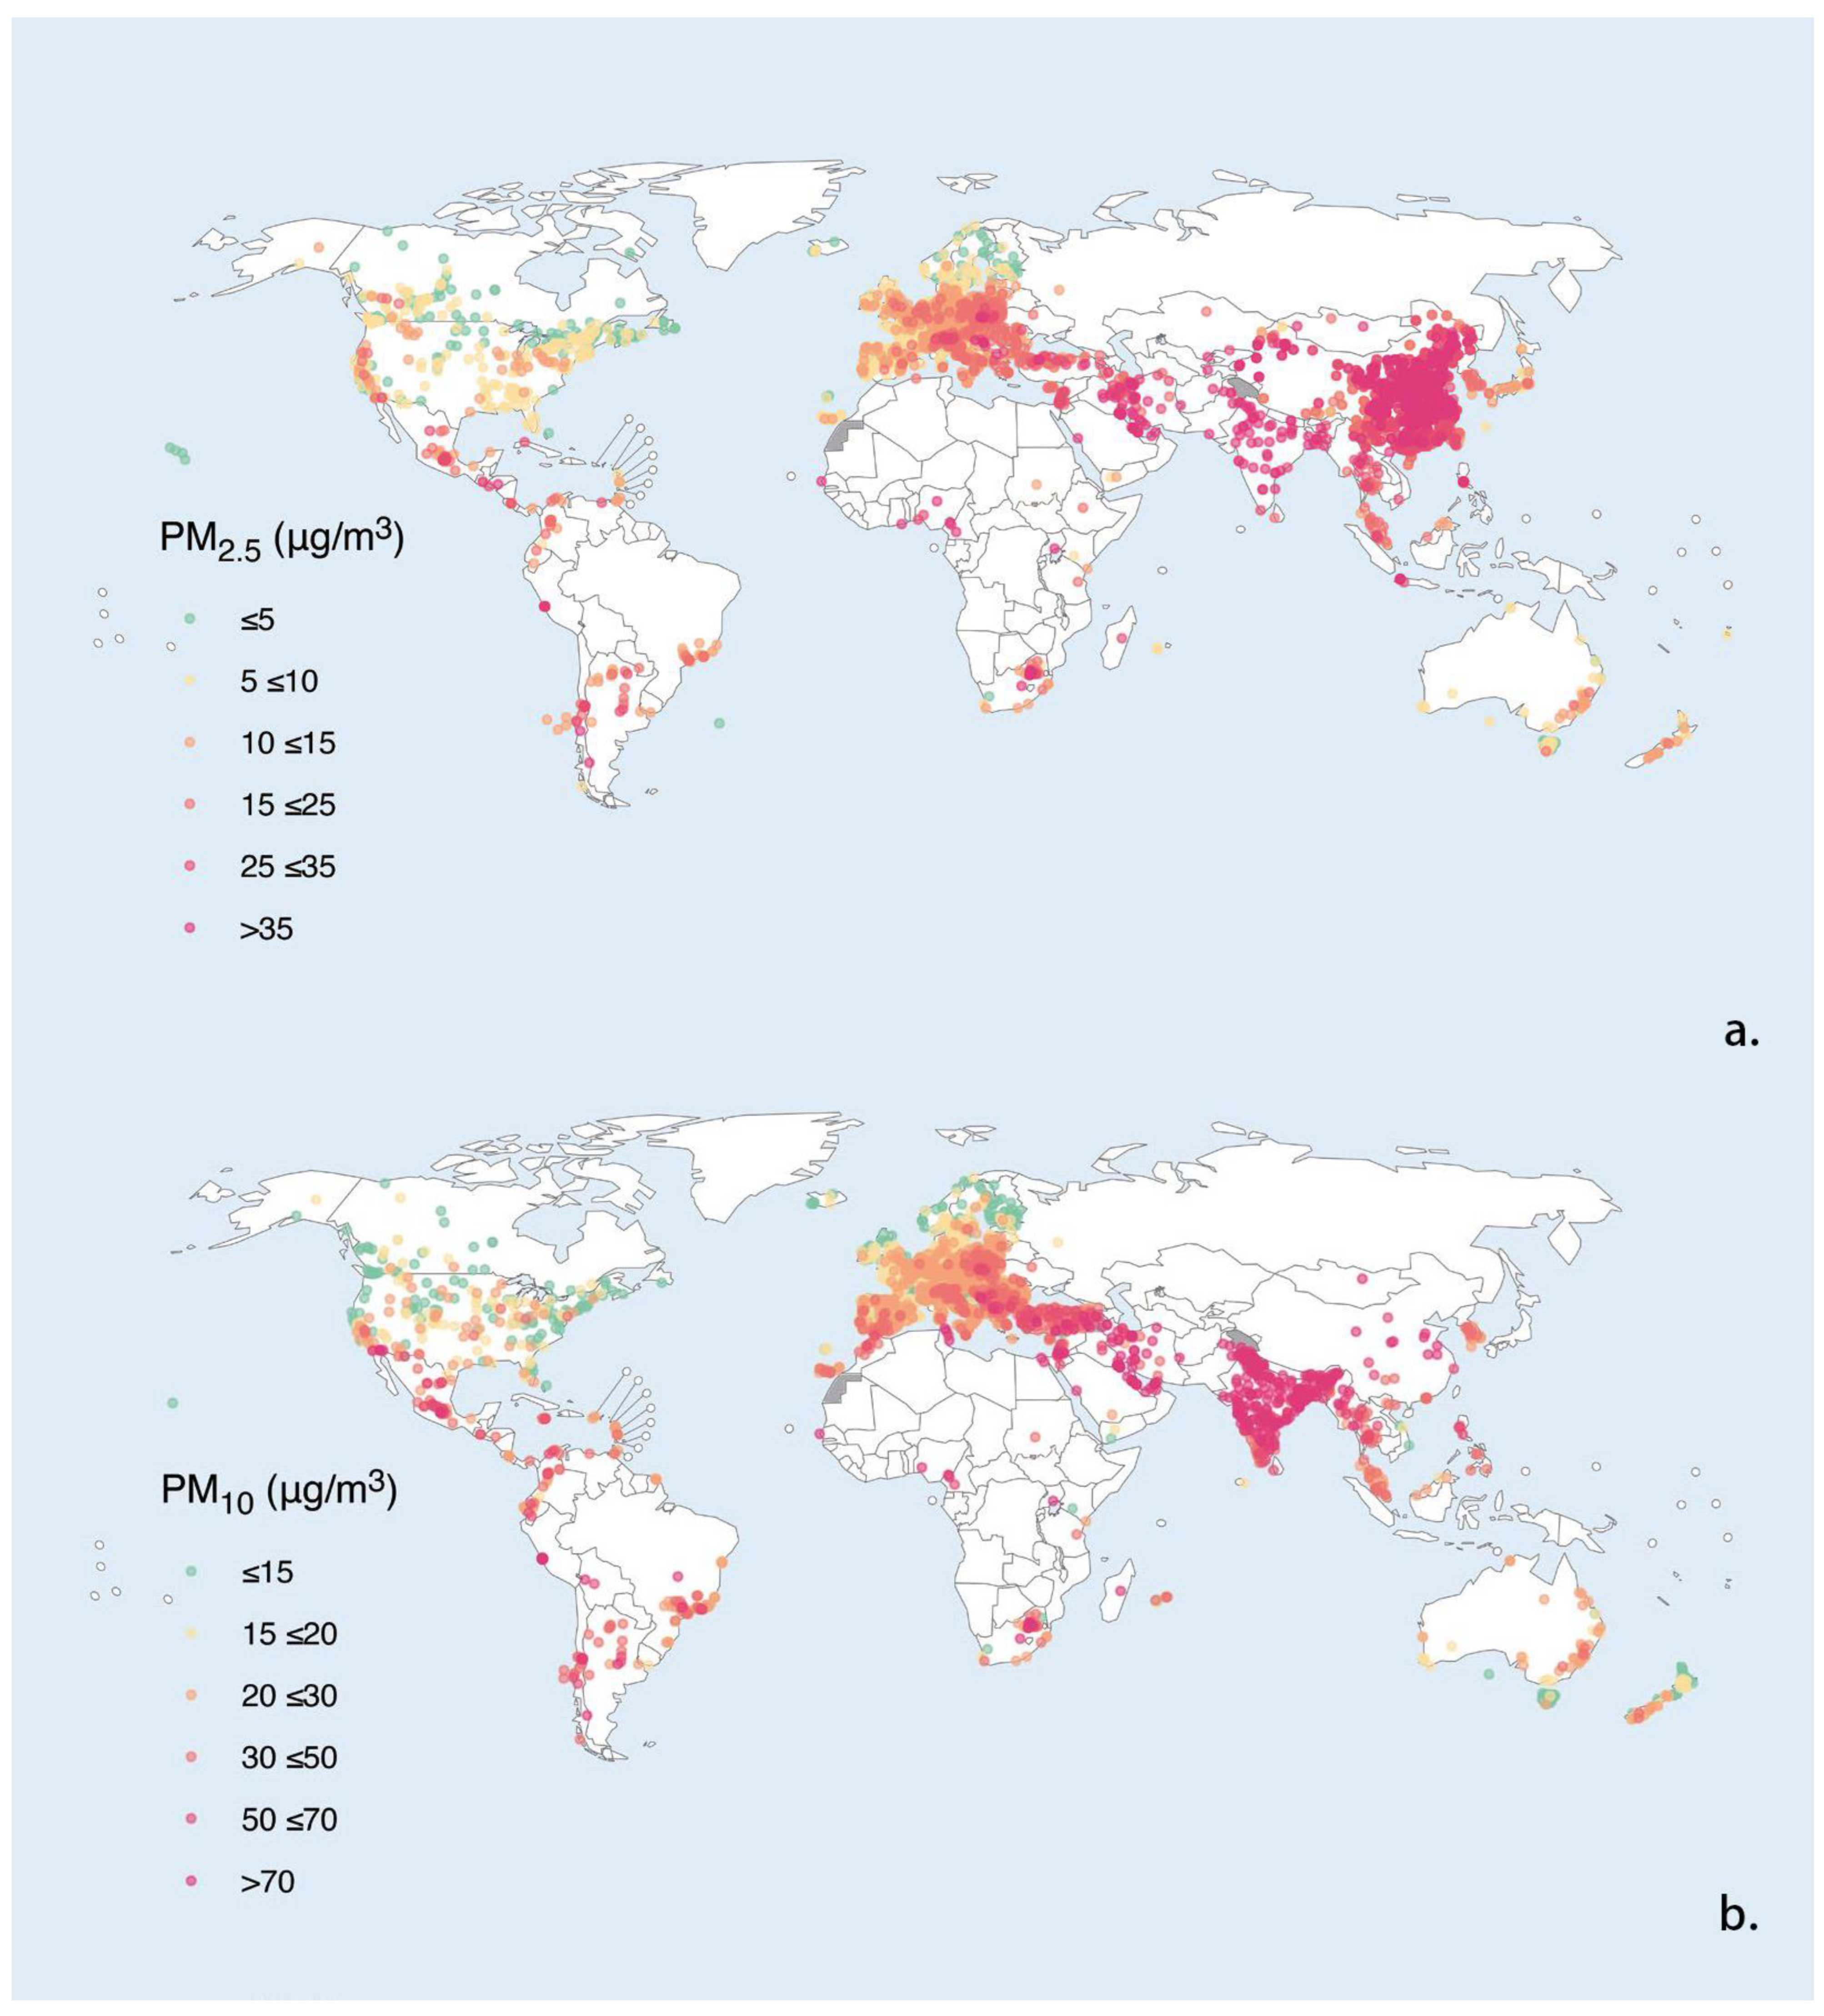
In recent years, with increasing global attention to sustainable development, environmental pollution, and accelerated urbanization processes worldwide, air pollution has caused numerous environmental and health issues [1]. Air pollution, also known as atmospheric pollution, refers to the phenomenon where substances enter the atmosphere due to human activities or natural processes, reaching sufficient concentrations and durations to pose risks to human comfort, health, welfare, or the environment. These substances can be gases, solids, suspended particulate matter, etc. The World Health Organization (WHO) identifies six typical air pollutants: carbon monoxide (CO), lead (Pb), nitrogen dioxide (NO2), suspended particulate matter (SPM), sulfur dioxide (SO2), and ozone (O3) [2]. According to the WHO’s “Ambient air quality database, 2022 update status report” (Figure 1), only 17% of urban areas in high-income countries meet the WHO-recommended thresholds for PM2.5 or PM10 [2]. The density of detected air pollutants is higher in countries with medium to high incomes, such as China, India, Europe, and North America. Therefore, improving air quality has become an urgent issue that needs to be addressed by countries worldwide.
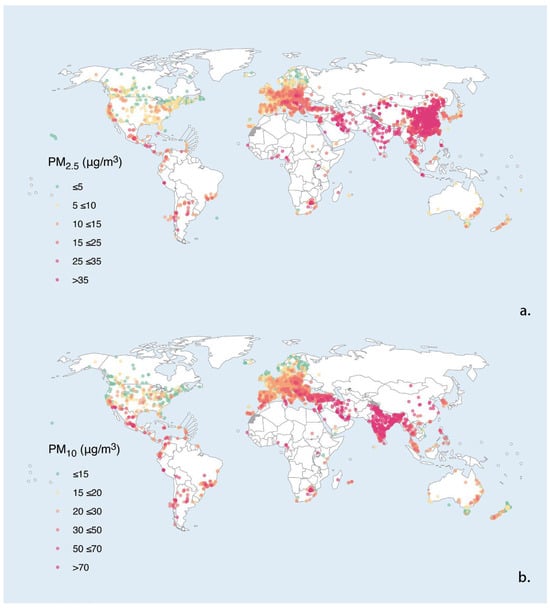
Figure 1.
Locations of settlements with data on (a) PM2.5 and (b) PM10 concentrations, 2010–2019. Reprinted with permission from Ref. [3].
In some pioneering scientific studies, green infrastructure (GI) has been found to have positive impacts on air pollution [4,5,6]. Furthermore, researchers have confirmed that GI plays a crucial role in climate adaptation [7,8], assisting cities in mitigating the impacts of climate change [9,10,11], and enhancing urban resilience [12,13]. Additionally, due to improvements in air quality, GI also has positive effects on public health [14,15,16]. Therefore, this study aims to accurately quantify the influence of GI on air pollution, analyzing their relationship from a more specific physical and architectural perspective.
However, there are various definitions of GI among researchers [17,18,19,20]. When defining GI, researchers primarily focus on keywords such as green space, environment, ecology, network, quality of life, etc. Its constituent elements generally include natural states, man-made constructions, reserve areas, and connecting networks. Since this study specifically investigates the relationship between GI area and air quality, it needs to narrow down the broad definition of GI. Thus, this study defines GI as “a network of urban environmental and ecological green spaces strategically planned or managed”.
1.2. Research Review
To gain a detailed understanding of the research landscape in this field, we conducted a search on the Web of Science (WoS) database using specific search terms. The search terms used were: TS = (“green infrastructure” OR “green land” OR “green area”) AND TS = (“air pollution” OR “atmospheric pollution” OR “air quality”). The search covered the period from 1 January 2014, to 20 May 2024, and included publications in the English language.
In this study, we excluded the following types of papers from our search results: (a) early access, (b) book chapters, (c) data papers, (d) proceeding papers, (e) editorial material, and (f) research papers with incomplete literature and irrelevant to the research topic. As of 29 May 2024, 604 documents were retrieved from this search, covering 177 journals, involving contributions from researchers in 198 countries and regions, affiliated with 1747 institutions, and authored by 2408 individuals. Statistical details are summarized in Table 1.

Table 1.
Statistical information on the data.
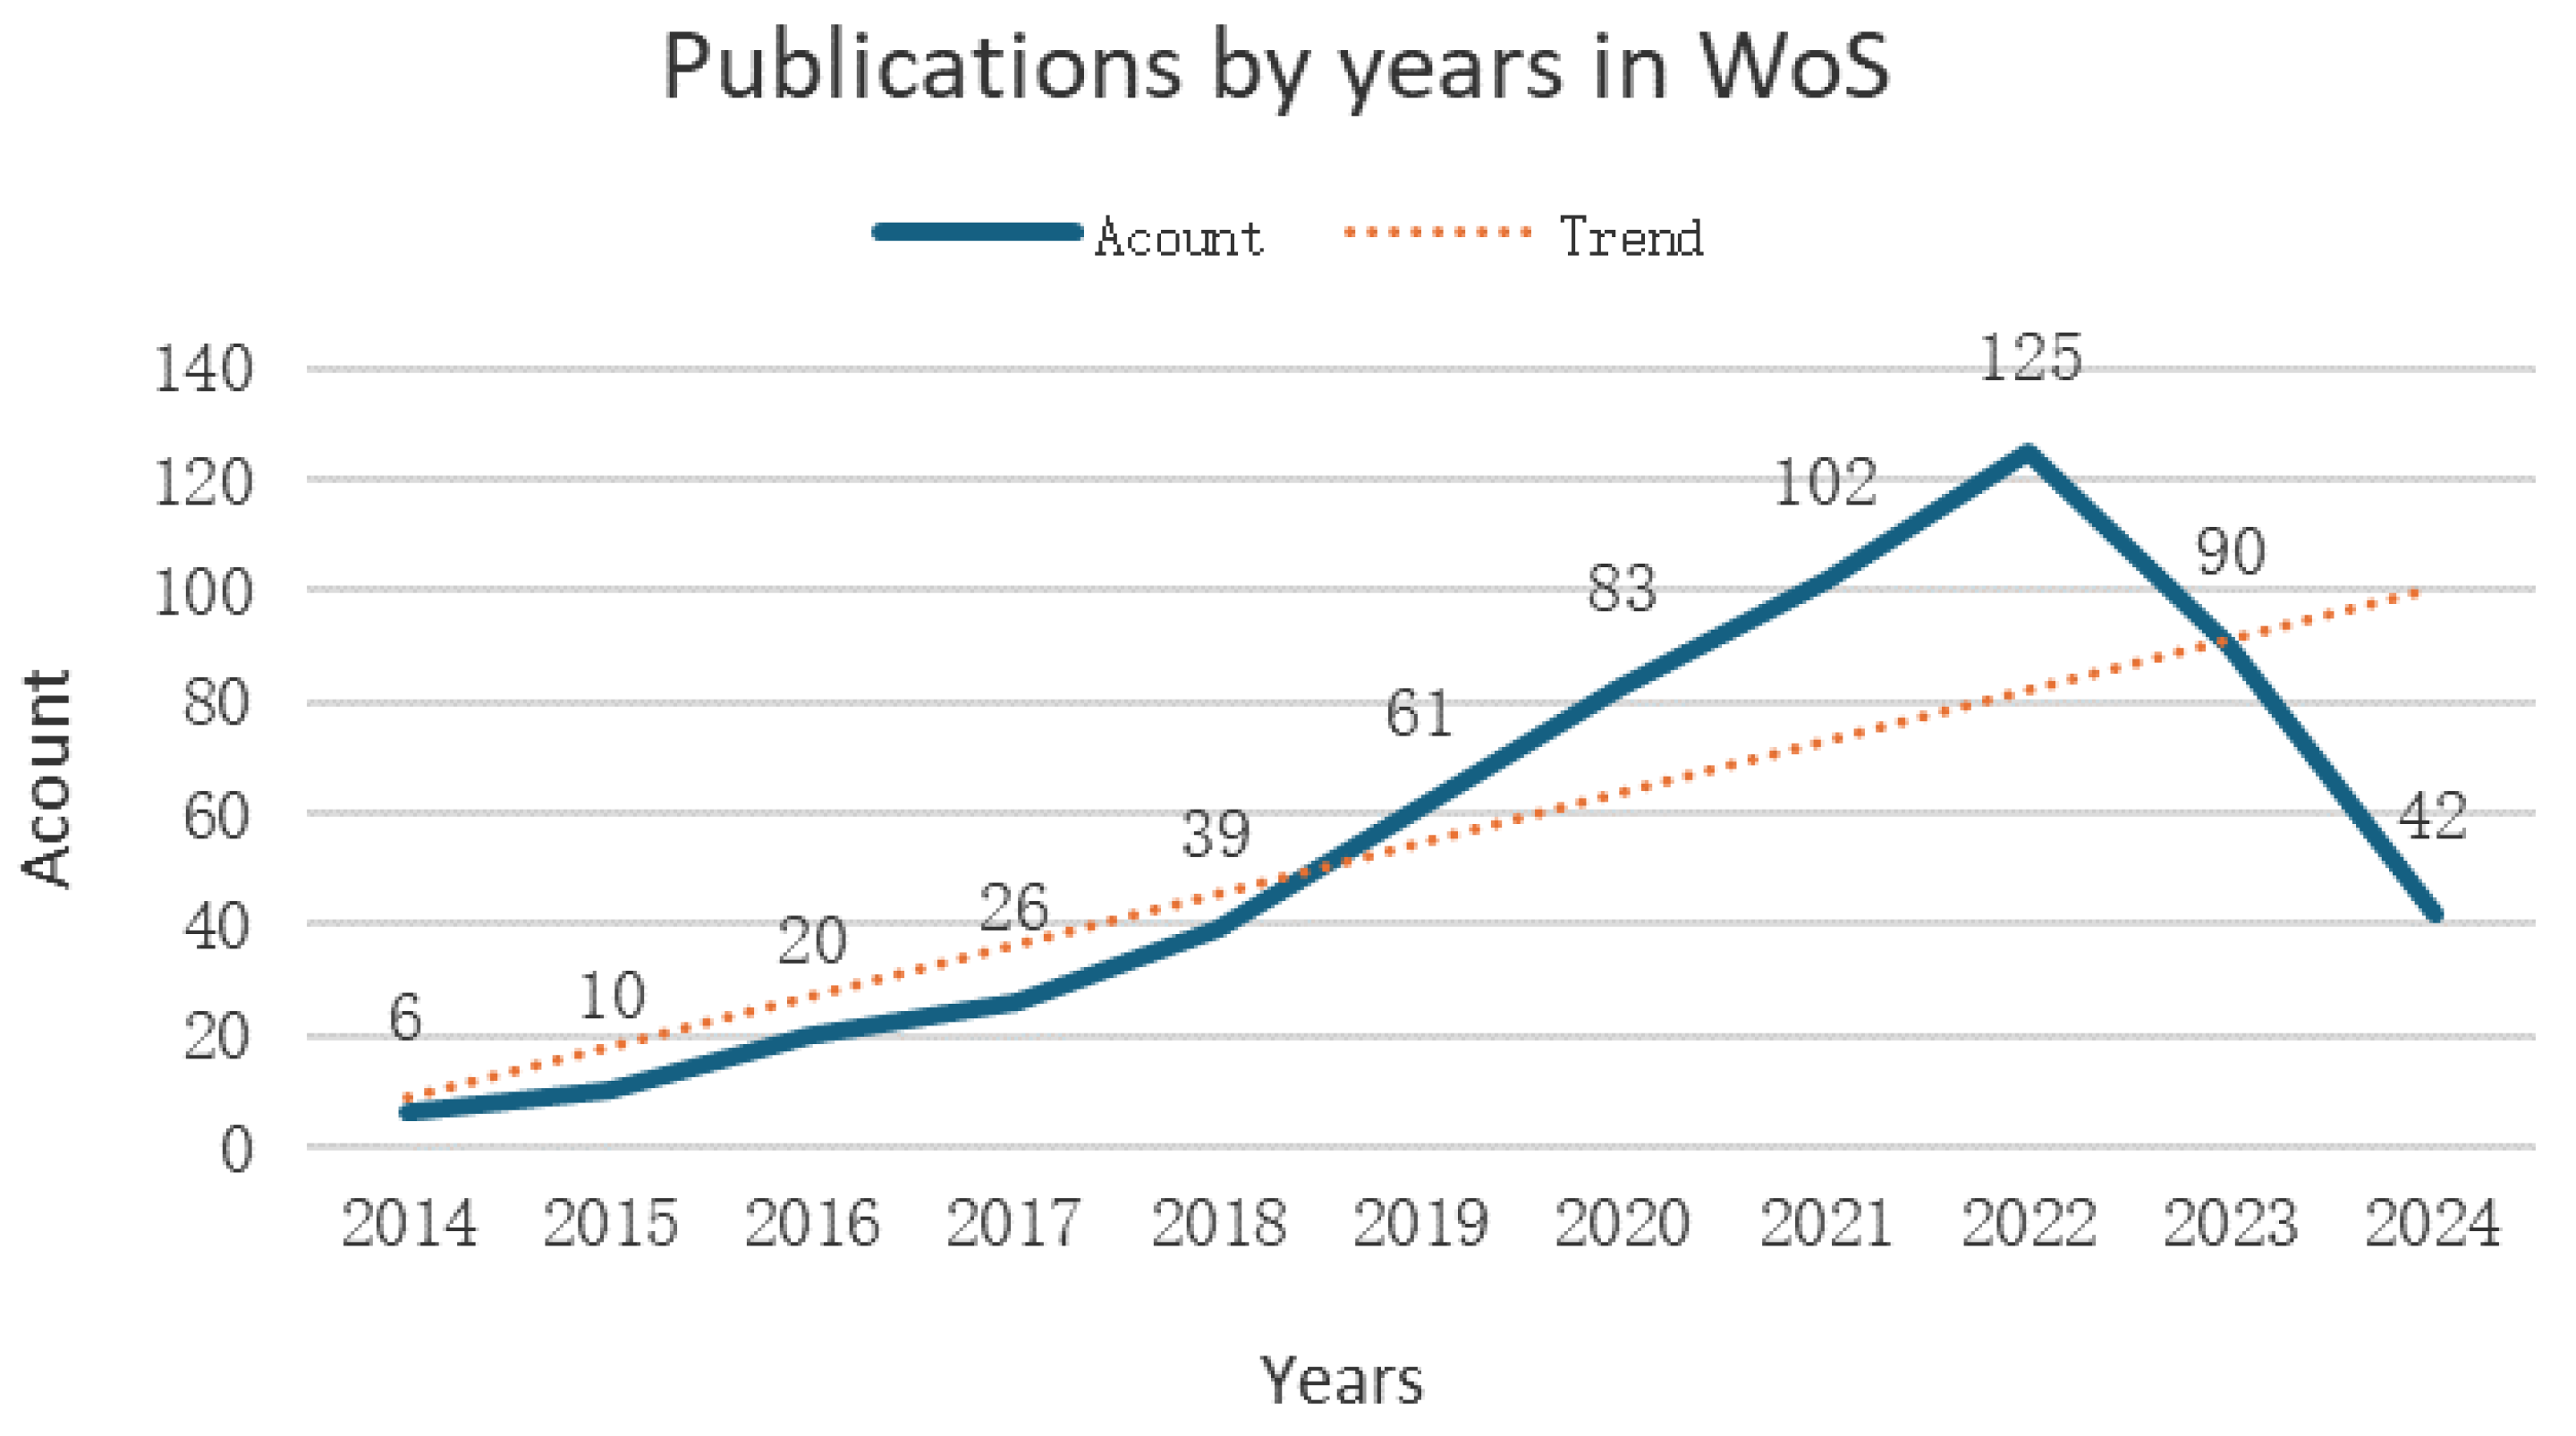
Over the past decade, the number of publications related to GI and Air Pollution shows a notable trend, as depicted in Figure 2. In 2022, there were 125 related publications. Although there was a slight decrease in 2023, this decline may be attributed to the impact of COVID-19. The steady upward trend line indicates increasing attention from researchers in this field (Figure 2).
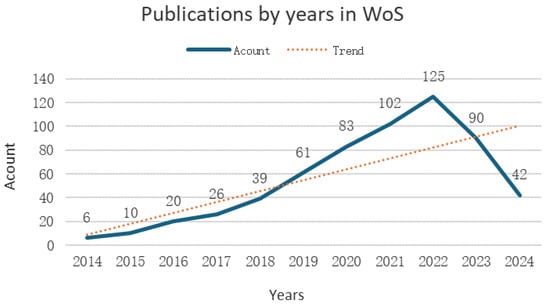
Figure 2.
Publications by years in WoS.
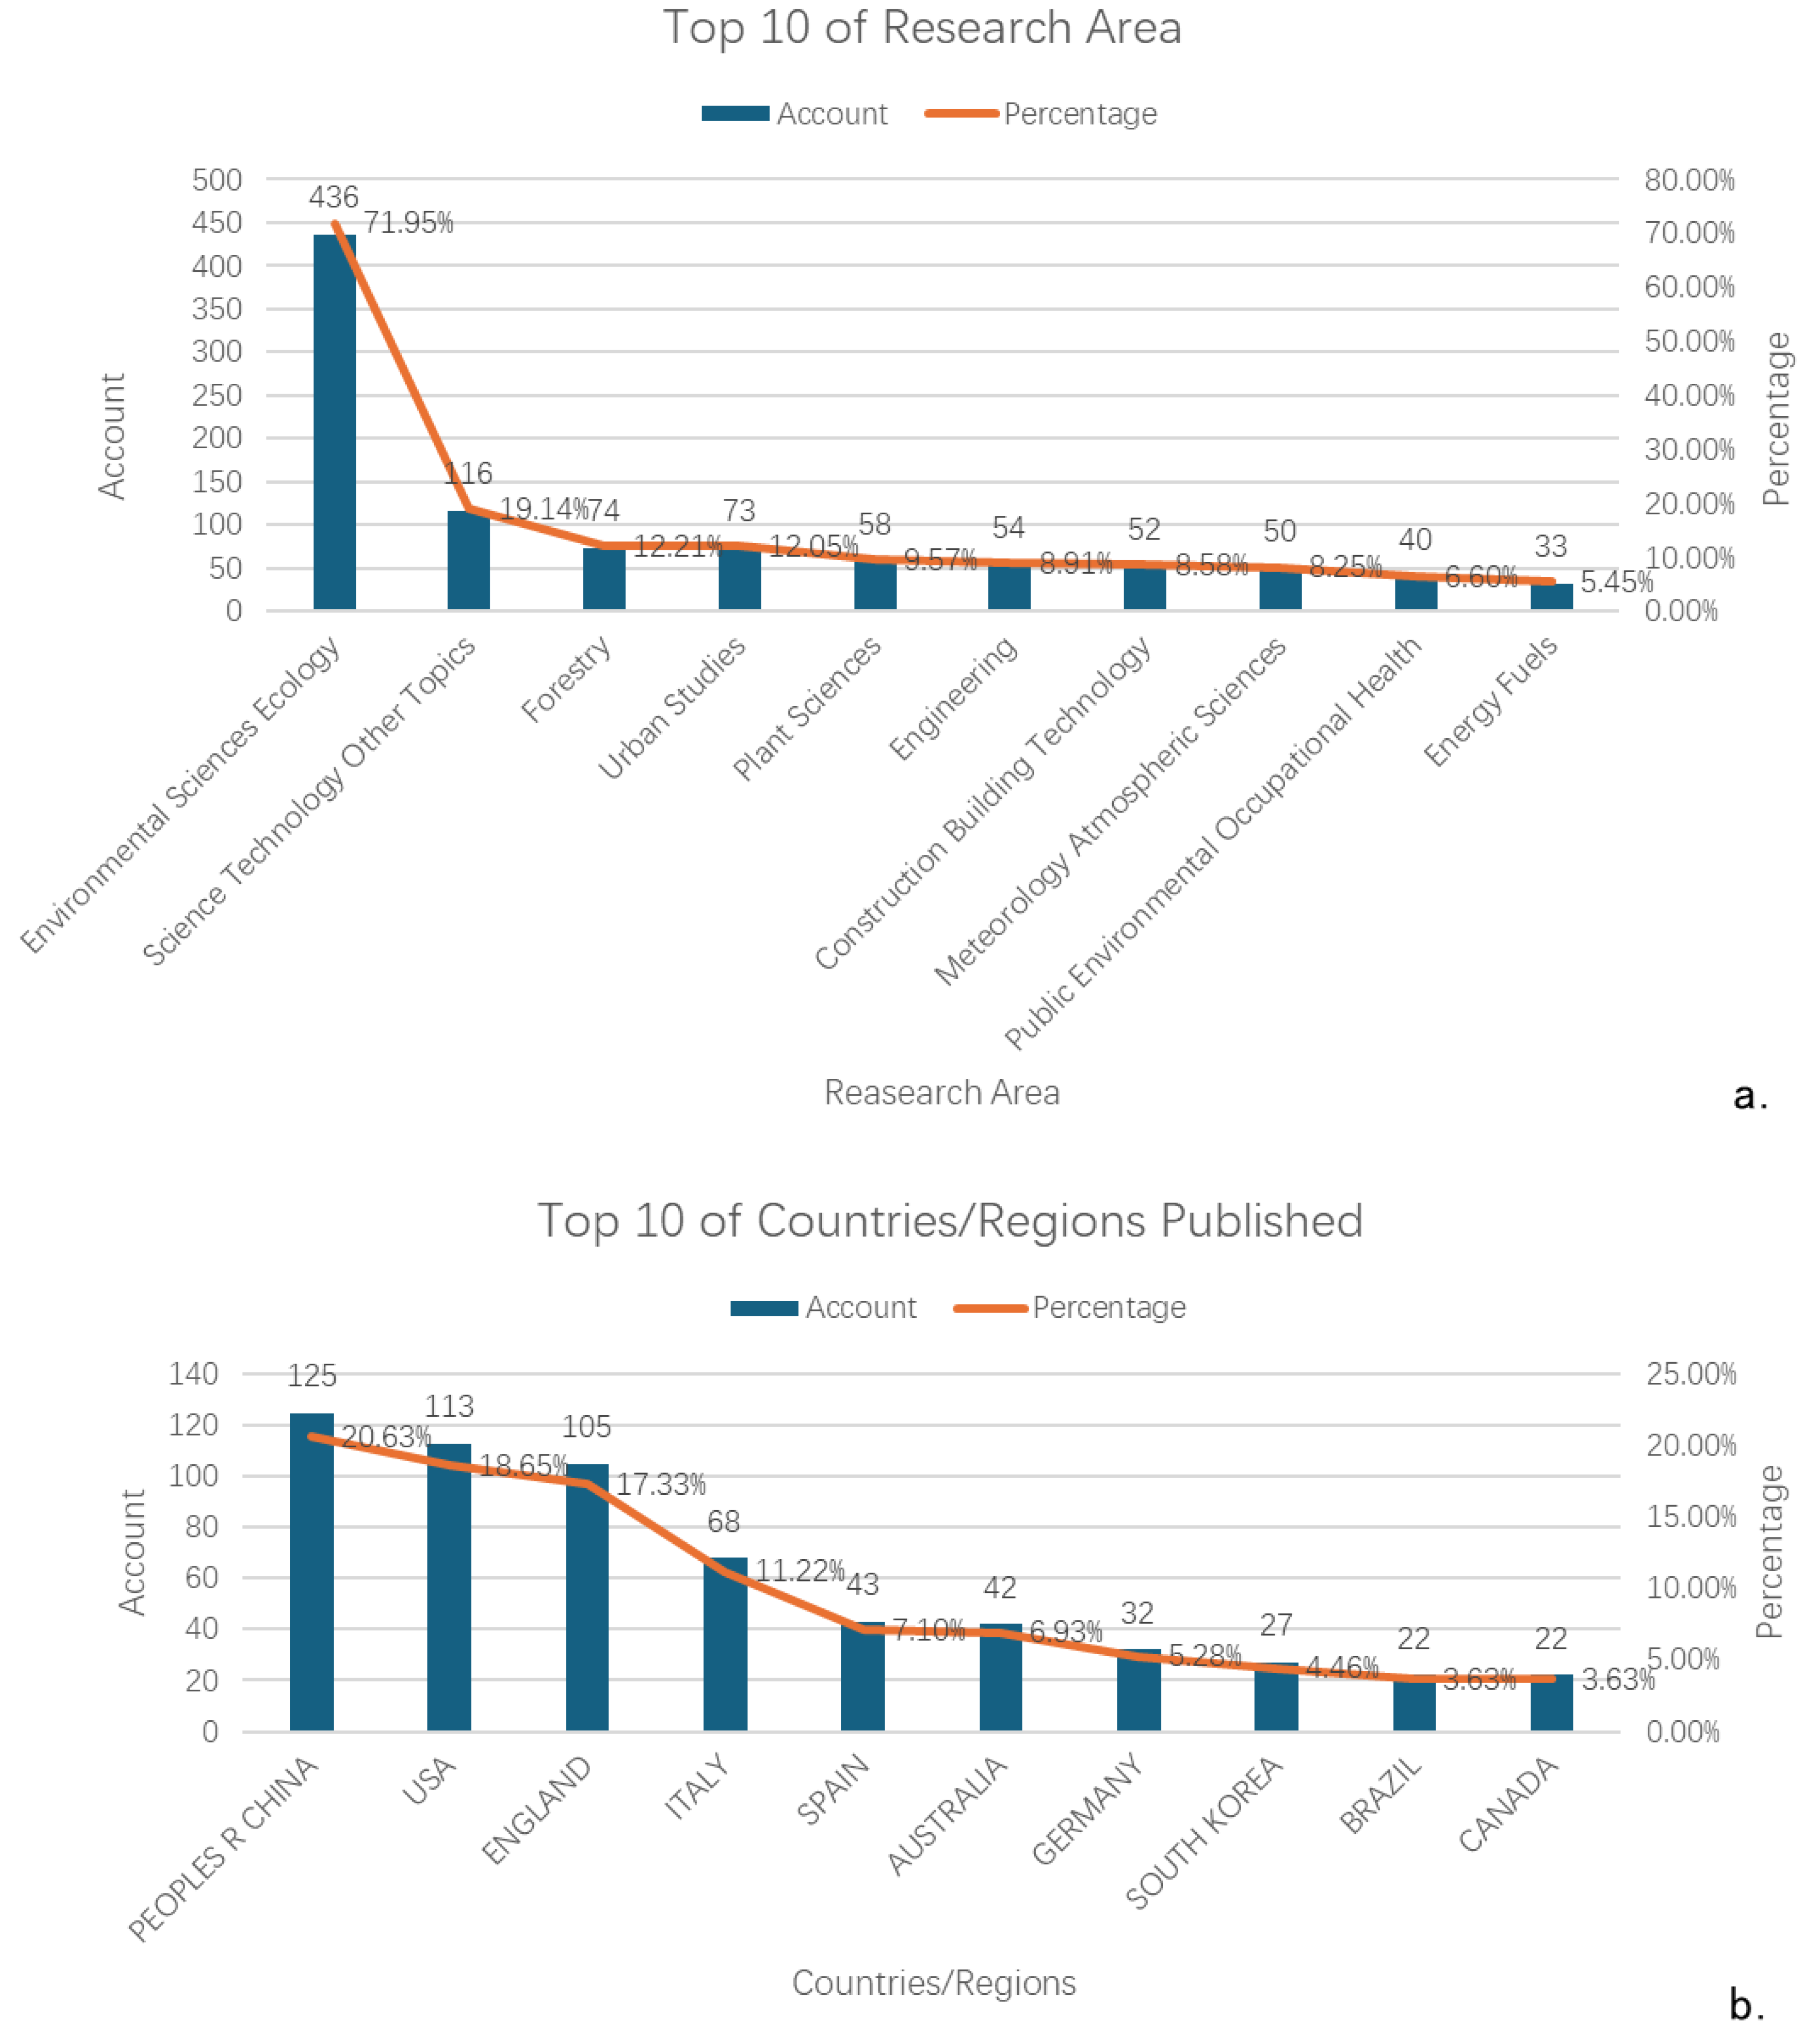
Analyzing the distribution across research fields, the top three are: “Environmental Sciences Ecology” (71.95%), “Science Technology Other Topics” (19.14%), and “Forestry” (12.21%). In terms of author affiliations by country, the top three are China (20.63%), the USA (18.65%), and England (17.33%) (Figure 3).
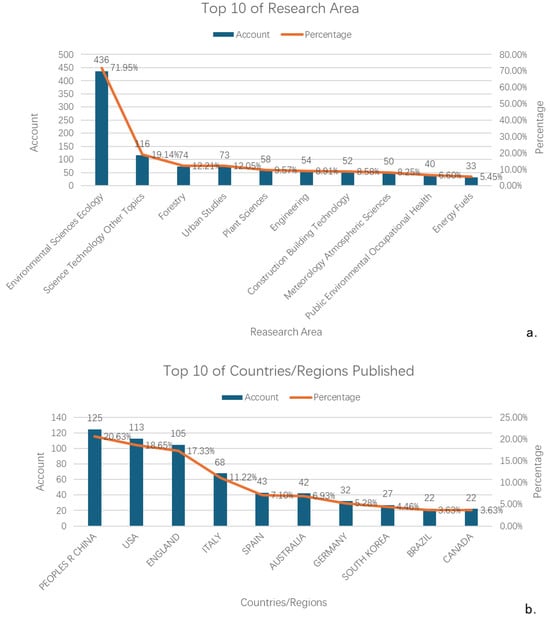
Figure 3.
(a) Top 10 Research areas and (b) Top 10 Countries/Regions published.
We analyzed the research field using CiteSpace [21]. Current studies on the impact of GI on air pollution can be broadly categorized into several aspects: (a) Green Plants and Ecology [22,23,24,25,26], focusing on plant species, growth habits, and their roles in ecosystems; (b) Sustainable Development and Communities [11,27,28,29], addressing how to establish and maintain environmentally friendly and resource-efficient urban communities; (c) Drone Technology and Applications [30,31,32,33], utilizing drones for environmental monitoring and data collection, including wind measurements and thermal data; (d) Green Technology and Urban Planning [12,34,35,36,37], improving urban environments, conserving energy, and beautifying cities through planting initiatives; (e) Spatial and Temporal Data Analysis [38,39,40,41], using Geographic Information Systems (GIS) or other technologies to analyze data changes over time and space; (f) Public Health and Safety [42,43,44]: examining the impact of GI on human health.
Research highly relevant to this study primarily focuses on the theme “Spatial and Temporal Data Analysis”. Further analysis of relevant literature on this theme reveals the following contributions: Martinez and Labib [45] studied the sensitivity of NDVI to different vegetation types, finding that the relationship between NDVI and individual vegetation types mostly follows a nonlinear trend. Gruwald et al. [46] evaluated the impact of vegetation such as trees, hedges, and green roofs on pollutant concentrations in various urban environments. Karteris et al. [37] investigated the potential benefits of green roofs in Thessaloniki, Greece, using high-resolution satellite imagery and GIS to assess their coverage area and effects on carbon sequestration, rainwater retention, and energy savings. Tella and Balogun [38] conducted a spatial hazard assessment of the Air Quality Index (AQI) in Selangor, Malaysia, using four machine learning models, highlighting XGBoost and random forest models for their high accuracy and precision. Tran et al. [47] discussed GI as a sustainable complement to traditional stormwater infrastructure, proposing the GI Spatial and Feature (GIST) model to optimize GI spatial selection and plant characteristics for maximizing multifunctionality. Zhou et al. [39] identified statistical regularities between PM2.5 concentrations and adsorption capacities of representative trees through field sampling and measurements, simulating the impact of different afforestation schemes on PM2.5 concentrations using GIS, and proposing greening distribution strategies. Li et al. [48] estimated the annual PM2.5 removal capacity of Urban Green Infrastructure (UGI) in Shenyang, China, from 2000 to 2019 using a PM2.5 dry deposition model, detected spatial heterogeneity of annual PM2.5 removal capacity through Sen-MK test and local spatial autocorrelation analysis, and explored the influence of landscape patterns and socio-economic variables on PM2.5 removal capacity using linear regression models.
Despite the comprehensive analyses from various perspectives on the impact of GI on air pollution, there remains a significant gap in quantitative studies of air pollution. This study aims to address this gap by conducting a systematic quantitative analysis to explore the specific extent of GI’s impact on air pollution.
2. Research Method
This study aims to systematically quantify and explore the specific impact of GI on air pollution. The research will employ remote sensing technology to acquire high-precision NDVI data for accurately calculating the coverage area of GI. Subsequently, multiple regression analysis models will be utilized to quantify the extent of GI’s impact on major air pollutants, including NO2, O3, CO, and PM10. The study will focus on the cities of Ulsan and Gunpo in South Korea as case studies to verify the hypothesis that increasing the GI area can improve air pollution. Furthermore, the research includes an analysis of the population and the number of different types of residential buildings to understand their influence on air pollution, using data obtained from government sources. By measuring the GI area in the two case cities, and collecting data on total population, different types of residential buildings, and air quality, the study aims to validate the significance of the data through statistical models and analyze their correlations.
Through this systematic quantitative analysis, the study not only aims to provide specific numerical evaluations of GI’s impact on air pollution but also intends to reveal underlying mechanisms and pathways. This research will contribute quantitative scientific evidence for urban planning and environmental management.
This study selects Ulsan City as one of its cases, which is the most representative industrial city in South Korea. Due to the presence of numerous industrial enterprises, Ulsan typically faces higher levels of air pollution. The concentrations of pollutants are high and vary significantly, making it conducive for studying the mitigation effects of GI under different pollution levels. Moreover, industrial cities like Ulsan are usually equipped with a substantial number of environmental monitoring stations, which provide high-resolution and high-frequency air quality data. On the other hand, Gunpo City, another chosen case, represents one of the first new city developments adjacent to industrial areas and major transportation routes in Gyeonggi Province near Seoul. This proximity to industrial emissions and traffic pollution makes Gunpo City also representative in terms of pollution characteristics. However, the number of air pollution measurement stations within the study area is inadequate. Additionally, South Korea’s air quality data collection is point-based and often dispersed, making it challenging to precisely locate their distribution. Therefore, for measuring air pollution data, this study supplements the data from observation stations in nearby cities and employs methods like Kriging interpolation to comprehensively analyze the data. When choosing an interpolation method, although the Inverse Distance Weighting (IDW) method is easier to implement and understand, it assumes that points closer in proximity are more similar than those further away. This assumption can lead to suboptimal results when data points are sparse or unevenly distributed. Therefore, in air quality assessments, Kriging is often preferred over IDW because air quality monitoring stations are typically not evenly distributed, and the measured variables are influenced by more than just proximity. Kriging considers spatial correlation, allowing it to better capture underlying trends in the data and provide more reliable predictions in areas with fewer monitoring stations. These approaches ensure a thorough examination of the effects of GI on air pollution in both Ulsan and Gunpo, considering their respective industrial and developmental contexts and the complexities of air quality measurement in urban settings.
3. Analysis and Result
3.1. Measurement of Infrastructure Area and Analysis of Air Pollution Information in Ulsan City
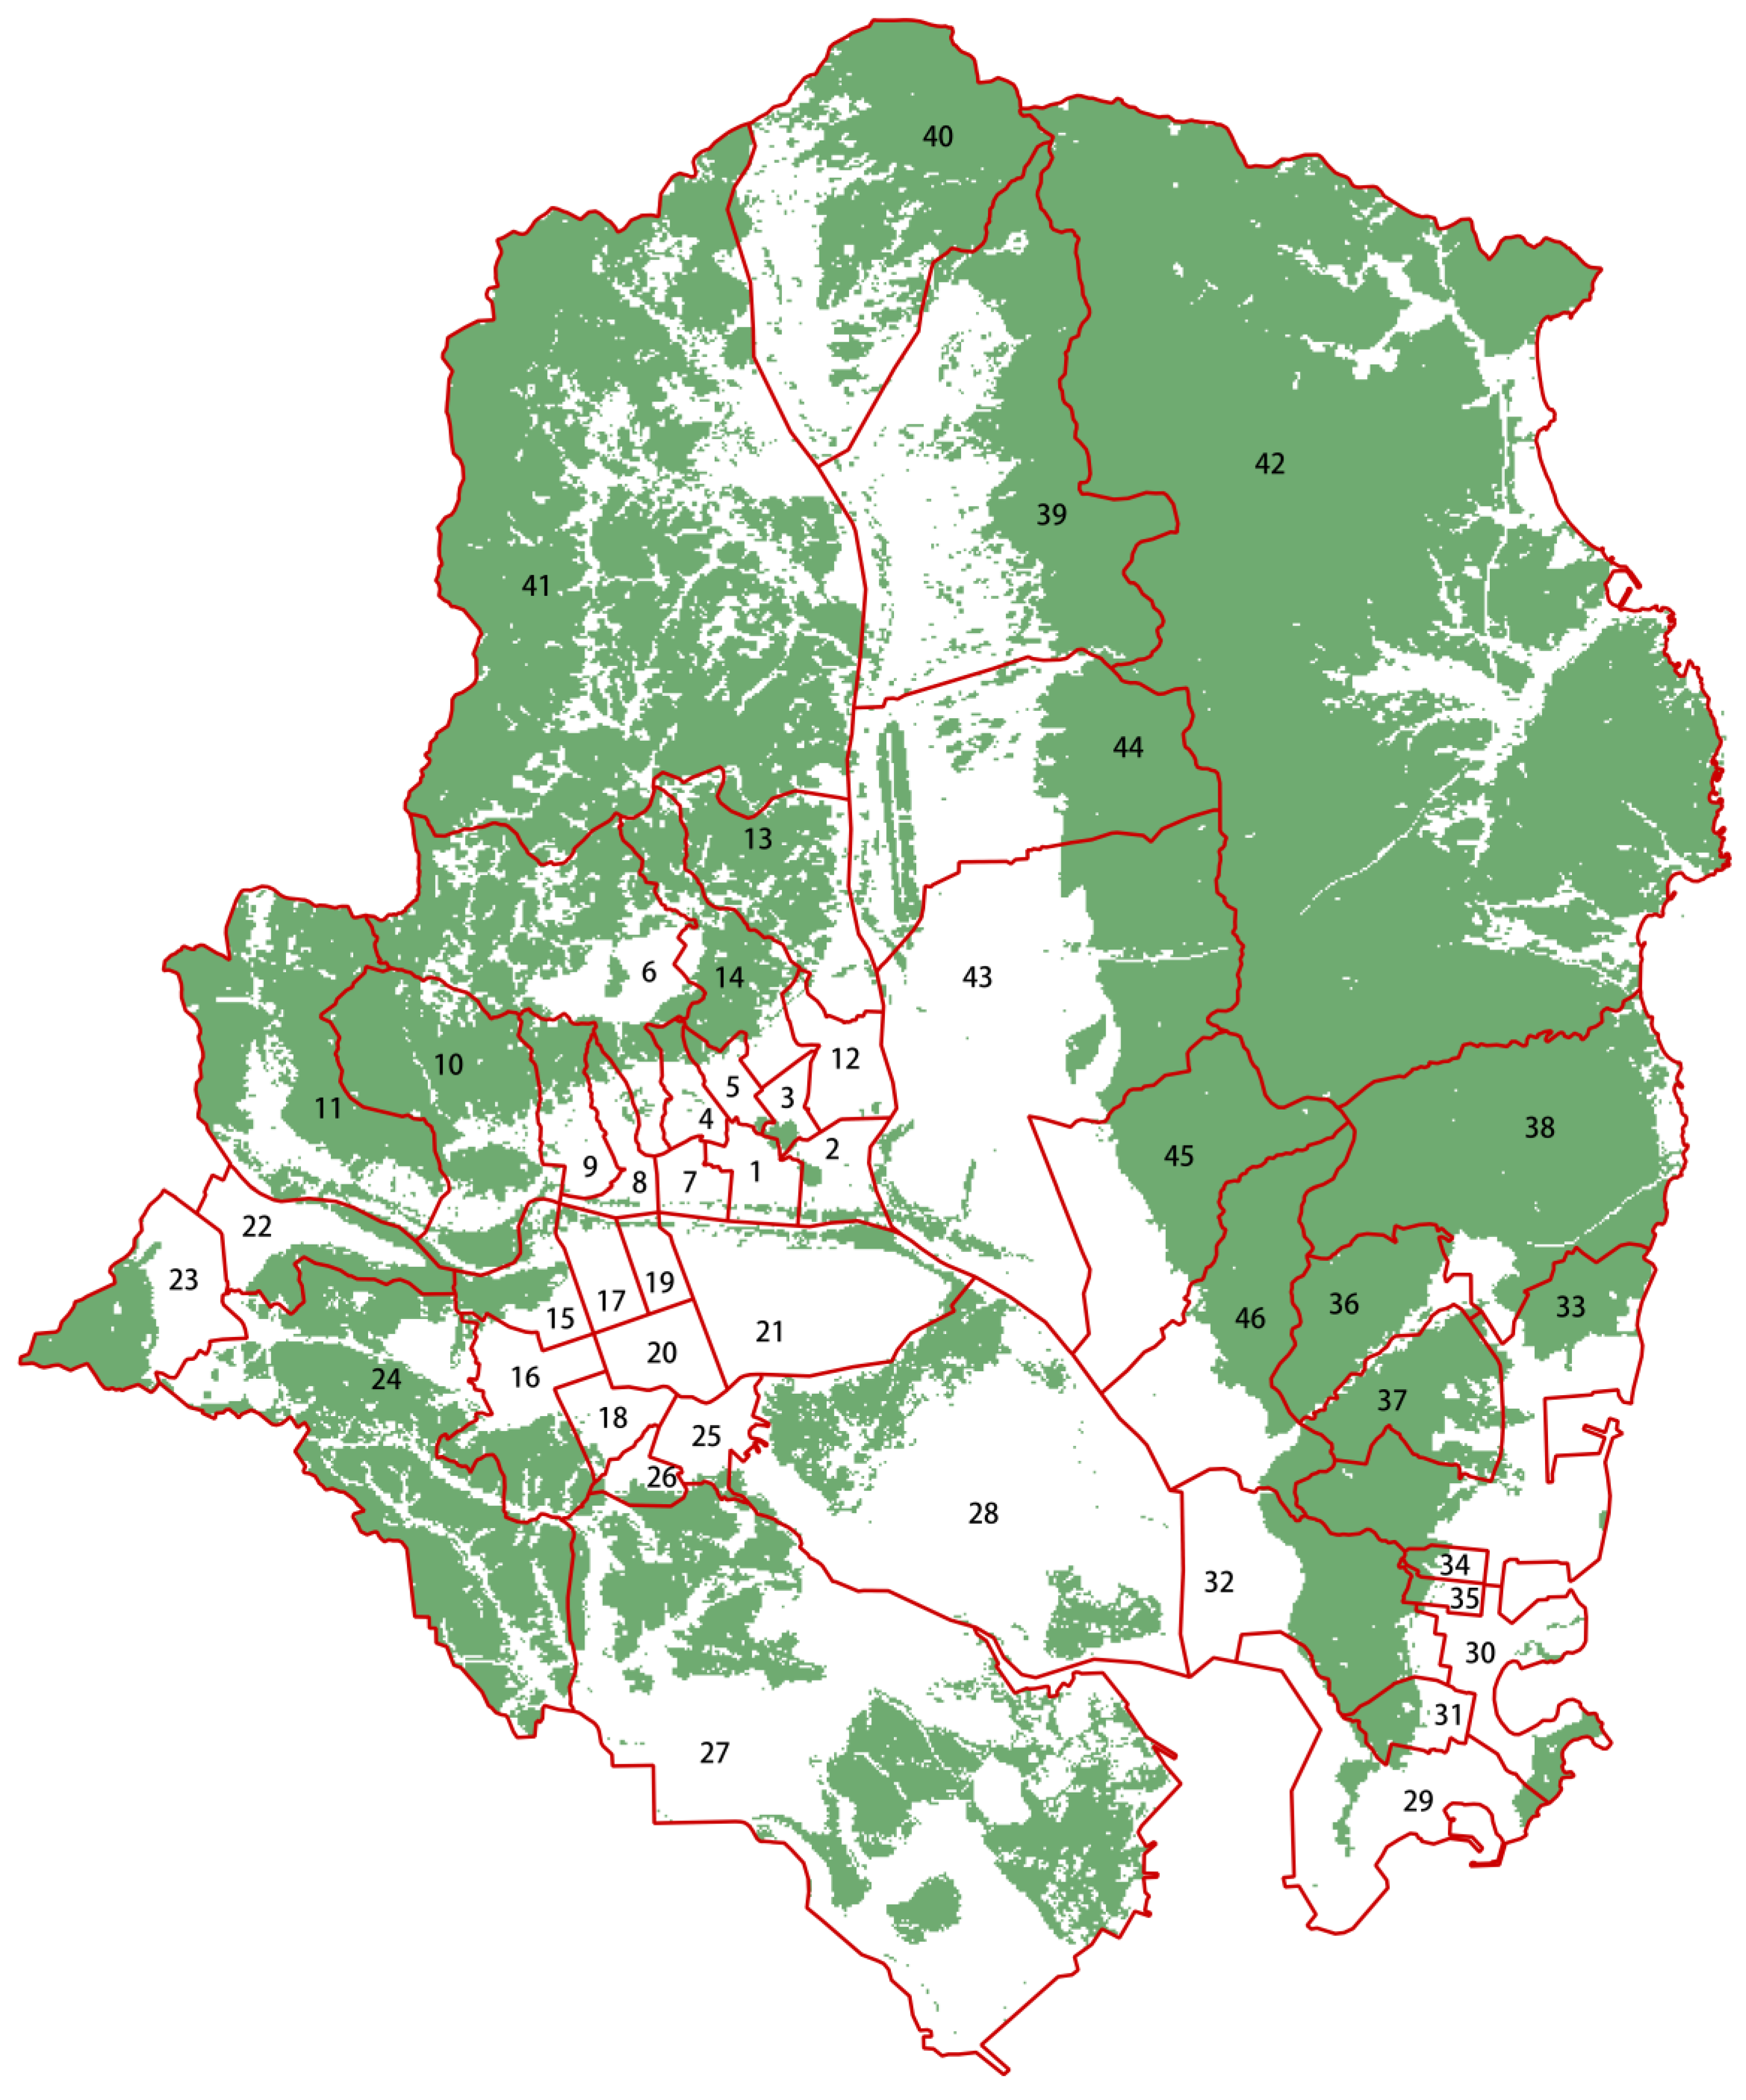
Ulsan City in South Korea is the most representative industrial city with a total area of 1062.33 square kilometers. Administrative divisions in South Korea are designated as “Dong”. The detailed GI area for each Dong was measured using the NDVI method. Population data, along with the number of separate houses, apartments, row houses, and multi-unit residences within the area, were collected from government sources (Table 2). Satellite maps illustrate that among all 46 administrative districts in the region, 12 Dongs have less than 20% GI coverage, while 11 Dongs have over 50% GI coverage (Figure 4). The GI area ranges from a minimum of 0.04 square kilometers to a maximum of 55.38 square kilometers, with a median value of 1.08 square kilometers. Gangdong-dong has the highest proportion of GI coverage (90.23%), whereas Sinjeong5-dong has the lowest (7.00%).
Table 2.
GI area distribution by district using high-resolution Arirang data analysis.
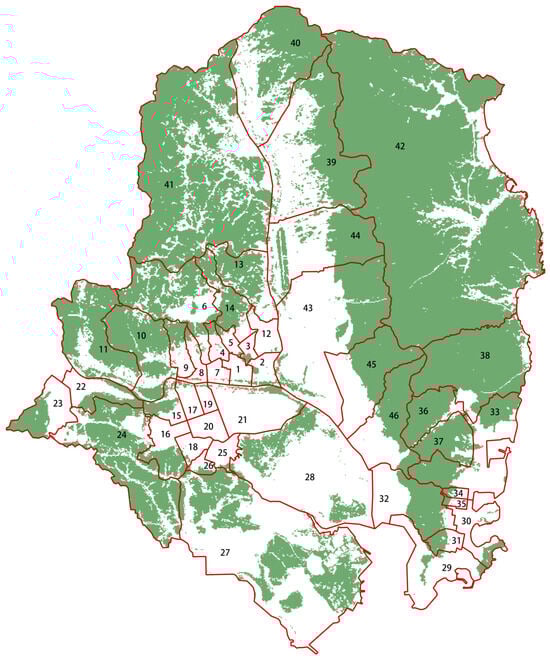
Figure 4.
GI area measurement in Ulsan, Korea.
3.1.1. Greenfield Infrastructure Area Analysis
Areas with higher GI coverage in the region, such as Gangdong-dong (90.23%), Nammok1-dong (84.94%), and Nammok3-dong (89.58%), typically have large land areas with lower population density. These areas may be emerging development zones or suburban areas with preserved natural landscapes, often featuring expansive open spaces and abundant vegetation. They not only provide better air quality but also enhance residents’ living environment by reducing temperatures and mitigating the urban heat island effect.
In contrast, areas with lower GI coverage, like Dal-dong (10.73%) and Sinjeong5-dong (7.00%), may be located in downtown or densely developed commercial districts with higher population density. These areas have limited GI, potentially leading to higher concentrations of pollutants in the air and posing greater health risks to residents.
3.1.2. Residential Type Analysis
- Single-family residence
Single-family residence typically refers to a standalone residential building designed for occupancy by a single family. This type of residence is usually occupied by one household, independent from other residences, without shared living spaces or facilities. Single-family homes are typically detached dwellings with their own entrance, yard, or garden, and residents are often either renters or owners. These homes often occupy larger land areas with lower building densities, resulting in relatively minimal environmental impact. In areas with high levels of GI such as Nongso1-dong (1252 units) and Gangdong-dong (1243 units), this low-density residential form combined with abundant green spaces may effectively reduce concentrations of air pollutants.
- b.
- Apartment
Apartments generally refer to high-rise buildings that can reach several tens of floors or even higher. High-rise buildings are typically constructed in urban or densely populated areas to optimize land use and accommodate residential, commercial, or business needs. Apartments are the most common type of housing in this area, particularly in densely populated regions such as Samsan-dong, which has 11,150 apartment units. Apartment buildings are often concentrated in city centers, and their high-density residential form implies a higher concentration of pollutants per unit area (such as vehicle exhaust and household emissions). However, these areas may also have better public transportation and environmental facilities, which partially mitigate the air pollution impacts associated with dense residential living.
- c.
- Townhouse and multi-unit residence
Townhouses, also known as “townhomes” or “city homes”, refer to a row of attached independent residential units typically found in urban or urbanized areas. These residences often have two or more floors and are physically connected to adjacent houses externally, while internally they are separate units. Each townhouse usually has its own entrance, interior space, and possibly a garage or parking space. Townhouses typically share one or two walls with neighboring units, allowing them to provide individual housing units in a limited space and have a higher residential density compared to traditional single-family residences.
Multi-unit residence refers to a building that contains multiple independent residential units or apartment units. These residential units can be distributed across the same floor or multiple floors within the building. Each unit typically has its own entrance and interior space, and the building height varies, falling between that of single-family residences and apartments.
Townhouses and multi-unit residences exhibit different distributions across various regions. Townhouses are more prevalent in Dal-dong (290 units), while in some areas like Boksan2-dong and Yaksa-dong, they are completely absent. This housing form lies between single-family residences and apartments, typically featuring higher residential density and relatively lower building heights, thus impacting air pollution to an extent between that of single-family residences and apartments. Multi-unit residences are most abundant in Samsan-dong (2296 units). These areas may be mixed-use residential zones, accommodating both high-density apartments and multi-unit residences suitable for families. Properly managed multi-unit residential areas can effectively reduce each household’s contribution to air pollution.
In general, urban planning in this region exhibits a high degree of diversity, with variations in green space coverage and types of residential areas directly influencing the state of air pollution. Areas with high green space coverage, such as Gangdong-dong and Nammok-dong, benefit from extensive vegetation cover that effectively mitigates air pollution, thereby enhancing local environmental quality and residents’ quality of life. Conversely, areas with low green space coverage and high residential density, such as Dal-dong and Samsan-dong, face greater pressure from air pollution due to insufficient greenery and high population density. However, these areas may also implement efficient public transportation and environmental measures to partially alleviate pollution issues.
3.1.3. Analysis of Air Pollutants
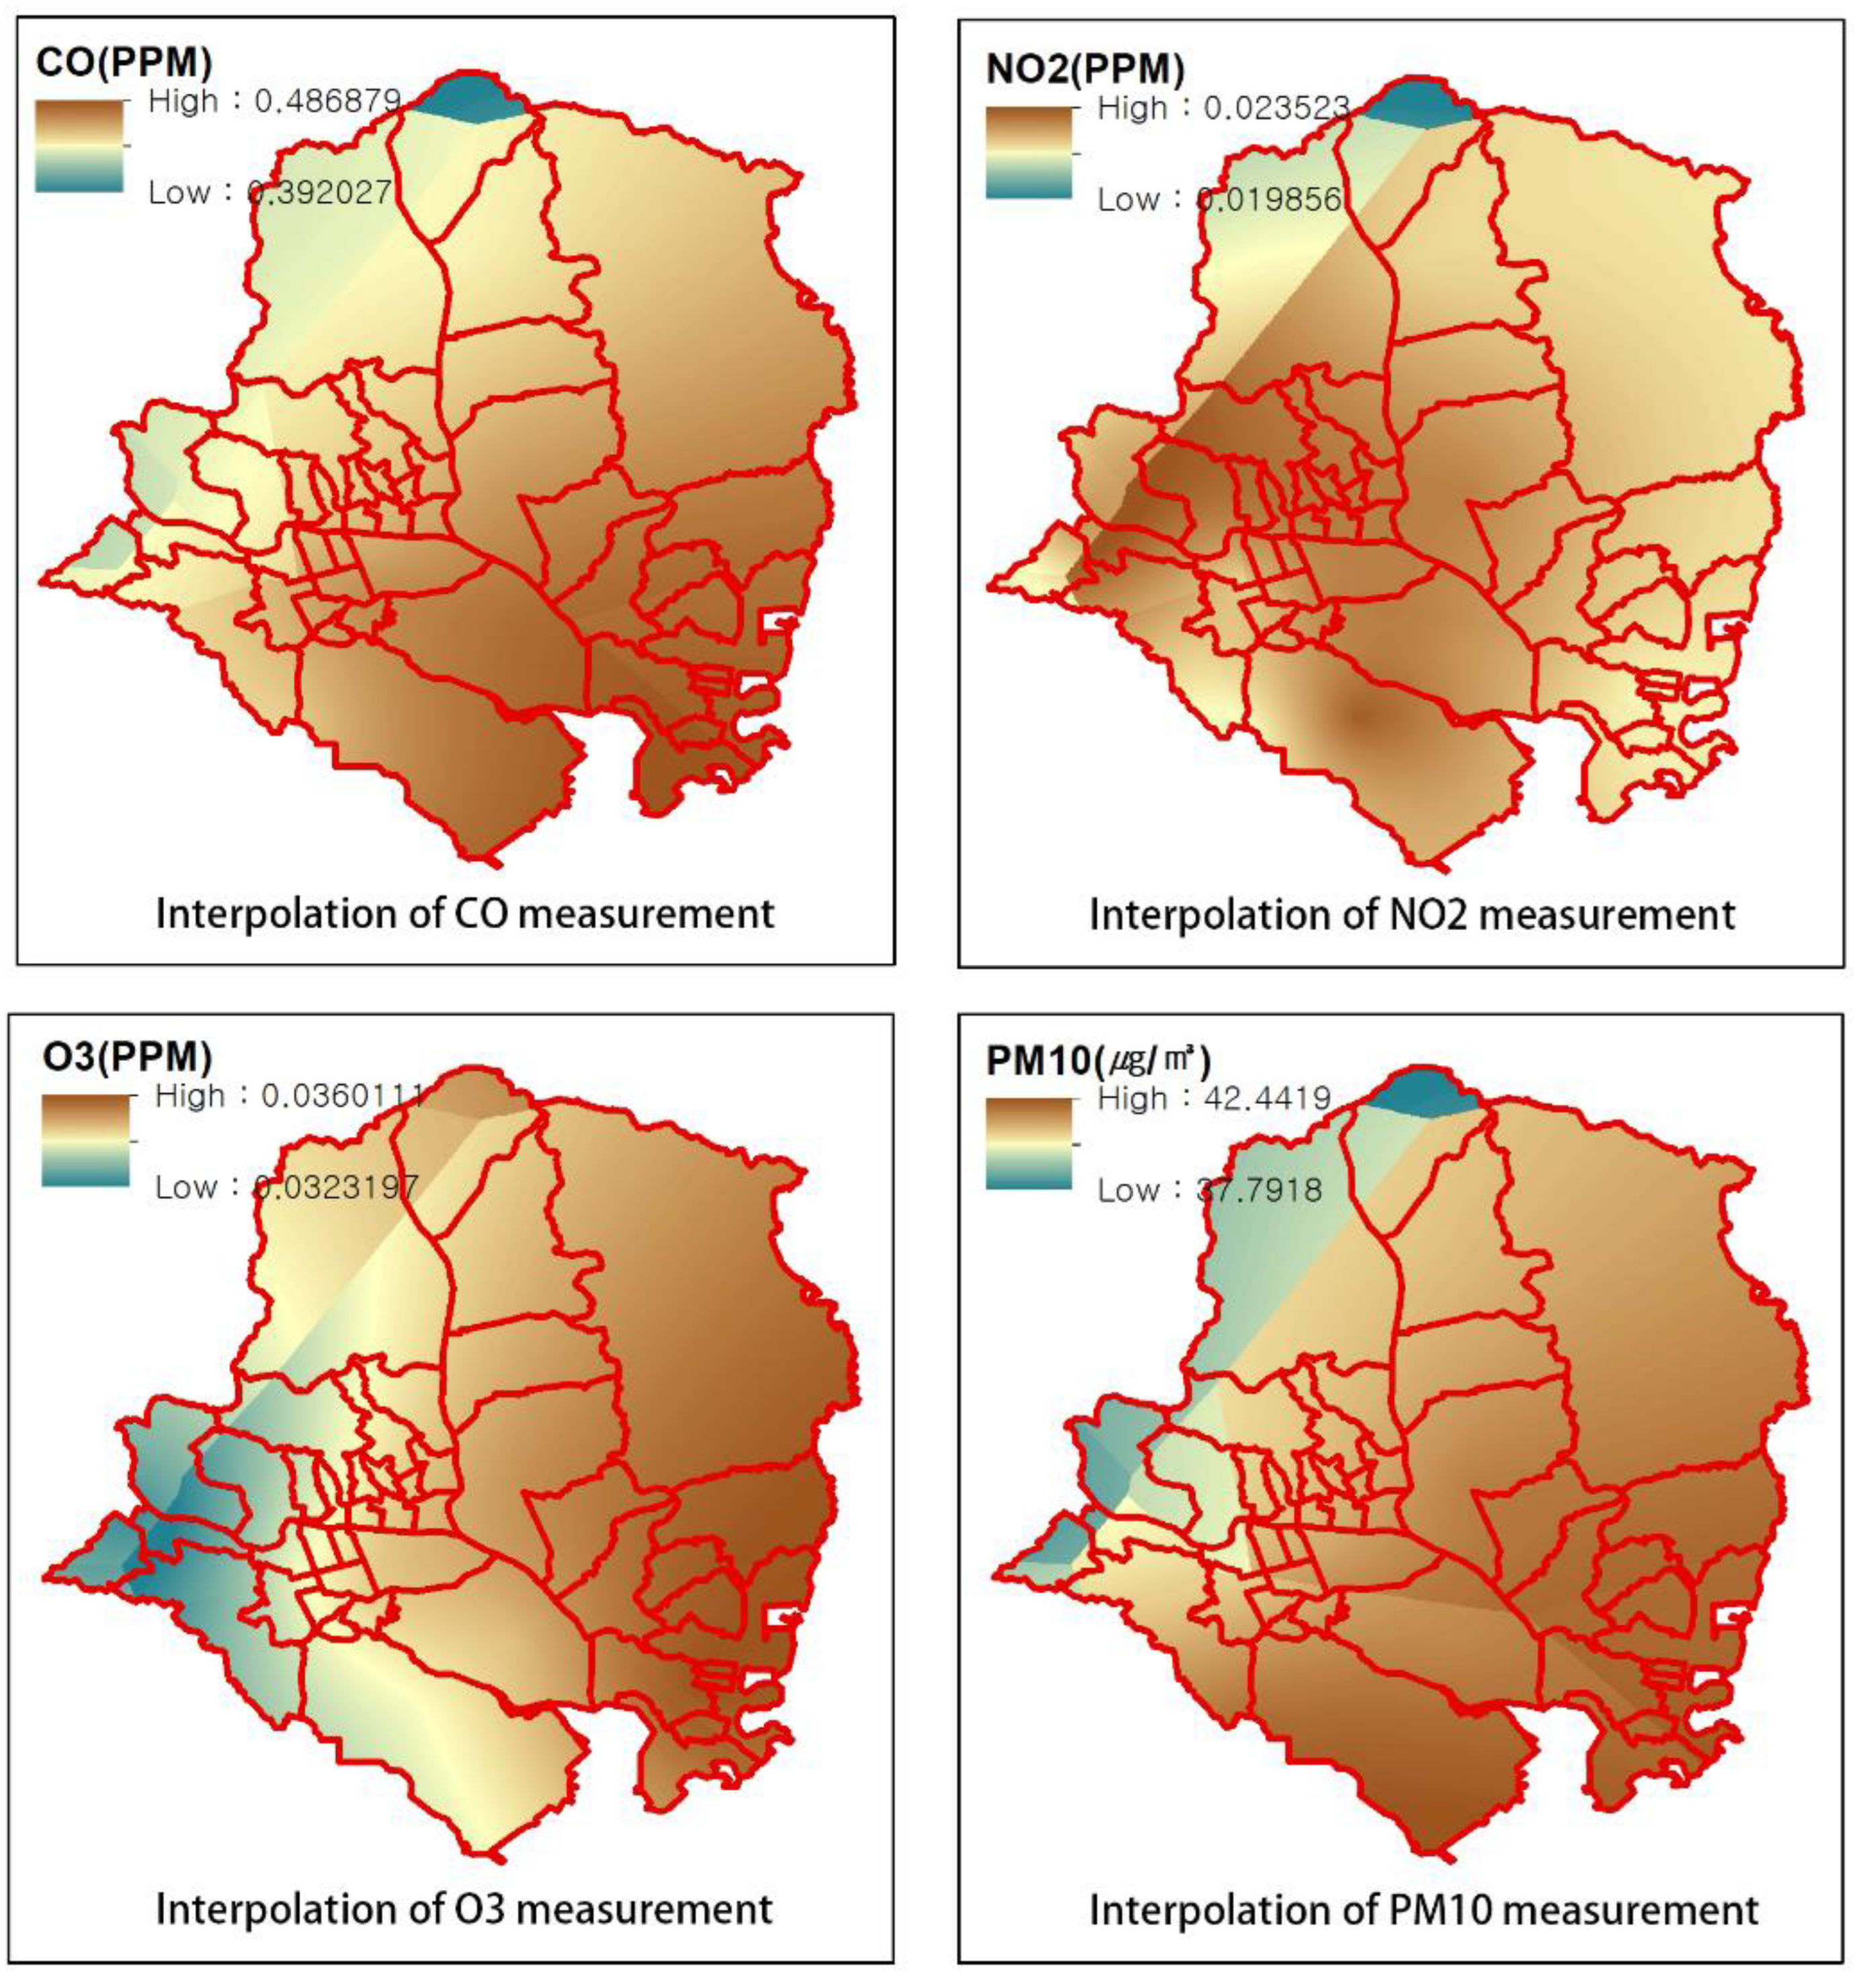
In measuring atmospheric pollution data, due to the limited number of 14 measurement stations within Ulsan City, we expanded our assessment of the region’s atmospheric pollution levels by incorporating data from an additional 6 measurement stations surrounding Ulsan City (Table 3), Pollutant measurements are in ppm at the multiannual level. Subsequently, we utilized kriging interpolation to calculate values across the entire region (Figure 5).
Table 3.
Measurement stations information for air quality in Ulsan City.
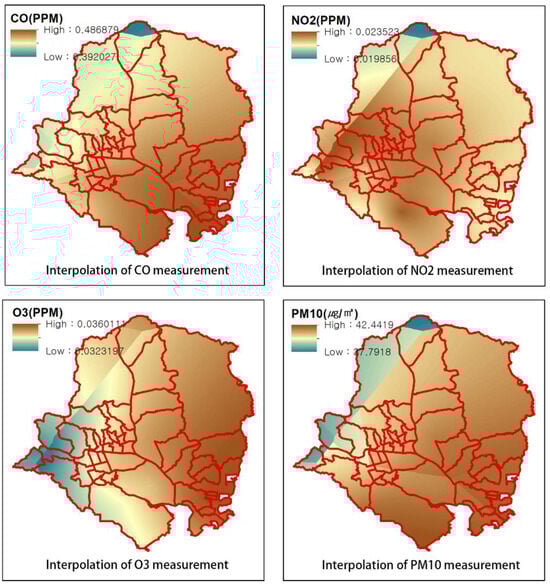
Figure 5.
Air Quality Pollution Information for Ulsan City, Korea.
Overall, there are significant regional differences in the impact of GI and residential types on atmospheric pollution in the studied area. Regions with high green coverage rates, such as Gangdong-dong and Nammok-dong, show lower pollutant concentrations, indicating that abundant vegetation cover helps reduce air pollution. In contrast, areas with low green coverage and high-density housing, like Dal-dong and Samsan-dong, face greater air pollution pressures, especially with higher concentrations of CO and NO2.
Carbon monoxide (CO), primarily from vehicle exhaust and industrial emissions, is a major component of urban air pollution. As depicted in Figure 5, CO concentrations are unevenly distributed across the region, primarily concentrated in densely populated areas in the central and southern parts. These areas, characterized by high population density and low GI coverage, such as Samsan-dong and Sinjeong2-dong, experience heavy traffic flow and significant emissions. Additionally, regions densely populated with apartments and multi-unit residences contribute to higher CO emissions.
Nitrogen dioxide (NO2), emitted mainly from vehicle and industrial combustion processes, is harmful to the respiratory system. Figure 5 shows that the highest NO2 concentrations are concentrated in downtown areas and near major traffic arteries. For instance, areas like Dal-dong and Bangeo-dong experience severe traffic congestion and thus higher NO2 levels. Furthermore, the western and southern parts, where industrial activities are more prevalent, also exhibit elevated NO2 concentrations.
Ozone (O3), primarily a secondary pollutant from photochemical reactions, is distributed in higher concentrations in the central and eastern parts, as shown in Figure 5. These areas have lower GI coverage, limiting their ability to regulate temperature and reduce O3 concentrations effectively.
PM10 refers to particulate matter in the atmosphere, posing various health hazards. The interpolation map indicates that regions with higher PM10 concentrations are mainly concentrated in the eastern and southern parts of the studied area. These areas have lower GI coverage and higher building density, likely due to frequent construction activities and heavy traffic flow, as seen in Mugeo-dong and Jeonha1-dong. Insufficient vegetation in these areas results in ineffective deposition and filtration of PM10 particles.
3.2. Measurement of Infrastructure Area and Analysis of Air Pollution Information in Junpo City
This study also includes another city, Gunpo, South Korea, which spans an area of 36.42 square kilometers and comprises 11 administrative districts. As one of the first new cities developed near Seoul, Gunpo is located adjacent to industrial zones and major transportation routes in Gyeonggi Province. This positioning makes Gunpo representative in terms of industrial emissions and traffic pollution.
In recent years, Gunpo has focused on urban greening initiatives, incorporating various types of GI such as urban parks, green corridors, rooftop gardens, and riverbank greening zones. These diverse GI elements provide an ideal experimental site for studying the specific effects of different types of GI on mitigating air pollution. The urban development in Gunpo is mainly concentrated in the northeast, expanding gradually towards the southwest (Figure 6).
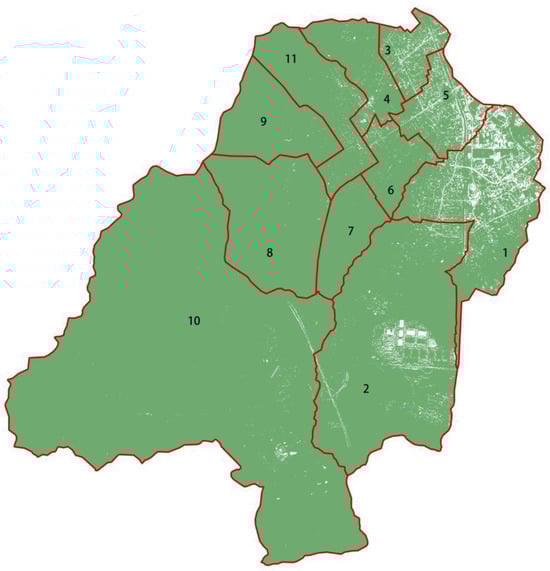
Figure 6.
GI Area measurement in Gunpo, Korea.
From satellite imagery, it is evident that the GI coverage in this region is substantial, with GI areas in the central administrative districts of the city all exceeding 80%. Due to extensive vegetation cover, these areas are expected to demonstrate significant effects in purifying air quality. During the statistical analysis and modeling process, data from areas with high GI coverage can be utilized to validate and optimize air quality models. The detailed data and noticeable effects in these regions can enhance the accuracy and predictive capability of the models, providing reliable references for applications in other areas.
Using the Normalized Difference Vegetation Index (NDVI) method, we measured the detailed GI coverage in each region. Additionally, government data provided information on the population, and number of single-family residences, apartments, townhouses, and multi-unit residences within this area (Table 4).
Table 4.
GI Area, population, and number of residences in Gunpo, Korea.
3.2.1. GI, Population and Dwelling Type Analysis
Overall, Gunpo City has a generally high coverage of GI across its entirety. The area with the highest GI coverage is Ogeum-dong, reaching 99.92%, characterized primarily by high-rise apartment buildings with low residential density. Even in Gunpo1-dong, which has the highest residential density, GI coverage still reaches 81.60%. Typically, high-density residential areas may face greater air pollution pressures, but a high proportion of green space can mitigate these effects. Areas with a larger number of single-family and multi-unit residences (such as Gunpo1-dong and Geumjeong-dong) exhibit high residential density despite not having a high population density. Notably, Gunpo2-dong, despite having the highest population density, maintains a significant amount of GI due to its large number of apartments.
3.2.2. Air Pollution Analysis
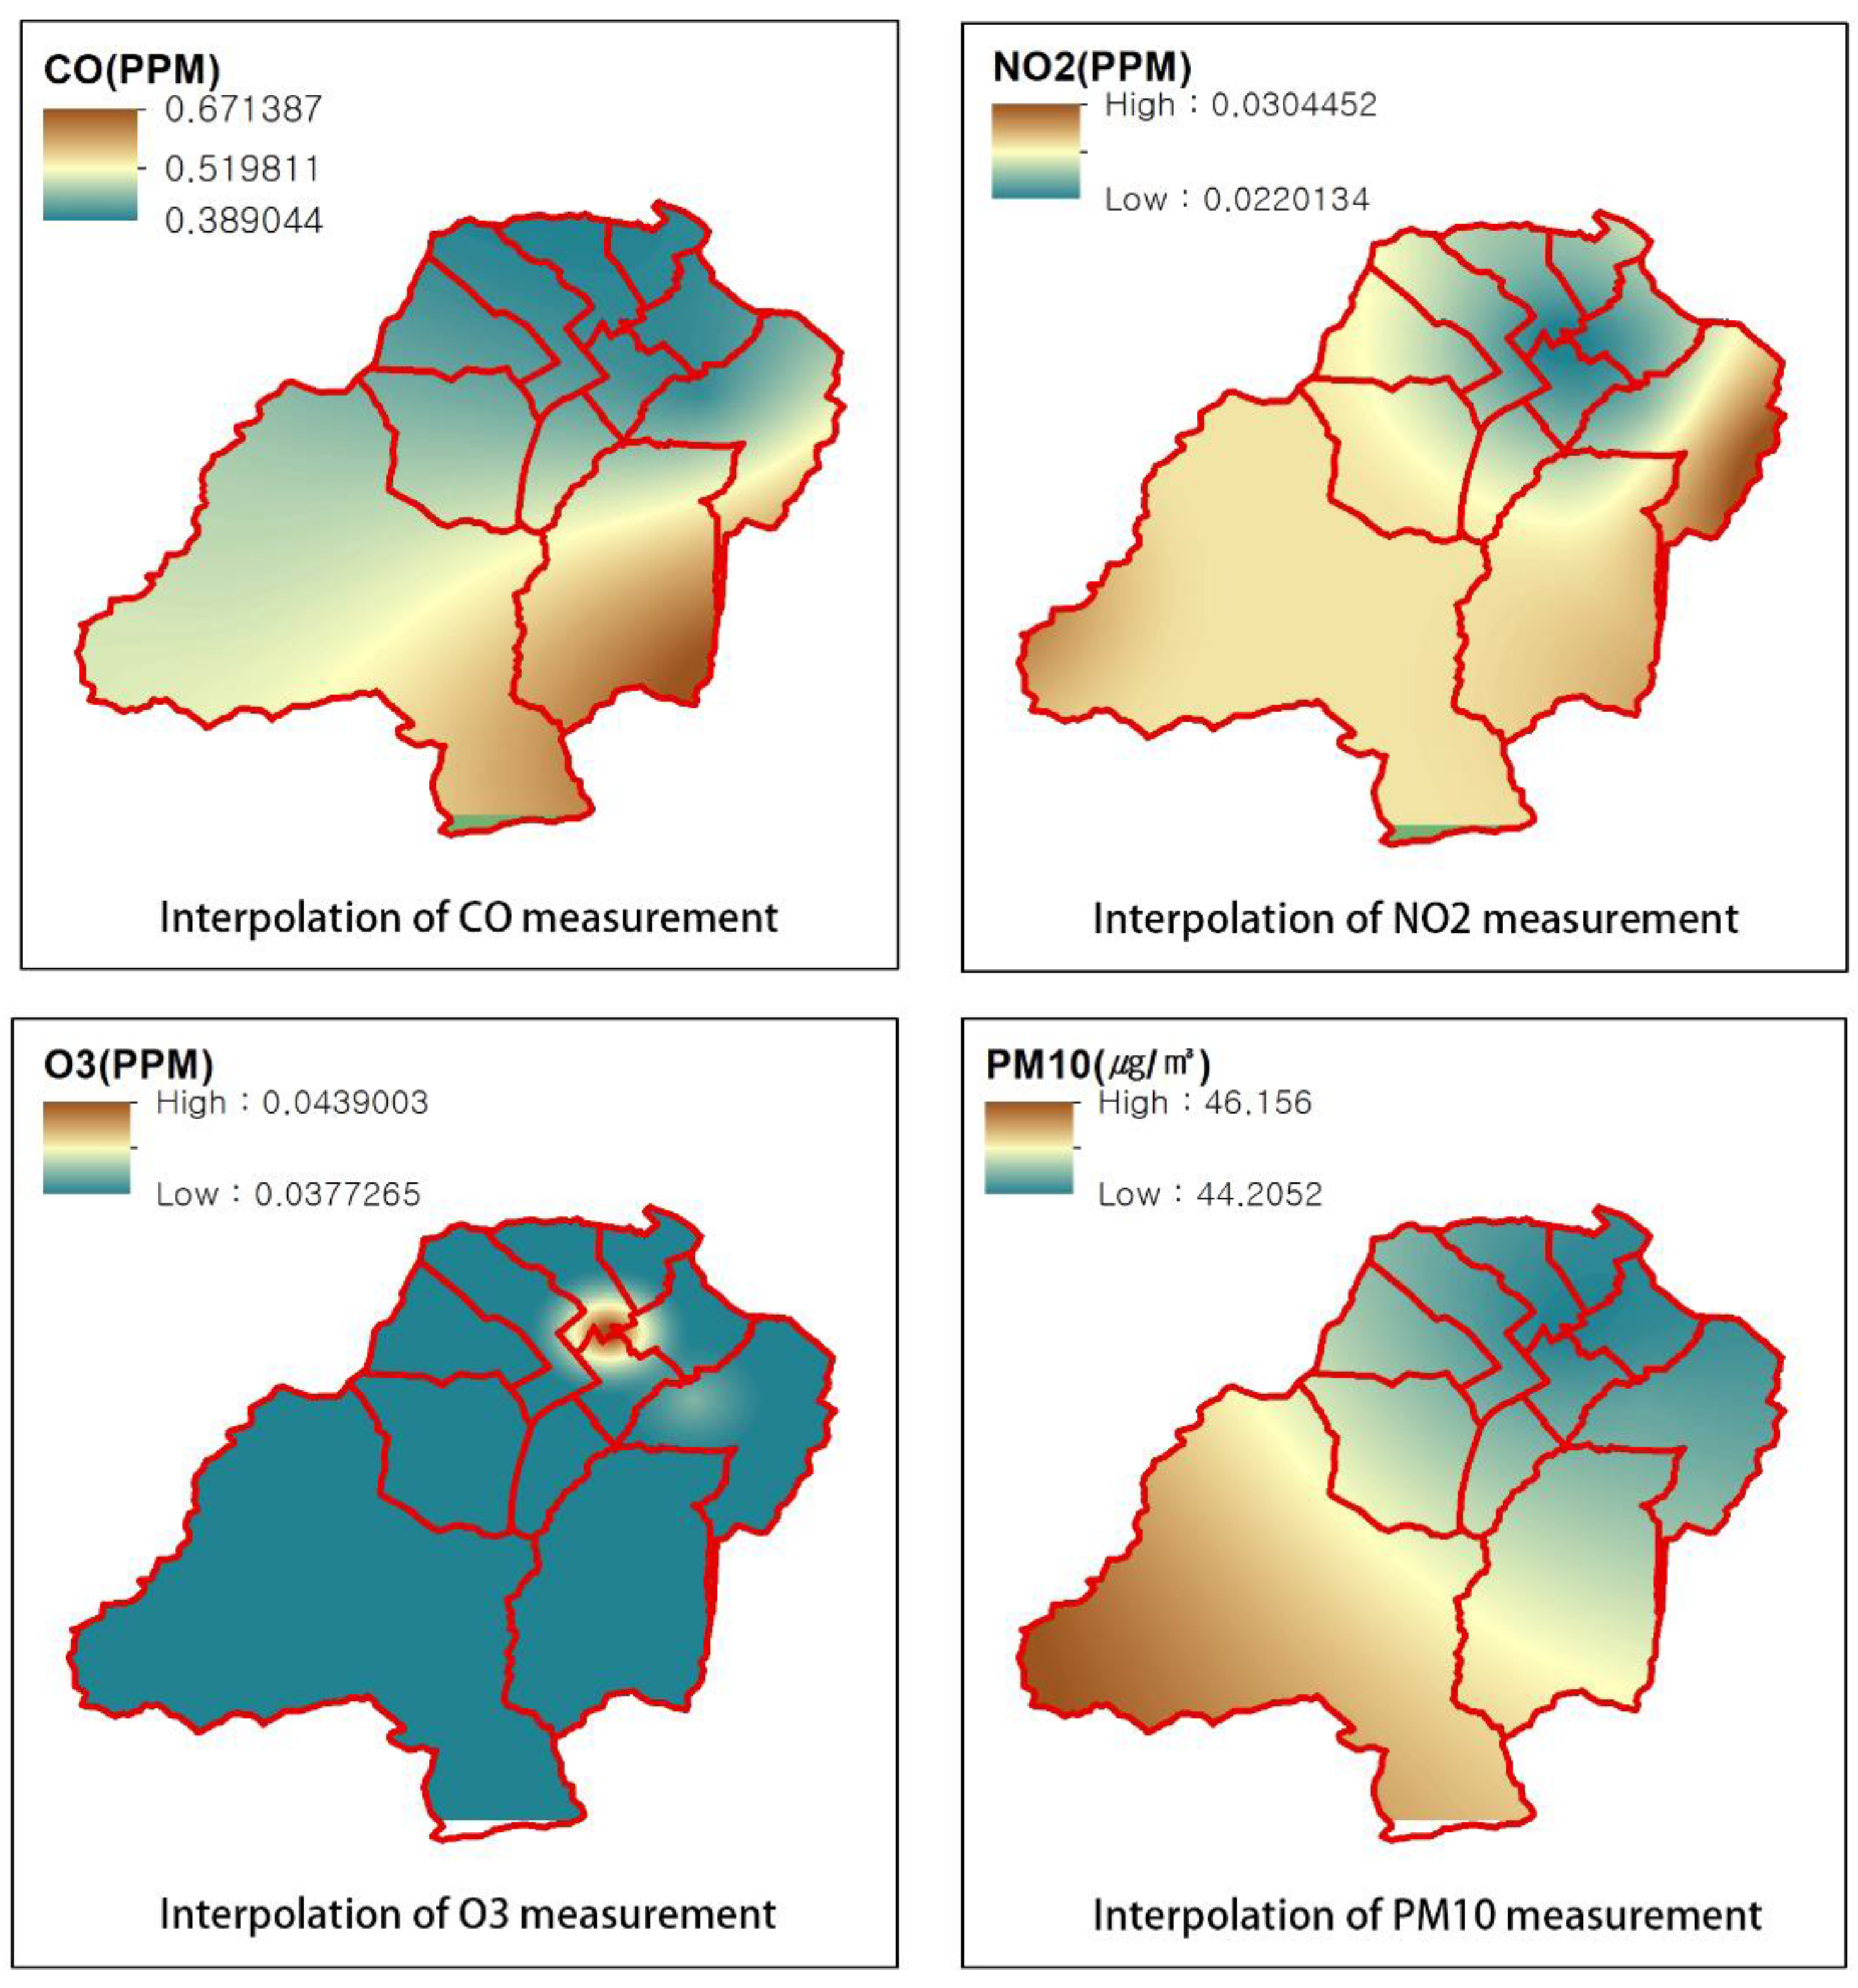
Due to the limited number of measurement stations within Gunpo City and its relatively small area, additional data from 10 surrounding cities were included in the measurement scope to comprehensively assess the air pollution levels in the region (Table 5), pollutant measurements are in ppm at the multiannual level. Subsequently, ordinary kriging interpolation was employed to calculate values across the area (Figure 7).
Table 5.
Measurement station information for air quality in Gunpo City, Korea.

Figure 7.
Air Quality Pollution Information for Gunpo City, Korea.
Due to the inclusion of surrounding cities’ monitoring data in the measurement of air pollution, the results may have been influenced. Therefore, we focused on analyzing the impact of GI on air pollution values in Gunpo City. Figure 7 shows that CO concentrations in Gunpo City are primarily concentrated in the southern and southeastern regions. Areas with higher CO concentrations are typically densely populated residential areas with significant traffic emissions. However, areas with high GI proportions, such as Shanbon-dong and Geumjeong-dong, exhibit lower CO concentrations, indicating the significant effectiveness of GI in absorbing CO.
Areas with higher concentrations of NO₂ and O₃ are also densely populated residential areas, especially those with a higher number of apartments, such as Gunpo2-dong. However, areas with a high proportion of GI show relatively lower NO2 and O3 concentrations, reflecting the role of green spaces in reducing traffic emissions and lowering ozone concentrations.
The PM10 values show an unusual pattern, with higher concentrations in the southwest where green areas are larger. This discrepancy may be influenced by PM10 values from monitoring stations in nearby southwest cities. However, the overall trend shows a gradual decrease in values from southwest to northwest, indicating that GI plays a filtering role in airborne particulate matter.
Comparing the air pollution data between Ulsan and Gunpo cities, there are noticeable spatial differences in pollutant concentrations. In Ulsan, the pollution concentration shows significant regional variations, with higher levels in the central urban areas and lighter pollution in the outskirts. On the other hand, in Gunpo City, pollutant concentrations are relatively uniform across the urban area, but specific regions (such as the southern and southeastern parts) exhibit higher concentrations. Gunpo City generally has a higher proportion of GI, with many areas having GI coverage close to or exceeding 90%, which significantly contributes to improving air quality. In contrast, while Ulsan also has areas with high proportions of green spaces, the coverage is relatively less extensive. This difference may contribute to higher air pollution levels in certain areas of Ulsan. The areas with high pollutant concentrations in Ulsan are more concentrated, whereas in Gunpo City, these areas are more dispersed, especially in the southern and southeastern parts of the city. In terms of urban structure and layout, Gunpo City exhibits a more diverse distribution of residential types including single-family residences, apartments, townhouses, and multi-unit residences. This balanced distribution may help in more evenly dispersing pollutant concentrations. In contrast, some areas of Ulsan, such as industrial zones, have a more homogeneous residential type and higher density, potentially contributing to higher pollutant concentrations in these regions. Gunpo City has a higher overall population density, but its mixed layout of residential areas and green spaces may contribute to a more even dispersion of pollutant concentrations. Ulsan’s concentration of industrial and residential areas is relatively concentrated, which may amplify the impact of industrial emissions on local air quality compared to Gunpo City.
3.3. Multivariate Regression Analysis
This study analyzed the relationship between GI area and air quality (nitrogen dioxide (NO2), ozone (O3), carbon monoxide (CO), and particulate matter (PM10)), using the percentage of GI area (%) as an independent variable. To further identify differences between models, variables such as total population, number of single-family residences, apartments, townhouses, and multi-unit residences were introduced as independent variables to explore their impact on the models. The introduction of these variables helps to deepen the understanding of the differences and strengths of various models in predicting the influence of GI on pollutant concentrations, thereby enhancing the completeness and accuracy of the analysis. The analysis results are shown in Table 6.
Table 6.
Summary table with 11 independent and 4 dependent variables.
Analyzing the data in Table 6, it is evident that the regression model exhibits higher explanatory power for PM10, NO2, and O3, as indicated by their higher Modified R2 values compared to CO, whose Modified R2 is relatively lower. Additionally, the F Probability values show that PM10, NO2, and O3 are statistically significant overall, whereas CO’s F Probability (0.058) is slightly above 0.05, suggesting the model’s approach significance for CO.
Regarding the variable analysis results, total population shows no significant impact on PM10, NO2, and O3, but it has a significant positive effect on CO (p = 0.011), indicating that an increase in total population leads to a CO increase of 0.000008269 ppm.
Single-family residences significantly positively influence PM10 (p = 0.035) and O3 (p = 0.018), and approach significance for NO2 (p = 0.063), suggesting that areas with more single-family residences may increase concentrations of these pollutants. Specifically, each additional unit of single-family residences increases PM10 by 0.006 ppm and O3 by 0.000007078 ppm.
Apartments significantly positively impact PM10 (p = 0.009), NO2 (p = 0.042), and O3 (p = 0.004), indicating that each additional unit of apartments increases PM10 by 0.008 ppm, NO2 by 0.000005037 ppm, and O3 by 0.000008527 ppm.
Townhouses significantly positively influence PM10 (p = 0.060) and O3 (p = 0.032), with each additional unit of townhouses increasing PM10 by 0.006 ppm and O3 by 0.000007221 ppm.
Multi-unit residences significantly positively influence PM10 (p = 0.004), NO2 (p = 0.023), and O3 (p = 0.002). This suggests that each additional unit of multi-unit residences increases PM10 by 0.0000006113 ppm, NO2 by 0.0000000001925 units, and O3 by 0.00000001512 ppm.
Green infrastructure (NDVI_GI) has a near-significant negative impact on NO2 (p = 0.085), indicating that GI helps reduce NO2 concentrations. Specifically, each additional unit area of GI decreases NO2 by 0.0000000001925 units.
Non-green infrastructure (NDVI_NON) significantly positively influences PM10 (p = 0.008) and CO (p = 0.009). This implies that each additional unit area of non-GI increases PM10 by 0.0000006113 ppm and CO by 0.00000001512 ppm.
The results above indicate that each of the four air pollutants is associated with different factors: (a) an increase in urban population leads to higher CO concentrations; (b) an increase in single-family residences results in higher PM10 and O3 levels; (c) an increase in apartments significantly increases PM10, NO2, and O3 levels, and slightly increases CO levels; (d) an increase in townhouses leads to higher PM10 and O3 levels; (e) an increase in GI area reduces NO2 levels, while a decrease in GI area increases PM10 and CO levels.
However, it is important to note that not all coefficients are statistically significant in every case, which could be attributed to other unconsidered factors or data limitations. These findings provide important clues for further exploring the relationship between GI and air quality. Further research is needed to validate these associations and consider additional influencing factors such as traffic conditions, industrial emissions, as well as spatial and temporal scales of variation. The Modified R2 values in this study did not exhibit high explanatory power except for PM10, which had a Modified R2 of 0.693. This suggests that while the model explains 69.3% of the variance in PM10 levels, 30.7% remains unexplained. This unexplained variance may be due to several factors, including the inherent limitations of the interpolation methods used, which may not account for all sources of variation in air quality. The impact of various uncontrolled factors such as meteorological conditions, traffic patterns, industrial emissions, and the spatial distribution of monitoring stations can contribute to this residual variance. Additionally, the lack of field validation and direct observation of local environmental conditions further limits the model’s explanatory power. To address these limitations, future research should incorporate more detailed field studies and consider additional variables that influence air quality to improve model accuracy and comprehensiveness.
The core hypothesis of this study is that increasing GI can effectively improve air quality. The study results are partially supported by statistical tests for NO2, showing a significant association between increased GI and improved air quality. Additionally, the study tested the correlation between increases in green coverage area ratios using NDVI data and air quality, finding statistically significant correlations in all cases.
4. Conclusions
In this study, researchers conducted correlation analyses between the GI area and the atmospheric pollutants NO2, O3, CO, and PM10 to investigate their relationships. The study found that for every 1% increase in GI area, nitrogen dioxide decreases by approximately 0.000000001925 ppm. This empirical finding reaffirms the direct impact of increasing GI area on improving atmospheric air quality, as demonstrated by actual measurement data.
This research aimed to explore the influence of GI on urban centers, focusing particularly on the relationship between the proportion of GI area and air quality improvement. Although no statistically significant results were obtained for all four dependent variables at the same time, statistically significant results were obtained for NO2. Additionally, the increase in non-GI regions led to an increase in PM10 and CO, further confirming the correlation between them in the reverse direction. The presence of significant correlations in statistical results is crucial as it explores the potential of effectively utilizing geographic information in future air quality research. Furthermore, through case studies analyzing the use of GI in urban planning, this study provides empirical evidence on how to more effectively plan green spaces. This approach transcends traditional categories of aesthetics and spatial utilization associated with green space planning. Therefore, future research on air quality should encompass data from more cities to ensure the reliability of statistical analyses. Moreover, there should be enhanced in-depth analysis of the distribution of GI, not limited solely to area ratios, to ensure comprehensive and diversified research analysis.
This study provides important insights into urban planning and urban green spaces. The research indicates a significant correlation between GI, such as vegetation cover, and air quality. Therefore, the importance of increasing green space coverage should be fully considered in urban planning. Urban planners can enhance the quality of urban environments and reduce the emission and spread of pollutants by incorporating parks, greenways, and plant landscapes into city layouts. This approach ultimately improves residents’ quality of life. Moreover, different types of GI may have varying effects on air quality improvement. Hence, urban planning should comprehensively consider various types of green spaces, including natural green areas like forests and wetlands, as well as artificial green spaces such as urban parks and green belts. Depending on specific circumstances, appropriate types of green spaces should be selected for layout and design to maximize their impact on air quality.
Simultaneously, optimizing population density through measures such as developing satellite cities, encouraging suburb development, and improving transportation infrastructure helps alleviate population pressure in central urban areas. Increasing the proportion of GI in high-density residential areas, such as adding parks and small green spaces, contributes to air quality improvement. Encouraging low-pollution transportation methods and reducing automobile exhaust emissions while enhancing the efficiency of public transportation systems are also crucial strategies. In urban planning, it is essential to allocate residential types and green space layouts sensibly, establish a robust environmental monitoring system, and regularly assess air quality and pollution sources. Based on monitoring results, adjusting urban planning and environmental protection policies promptly ensures the effectiveness of measures, facilitating coordinated development between the environment and residential areas.
In addition, this study is based on data collection and spatial analysis at specific points without any field investigation. This approach has limitations due to the lack of direct observation and measurement of local environments and conditions. To achieve more accurate and comprehensive results, future research should conduct more in-depth field studies. This includes field measurements, analysis of the city’s three-dimensional structure and street types, and calibration and validation of models and data results. Understanding the height, density, and layout of buildings in a city can help better comprehend the dispersion patterns of pollutants. Different types of streets (e.g., width, orientation, and traffic flow) significantly impact air quality.
Future research should consider incorporating additional factors such as air ventilation corridors, local topography, wind directions, and the distribution of heavy traffic roads, all of which significantly influence air pollution levels. By including these variables, studies could provide a more comprehensive understanding of the factors affecting air quality. Additionally, employing computational fluid dynamics methods and conducting wind tunnel experiments can be highly valuable for examining the relationship between urban structures and air pollution. These advanced techniques offer detailed insights into how different aspects of urban planning and infrastructure impact air quality, and continued exploration of these methods could further enhance our understanding of this complex issue.
Finally, it is imperative to strengthen the management and protection of urban green spaces to ensure their long-term effectiveness in improving air quality. This includes enhancing the ecological management of green spaces, rational utilization of water resources, preventing soil erosion, and implementing rigorous monitoring and evaluation of urban green spaces. Promptly identifying and resolving issues ensures the healthy development of urban green space systems, thereby achieving sustainable urban environmental goals.
Author Contributions
H.Y.K. prepared the entire funding and in-depth interview; H.Y.K. conducted quantitative analysis; and J.L. prepared the overall research process and the manuscript. All authors have read and agreed to the published version of the manuscript.
Funding
This research was supported by the Basic Research Program through the National Research Foundation of Korea (NRF) funded by the MSIT (RS-2023-00220751).
Data Availability Statement
The data used to support the findings of this study are available from the corresponding author upon reasonable request. The data are not publicly available due to privacy.
Conflicts of Interest
The authors declare no conflicts of interest.
References
- Abubeker, K.M.; Baskar, S. Wireless sensor and wireless body area network assisted biosensor network for effective monitoring and prevention of non-ventilator hospital-acquired pneumonia. Front. Sustain. Cities 2022, 4, 13. [Google Scholar] [CrossRef]
- World Health Organization. Billions of People Still Breathe Unhealthy Air: New WHO Data. Available online: https://www.who.int/news/item/04-04-2022-billions-of-people-still-breathe-unhealthy-air-new-who-data (accessed on 1 May 2024).
- World Health Organization. WHO Ambient Air Quality Database, 2022 Update: Status Report. World Health Organization. 2023. Available online: https://iris.who.int/handle/10665/368432 (accessed on 5 August 2024).
- Chen, H.S.; Lin, Y.C.; Chiueh, P.T. Nexus of ecosystem service-human health-natural resources: The nature-based solutions for urban PM2.5 pollution. Sustain. Cities Soc. 2023, 91, 11. [Google Scholar] [CrossRef]
- Eisenman, T.S.; Churkina, G.; Jariwala, S.P.; Kumar, P.; Lovasi, G.S.; Pataki, D.E.; Weinberger, K.R.; Whitlow, T.H. Urban trees, air quality, and asthma: An interdisciplinary review. Landsc. Urban Plan. 2019, 187, 47–59. [Google Scholar] [CrossRef]
- Yao, Y.B.; Wang, Y.F.; Ni, Z.B.; Chen, S.Q.; Xia, B.C. Improving air quality in Guangzhou with urban green infrastructure planning: An i-Tree Eco model study. J. Clean Prod. 2022, 369, 13. [Google Scholar] [CrossRef]
- Elmqvist, T.; Setälä, H.; Handel, S.N.; van der Ploeg, S.; Aronson, J.; Blignaut, J.N.; Gómez-Baggethun, E.; Nowak, D.J.; Kronenberg, J.; de Groot, R. Benefits of restoring ecosystem services in urban areas. Curr. Opin. Environ. Sustain. 2015, 14, 101–108. [Google Scholar] [CrossRef]
- Danilina, N.; Tsurenkova, K.; Berkovich, V. Evaluating Urban Green Public Spaces: The Case Study of Krasnodar Region Cities, Russia. Sustainability 2021, 13, 24. [Google Scholar] [CrossRef]
- Chen, H.S.; Tam, K.I.; Zhao, Y.L.; Yuan, L.; Wang, W.Y.; Lin, M.R.S.; Chiang, P.C. Development of Environmental Action Plans for Adaptation to Climate Change: A Perspective of Air Quality Management. Aerosol Air Qual. Res. 2023, 23, 17. [Google Scholar] [CrossRef]
- Li, X.Q.; Stringer, L.C.; Dallimer, M. The Impacts of Urbanisation and Climate Change on the Urban Thermal Environment in Africa. Climate 2022, 10, 21. [Google Scholar] [CrossRef]
- Pandey, B.; Ghosh, A. Urban ecosystem services and climate change: A dynamic interplay. Front. Sustain. Cities 2023, 5, 34. [Google Scholar] [CrossRef]
- Newman, G.; Shi, T.Q.; Yao, Z.; Li, D.Y.; Sansom, G.; Kirsch, K.; Casillas, G.; Horney, J. Citizen Science-Informed Community Master Planning: Land Use and Built Environment Changes to Increase Flood Resilience and Decrease Contaminant Exposure. Int. J. Environ. Res. Public Health 2020, 17, 13. [Google Scholar] [CrossRef]
- Ko, S.; Lee, D. Effectiveness of Green Infrastructure Location Based on a Social Well-Being Index. Sustainability 2021, 13, 18. [Google Scholar] [CrossRef]
- Rigolon, A.; Browning, M.; McAnirlin, O.; Yoon, H. Green Space and Health Equity: A Systematic Review on the Potential of Green Space to Reduce Health Disparities. Int. J. Environ. Res. Public Health 2021, 18, 27. [Google Scholar] [CrossRef]
- Roe, J.; Mondschein, A.; Neale, C.; Barnes, L.; Boukhechba, M.; Lopez, S. The Urban Built Environment, Walking and Mental Health Outcomes Among Older Adults: A Pilot Study. Front. Public Health 2020, 8, 15. [Google Scholar] [CrossRef]
- Wolf, K.L.; Lam, S.T.; McKeen, J.K.; Richardson, G.R.A.; van den Bosch, M.; Bardekjian, A.C. Urban Trees and Human Health: A Scoping Review. Int. J. Environ. Res. Public Health 2020, 17, 30. [Google Scholar] [CrossRef] [PubMed]
- Benedict, M.A.; McMahon, E.T. Green Infrastructure: Linking Landscapes and Communities; Island press: Washington, DC, USA, 2012. [Google Scholar]
- Ahern, J. Green infrastructure for cities: The spatial dimension. Cities Future Towards Integr. Sustain. Water Landsc. Manag. 2007, 13, 267–283. [Google Scholar]
- Gill, S.E.; Handley, J.F.; Ennos, A.R.; Pauleit, S. Adapting cities for climate change: The role of the green infrastructure. Built. Environ. 2007, 33, 115–133. [Google Scholar] [CrossRef]
- Fletcher, T.D.; Shuster, W.; Hunt, W.F.; Ashley, R.; Butler, D.; Arthur, S.; Trowsdale, S.; Barraud, S.; Semadeni-Davies, A.; Bertrand-Krajewski, J.-L. SUDS, LID, BMPs, WSUD and more–The evolution and application of terminology surrounding urban drainage. Urban Water J. 2015, 12, 525–542. [Google Scholar] [CrossRef]
- Chen, Y.; Wang, Y.P.; Zhou, D. Knowledge Map of Urban Morphology and Thermal Comfort: A Bibliometric Analysis Based on CiteSpace. Buildings 2021, 11, 23. [Google Scholar] [CrossRef]
- He, C.; Qiu, K.Y.; Alahmad, A.; Pott, R. Particulate matter capturing capacity of roadside evergreen vegetation during the winter season. Urban For. Urban Green. 2020, 48, 17. [Google Scholar] [CrossRef]
- Weerakkody, U.; Dover, J.W.; Mitchell, P.; Reiling, K. The impact of rainfall in remobilising particulate matter accumulated on leaves of four evergreen species grown on a green screen and a living wall. Urban For. Urban Green. 2018, 35, 21–31. [Google Scholar] [CrossRef]
- Xu, H.Y.; Zhao, G.H. Assessing the Value of Urban Green Infrastructure Ecosystem Services for High-Density Urban Management and Development: Case from the Capital Core Area of Beijing, China. Sustainability 2021, 13, 19. [Google Scholar] [CrossRef]
- Wuyts, K.; Smets, W.; Lebeer, S.; Samson, R. Green infrastructure and atmospheric pollution shape diversity and composition of phyllosphere bacterial communities in an urban landscape. FEMS Microbiol. Ecol. 2020, 96, 14. [Google Scholar] [CrossRef]
- Muyshondt, B.; Wuyts, K.; Van Mensel, A.; Smets, W.; Lebeer, S.; Aleixo, C.; Ortí, M.A.; Casanelles-Abella, J.; Chiron, F.; Giacomo, P.; et al. Phyllosphere bacterial communities in urban green areas throughout Europe relate to urban intensity. FEMS Microbiol. Ecol. 2022, 98, 12. [Google Scholar] [CrossRef] [PubMed]
- Hui, C.X.; Dan, G.; Alamri, S.; Toghraie, D. Greening smart cities: An investigation of the integration of urban natural resources and smart city technologies for promoting environmental sustainability. Sustain. Cities Soc. 2023, 99, 28. [Google Scholar] [CrossRef]
- Jain, M.; Nagpal, A. Relationship Between Environmental Sustainability and Human Development Index: A Case of Selected South Asian Nations. Vision 2019, 23, 125–133. [Google Scholar] [CrossRef]
- Zinia, N.J.; McShane, P. Urban ecosystems and ecosystem services in megacity Dhaka: Mapping and inventory analysis. Urban Ecosyst. 2021, 24, 915–928. [Google Scholar] [CrossRef]
- Jaron, A.; Borucka, A.; Delis, P.; Sekrecka, A. An Assessment of the Possibility of Using Unmanned Aerial Vehicles to Identify and Map Air Pollution from Infrastructure Emissions. Energies 2024, 17, 15. [Google Scholar] [CrossRef]
- Miao, C.P.; Cui, A.W.; Xiong, Z.P.; Hu, Y.M.; Chen, W.; He, X.Y. Vertical evaluation of air quality improvement by urban forest using unmanned aerial vehicles. Front. Ecol. Evol. 2022, 10, 10. [Google Scholar] [CrossRef]
- Liu, X.; Shi, X.Q.; He, H.D.; Li, X.B.; Peng, Z.R. Vertical distribution characteristics of particulate matter beside an elevated expressway by unmanned aerial vehicle measurements. Build. Environ. 2021, 206, 14. [Google Scholar] [CrossRef]
- Liu, X.; Shi, X.Q.; Li, X.B.; Peng, Z.R. Quantification of multifactorial effects on particle distributions at urban neighborhood scale using machine learning and unmanned aerial vehicle measurement. J. Clean Prod. 2022, 378, 11. [Google Scholar] [CrossRef]
- Nordman, E.E.; Isely, E.; Isely, P.; Denning, R. Benefit-cost analysis of stormwater green infrastructure practices for Grand Rapids, Michigan, USA. J. Clean Prod. 2018, 200, 501–510. [Google Scholar] [CrossRef]
- Sturiale, L.; Scuderi, A. The Role of Green Infrastructures in Urban Planning for Climate Change Adaptation. Climate 2019, 7, 24. [Google Scholar] [CrossRef]
- Tiwary, A.; Kumar, P. Impact evaluation of green-grey infrastructure interaction on built-space integrity: An emerging perspective to urban ecosystem service. Sci. Total Environ. 2014, 487, 350–360. [Google Scholar] [CrossRef] [PubMed]
- Karteris, M.; Theodoridou, I.; Mallinis, G.; Tsiros, E.; Karteris, A. Towards a green sustainable strategy for Mediterranean cities: Assessing the benefits of large-scale green roofs implementation in Thessaloniki, Northern Greece, using environmental modelling, GIS and very high spatial resolution remote sensing data. Renew. Sustain. Energ. Rev. 2016, 58, 510–525. [Google Scholar] [CrossRef]
- Tella, A.; Balogun, A.L. GIS-based air quality modelling: Spatial prediction of PM10 for Selangor State, Malaysia using machine learning algorithms. Environ. Sci. Pollut. Res. 2022, 29, 86109–86125. [Google Scholar] [CrossRef] [PubMed]
- Zhou, Y.J.; Liu, H.L.; Zhou, J.X.; Xia, M. GIS-Based Urban Afforestation Spatial Patterns and a Strategy for PM2.5 Removal. Forests 2019, 10, 17. [Google Scholar] [CrossRef]
- Fernández, I.C.; Wu, J.G. A GIS-based framework to identify priority areas for urban environmental inequity mitigation and its application in Santiago de Chile. Appl. Geogr. 2018, 94, 213–222. [Google Scholar] [CrossRef]
- Badach, J.; Szczepanski, J.; Bonenberg, W.; Gebicki, J.; Nyka, L. Developing the Urban Blue-Green Infrastructure as a Tool for Urban Air Quality Management. Sustainability 2022, 14, 29. [Google Scholar] [CrossRef]
- Castillo, M.D.; Anenberg, S.C.; Chafe, Z.A.; Huxley, R.; Johnson, L.S.; Kheirbek, I.; Malik, M.; Marshall, J.D.; Naidoo, S.; Nelson, M.L.; et al. Quantifying the Health Benefits of Urban Climate Mitigation Actions: Current State of the Epidemiological Evidence and Application in Health Impact Assessments. Front. Sustain. Cities 2021, 3, 16. [Google Scholar] [CrossRef]
- Hegeman, E.E.; Levin, P.S. Using human health disparities and salmon health to guide spatial prioritization of green stormwater infrastructure. Landsc. Urban Plan. 2023, 240, 10. [Google Scholar] [CrossRef]
- Wang, R.Y.; Dong, P.X.; Dong, G.P.; Xiao, X.; Huang, J.W.; Yang, L.C.; Yu, Y.J.; Dong, G.H. Exploring the impacts of street-level greenspace on stroke and cardiovascular diseases in Chinese adults. Ecotox. Environ. Saf. 2022, 243, 10. [Google Scholar] [CrossRef] [PubMed]
- Martinez, A.D.; Labib, S.M. Demystifying normalized difference vegetation index (NDVI) for greenness exposure assessments and policy interventions in urban greening. Environ. Res. 2023, 220, 12. [Google Scholar] [CrossRef] [PubMed]
- Gruwald, L.; Heusinger, J.; Weber, S. A GIS-based mapping methodology of urban green roof ecosystem services applied to a Central European city. Urban For. Urban Green. 2017, 22, 54–63. [Google Scholar] [CrossRef]
- Tran, T.J.; Helmus, M.R.; Behm, J.E. Green infrastructure space and traits (GIST) model: Integrating green infrastructure spatial placement and plant traits to maximize multifunctionality. Urban For. Urban Green. 2020, 49, 11. [Google Scholar] [CrossRef]
- Li, K.M.; Li, C.L.; Hu, Y.M.; Xiong, Z.P.; Wang, Y.H. Quantitative estimation of the PM2.5 removal capacity and influencing factors of urban green infrastructure. Sci. Total Environ. 2023, 867, 11. [Google Scholar] [CrossRef]

Disclaimer/Publisher’s Note: The statements, opinions and data contained in all publications are solely those of the individual author(s) and contributor(s) and not of MDPI and/or the editor(s). MDPI and/or the editor(s) disclaim responsibility for any injury to people or property resulting from any ideas, methods, instructions or products referred to in the content. |
© 2024 by the authors. Licensee MDPI, Basel, Switzerland. This article is an open access article distributed under the terms and conditions of the Creative Commons Attribution (CC BY) license (https://creativecommons.org/licenses/by/4.0/).