Article

Unraveling the Dynamic Relationship between Neighborhood Deprivation and Walkability over Time: A Machine Learning Approach

1
School of Sports Economics and Management, Hubei University of Economics, Wuhan 430205, China
2
School of Public Policy & Management, China University of Mining and Technology, Xuzhou 221116, China
3
School of Resource and Environmental Sciences, Wuhan University, Wuhan 430079, China
*
Author to whom correspondence should be addressed.
Land 2024, 13(5), 667; https://doi.org/10.3390/land13050667
Submission received: 6 April 2024 / Revised: 30 April 2024 / Accepted: 8 May 2024 / Published: 12 May 2024
(This article belongs to the Special Issue Recent Progress in RS&GIS-Based Urban Planning)

Abstract

:
Creating a walkable environment is an essential step toward the 2030 Sustainable Development Goals. Nevertheless, not all people can enjoy a walkable environment, and neighborhoods with different socioeconomic status are found to vary greatly with walkability. Former studies have typically unraveled the relationship between neighborhood deprivation and walkability from a temporally static perspective and the produced estimations to a point-in-time snapshot were believed to incorporate great uncertainties. The ways in which neighborhood walkability changes over time in association with deprivation remain unclear. Using the case of the Hangzhou metropolitan area, we first measured the neighborhood walkability from 2016 to 2018 by calculating a set of revised walk scores. Further, we applied a machine learning algorithm, the kernel-based regularized least squares regression in particular, to unravel how neighborhood walkability changes in relation to deprivation over time. The results not only capture the nonlinearity in the relationship between neighborhood deprivation and walkability over time, but also highlight the marginal effects of each neighborhood deprivation indicator. Additionally, comparisons of the outputs between the machine learning algorithm and OLS regression illustrated that the machine learning approach did tell a different story and should contribute to remedying the contradictory conclusions in earlier studies. This paper is believed to renew the understanding of social inequalities in walkability by bringing the significance of temporal dynamics and structural interdependences to the fore.

1. Introduction

The rising prevalence of overweight or obese individuals has become a growing concern worldwide [1], given the associated increased risk factor for non-communicable diseases (NCDs) and subsequent socioeconomic burdens [2]. To make matters worse, health status and healthy lifestyles are interactively or independently associated with neighborhood socioeconomic and built environment characteristics [3]. Socioeconomic gradients in the built environment features that create a supportive physical and social context for health-related behaviours have been frequently emphasized [4,5], and numerous cases have highlighted that the prevalence of obesity and NCDs are much higher in deprived neighborhoods with higher concentrations of low-income and ethnic minorities groups [6,7,8]. In this regard, unraveling associations between neighborhood deprivation and the built environment should provide in-depth insights into strategies for urban planners and policymakers.
Walking has been widely acknowledged to deliver health benefits in diverse ways [7,9]. Studies have evidenced that a walkable environment plays an essential role in combating obesity and non-communicable diseases [5,10]. Creating a walkable environment is not only a practical step toward the UN Sustainable Development Goals (SDGs) 2030 [11], but also a useful strategy recommended by the New Urbanism for reshaping urban areas [7,12,13]. Nevertheless, not all people can enjoy a walkable environment, and neighborhoods with different socioeconomic status (SES) are supposed to vary greatly with walkability [14]. Following such theoretical hypotheses, several insightful studies examined the relationship between neighborhood deprivation and walkability but reached contradictory conclusions [15,16,17,18,19]. In order to obtain more generalized knowledge, three key issues need to be further addressed:
First, the majority of earlier studies examined the European and North American contexts and there is a lack of empirical research in the context of Chinese metropolitan areas, where neighborhood–environment and sociodemographic characteristics greatly differ from those of the western nations [14].
Second, former studies typically examined the relationship between neighborhood deprivation and walkability from a temporally static perspective and the produced estimations to a point-in-time snapshot are believed to incorporate great uncertainties [20,21]. How neighborhood walkability changes over time in association with deprivation remains unclear.
Last, the frequently employed traditional ordinary least squares (OLS) regression relies heavily on a linear assumption and should be very limited in addressing the structural interdependences among the multidimensional neighborhood deprivation aspects [22].
Machine learning algorithms have recently mushroomed in a plethora of land use research fields [23,24,25,26]. They present a strong capability for untangling nonlinearity in associations and handling structural interdependences among variables [22,27], thereby offering a new impetus for unpacking the dynamic relationship between neighborhood deprivation and walkability over time. Based on this point, our study aims to remedy the research gaps by demonstrating a machine learning approach to unraveling how neighborhood walkability changes in relation to deprivation over time within a typical Chinese metropolitan area. In particular, we compare the outputs between machine learning algorithms and OLS regression so as to illustrate how the machine learning approach tells a different story. To the best of our knowledge, this paper is among the very first attempts to revisit the relationship between neighborhood deprivation and walkability from a temporally dynamic viewpoint. It renews the understanding of social inequalities in walkability by bringing the significance of temporal dynamics and structural interdependences to the fore.

2. Materials and Methods

2.1. Study Area and Research Design

Located in the northern part of Zhejiang Province, the Hangzhou metropolitan area is among the most populous and prosperous urban areas in China’s Yangtze River Delta Megaregion (Figure 1). It is the core urban area of the Hangzhou megacity, comprising six districts and holding over 12 million residents. Setting the goals of leisure, wealth, and civilization, the Hangzhou metropolitan area has achieved remarkable success in creating pedestrian, non-motorized, and public transportation systems in the recent past. At the same time, socio-spatial segregation gradually evolved along with the rapid urban construction and development, which served as a mirror of modern cities in China. Researchers have observed the inequitable distribution of public facilities, open spaces, and mobility patterns across socioeconomic groups [4,25,28,29]. In this respect, how to make a walkable environment compatible with an equal society becomes an urgent issue for the Hangzhou metropolitan area. It therefore requires efforts to unravel the relationship between neighborhood deprivation and walkability over time.
A neighborhood refers to a geographical unit which has sociodemographic characteristics that are relatively homogeneous, or which exhibits identical built environment features. No uniform criteria exist as to the geographical delineation of neighborhoods. Scholars have demonstrated various methods for delineating neighborhoods in urban settings, which can be classified into two major categories. One category accords with the urban management or administrative levels, ranging from the community, subdistrict, and district to the census tract, mesh block, and block levels [14,30,31]. The other category employs buffer-based analysis to create the vicinity of residence [32,33,34] or relies on the street segments [4,35]. Such an approach has been criticized for potentially incorporating objective bias, and most importantly, this approach has no compatible sociodemographic statistical data. In accordance with prior related studies [4,25,28,29], the neighborhood in this study refers to the residential quarter (juzhu xiaoqu in Chinese), which is the finest level of China’s urban governance.
It takes four major steps to realize the research objectives. First, a set of modified walk scores is developed to measure neighborhood walkability and capture its spatiotemporal patterns within the study area from 2016 to 2018. Second, a number of indicators are selected from multiple dimensions to represent neighborhood deprivation. Third, a machine learning algorithm, the kernel-based regularized least squares regression in particular, is utilized to capture how neighborhood walkability changes in association with deprivation and is further compared to the OLS regression in terms of model performances and estimations. Last, implications for spatial planning are discussed. It should be further elaborated that the temporal span of three years is relatively limited due to the scarcity of neighborhood deprivation data in China. Fortunately for our study, earlier studies have demonstrated that comparisons between 2016 and 2018 could provide sufficient insights into the rapid changes of built environment and sociodemographic characteristics in the Hangzhou metropolitan area [4,25,28,29]. Thus, such a spatiotemporal scale can adequately facilitate a contribution to the current literature about methodology and further provide refreshed empirical knowledge.

2.2. Measures of Neighborhood Walkability

Walkability is typically understood as the extent to which the urban built environment is conducive to walking [4]. A spectrum of tools and methodologies has been demonstrated to measure walkability from objective or subjective dimensions [19,20,26,36,37,38,39,40] at different scales. Both of the subjective and the objective measures have their own merits and demerits. The subjective approaches typically ask the residents to score their feelings of safety, beauty, pleasure, and comfort based on street view images and further predict the perceived walkability at segment or intersection scales [19,20,41,42]. Nevertheless, the score rating is highly sensitive to the interviewers’ sociodemographic characteristics as well as the sample size [42,43,44]. Furthermore, the distribution of street view images is uneven across space and time, making it difficult to evaluate the walkability at a neighborhood scale [7,19]. Compared to subjective perceptions, objective measures are much easier to calculate and can provide intuitive figures for planners and policymakers to identify the less walkable places that need planning interventions [14,45]. To be specific, the walk score (https://www.walkscore.com, accessed on 1 March 2023), one of the most popular objective measures, offers a metric of overall walkability by weighting the distances to different categories of urban amenities. However, the walk score was originally designed against the North American background which greatly differs from the Chinese urban context. Following the work of Su et al. [7], we revised the walk score in three respects: (1) the determination of amenities and their weight; (2) the establishment of the decay function for distance calculation; and (3) the consideration of pedestrian features. Detailed steps are listed as follows:
Step 1: Selection of amenities and determination of weight
In reference to prior related studies [7,41], selecting the amenities accorded with the ‘Chinese Standard for Urban Community Design’ and these amenities were divided into six major categories, including commercial services (A), education and training (B), public services (C), transport facilities (D), medical care (E), and finance and communications (F). Then, 800 questionnaires were randomly collected to record the use frequency of the amenities among the urban residents in the study area. Last, a standard weight was assigned to each amenity according to their average use frequency (Table 1).
Step 2: Establishment of the decay function for distance calculation
According to the law of facility use barrier attenuation, the tolerance time for visiting different amenities via walking declines with the travel distance [7]. In our study, we tested the decay function, proposed by Su et al. [7] using the questionnaires and found a perfect fitting (R2 = 0.87, p < 0.01). We employed the decay coeffects for revising the distance calculated based on the pedestrian network and further integrated them into an original walk score.
Step 3: Modified walk score in consideration of pedestrian features
It has been frequently reported that pedestrian features significantly contribute to walking. Scholars have suggested the incorporation of pedestrian features to adjust the estimations of the decay function. Among them, intersection density and block length are the most commonly employed indicators. We referred to previous studies conducted in urban China and set the attenuation rate for these two indicators. Finally, the original walk score was modified by the attenuation rate for intersection density and block length (Table 2).
We calculated the overall walk score and the subtype walk score for the six categories of amenities for each neighborhood of the research area in 2016 and 2018. Data on POIs, pedestrian networks, and land use were obtained and accessed from the local government.

2.3. Indicators of Neighborhood Deprivation

Researchers generally agree that neighborhood deprivation is a multidimensional concept and should be measured using different categories of indicators, including education, income, gender, age, culture, occupation, and housing conditions [4,25,28,29,31,33]. While the employed indicators vary with cases in the literature, it is generally agreed that selecting indicators of neighborhood deprivation should follow three major guidelines, namely multidimension, low redundancy, and compatibility with related studies [4,46,47]. In practice, selecting indicators of neighborhood deprivation is also highly subject to data availability [4]. Referring to related studies [4,25,28,29] and considering data availability, twelve indicators of neighborhood deprivation were selected from six dimensions, including age, gender, occupation, education, culture, and marriage status. Data on these indicators for each neighborhood were provided by the local government (Table 3).

2.4. The Kernel-Based Regularized Least Squares Regression

In order to identify the relationship between neighborhood deprivation and walkability over time, we employ the Kernel-based regularized least square regression (KRLS) algorithm. As a novel machine learning algorithm, the KRLS can accommodate a wide range of smooth, nonlinear, and non-additive functions of the covariates by fitting a flexible, minimum-complexity regression surface to the data [22,48]. In this way, the KRLS unravels the nonlinearity in the relationship between neighborhood deprivation and walkability over time; as well, the KRLS produces estimates of the marginal effects of each neighborhood deprivation indicator and their interactions. Furthermore, the KRLS fundamentally involves fitting a linear regression to data that have been transformed via a kernel function, which quantifies the similarity among data points. This transformation projects the data into a higher-dimensional space; however, the model retains a linear form in this new space, which does not inherently complicate the model, an issue frequently seen in support vector machines and neural networks. Specifically, the data may be transformed into an infinitely dimensional space in support vector machines, and the model complexity is substantially higher in neural networks. Also, KRLS incorporates regularization in its fitting process. This regularization helps to mitigate overfitting by penalizing larger weights, effectively encouraging smaller, more generalized weight values [48]. We first quantify the relationship between neighborhood deprivation indicators and overall walk scores over time and then examine the relationships between neighborhood deprivation indicators and subtype walk scores from 2016 to 2018. All the variables have been standardized before implementing the KRLS. In order to evidence the advantage of KRLS, we compare the model performances between KRLS and OLS using the R2 indicator. Following this, to address possible concerns regarding overfitting, we implement a leave-one-out cross-validation (LOOCV) in our analysis. The LOOCV process is described by the equation below. This method provides a rigorous assessment of model performance and stability across different subsets of the data. Finally, the interactions among deprivation indicators are quantified.
L O O C V = 1 i = 1 n ( y i y ^ i ) 2 i = 1 n ( y i y ¯ ) 2
where y i ^ represents the prediction from the model trained on the dataset excluding the i-th sample.

3. Results

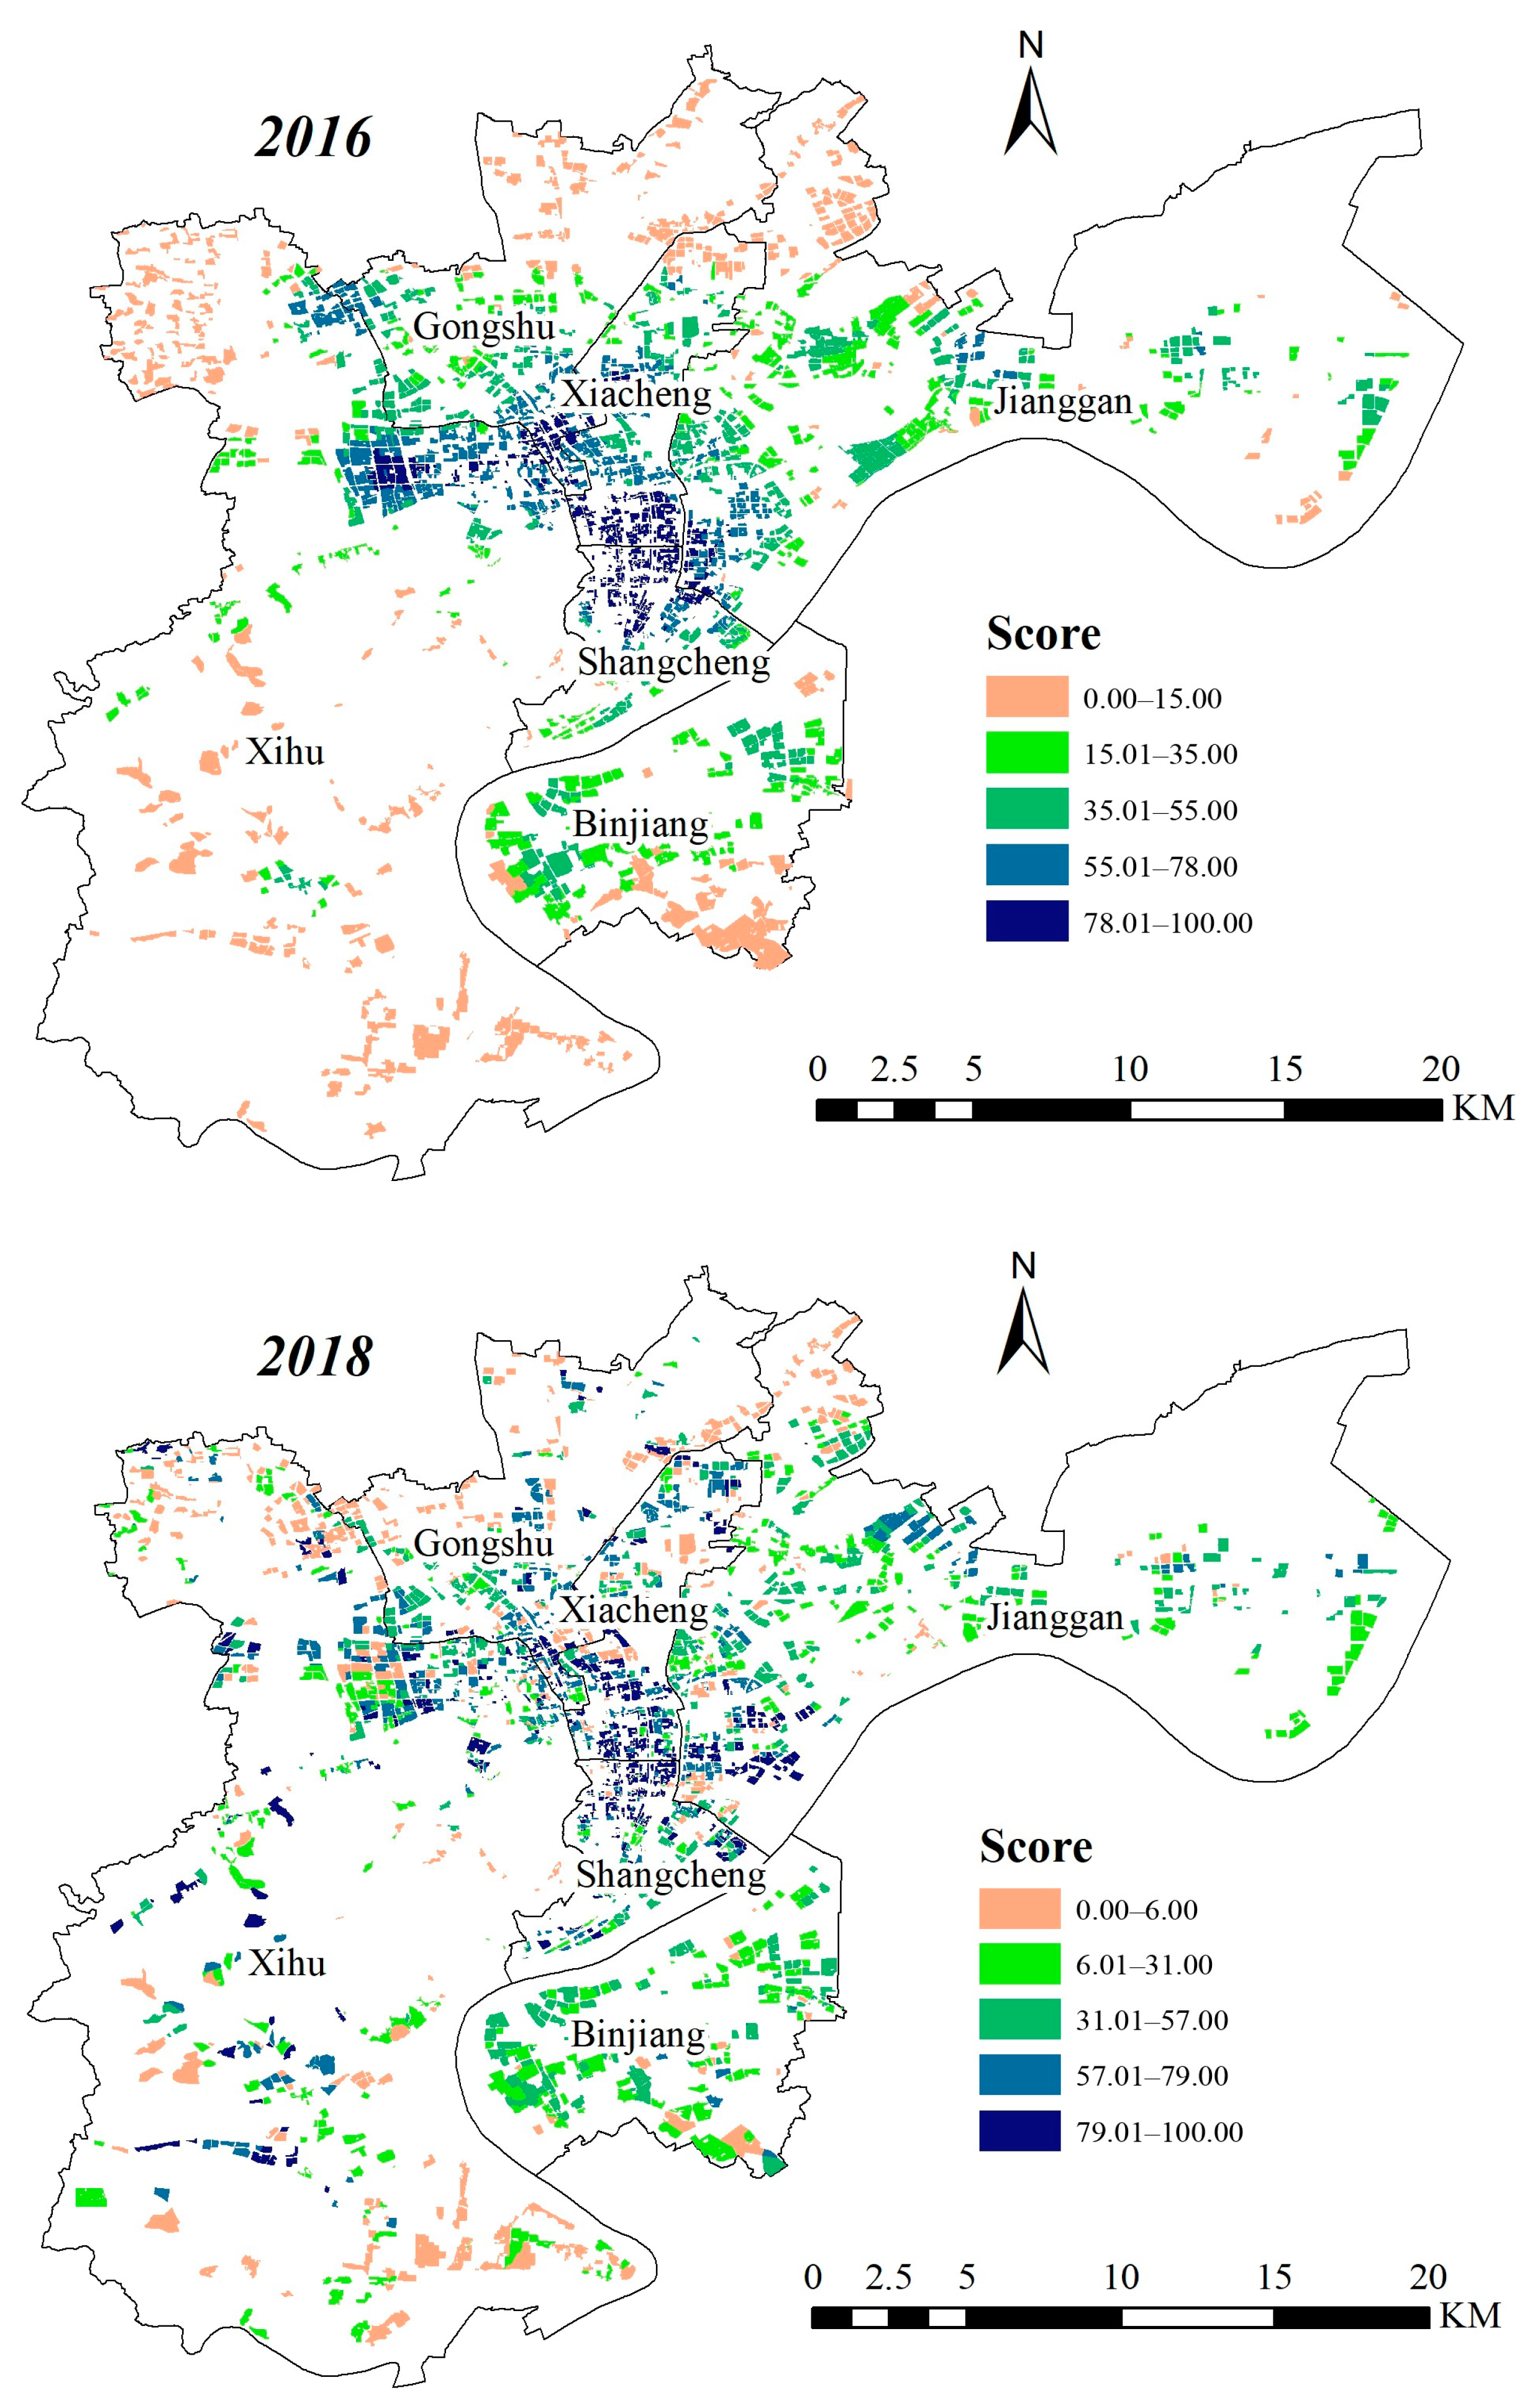
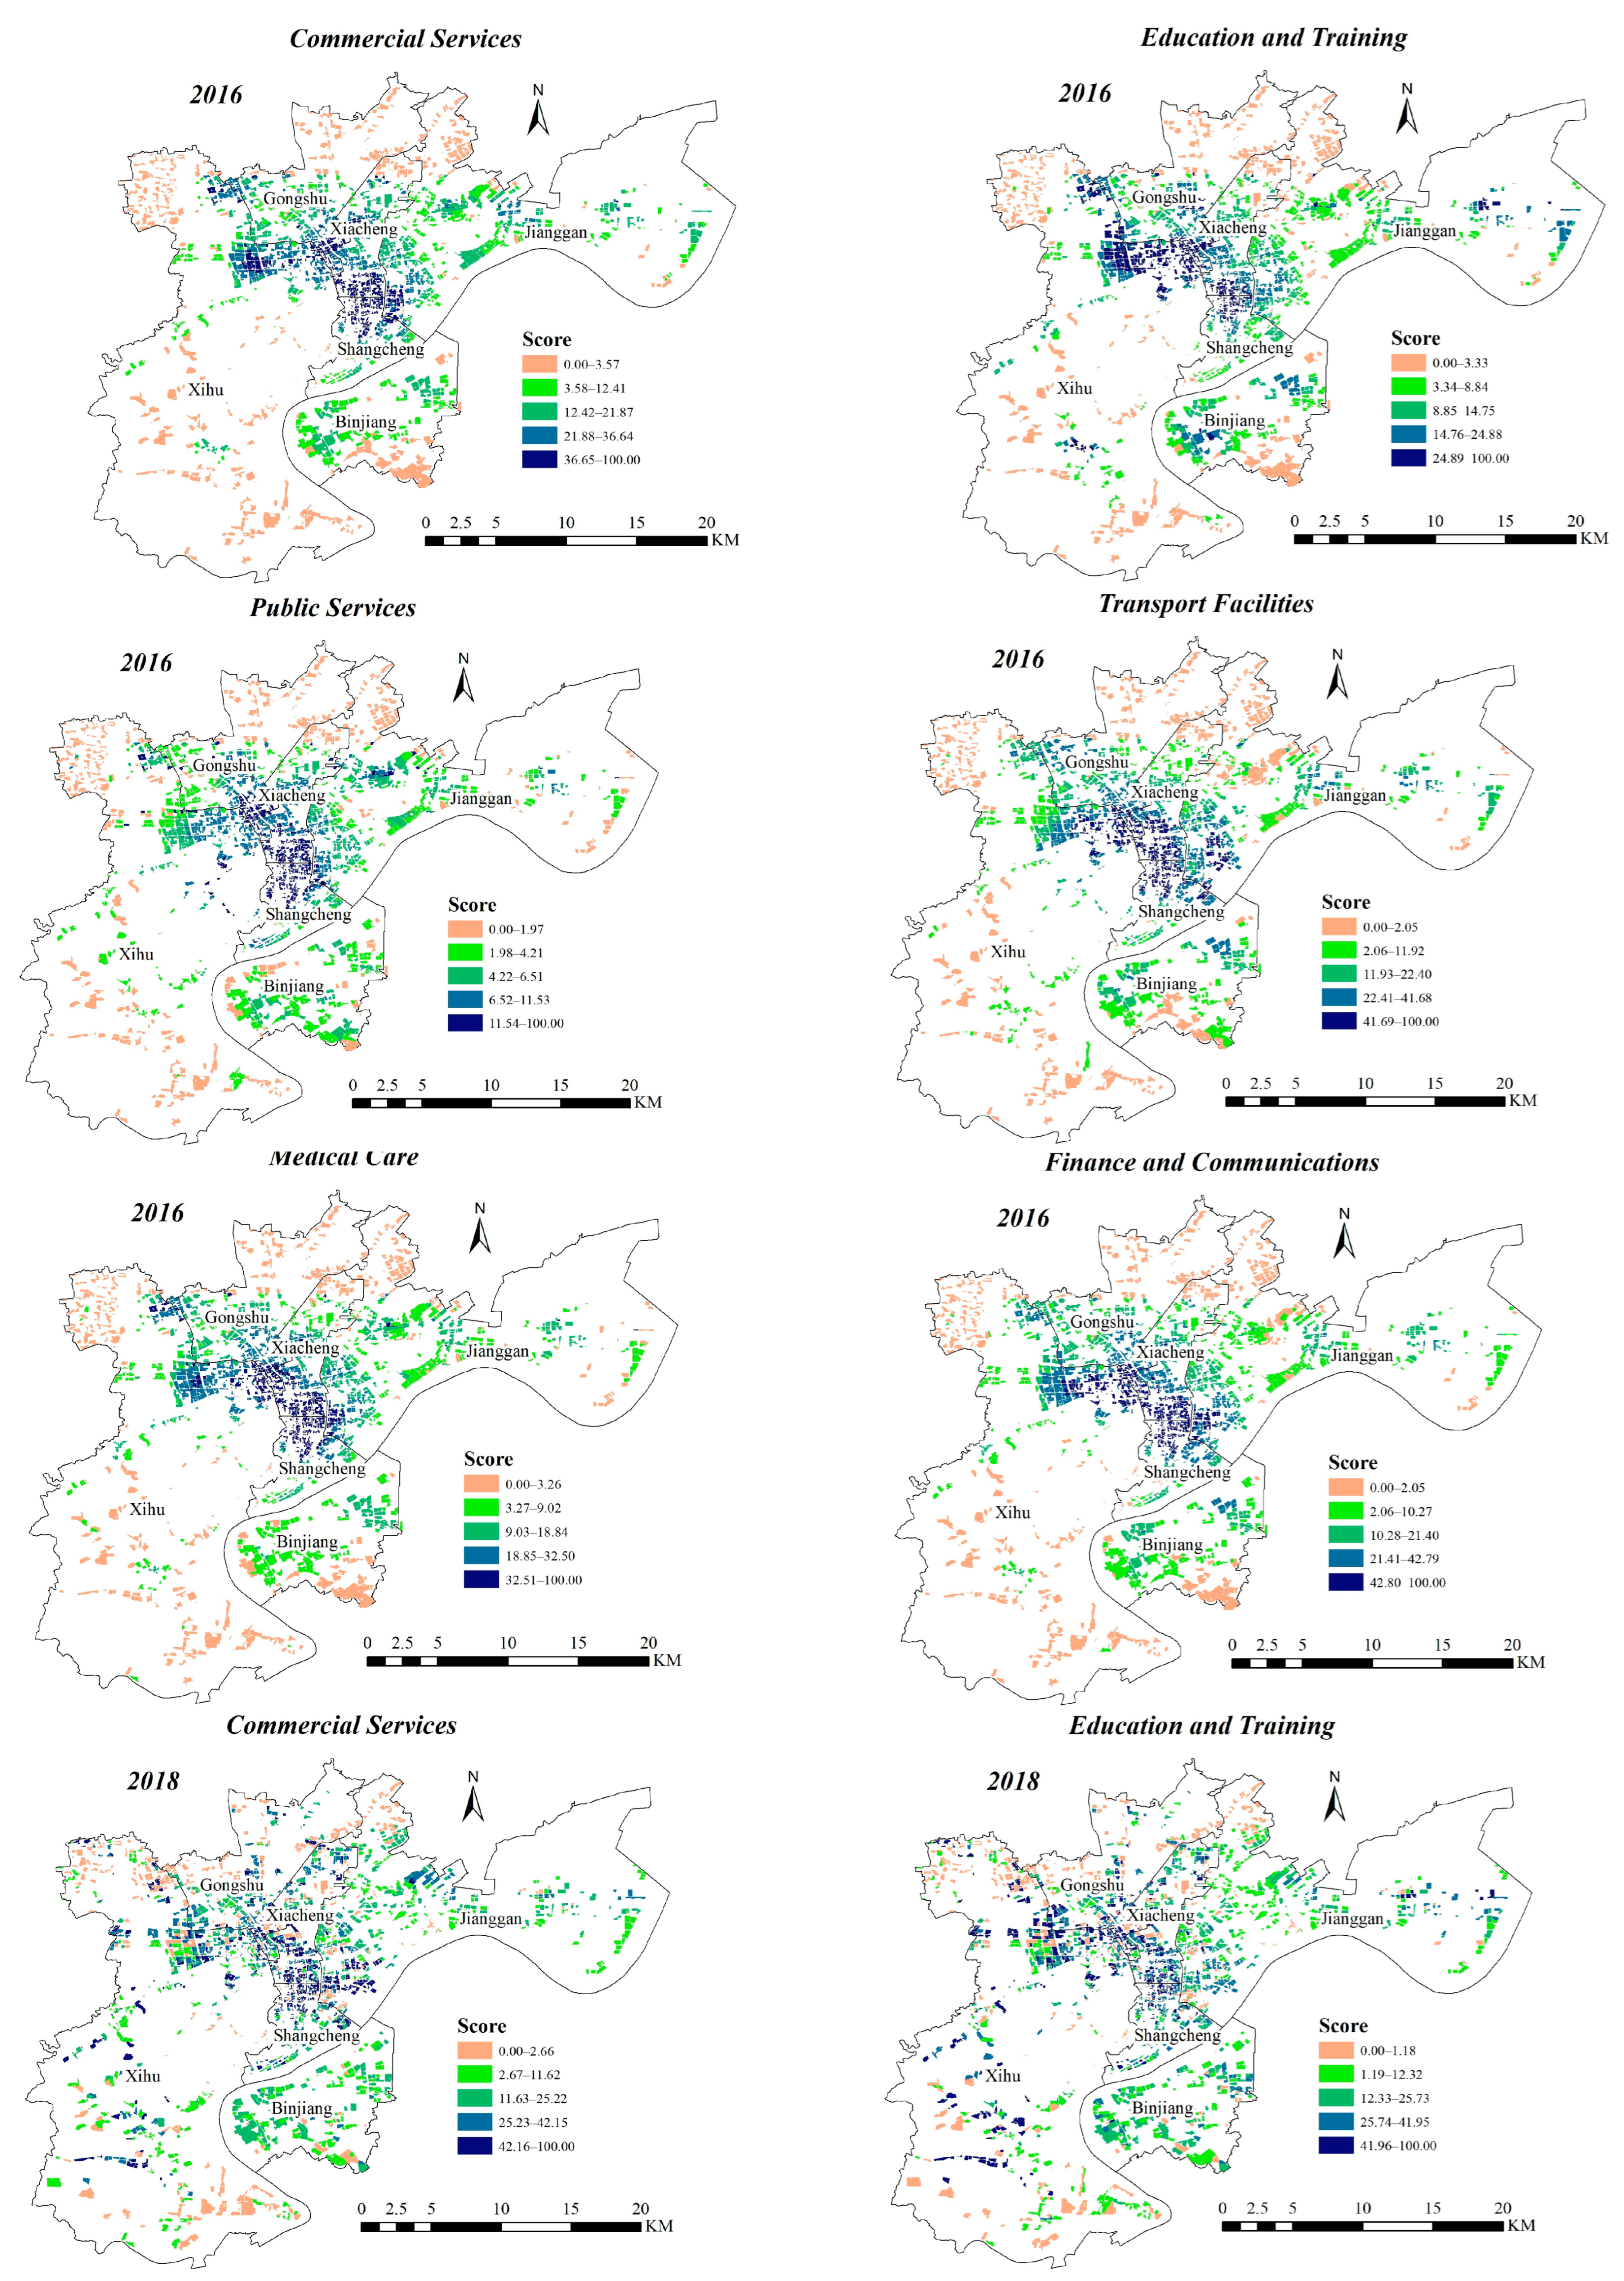
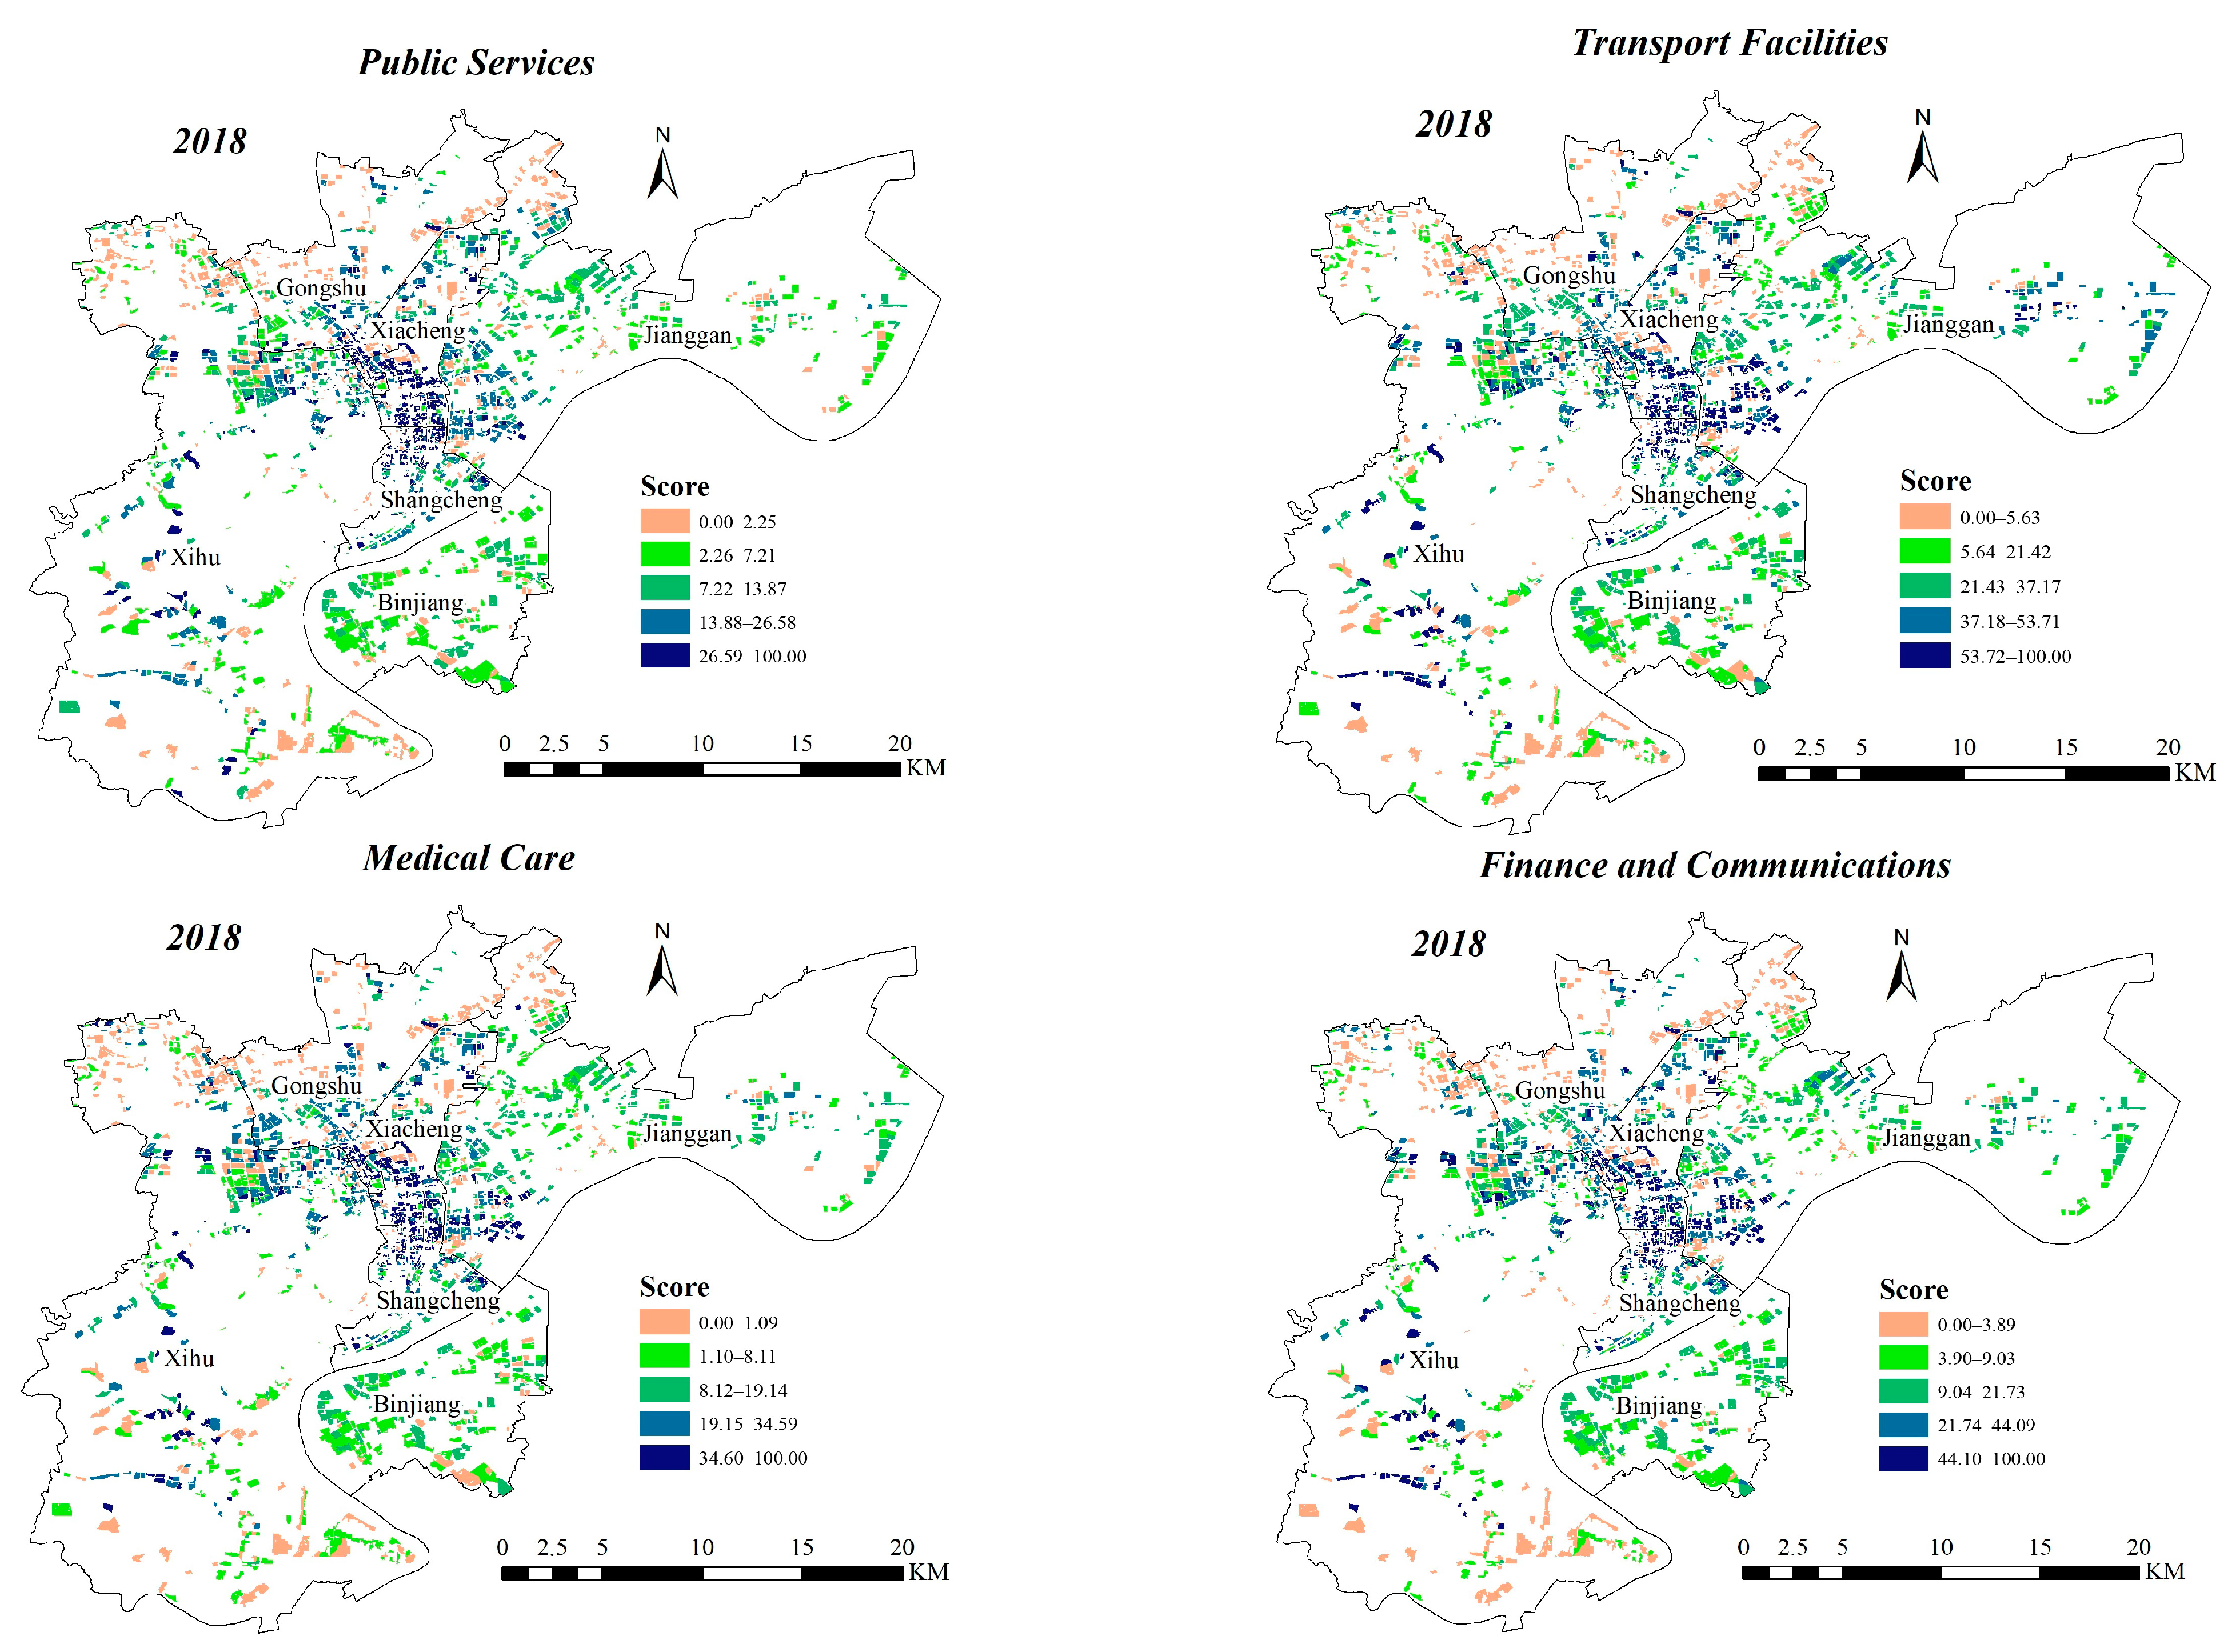
3.1. Spatiotemporal Patterns of Neighborhood Walkability from 2016 to 2018

Figure 2 presents an improved trend of the overall walk score from 2016 to 2018 within the Hangzhou metropolitan area. In 2016, from the central area to the suburb, there was a significant circle-like distribution pattern of walkability from high to low. Specifically, the overall walk score was higher within the Shangcheng and Xiacheng districts, while that in Jianggan, Binjiang, and Gongshu was lower. In 2018, the overall walk score of the Xihu district was largely improved, but in Binjiang and Jianggan, it was still relatively low.
As exhibited in Figure 3, the subtype walk score showed similar distribution characteristics with the overall walk score. To be specific, in 2016, the Shangcheng and Xiacheng districts generally had a higher subtype walk score of the six categories. With respect to the community commercial services subtype walk score, it was higher in the northern part of the Xihu district. For the community education and training subtype walk score, the northern part of Xihu and the central area of Binjiang were higher, while the peripheral areas of the Xihu district and Gongshu districts were lower. For the community public services subtype walk score, the northwest part of the Xihu district and the southern part of the Gongshu district were higher, while the northern part of the Jianggan district was lower. The community transport facilities subtype walk score, the community medical care walk score, and the community finance and communication walk score also presented similar spatial patterns. In 2018, the Shangcheng and Xiacheng districts still presented higher subtype walk scores of the six categories. The majority of the communities have seen increased subtype walk scores compared with 2016, especially those within the Xihu district.

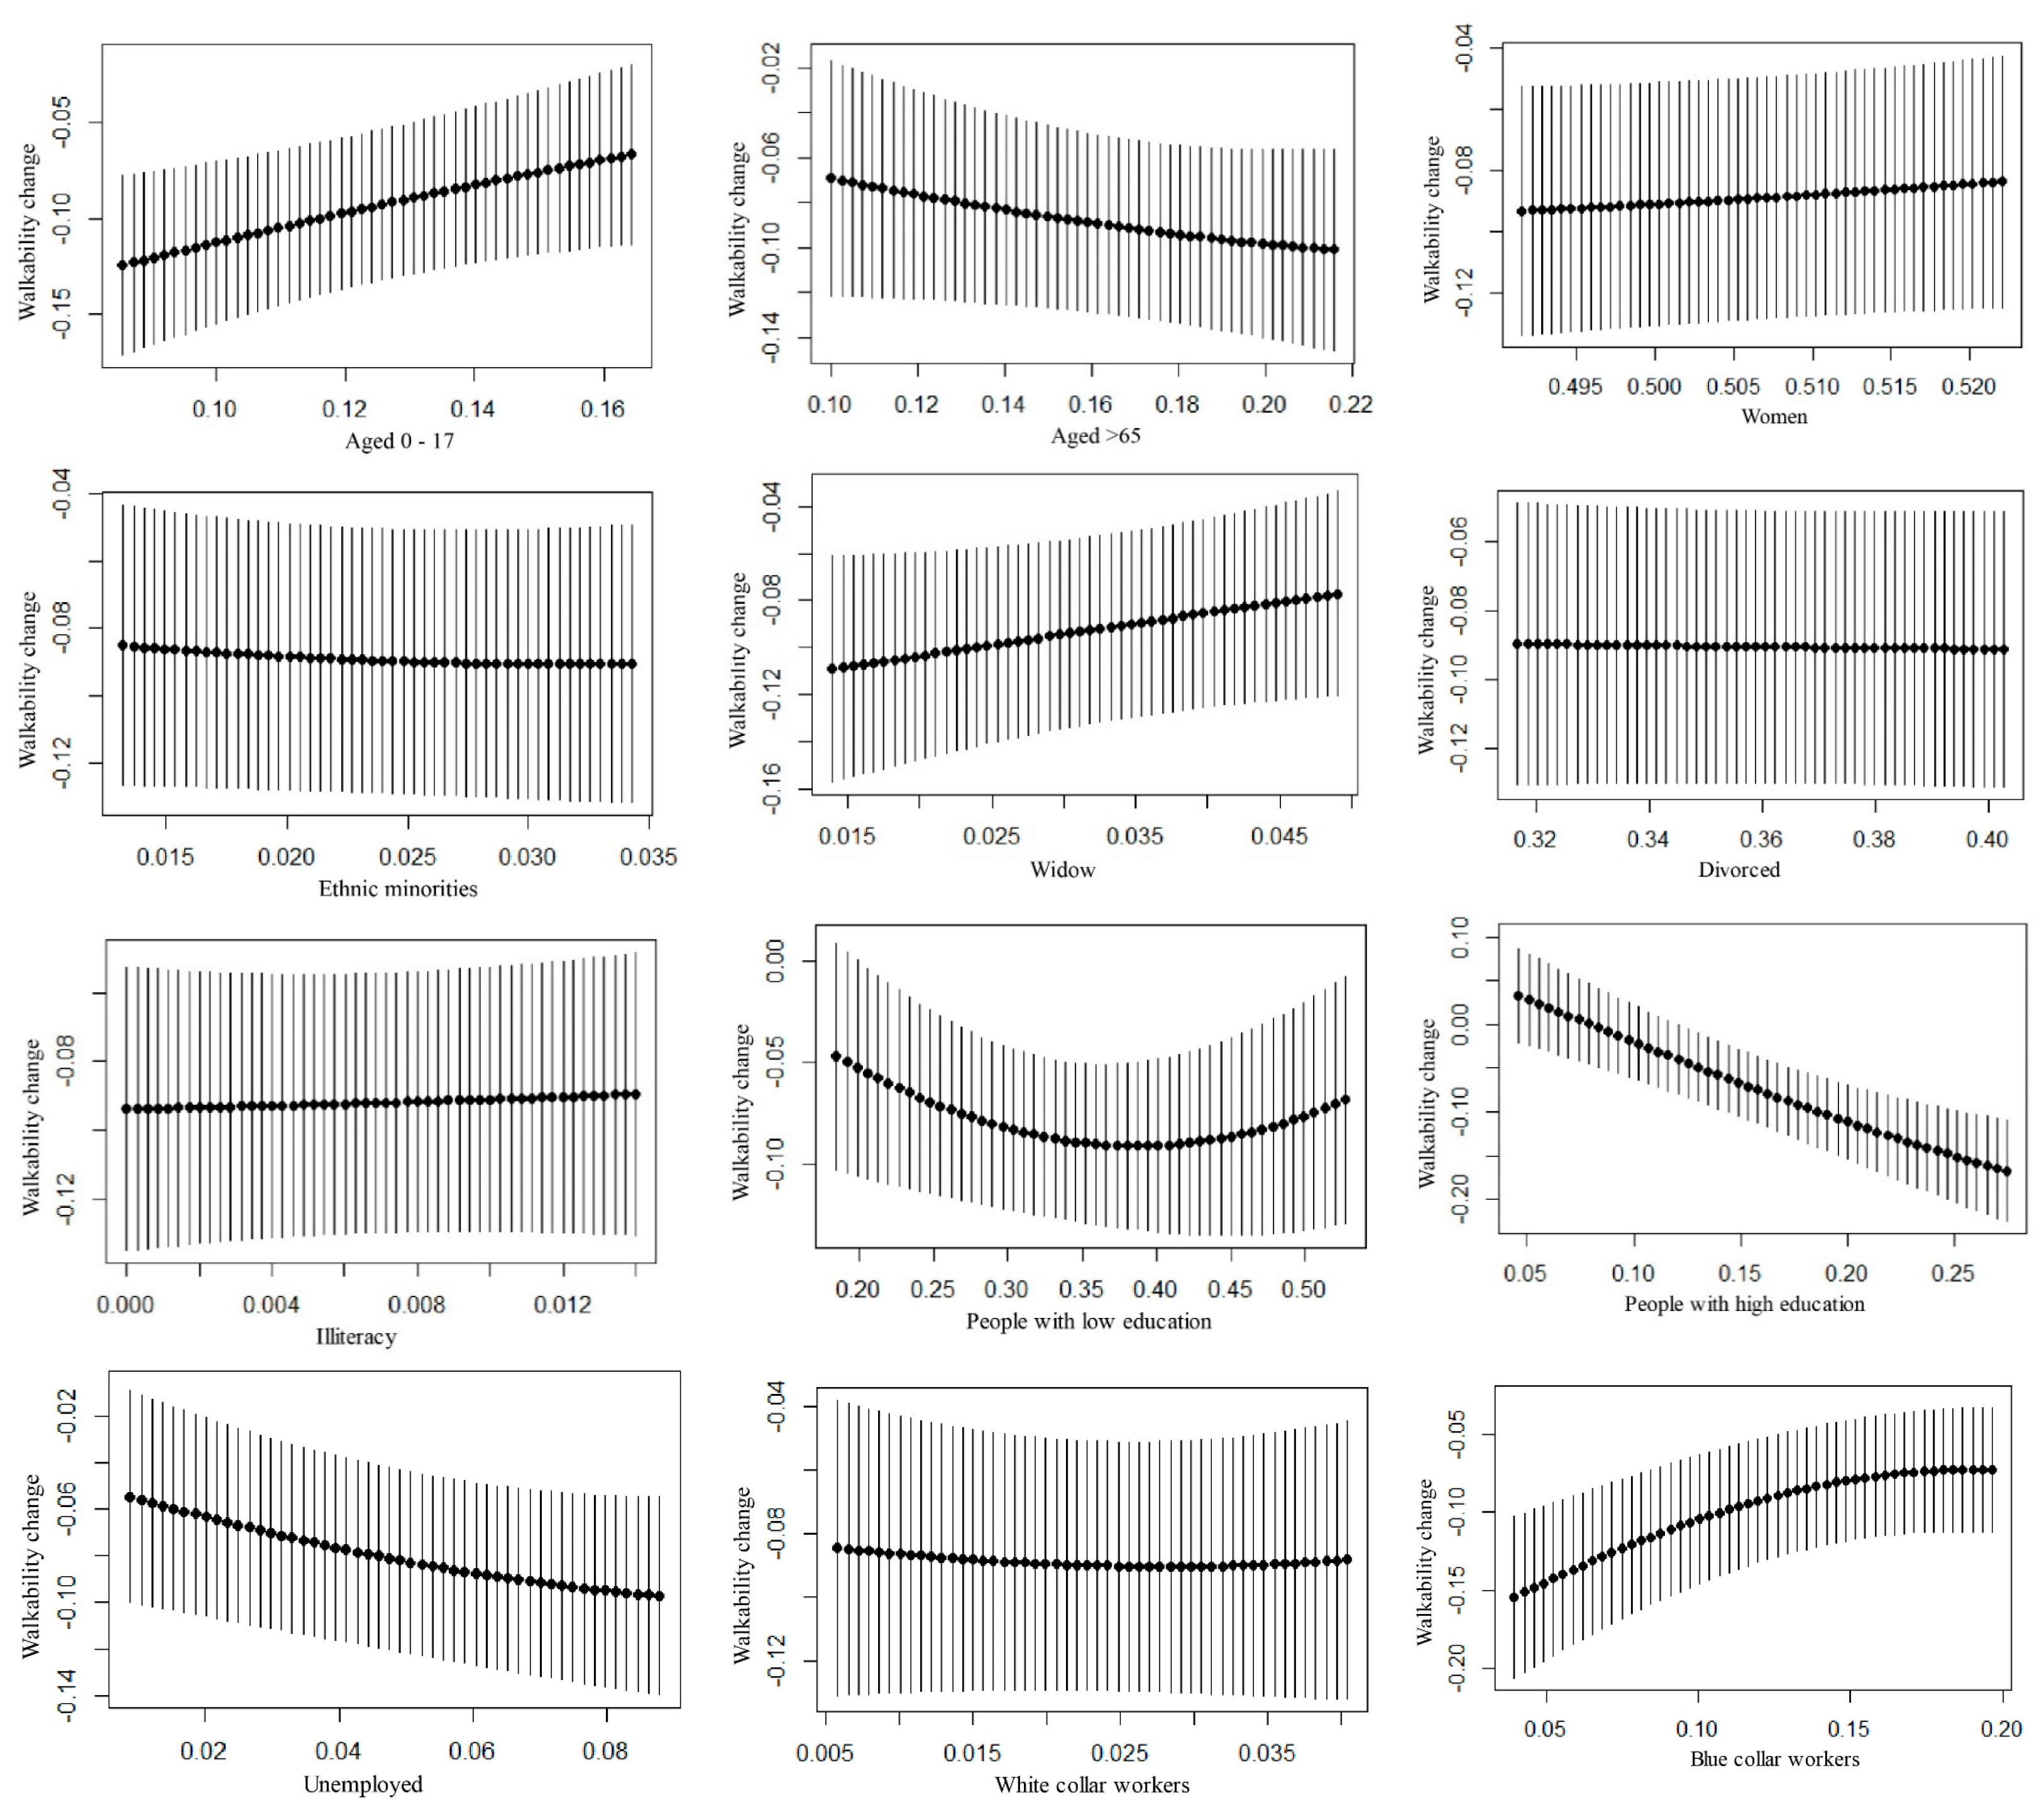
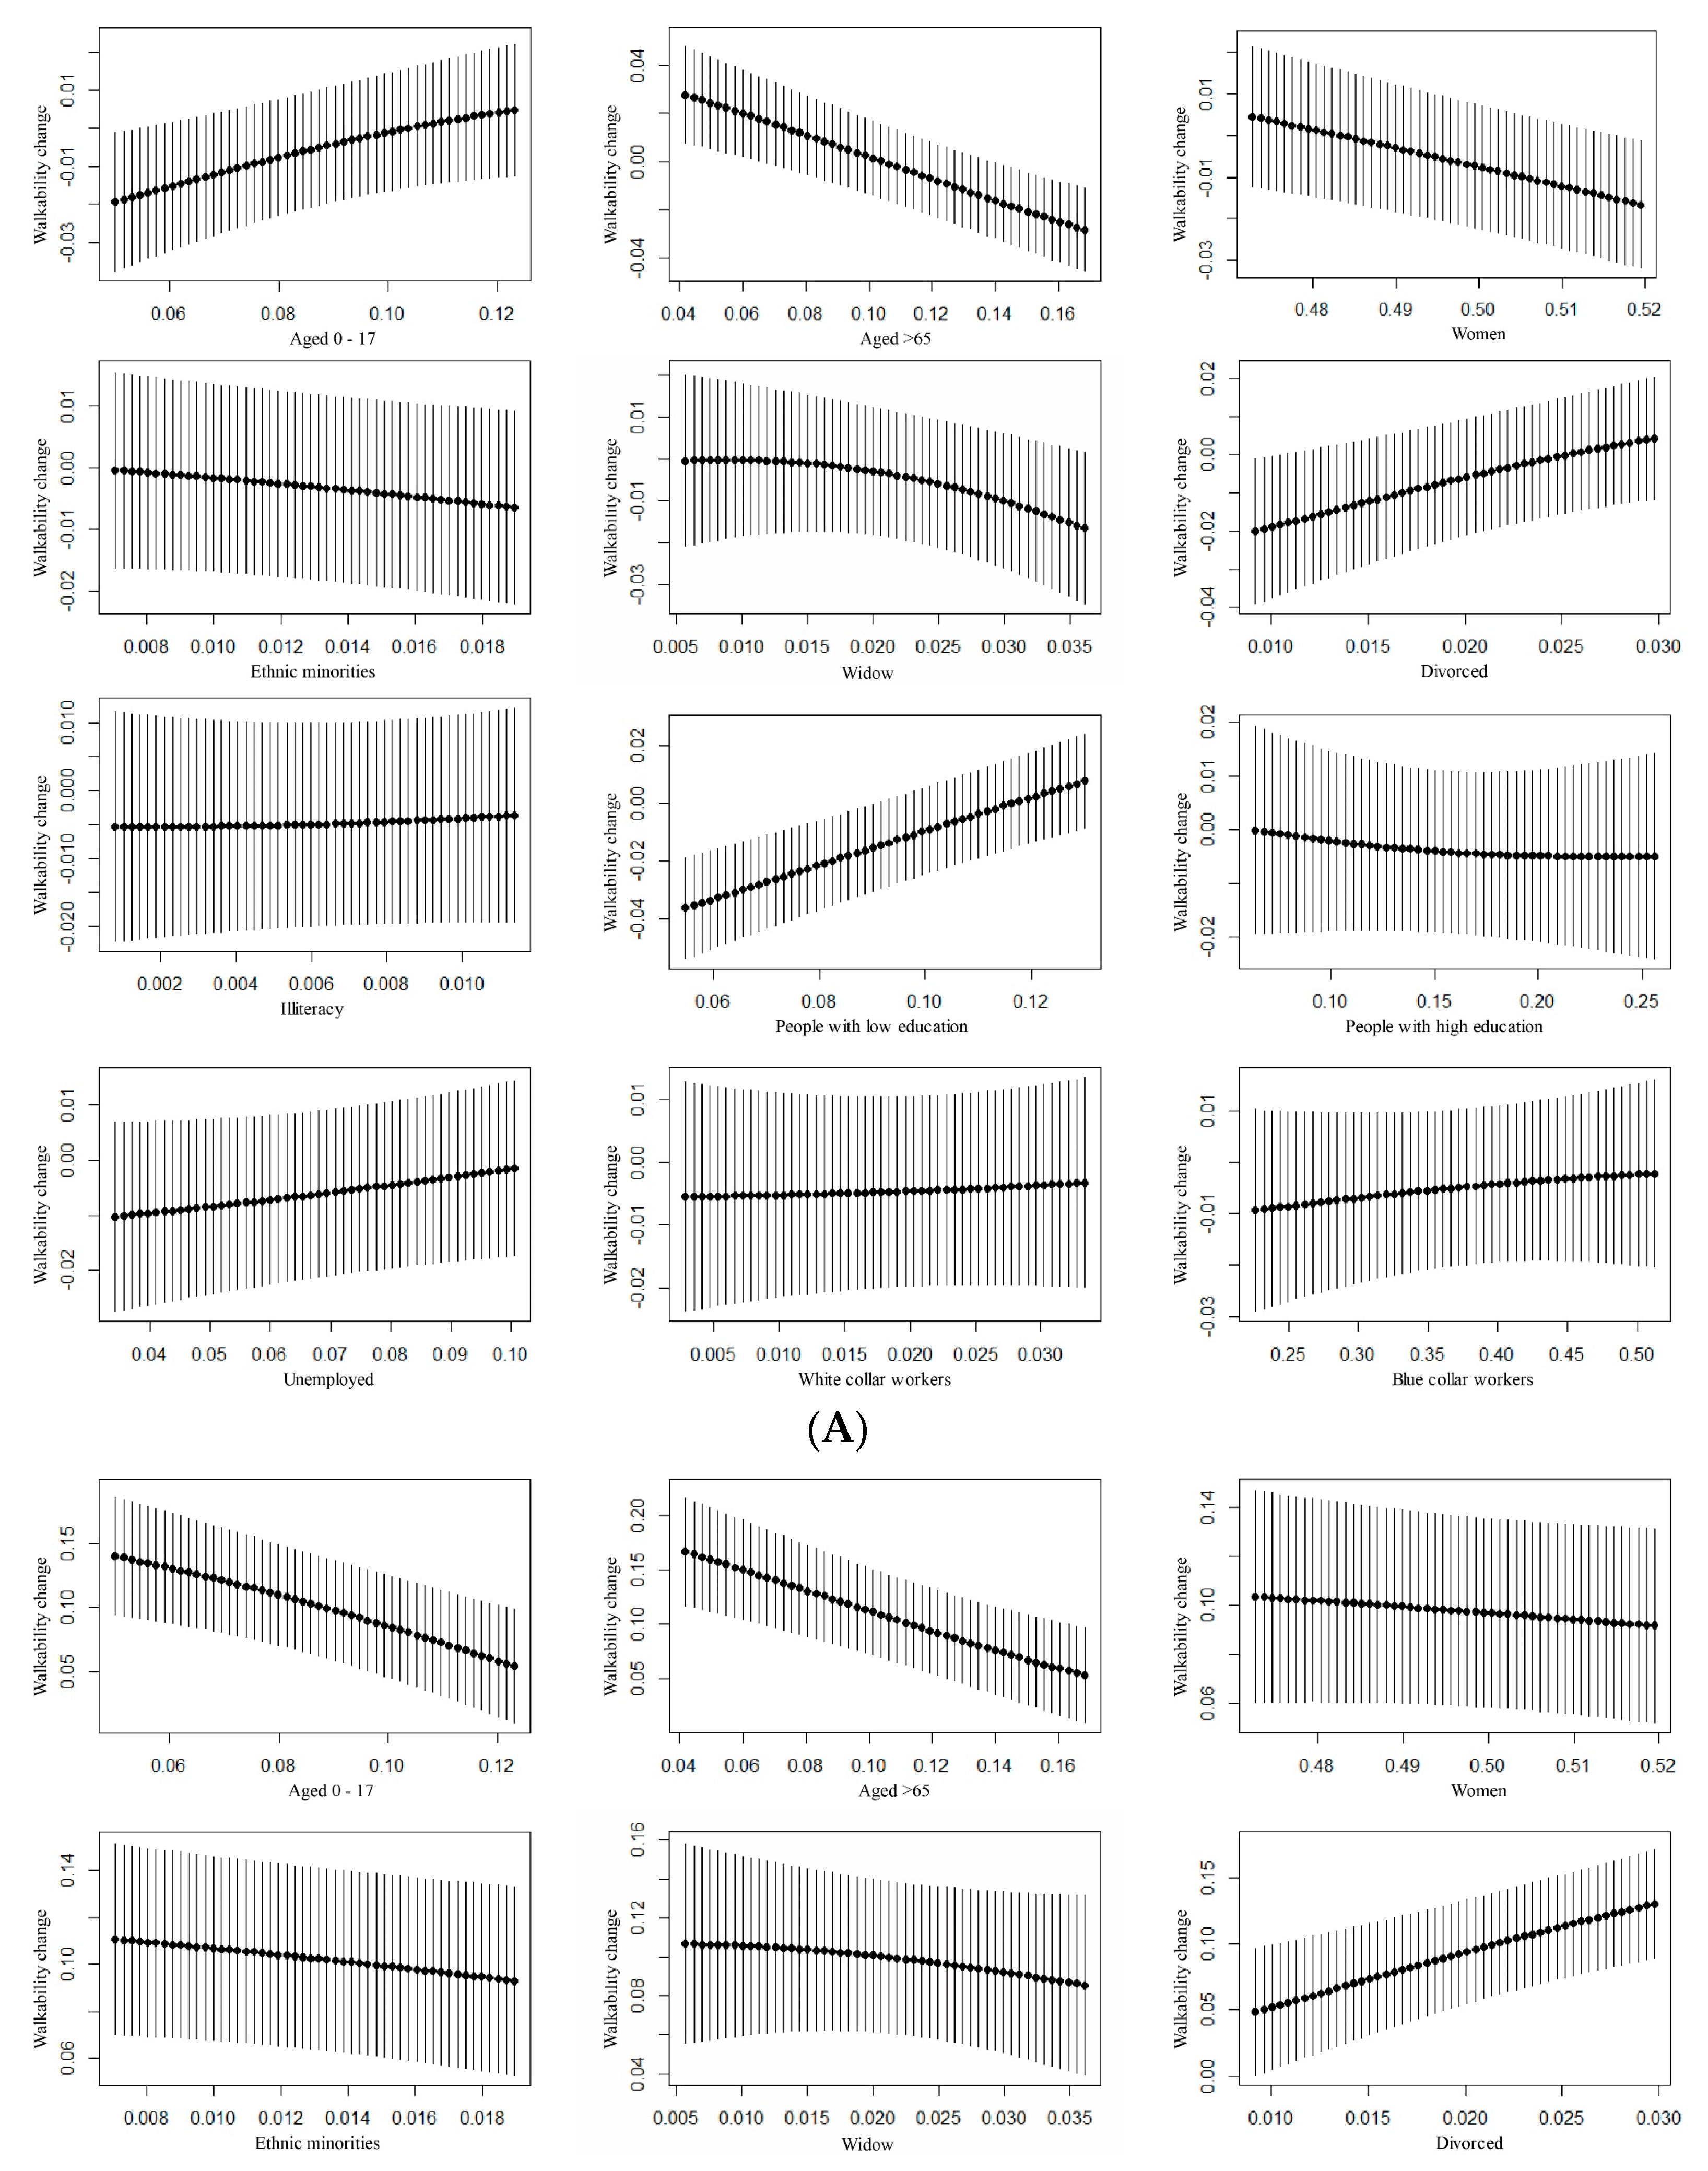
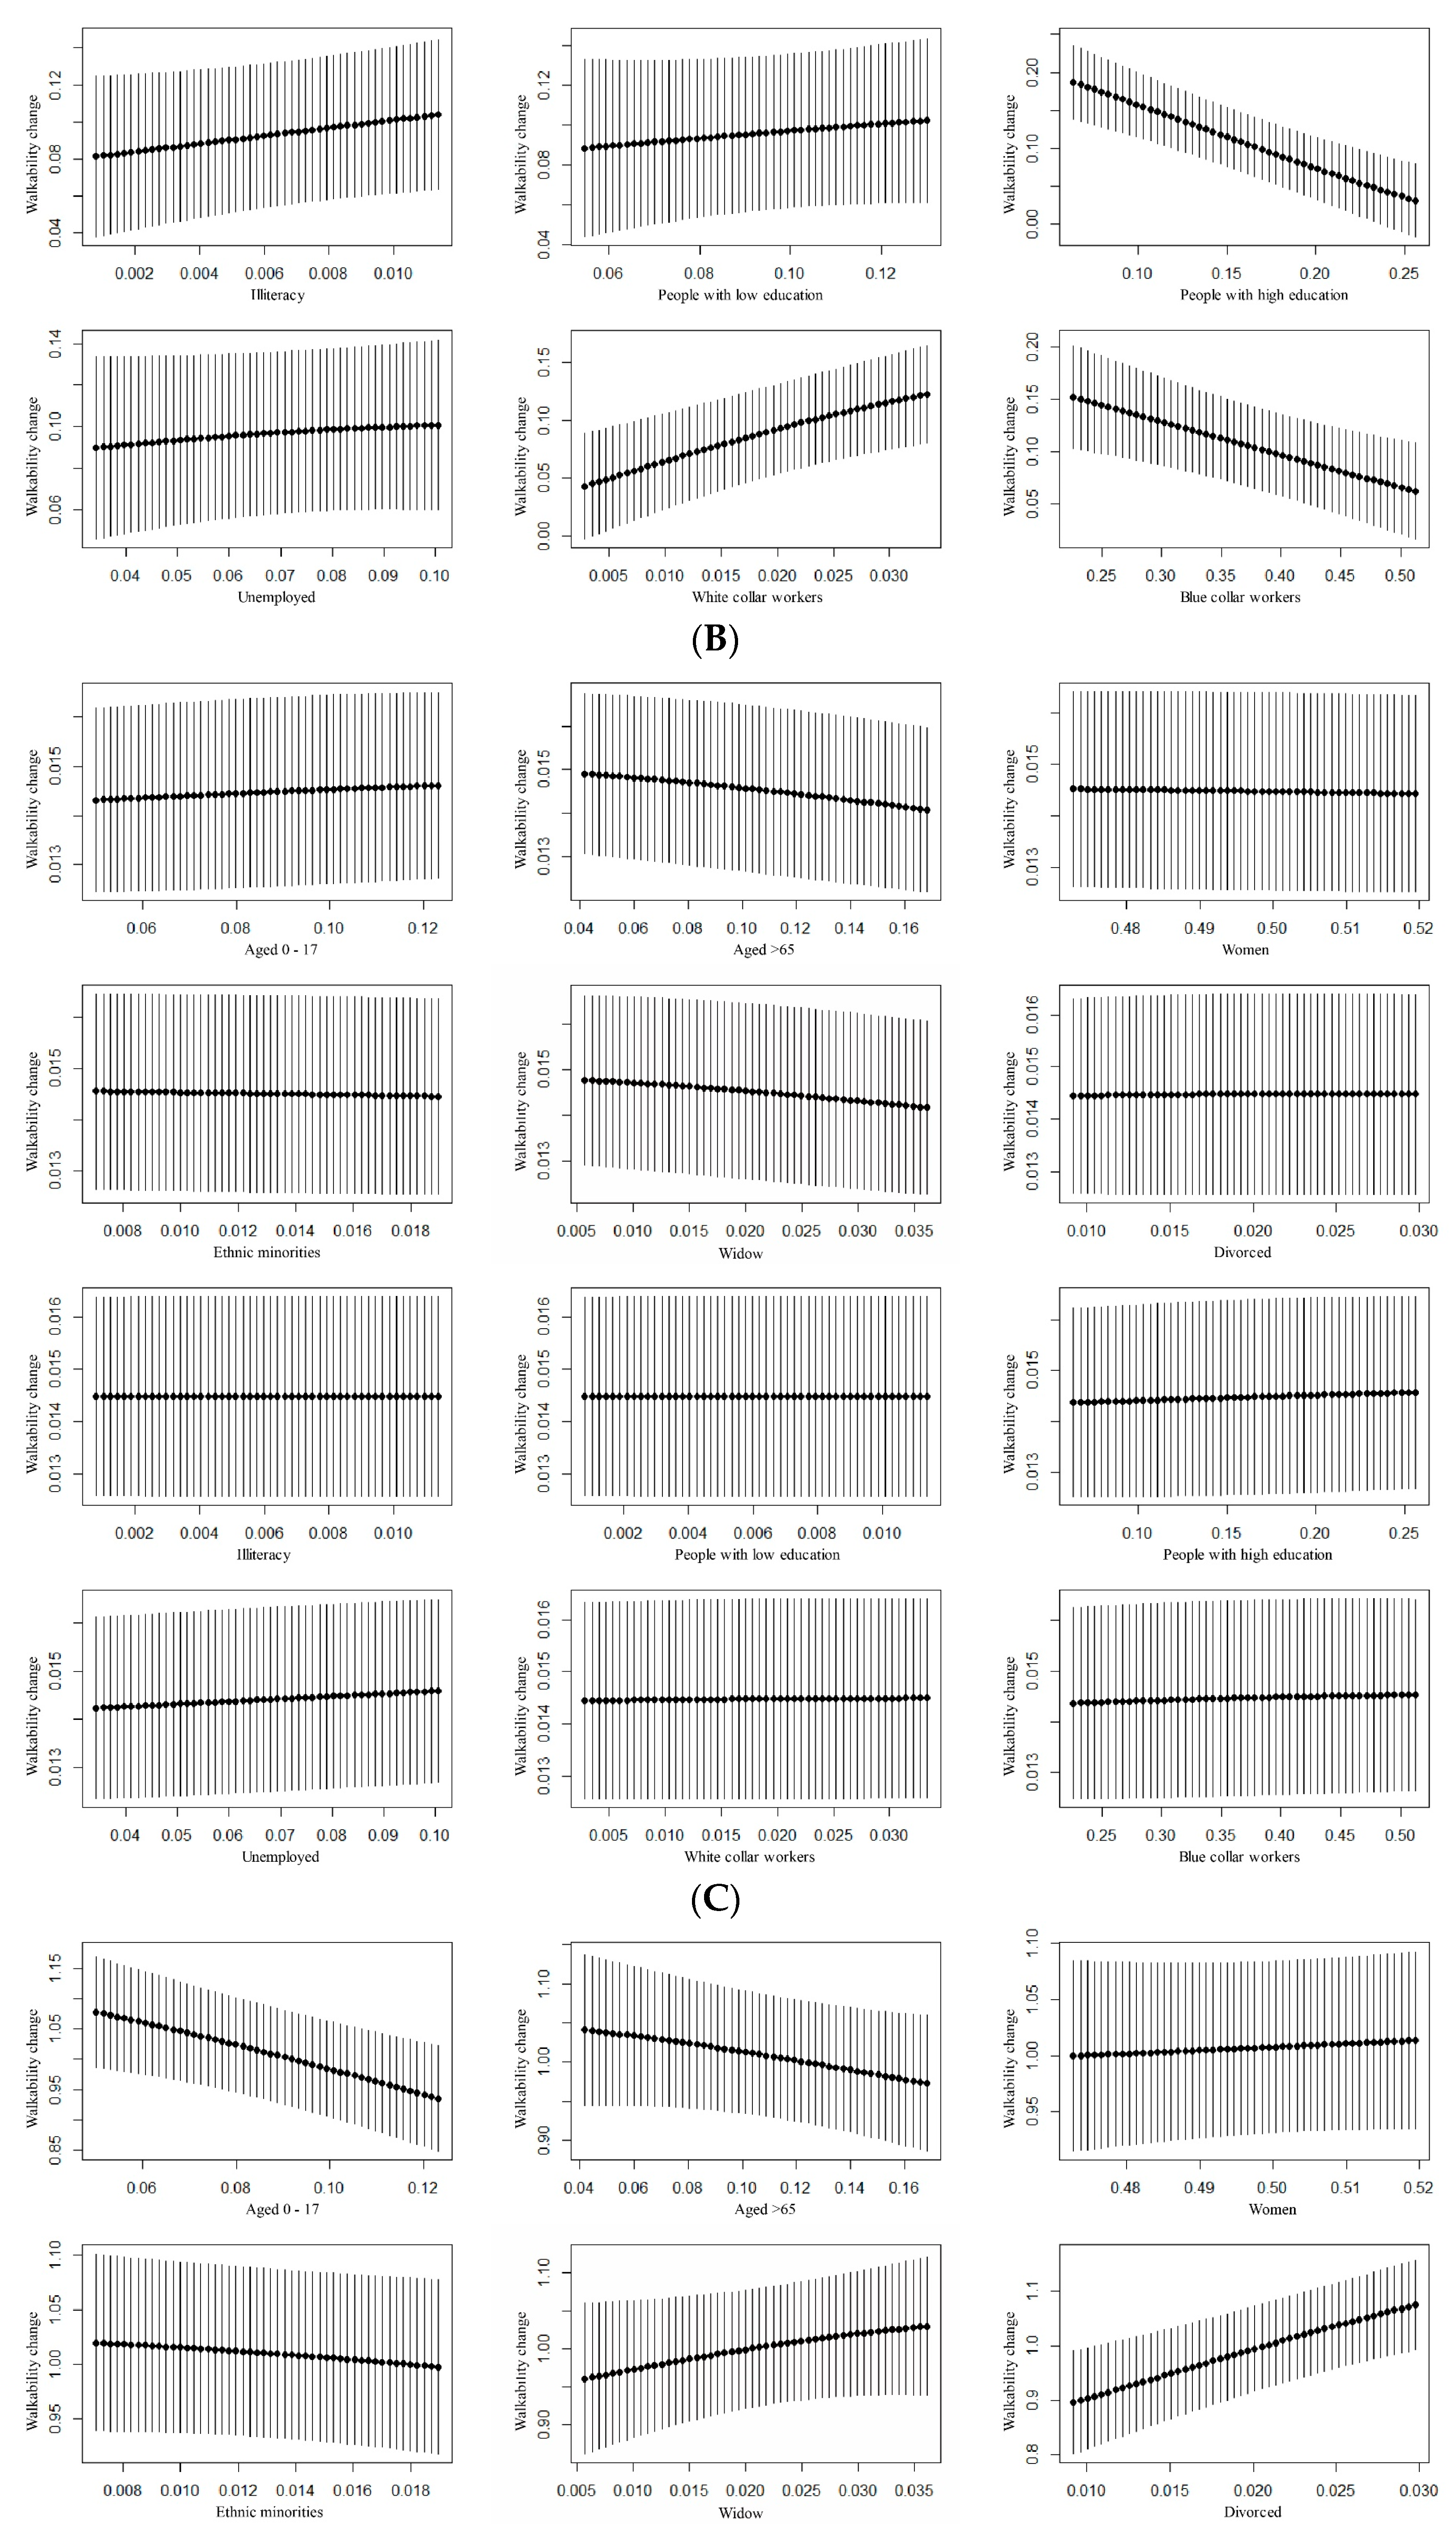
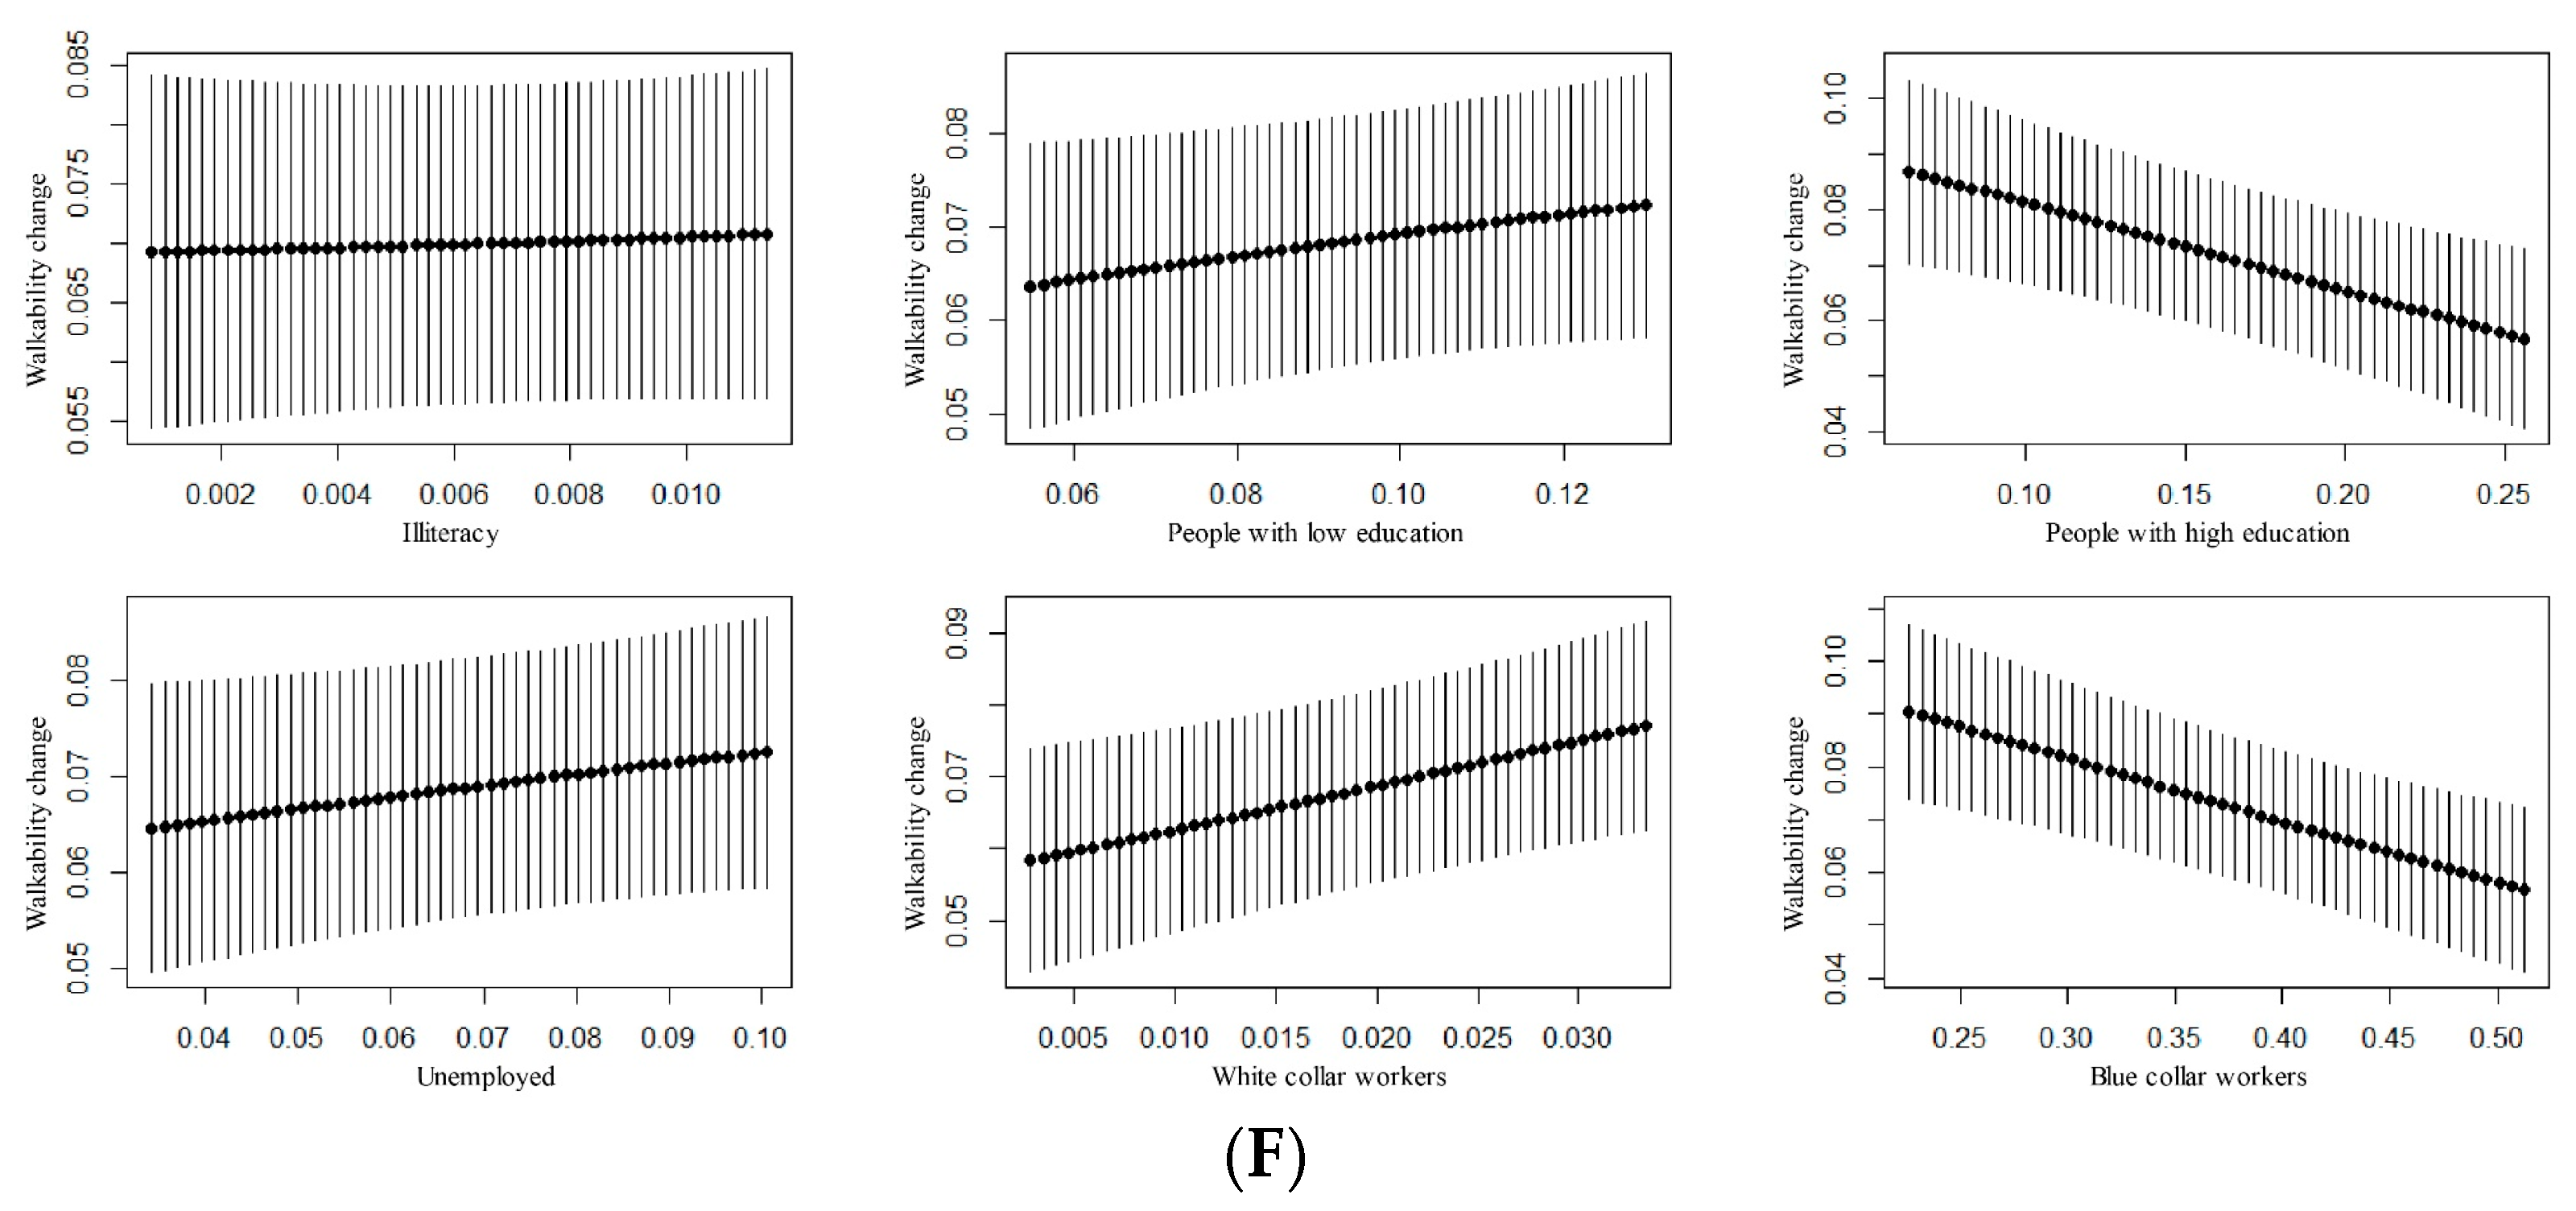
3.2. The Relationship between Neighborhood Deprivation and Walkability over Time

Table 4 shows the comparisons of the performances between the KRLS and OLS models for each regression. We found that the KRLS model had a clear advantage over the OLS model since the explanatory ability in terms of the R square value had been improved to a large extent for all regression models. Also, the LOOCVC values are comparable to R-squared values, illustrating the robustness of KRLS against overfitting. Figure 4 illustrates the relationship between neighborhood deprivation and overall walkability over time. To be clear, each graph in Figure 3 exhibits that the specific percentile values (e.g., the 25th, 50th, and 75th) of the marginal effect vary from observations of each deprivation indicator. Taking the number of people aged over 65 years old as an example, the coefficient presented great variability from the negative coefficient at the 25th percentile (−0.505) to the negative coefficient at the 50th percentile (−0.155), and to the positive coefficient at the 75th percentile (0.102). Such a discovery highlighted that only the communities with an extremely high percentage of elderly people would experience an increasing trend in overall walkability over time, whereas the other communities were likely to witness a declining tendency in overall walkability over time. Such a changing trend was also discovered for the proportion of people with lower education, from a negative association to a positive association. For the other neighborhood deprivation indicators, the marginal effects were generally consistent and were negatively associated with overall walkability. These results foregrounded that neighborhoods with higher concentrations of deprived groups were not likely to enjoy improved overall walkability over time.
Figure 5 summarizes the relationships between neighborhood deprivation indicators and subtype walk score indices over time. For the community commercial services subtype walk score changes over time (Figure 5A), people aged between 0 to 17, people with low education, unemployed people, and blue-collar workers have positive associations, revealing that neighborhoods with higher concentrations of deprived groups would experience improved walkability to commercial services facilities. For the community education and training subtype walk score changes over time (Figure 5B), people aged between 0 to 17, people aged over 65, ethnic minorities, and blue-collar workers presented negative associations, denoting that neighborhoods with a higher percentage of deprived groups would possibly witness a decline in walkability to education and training facilities. For the public services subtype walk score changes over time (Figure 5C), all the deprivation indicators presented no significant relationships. For the community transport facilities subtype walk score changes over time (Figure 5D), people aged between 0 to 17, people aged over 65, people with low education, and a proportion of blue-collar workers presented negative associations, denoting that neighborhoods with a higher percentage of deprived groups would possibly witness a decline in walkability to transport facilities. On the contrary, the proportion of white-collar workers was positively correlated with the community transport facilities subtype walk score changes over time. This suggests that neighborhoods with higher concentrations of white-collar workers would enjoy improved walkability to transport facilities over time. For the medical care facilities subtype walk score changes over time (Figure 5E), all the deprivation indicators presented no significant relationships. For the community finance and communication facilities subtype walk score changes over time (Figure 5F), people aged between 0 to 17, people aged over 65, people with low education, and the proportion of blue-collar workers presented negative associations, while the proportion of white-collar workers showed positive associations. This further denotes the decline in walkability over time for deprived neighborhoods.

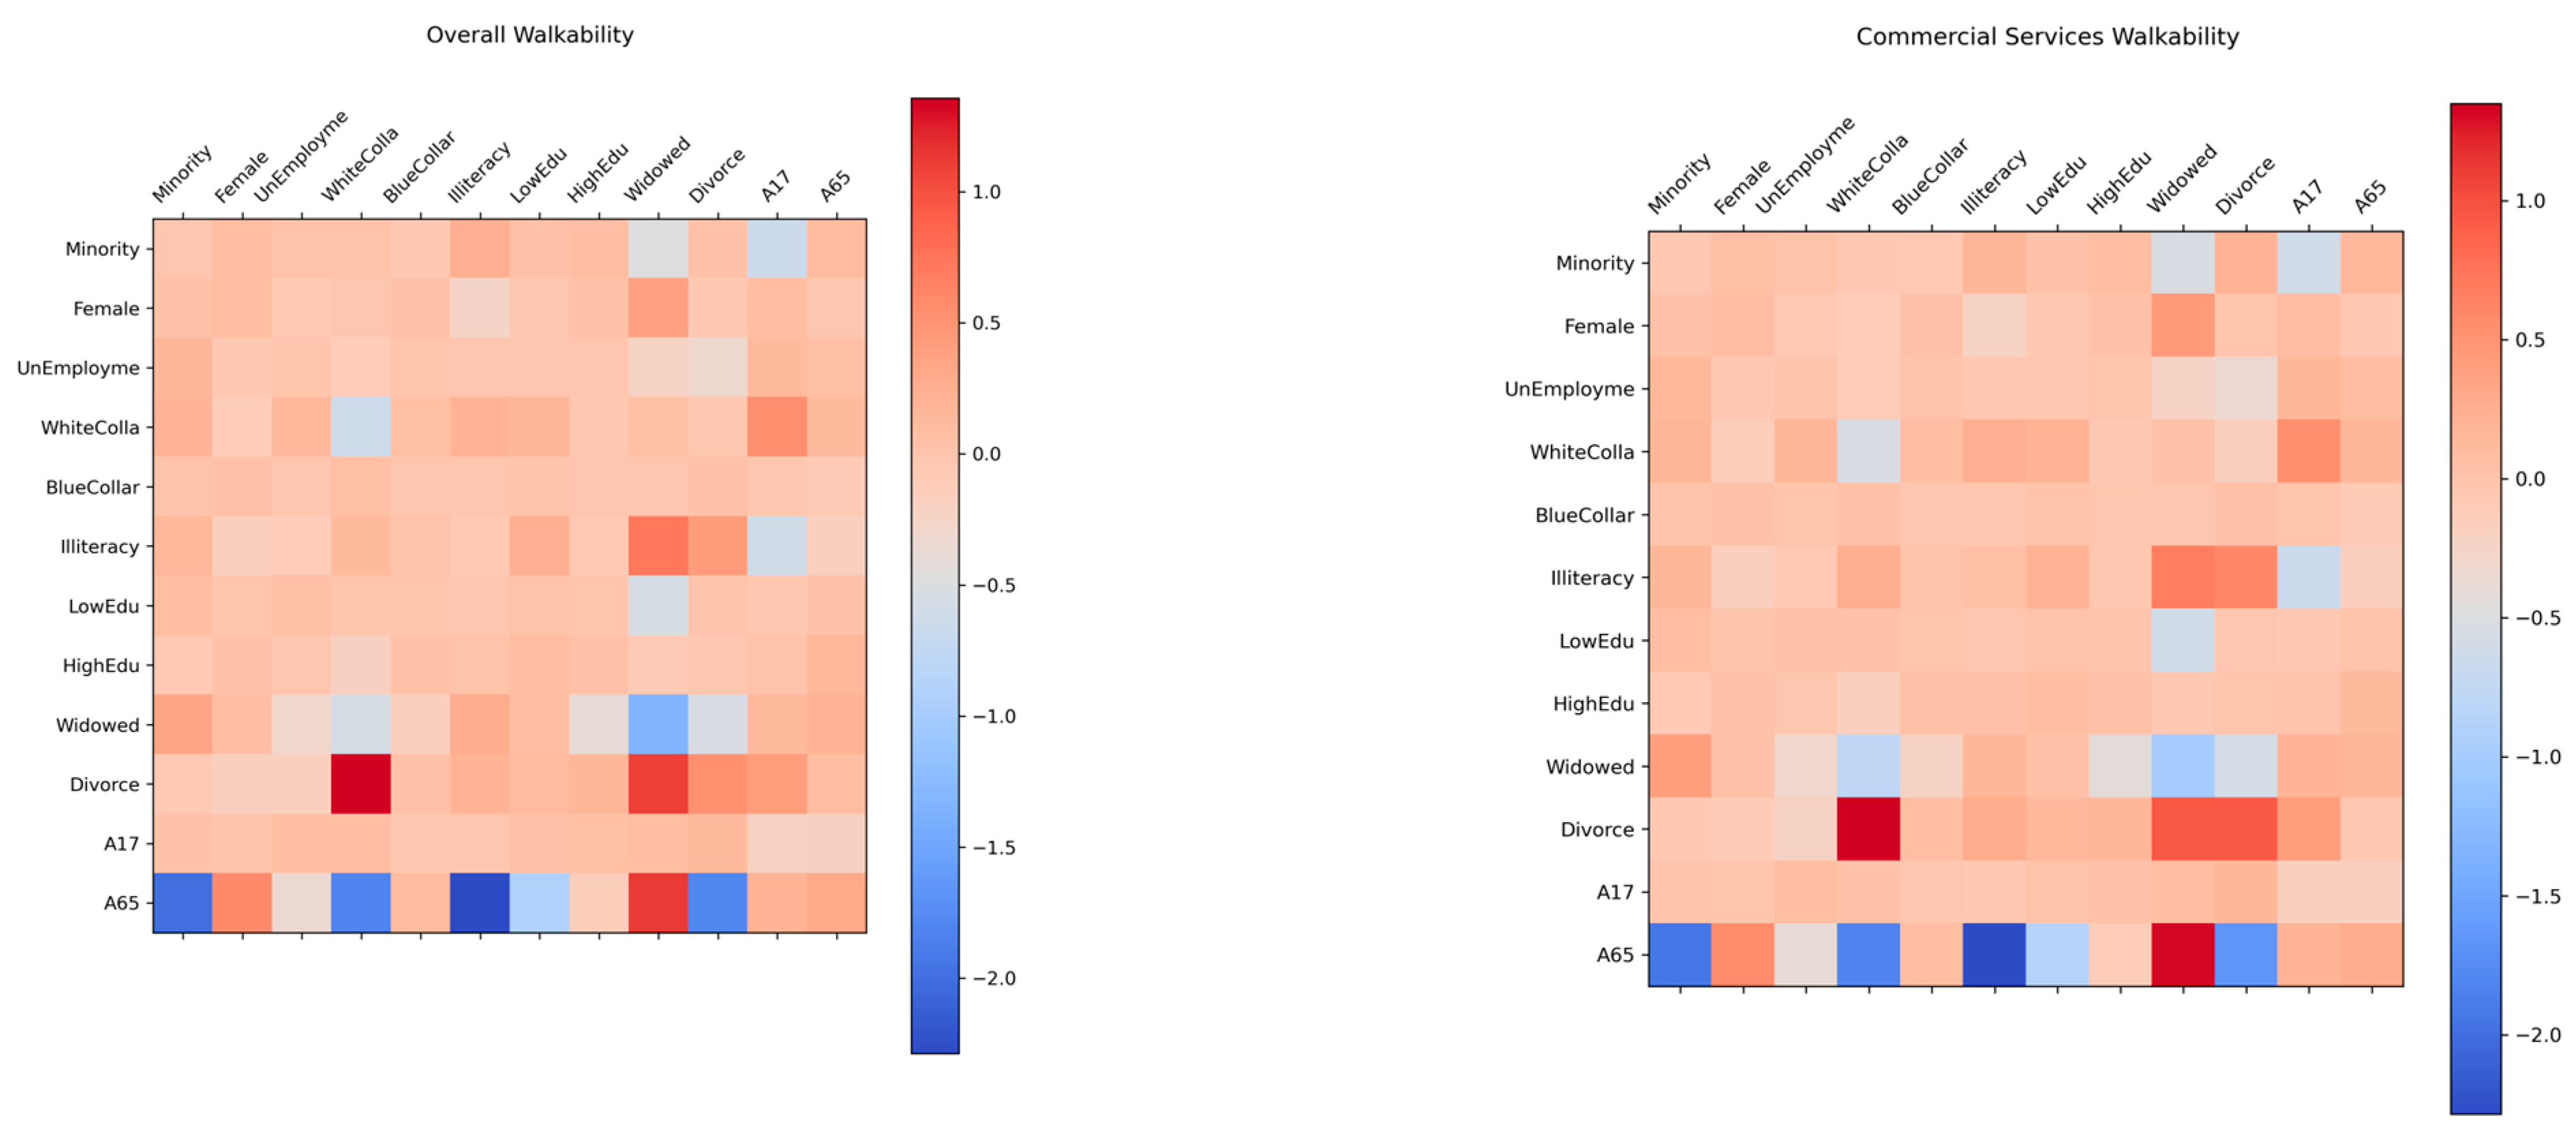
3.3. Interactions among Neighborhood Deprivation Indicators

Figure 6 exhibits the interactions among neighborhood deprivation indicators. A consistent tendency is observed for the overall walkability and subtype walkability. To be specific, a positively higher contribution is found for the interaction between the proportion of divorced individuals and the proportion of blue-collar workers, between the proportion of divorced individuals and the proportion of illiteracy, as well as between the proportion of divorced individuals and the proportion of elderly people aged over 65. This indicates that marriage status should interact with age, education, and occupation closely in explaining neighborhood walkability changes. This also suggests that neighborhoods with deprivation in these four dimensions are prone to experience improved overall and subtype walkability. On the contrary, the interactions between the proportion of elderly people aged over 65 and other deprivation indicators contribute to walkability changes in a negatively high manner. This confirms the results presented in Figure 5 and further highlights that the multidimensional deprivation in walkability should be more significant in neighborhoods with higher concentrations of elderly people.

4. Discussion and Conclusions

Drawing on how neighborhood walkability changes over time in association with deprivation, this paper first characterized neighborhood overall and subtype walkability using a revised walk score and then unraveled the relationship between neighborhood deprivation and walkability over time using a novel machine learning algorithm. The results showed that both community overall walkability and subtype walkability in the Hangzhou metropolitan area improved from 2016 to 2018. In addition, due to the significant improvement in the walkability of the Xihu district, the circle-like distribution pattern of higher walkability in the central region to lower walkability in the marginal region has changed. The distribution pattern was similar to the result of Su et al. [4], who measured the walkability in Hangzhou in 2017 and found that the walkability in Shangcheng, Xiacheng, and Xihu was relatively higher. On the contrary, Fan et al. [49] reported that Hangzhou experienced decreased or stable walkability during 2000–2010. In this regard, our findings fully affirm the progress toward creating a walkable environment in Hangzhou in recent years. In order to unpack the contributors to increased walkability, we applied the chain substitution method [28,29,50] to determine the relative contribution of the structural factors (e.g., amenities and pedestrian features) of the walkability score. We found that amenities and pedestrian features, respectively, accounted for on average of 85% and 15% of the changes of overall neighborhood walkability. The higher contribution of amenities to neighborhood walkability was mainly due to the new Master Plan promulgated in 2016, which aimed to provide extra education, medical and health services, and other resources to the deprived areas. We further noticed that people over 65 years old and ethnic minorities were still vulnerable to walkability change. However, the proportion of other disadvantaged groups, such as people aged between 0 to 17 years old, women, and unemployed people, had a positive relationship with the community’s overall walkability change. In general, although social inequality in walkability has been improved in the Hangzhou metropolitan area, some disadvantaged groups such as the elderly and ethnic minorities should remain the focus of future policy attention and services.
For the relationship between subtype walkability and neighborhood deprivation, we found that the community public services walkability change and the community medical care walkability change had no significant relationship with deprivation. But for the other four types of walkability changes, people aged over 65 years old, ethnic minorities, and people with high education were typically disadvantaged groups that showed a negative relationship with the community walkability change. Divorced people, unemployed people, and white-collar workers were typically advantaged groups that showed a positive relationship with the walkability change. These results were consistent with the previous study conducted by Rundle et al. [51] and Engel et al. [52]. Another discovery was that the subtype walkability had different relationships with neighborhood deprivation. Among them, children and divorced individuals were still exposed to a deprived transport walkability environment. What is more, regarding the interactions among the deprivation indicators, we distinguished that marriage status and age were the key indicators in predicting neighborhood walkability changes over time. These indicators interact closely with other deprivation indicators and can be used as essential references for formulating planning guidelines. Studies have shown that infrastructure construction for a walkable environment can promote people’s willingness to travel [44]; it can promote residents’ mobility and health by providing appropriate services for walkers [53]. Since the social inequality in neighborhood walkability still exists, more policies and planning will be needed to solve these problems. For example, for the neighborhoods with higher concentrations of children, urban planners are expected to provision more transport amenities to enhance walkability. Besides, our study found that elderly individuals were still restricted from improved walking environments, especially in the context of China’s severe aging society [54,55]. The walking environment of the elderly is the first urgent concern. Therefore, since the quality of the walking environment is dependent on several different factors [56], we should not only increase the number of facilities and improve road conditions to reduce the travel distance [57], but also increase the comfort of the walking environment by adding benches, so as to improve the walking environment and travel willingness of the elderly [58].
The major strengths of our study are that we have dealt with the community overall and subtype walkability changes over time and their relationship with neighborhood deprivation. Taking the residential quarter as the geographical study unit can clearly reflect the characteristics of the relationship at the micro-scale [59]. In addition, we utilize objective GIS-based measures instead of subjective evaluation, which can help us obtain more accurate and reliable results at a lower cost [60]. Compared with the traditional linear statistical method, the KRLS method we use is more likely to truly reflect the law in social problems, which may be nonlinear, especially for the highly interdependent neighborhood deprivation characteristics involved in our study. We believe that our approach provides a new idea to further measure walkability and utilize a more suitable method to deal with the problem of neighborhood deprivation interdependence. The demonstrated methodology requires no specific expertise in computation and is relatively easy to perform. It is also geographically flexible enough to be extended into other land use research fields and applied into other urban settings both in developing countries and developed nations. Additionally, the walk score framework is engaged with data analysis, which should lay a solid theoretical foundation for the calculation of walkability. Thus, the produced empirical evidence should add to knowledge regarding how and why walkability changes with neighborhood deprivation.
Several limitations should also be noted. On the one hand, our research is based on objective GIS data but does not take into account human perception evaluations, such as crowding levels and human flow, which have been confirmed to have an important effect on walkability [61]. On the other hand, the data used in the study has a span of 3 years, but the time interval is a little short to fully obtain a universal law of neighborhood walkability in relation to deprivation. Furthermore, only three indicators of pedestrian features were used to modify the walk score. Other pedestrian features, such as the networks of bicycle lines, traffic congestion, and problems with the parking of individual cars, denivelation of pedestrian paths, continuous development of space, and attractive contents in the surrounding environment, which influence walking trips in urban areas, are not incorporated. To date, the academic circle has not worked out a practical solution to integrating objective and subjective measures of walkability. Future studies are expected to address such a challenge and collect high quality data of pedestrian features. What is more important is that future research should examine walkability in different environments, and the most typical ones are the physical environment, social environment, and cultural environment. Further exploration into how these factors influence walkability would also be beneficial, considering that differential preferences for certain amenities or public spaces might affect contextualized walkability.

Author Contributions

Methodology, G.L.; Writing—original draft, Q.W.; Writing—review & editing, M.W. All authors have read and agreed to the published version of the manuscript.

Funding

This paper is supported by the Humanities and Social Science Fund of Ministry of Education of China (No. 23YJA890036).

Data Availability Statement

The original contributions presented in the study are included in the article, further inquiries can be directed to the corresponding author.

Conflicts of Interest

The authors declare no conflicts of interest.

References

  1. World Health Organization: Obesity and Overweight Fact Sheet No 311. Available online: https://www.who.int/news-room/fact-sheets/detail/obesity-and-overweight (accessed on 7 May 2024).
  2. Caballero, B. Introduction Symposium: Obesity in developing countries: Biological and ecological factors. J. Nutr. 2001, 131, 866S–870S. [Google Scholar] [CrossRef] [PubMed]
  3. Schüle, S.A.; Bolte, G. Interactive and independent associations between the socioeconomic and objective built environment on the neighbourhood level and individual health: A systematic review of multilevel studies. PLoS ONE 2015, 10, e0123456. [Google Scholar] [CrossRef]
  4. Su, S.; Zhou, H.; Xu, M.; Ru, H.; Wang, W.; Weng, M. Auditing street walkability and associated social inequalities for planning implications. J. Transp. Geogr. 2019, 74, 62–76. [Google Scholar] [CrossRef]
  5. Selvakumaran, S.; Lin, C.; Hadgraft, N.; Chandrabose, M.; Owen, N.; Sugiyama, T. Area-level socioeconomic inequalities in overweight and obesity: Systematic review on moderation by built-environment attributes. Health Place 2023, 83, 103101. [Google Scholar] [CrossRef]
  6. Ogden, C.L. Trends in obesity among adults in the United States, 2005 to 2014. JAMA 2016, 315, 2284–2291. [Google Scholar]
  7. Su, S.; Pi, J.; Xie, H.; Cai, Z.; Weng, M. Community deprivation, walkability, and public health: Highlighting the social inequalities in land use planning for health promotion. Land Use Policy 2017, 67, 315–326. [Google Scholar] [CrossRef]
  8. Pereira, M.F.; Almendra, R.; Vale, D.S.; Santana, P. The relationship between built environment and health in the Lisbon Metropolitan area—Can walkability explain diabetes’ hospital admissions? J. Transp. Health 2020, 18, 100893. [Google Scholar] [CrossRef]
  9. Hoehner, C.M.; Handy, S.L.; Yan, Y.; Blair, S.N.; Berrigan, D. Association between neighborhood walkability, cardiorespiratory fitness and body-mass index. Soc. Sci. Med. 2011, 73, 1707–1716. [Google Scholar] [CrossRef]
  10. Lang, J.J.; Pinault, L.; Colley, R.C.; Prince, S.A.; Christidis, T.; Tjepkema, M.; Crouse, D.L.; de Groh, M.; Ross, N.; Villeneuve, P.J. Neighbourhood walkability and mortality: Findings from a 15-year follow-up of a nationally representative cohort of Canadian adults in urban areas. Environ. Int. 2022, 161, 107141. [Google Scholar] [CrossRef]
  11. United Nations: Transforming Our World: The 2030 Agenda for Sustainable Development. Available online: https://sdgs.un.org/publications/transforming-our-world-2030-agenda-sustainable-development-17981 (accessed on 14 February 2023).
  12. Higgs, C.; Badlands, H.; Simons, K.; Knibbs, L.D.; Giles-Corti, B. The Urban Liveability Index: Developing a policy-relevant urban liability composite measure and evaluating associations with transport mode choice. Int. J. Health Geogr. 2019, 18, 14. [Google Scholar] [CrossRef]
  13. Micelli, E.; Giliberto, G. Assessing Quality of Life and Walkability for Urban Regeneration: The Piave Neighbourhood in Mestre-Venice. Land 2023, 12, 2133. [Google Scholar] [CrossRef]
  14. Weng, M.; Ding, N.; Li, J.; Jin, X.; Xiao, H.; He, Z.; Su, S. The 15-min walkable neighbourhoods: Measurement, social inequalities and implications for building healthy communities in urban China. J. Transp. Health 2019, 13, 259–273. [Google Scholar] [CrossRef]
  15. Cutts, B.B.; Darby, K.J.; Boone, C.G.; Brewis, A. City structure, obesity, and environmental justice: An integrated analysis of physical and social barriers to walkable streets and park access. Soc. Sci. Med. 2009, 69, 1314–1322. [Google Scholar] [CrossRef]
  16. Steinmetz-Wood, M.; Kestens, Y. Does the effect of walkable built environments vary by neighbourhood socioeconomic status? Prev. Med. 2015, 81, 262–267. [Google Scholar] [CrossRef]
  17. Guzman, L.A.; Arellana, J.; Castro, W.F. Desirable streets for pedestrians: Using a street-level index to assess walkability. Transp. Res. Part D Transp. Environ. 2022, 111, 103462. [Google Scholar] [CrossRef]
  18. Jeon, J.; Woo, A. Deep learning analysis of street panorama images to evaluate the streetscape walkability of neighborhoods for subsidized families in Seoul, Korea. Landsc. Urban Plan. 2023, 230, 104631. [Google Scholar] [CrossRef]
  19. Lu, Y.; Chen, H. Using google street view to reveal environmental justice: Assessing public perceived walkability in macroscale city. Landsc. Urban Plan. 2024, 244, 104995. [Google Scholar] [CrossRef]
  20. Zhou, H.; He, S.; Cai, Y.; Wang, M.; Su, S. Social inequalities in neighborhood visual walkability: Using street view imagery and deep learning technologies to facilitate healthy city planning. Sustain. Cities Soc. 2019, 50, 101605. [Google Scholar] [CrossRef]
  21. Chen, X.; Zhang, L.; Zhao, Z.; Zhang, F.; Liu, S.; Long, Y. Characterizing and Measuring the Environmental Amenities of Urban Recreation Leisure Regions Based on Image and Text Fusion Perception: A Case Study of Nanjing, China. Land 2023, 12, 1998. [Google Scholar] [CrossRef]
  22. Hipp, J.R.; Kane, K.; Kim, J.H. Recipes for neighborhood development: A machine learning approach toward understanding the impact of mixing in neighbourhoods. Landsc. Urban Plan. 2017, 164, 1–12. [Google Scholar] [CrossRef]
  23. Kang, Y.; Zhang, F.; Peng, W.; Gao, S.; Rao, J.; Duarte, F.; Ratti, C. Understanding house price appreciation using multi-source big geo-data and machine learning. Land Use Policy 2021, 111, 104919. [Google Scholar] [CrossRef]
  24. Carranza, J.P.; Piumetto, M.A.; Lucca, C.M.; Silva, E.D. Mass appraisal as affordable public policy: Open data and machine learning for mapping urban land values. Land Use Policy 2022, 119, 106211. [Google Scholar] [CrossRef]
  25. Wang, L.; He, S.; Su, S.; Li, Y.; Hu, L.; Li, G. Urban neighborhood socioeconomic status SES inference: A machine learning approach based on semantic and sentimental analysis of online housing advertisements. Habitat Int. 2022, 124, 102572. [Google Scholar] [CrossRef]
  26. Ye, Y.; Jia, C.; Winter, S. Measuring Perceived Walkability at the City Scale Using Open Data. Land 2024, 13, 261. [Google Scholar] [CrossRef]
  27. Yang, J.; Fricker, P.; Jung, A. From intangible to tangible: The role of big data and machine learning in walkability studies. Comput. Environ. Urban Syst. 2024, 109, 102087. [Google Scholar] [CrossRef]
  28. Li, Z.; Wei, H.; Wu, Y.; Su, S.; Wang, W.; Qu, C. Impact of community deprivation on urban park access over time: Understanding the relative role of contributors for urban planning. Habitat Int. 2019, 92, 102031. [Google Scholar] [CrossRef]
  29. Hu, L.; Zhao, C.; Wang, M.; Su, S.; Weng, M.; Wang, W. Dynamic healthy food accessibility in a rapidly urbanizing metropolitan area: Socioeconomic inequality and relative contribution of local factors. Cities 2020, 105, 102819. [Google Scholar] [CrossRef]
  30. Barnes, T.L.; Colabianchi, N.; Hibbert, J.D.; Porter, D.E.; Lawson, A.B.; Liese, A.D. Scale effects in food environment research: Implications from assessing socioeconomic dimensions of supermarket accessibility in an eight-county region of South Carolina. Appl. Geogr. 2016, 68, 20–27. [Google Scholar] [CrossRef]
  31. Cheung, K.S.; Yiu, C.Y.; Lin, B.P. Love thy neighbours or do ethnic neighbourhood qualities matter? Ethnic price differentials in a multi-ethnic housing market. N. Zealand Econ. Pap. 2024, 58, 20–39. [Google Scholar] [CrossRef]
  32. Leal, C.; Chaix, B. The influence of geographic life environments on cardiometabolic risk factors: A systematic review, a methodological assessment and a research agenda. Obes. Rev. 2011, 12, 217–230. [Google Scholar] [CrossRef]
  33. Cheung, K.S.; Yiu, E.; Zhang, Y. What matters more, school choices or neighbourhoods? Evidence from a socioeconomic based school zoning. Cities 2022, 128, 103772. [Google Scholar] [CrossRef]
  34. Rachele, J.N.; Mavoa, S.; Sugiyama, T.; Kavanagh, A.; Giles-Corti, B.; Brown, W.J.; Inoue, S.; Amagasa, S.; Turrell, G. Changes in neighbourhood walkability and body mass index: An analysis of residential mobility from a longitudinal multilevel study in Brisbane, Australia. Health Place 2024, 87, 103245. [Google Scholar] [CrossRef] [PubMed]
  35. Oyama, Y. Spatial city image and its formative factors: A street-based neighborhood cognition analysis. Cities 2024, 149, 104898. [Google Scholar] [CrossRef]
  36. Yin, L.; Wang, Z. Measuring visual enclosure for street walkability: Using machine learning algorithms and Google Street View imagery. Appl. Geogr. 2016, 76, 147–153. [Google Scholar] [CrossRef]
  37. Moura, F.; Cambra, P.; Gonçalves, A.B. Measuring walkability for distinct pedestrian groups with a participatory assessment method: A case study in Lisbon. Landsc. Urban Plan. 2017, 157, 282–296. [Google Scholar] [CrossRef]
  38. Hall, C.M.; Ram, Y. Walk score® and its potential contribution to the study of active transport and walkability: A critical and systematic review. Transp. Res. Part D Transp. Environ. 2018, 61, 310–324. [Google Scholar] [CrossRef]
  39. D’Orso, G.; Migliore, M. A GIS-based method for evaluating the walkability of a pedestrian environment and prioritised investments. J. Transp. Geogr. 2020, 82, 102555. [Google Scholar] [CrossRef]
  40. Gong, W.; Huang, X.; White, M.; Langenheim, N. Walkability Perceptions and Gender Differences in Urban Fringe New Towns: A Case Study of Shanghai. Land 2023, 12, 1339. [Google Scholar] [CrossRef]
  41. Bartzokas-Tsiompras, A.; Konstantinidou, E. Visual analytics of graffiti spatial patterns across 30 European city centres. Environ. Plan. B Urban Anal. City Sci. 2023, 50, 564–568. [Google Scholar] [CrossRef]
  42. Dickinson, C.; Manaugh, K.; Pathak, P.; Sengupta, R. Geographic identity and perceptions of walkable space. Travel Behav. Soc. 2024, 34, 100703. [Google Scholar] [CrossRef]
  43. Cui, Q.; Zhang, Y.; Yang, G.; Huang, Y.; Chen, Y. Analysing gender differences in the perceived safety from street view imagery. Int. J. Appl. Earth Obs. Geoinf. 2024, 124, 103537. [Google Scholar] [CrossRef]
  44. Yu, H.; Fang, Y.; Qi, X.; Wang, K.; Lei, Y.; Zhang, D.; Chen, Q.; Liu, D.; Ren, X. Sociodemographic characteristics of healthy volunteers along with their experience, attitude and concerns of clinical trials in Wuhan, China. Sci. Rep. 2023, 13, 19550. [Google Scholar] [CrossRef] [PubMed]
  45. Yang, Y.; Qian, Y.; Zeng, J.; Wei, X.; Yang, M. Walkability Measurement of 15-Minute Community Life Circle in Shanghai. Land 2023, 12, 153. [Google Scholar] [CrossRef]
  46. Wang, L.; He, S.; Zhao, C.; Su, S.; Weng, M.; Li, G. Unraveling urban food availability dynamics and associated social inequalities: Towards a sustainable food environment in a developing context. Sustain. Cities Soc. 2021, 77, 103591. [Google Scholar] [CrossRef]
  47. Wu, J.; Qin, W.; Peng, J.; Li, W. The Evaluation of Walkability and Daily Facility Distribution Reasonability of Futian District, Shenzhen Based on Walk Score. Urban Dev. Stud. 2014, 10, 49–56. [Google Scholar]
  48. Hainmueller, J.; Hazlett, C.J. Kernel regularized least squares: Reducing misspecification bias with a flexible and interpretable machine learning approach. Political Anal. 2014, 22, 143–168. [Google Scholar] [CrossRef]
  49. Fan, P.; Wan, G.; Xu, L.; Park, H.; Xie, Y.; Liu, Y.; Chen, J. Walkability in urban landscapes: A comparative study of four large cities in China. Landsc. Ecol. 2018, 33, 323–340. [Google Scholar] [CrossRef]
  50. Vaninsky, A. The Factor analysis of Economic Activity; Finance and Statistics: Moscow, Russia, 1984. [Google Scholar]
  51. Rundle, A.; Field, S.; Park, Y.; Freeman, L.; Weiss, C.C.; Neckerman, K. Personal and neighborhood socioeconomic status and indices of neighborhood walk-ability predict body mass index in New York City. Soc. Sci. Med. 2008, 67, 1951–1958. [Google Scholar] [CrossRef]
  52. Engel, L.; Chudyk, A.M.; Ashe, M.C.; McKay, H.A.; Whitehurst, D.G.T.; Bryan, S. Older adults’ quality of life–Exploring the role of the built environment and social cohesion in community-dwelling seniors on low income. Soc. Sci. Med. 2016, 164, 1–11. [Google Scholar] [CrossRef]
  53. Winters, M.; Voss, C.; Ashe, M.C.; Gutteridge, K.; McKay, H.; Sims-Gould, J. Where do they go and how do they get there? Older adults’ travel behaviour in a highly walkable environment. Soc. Sci. Med. 2015, 133, 304–312. [Google Scholar] [CrossRef]
  54. Peng, X. China’s demographic history and future challenges. Science 2011, 333, 581–587. [Google Scholar] [CrossRef] [PubMed]
  55. Alfonzo, M.; Guo, Z.; Lin, L.; Day, K. Walking, obesity and urban design in Chinese neighbourhoods. Prev. Med. 2014, 69, S79–S85. [Google Scholar] [CrossRef] [PubMed]
  56. Amoroso, S.; Castelluccio, F.; Maritano, L. Indicators for sustainable pedestrian mobility. Urban Transp. XVIII Urban Transp. Environ. 21st Century 2012, 18, 173. [Google Scholar]
  57. Boschmann, E.E.; Brady, S.A. Travel behaviors, sustainable mobility, and transit-oriented developments: A travel counts analysis of older adults in the Denver, Colorado metropolitan area. J. Transp. Geogr. 2013, 33, 1–11. [Google Scholar] [CrossRef]
  58. World Health Organization: Ageing. Available online: https://www.who.int/health-topics/ageing (accessed on 7 May 2024).
  59. Smith, G.; Gidlow, C.; Davey, R.; Foster, C. What is my walking neighbourhood? A pilot study of English adults’ definitions of their local walking neighbourhoods. Int. J. Behav. Nutr. Phys. Act. 2010, 7, 34. [Google Scholar] [CrossRef]
  60. Leslie, E.; Coffee, N.; Frank, L.; Owen, N.; Bauman, A.; Hugo, G. Walkability of local communities: Using geographic information systems to objectively assess relevant environmental attributes. Health Place 2007, 13, 111–122. [Google Scholar] [CrossRef]
  61. Ng, S.; Lau, W.; Brown, F.; Tam, E.; Lao, M.; Booth, V. Walkable City, Living Streets; Civic Exchange: Hong Kong, China, 2015; Volume 201. [Google Scholar]
Figure 1. Study area.
Land 13 00667 g001
Figure 2. The community overall walkability in 2016 and 2018.
Land 13 00667 g002
Figure 3. The community subtype walkability in 2016 and 2018.
Land 13 00667 g003aLand 13 00667 g003b
Figure 4. The relationship between overall walkability change and neighborhood deprivation.
Land 13 00667 g004
Figure 5. (A) The relationship between commercial services walkability change and neighborhood deprivation. (B) The relationship between education and training walkability change and neighborhood deprivation. (C) The relationship between public services walkability change and neighborhood deprivation. (D) The relationship between the transport facilities walkability change and neighborhood deprivation. (E) The relationship between medical care facilities walkability change and neighborhood deprivation. (F) The relationship between the finance and communication walkability change and neighborhood deprivation.
Land 13 00667 g005aLand 13 00667 g005bLand 13 00667 g005cLand 13 00667 g005d
Figure 6. Interactions among neighborhood deprivation indicators in explaining neighborhood walkability change.
Land 13 00667 g006aLand 13 00667 g006b
Table 1. Facility standard initial weights.
FrequencyHighestHigherMediumLowerLowestOccasionally
standard initial weight32.521.510.5
Table 2. Attenuation law of intersection density and block length.
Attenuation rate00.010.020.030.040.05
Block length (m)<120120–150150–165165–180180–195>195
Intersection density (a/km2)>7758–7747–5835–4723–35<23
Table 3. Descriptive statistics of the selected deprivation indicators.
CategoriesIndicatorsMaxMinMeanSD
GenderProportion of women (%)1.000.000.490.07
CultureProportion of ethnic minorities (%)0.670.000.020.03
OccupationProportion of unemployed (%)0.730.000.080.08
Proportion of blue-collar workers (%)1.000.000.430.25
Proportion of white-collar workers (%)0.500.000.020.03
EducationProportion of illiteracy (%)0.600.000.010.02
Proportion of people with low education (%)1.000.000.110.08
Proportion of people with high education (%)1.000.000.150.13
MarriageProportion of widow (%)0.180.000.020.02
Proportion of divorced (%)0.500.000.020.02
AgeProportion of adolescents aged between 0 and 17 years (%)0.500.000.080.06
Proportion of elderly people aged over 65 years (%)1.000.000.100.09
Table 4. The LOOCVC of KRLS and comparisons of R2 between KRLS and OLS.
Overall WSA WSB WSC WSD WSE WSF WS
KRLS-LOOCVC0.350.240.150.050.280.050.14
KRLS-R20.370.250.180.050.290.070.14
OLS-R20.18 **0.15 **0.13 **0.010.11 **0.030.08 **
** Abbreviations: p < 0.01 (A), education and training (B), public services (C), transport facilities (D), medical care (E), and finance and communications (F).
Disclaimer/Publisher’s Note: The statements, opinions and data contained in all publications are solely those of the individual author(s) and contributor(s) and not of MDPI and/or the editor(s). MDPI and/or the editor(s) disclaim responsibility for any injury to people or property resulting from any ideas, methods, instructions or products referred to in the content.

