Abstract
In the context of climate change, various natural disasters and extreme weather events are occurring with increasing frequency. In addition, large-scale urbanization in China poses serious challenges to disaster resilience. The convergence of climate change and large-scale urbanization has made the enhancement of urban resilience (UR) an important guideline for current urban development. This study analyzes the UR of 31 provinces in China during 2005–2021 through the entropy method. A UR evaluation index system is constructed from the perspective of population resilience, social resilience, economic resilience, safeguarding facility resilience, and ecological resilience. The results demonstrate the following: (1) The overall performance of UR in China is relatively low, with an average value of 0.2390. (2) Chinese provinces significantly differ in UR levels, with Beijing, Shanghai, Tianjin, Zhejiang, Jiangsu, and Fujian being the top performers and Guangxi, Yunnan, Xinjiang, Gansu, and Tibet being the bottom. (3) From 2005 to 2021, the average UR value of the 31 Chinese provinces significantly improved. (4) Generally, the eastern, middle, and western regions exhibit relatively high, medium, and low average UR values, respectively. These research findings provide valuable references for Chinese policymakers to adopt measures for promoting UR enhancement and urban safety.
1. Introduction
Climate change has led to severe and complicated natural disaster situations, with extreme weather events occurring frequently. According to the Global Disaster Assessment Report, the total frequency of global natural disasters in 2021 was 13% higher than the average over the previous 30 years (1991–2020), and the direct economic losses were 82% higher [1]. From 2000 to 2021, 441 extreme weather disasters globally affected a population of 2.186 billion person-times, resulting in 1,537,300 casualties and a direct economic loss of more than USD 1.4607 trillion. Limited by weak economic development and inadequate urban infrastructure, developing countries were more severely affected by natural disasters. Asia, where most countries are classified as developing, experienced the highest frequency of extreme weather disasters, with 287 occurrences accounting for 65.1% of the total number of global extreme weather disasters. The affected population in Asia constituted 85.3% of the global affected population, and the region accounted for 54.7% of the total number of deaths caused by global extreme weather disasters.
Furthermore, large-scale urbanization has created serious challenges to urban resilience (UR) to disasters [2]. The United Nations projected that by 2050, the proportion of the world’s population living in cities will increase by nearly 12% compared with the proportion in 2014. This means that ~2.5 billion people will be added to the urban population, resulting in ~66% of the world’s population living in cities by 2050. The majority of this growth will occur in urban areas of African and Asian developing countries [3]. The urbanization rate of China, a country with a large population, is projected to increase to 75% by 2050 [4], indicating that greater pressures on UR to disasters will persist in the country’s future.
The convergence of climate change and large-scale urbanization processes may significantly impact the function of urban areas as primary engines of innovation and economic growth [2]. Considering the potential threats, cities around the world are increasingly recognizing the importance of enhancing their capability to manage disasters. Resilience, a mechanism that enhances the ability to cope with environmental changes and disruptions, is an active topic in international and national policy circles [5]. Resilience is a key construct in both the Paris Agreement [6] and the Sustainable Development Goals [7]. The Chinese government also recognizes the importance of building resilient cities. For example, the Chinese 14th Five-Year Plan proposes to promote a new type of urbanization centered on human beings, enhance the capacity of urban flood prevention and drainage, and build sponge cities and resilient cities [8]. In the 20th National Congress of the Communist Party, Chinese President Xi Jinping advocated for accelerating the transformation of the development mode of megacities to build resilient cities [9]. Moreover, local governments have introduced a wide range of policies and measures. For example, Beijing issued the “Guidance on Accelerating the Construction of Resilient Cities” to accelerate resilience construction throughout the process of urban planning, construction, and management [10]. In 2023, Shanghai presented a government report that emphasized modernizing urban governance and building safe and resilient cities [11].
UR is defined as the ability of a city or an urban system to withstand a wide array of shocks and stresses [12]. These competencies mainly involve the ability to resist, absorb, accommodate, adapt to, transform, and recover from the effects of a hazard in a timely and efficient manner [13]. UR includes two main aspects: one is the internal logic between the urban structure and the crisis it faces; the other involves response measures and the capacity for mitigation and restoration after an urban crisis [14]. UR is gradually becoming a major scientific issue that relates to the sustainable development of modern cities [14], and it is considered an emerging strategy to achieve sustainable development [15].
Resilience was initially applied in systems ecology to define the characteristics of the stable state of an ecosystem [16]. The concept of resilience has gradually extended to different disciplines, particularly human ecology [14]. As an indispensable research subject in human ecology, resilience has naturally found application in urban research. The concept of resilient cities was first proposed by the International Council for Regional Sustainable Development as early as 2002 and was subsequently introduced into urban and disaster prevention research [17]. Subsequently, UR has been widely studied in the fields of economics, urban planning, disaster science, ecology, and geography [14]. Previous studies on UR can be classified into three types. The first category applied indicators to measure UR at the national scale. For example, Cutter and Derakhshan analyzed the dynamic nature of community resilience by examining spatial and temporal changes in baseline resilience indicators and the drivers of increasing or decreasing resilience across U.S. counties over two time periods (2010 and 2015) [18]. Shi et al. studied the spatiotemporal characteristics of the UR of 282 Chinese cities from 2012 to 2017 using the spatial cold–hot spot model [14]. The second category of studies measured the UR at the regional level. Jiang et al. measured the UR level of 13 prefecture-level administrative regions in China’s northeastern border region from 2010 to 2019 [19]. Chen et al. established a comprehensive evaluation indicator system to measure the spatiotemporal characteristics and influencing factors of UR in the Yellow River basin from 2011 to 2018 [20]. The third category of studies measured the UR in individual cities. For example, Haojian and Liu analyzed the temporal and spatial evolutions of UR and the spatial spillover effects of UR in Guangdong from 2012 to 2020 [21]. Yan et al. explored the linkage between UR and development in the megacity of Beijing in 2010 and 2015 [22].
The research on UR in China is still in its infancy [14]. Although numerous studies have examined UR in China, they have focused on the regional level and individual cities [19,21]. Empirically based studies at the national scale are few [18]. Examinations at the regional level or individual case studies are limited in terms of providing a comprehensive understanding of UR across different cities and enabling meaningful comparisons between those cities. As disaster resilience is a national challenge in China, every city bears the responsibility to enhance its UR. Experience sharing between cities is a good strategy to facilitate the implementation of urban sustainable development in each city. However, without a comparative assessment of URs among cities, experiences from different cities cannot be effectively explored and shared. Moreover, owing to various factors, such as regional resource endowment and development foundation, city development in China significantly differs among regions [14]. Therefore, it is crucial to study the UR at the national scale under the influence of China’s urbanization process and climate change. This paper aims to evaluate the UR of 31 provinces in China and explore the policy implications for governments to promote urban disaster resilience development and improve urban safety in China. The specific research questions are: (1) How did the overall performance of UR in China from 2005–2021? (2) Has China’s UR improved or reduced over the period 2005–2021? (3) Which are the best and worst URs, and what are the reasons for their best or worst performance? And (4) is UR in China characterized by regional divergence?
2. Materials and Methods
The aim of this research was to evaluate the UR performance of different Chinese provinces, and this goal was achieved in two major steps. The first step was to establish assessment indicators, and the second was to select the method for UR assessment. A flowchart of the research procedures framework is shown in Figure 1.
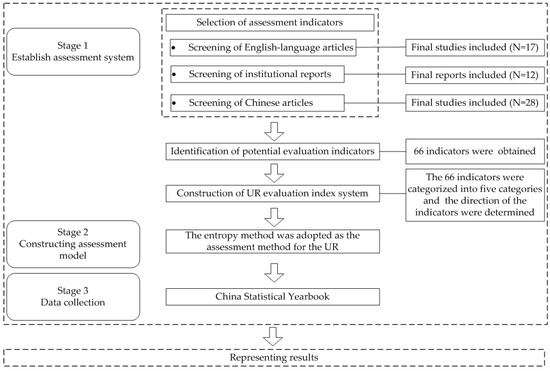
Figure 1.
The flowchart of the research procedures framework.
2.1. Urban Resilience Evaluation Index System
2.1.1. Selection of Assessment Indicators
In this study, the UR evaluation index system was derived from English-language articles, institutional reports, and Chinese articles. Through a statistical analysis of the UR evaluation indicators found in these articles and reports, the initial index system was obtained. The details are discussed as follows.
- Screening of English-language articles
First, “City Resilience”, “Community Resilience”, “Disaster Resilience”, and “Urban Resilience” were used as the search terms in five databases: Science Direct, SpringerLink, Web of Science, Taylor & Francis Online, and Wiley Online Library. The search focus was on titles; the search covered a time frame up to 31 May 2022, and the search category was journals. A total of 2405 articles were obtained.
Second, separate searches were performed on the headings using search strings (“measure” OR “analyze” OR “assess” OR “quantify” OR “evaluate”) and (“model” OR “framework” OR “tool” OR “index” OR “guide” OR “baseline”). Twenty-six articles were obtained from the Science Direct database, 9 articles from the SpringerLink database, 2 articles from the Taylor & Francis Online database, 54 articles from the Web of Science database, and 3 articles from the Wiley Online Library database, totaling 94 articles. The literature from the five databases was summarized, resulting in the exclusion of 31 articles and leaving a total of 63 articles.
Third, the literature was screened by reviewing the abstracts to eliminate the studies that were inconsistent with the research objectives. The screened literature needed to meet both the following requirements: (1) the evaluation object was a city or a community, and (2) the evaluation content was UR. Following this step, 17 articles were obtained.
Fourth, 17 articles were reviewed to select those that met the following two requirements: (1) quantitative methods were employed, and (2) an operational UR assessment index system was employed. Thirteen articles were obtained.
Finally, the snowballing method was applied to analyze the references cited in these 13 articles to filter out four high-quality articles that met the research objectives. Seventeen articles were identified as English-language sources for constructing a UR evaluation index system for China.
- 2.
- Screening of institutional reports
Institutions that developed an index system for UR assessment, as mentioned in the full text and cited documents, were extracted from the 17 articles from Section 2.1.1, resulting in a total of 34 institutions. The reports were examined according to the following criteria: (1) the report had a framework of evaluation indicators; (2) the object of evaluation was a city or community; (3) the evaluation was about UR or urban disaster resilience; (4) the evaluation indicators were quantitative; (5) the evaluation indicator system could be operationalized and borrowed; and (6) the evaluation indicator system had been used in practice. Finally, 12 institutions were screened to meet the objectives of the present study, and the names of their published UR assessment indicator systems are detailed in Table 1.

Table 1.
Communities of practice focused on UR assessment.
- 3.
- Screening of Chinese articles
First, the search condition of (“city” or “community”) with (“resilience”) and with (“assessment” or “evaluation”) was defined in the China National Knowledge Infrastructure database. The scope of the search was the title of the article, and the search covered a time frame up to 25 October 2022. A total of 135 articles met the search criteria.
Second, a preliminary screening of the acquired articles was conducted, and the categories of literature were selected as SCI (Science Citation Index), EI (Elsevier Engineering Information), Peking University Core, CSSCI (Chinese Social Sciences Citation Index), and CSCD (Chinese Science Citation Database), resulting in a total of 67 articles.
Third, a secondary screening was conducted by reviewing the titles and abstracts of the articles to remove journals not related to the UR assessment. The screening process was mainly based on the following criteria: (1) the object of evaluation was a city or a community, and (2) the content of evaluation was UR or disaster resilience. Forty-eight papers were obtained.
Fourth, the remaining articles were reviewed in full text to ensure they met the following two requirements: (1) they did not focus on specific types of communities or disasters, such as beaches, international communities, flooding disasters, and urban safety, as the current paper’s research goal is to establish a universal UR assessment index system; (2) the articles included a clear UR assessment index system. Nineteen articles were obtained.
Finally, the snowballing method was applied to analyze the cited references among the 19 obtained articles, and nine more articles were screened to meet the research objectives. Ultimately, 28 Chinese-language articles were identified for analyzing the UR evaluation index system.
2.1.2. Identification of Potential Evaluation Indicators
Based on the results of Section 2.1.1, Section 2.1.2 and Section 2.1.3, potential evaluation indicators were identified according to word frequency statistics. The indicators with a word frequency count of 1 were deleted. Eventually, 43 indicators were obtained from the English-language articles and the institutional reports, and 51 indicators were obtained from the Chinese articles. The aggregation yielded 94 indicators, and after the removal of 28 duplicated indicators and indicators of data that were not publicly available, a total of 66 indicators were finally obtained to constitute the UR evaluation indicator system. Three main features were identified from the examination of these 66 indicators. First, UR evaluation indicators focus on vulnerable groups (e.g., unemployed, elderly, and disabled populations), the economy (e.g., residential income levels, GDP, and fiscal revenues), facilities (e.g., emergency medical assistance, emergency evacuation transportation, and emergency communications), and the environment (green coverage, solid waste utilization, and forested areas). Second, “unemployment rate” and “emergency medical assistance capacity—number of beds” are important indicators for UR assessment, given their relatively high frequency in the word frequency statistics. Third, the English articles, institutional reports, and Chinese articles have different focuses on UR evaluation. For example, the English-language articles and the institutional reports pay more attention to disadvantaged groups such as the “elderly population”, “disabled population”, and “minimum living standard population”, while Chinese articles pay more attention to economic aspects such as “GDP” and “income level of the population”, and to safeguard facilities such as “emergency evacuation and transportation capacity”, and “post-disaster water supply capacity”.
2.1.3. Construction of Urban Resilience Evaluation Index System
The sustainable livelihoods framework (SLF) was adopted to categorize the 66 indicators into five categories: population resilience, social resilience, economic resilience, safeguarding facility resilience, and ecological resilience, as detailed in Table 2. The SLF was first proposed by Chambers and then further developed by scholars such as Chambers and Conway [23,24]. The SLF can guide the classification and selection of indicators related to disaster management [25]. The objective of the SLF is to promote disaster risk reduction plans to increase UR and reduce poverty, particularly in developing countries [26]. The SLF has been widely used in developing countries, particularly to address the disaster resilience of poor, rural communities [26,27].
Table 2.
Indicators selected for UR assessment.
As presented in Table 2, the direction of the indicator indicates its impact on UR, with positive values suggesting enhancement and negative values indicating a weakening effect. Considering that the selected indicator data were significantly different in terms of units and orders of magnitude and that the positive and negative directions needed to be distinguished, a standardized method was used for the dimensionless processing of data.
A more detailed framework of indicators selected for UR assessment is available in Table A1, which sets out three phases of disaster management, namely preparedness, response, and recovery. In addition, Table A1 presents the impact level among different indicators at each phase of the three disaster management.
2.2. Urban Resilience Measurement Model
The entropy method was adopted as the assessment method in this study. It is suitable for data with clearly fixed dimensions and focuses on index calculation [14]. Being an objective method, the entropy method avoids the influence of human factors in subjective assignment, providing a basis for multidimensional comprehensive evaluation [28,29]. Therefore, the entropy method was adopted to assign weights to the UR index system, and the UR index was calculated for 31 provinces in China. The specific steps are as follows:
- Constructing the original matrix
The total number of years considered in this study was 17, the number of target provinces for assessment was 31, the number of samples was 527, and the UR assessment index system contained 66 indicators. The mathematical model was established as follows:
Theoretical domain:
Each sample was characterized by data from n indicators:
Initial data matrix for the UR assessment model:
where denotes the original value of the jth UR assessment indicator in the ith province.
- 2.
- Data normalization
To make the indicators comparable with each other, it was necessary to normalize the initial data and convert the values of the UR assessment indicators into dimensionless indicator values within the interval of [0, 1].
Data normalization for positive indicators:
Data normalization for negative indicators:
where represents the raw value of the jth UR assessment indicator for the ith province.
represents the maximum original value of this assessment indicator for all provinces in the study period, represents the minimum original value of this assessment indicator for all provinces in the study period and represents the values of the normalized UR assessment indicators.
After data normalization, some of the data values became 0. To prevent the subsequent logarithmic calculation of the data from being meaningless, performing a translation after data normalization was necessary. A translation amount of 0.001 was selected, and the translated value was .
- 3.
- Calculating the contribution of the ith province to the jth indicator
Calculating weights with translated UR assessment indicator data:
where denotes the share of the jth indicator accounted for by the ith province and represents the value of the UR assessment index after translation.
- 4.
- Calculating the information entropy value of the indicator
The information entropy value of the jth indicator was calculated as follows:
where the value of the constant K is related to the number of samples m, with , and in this study, m was equal to 527, and represents the share of the jth indicator accounted for by the ith province.
- 5.
- Calculating the information utility value
The information utility value is related to the information entropy of the UR assessment index as follows:
- 6.
- Calculating weights for indicators for UR assessment
The entropy method was employed to calculate the weight of each UR assessment indicator according to the value coefficient of the UR assessment indicator information. The higher the value coefficient, the greater the contribution to the evaluation results. The formula for calculating the weights of the jth UR assessment indicator is as follows:
- 7.
- Calculating the UR score for each province
2.3. Data Collection
The data for the indicators in Section 2.1 were collected from municipalities, provinces, or autonomous regions. To ensure the completeness of indicators and the availability of data, the sample research area included 31 province-level municipalities, provinces, or autonomous regions in China. The data for these 31 provinces for the period of 2005–2021 were collected primarily from the China Statistical Yearbook published by the National Bureau of Statistics of China. The data sources for the indicator are detailed in Table 3. Any missing data were supplemented via interpolation.
Table 3.
Data sources for 2005–2021 UR indicator.
3. Results
3.1. Overall Urban Resilience Performance
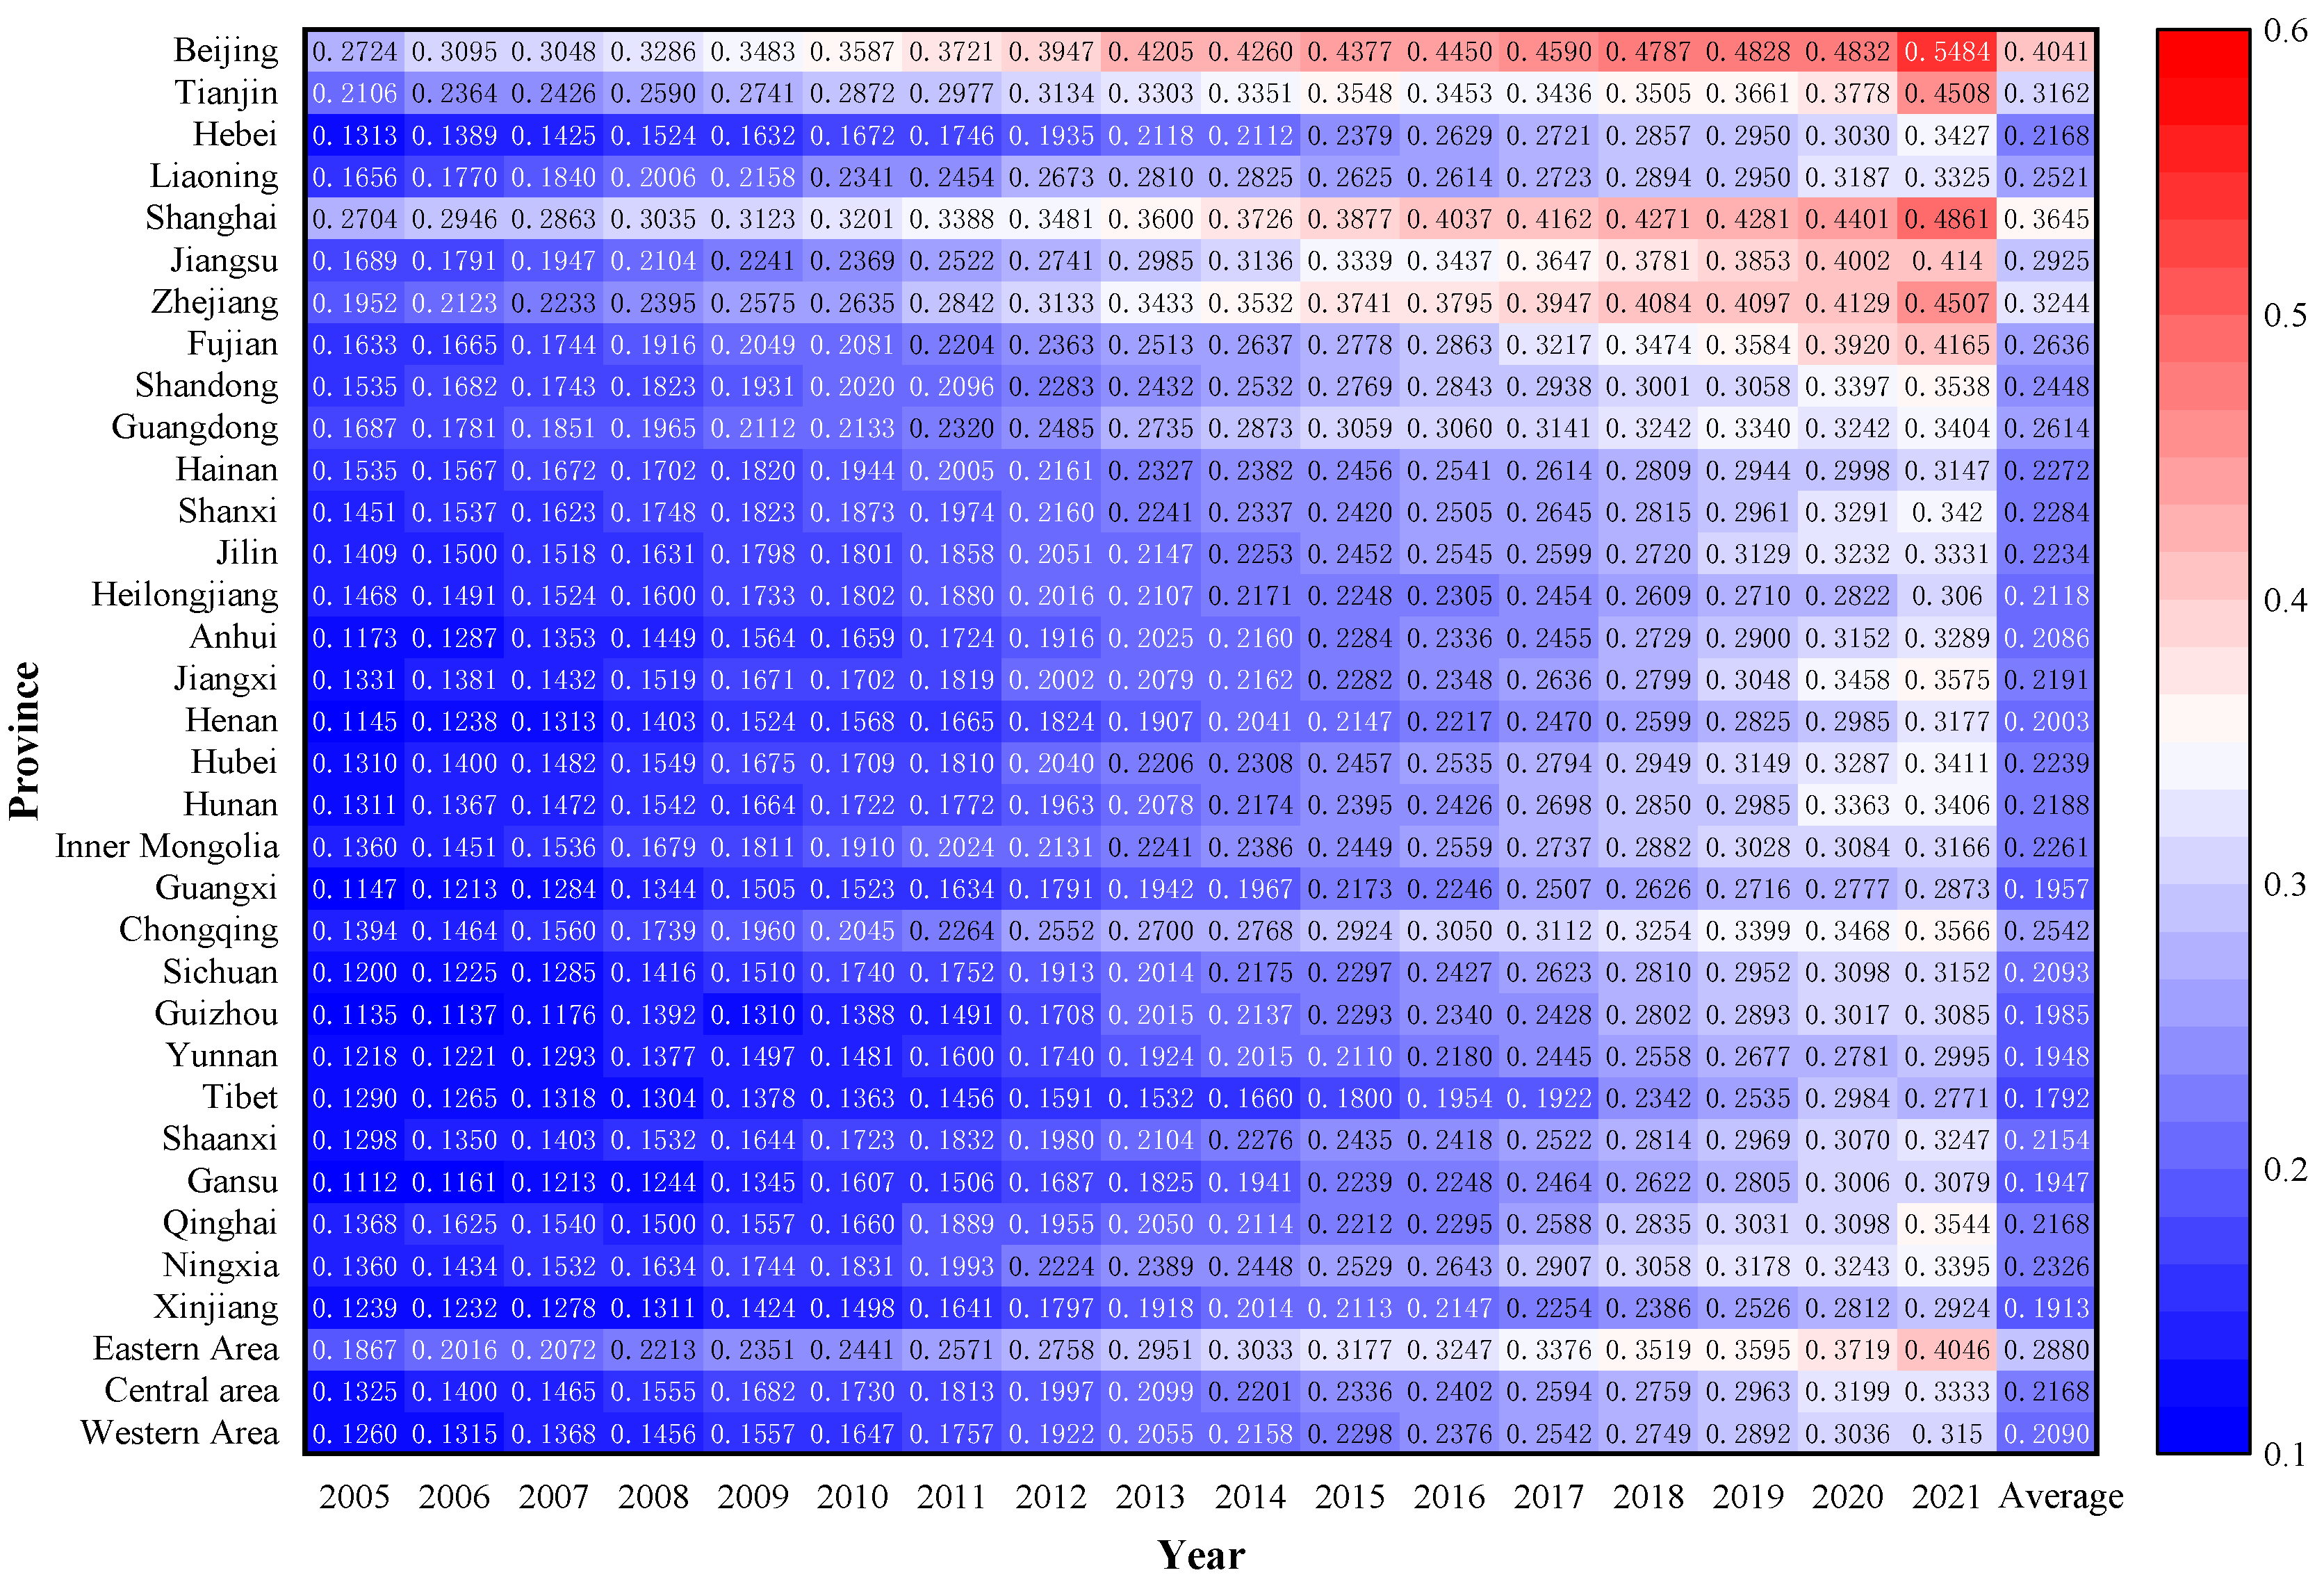
The UR measurement model and research data were used to calculate the URs of the 31 Chinese provinces. The UR results for 2005 to 2021 are shown in Figure 2. The average UR value across the sample provinces was 0.2390, and most of the sample provinces exhibited a resilience value lower than the national average UR value (0.2390). Moreover, during the entire surveyed period, Beijing exhibited the highest overall resilience, with an average UR value exceeding 0.4.
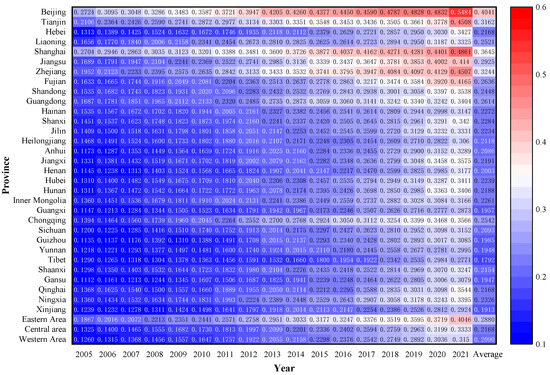
Figure 2.
UR results for 31 Chinese provinces during the period of 2005–2021.
According to the UR values in Figure 2, Table 4 illustrates the top five performers and the bottom five performers in UR from 2005 to 2021. Among the 31 provinces, Beijing, Shanghai, Tianjin, Zhejiang, Jiangsu, and Fujian were the top performers in terms of resilience, respectively. Figure 2 indicates that several provinces exhibited poor UR performance. During the considered period, Guangxi (13 occurrences), Yunnan (15 occurrences), Xinjiang (13 occurrences), and Tibet (14 occurrences) presented the highest number of occurrences among the five bottom performers in Table 4.
Table 4.
The top five performers and the bottom five performers in UR from 2005 to 2021.
3.2. Dynamic Changes in Urban Resilience
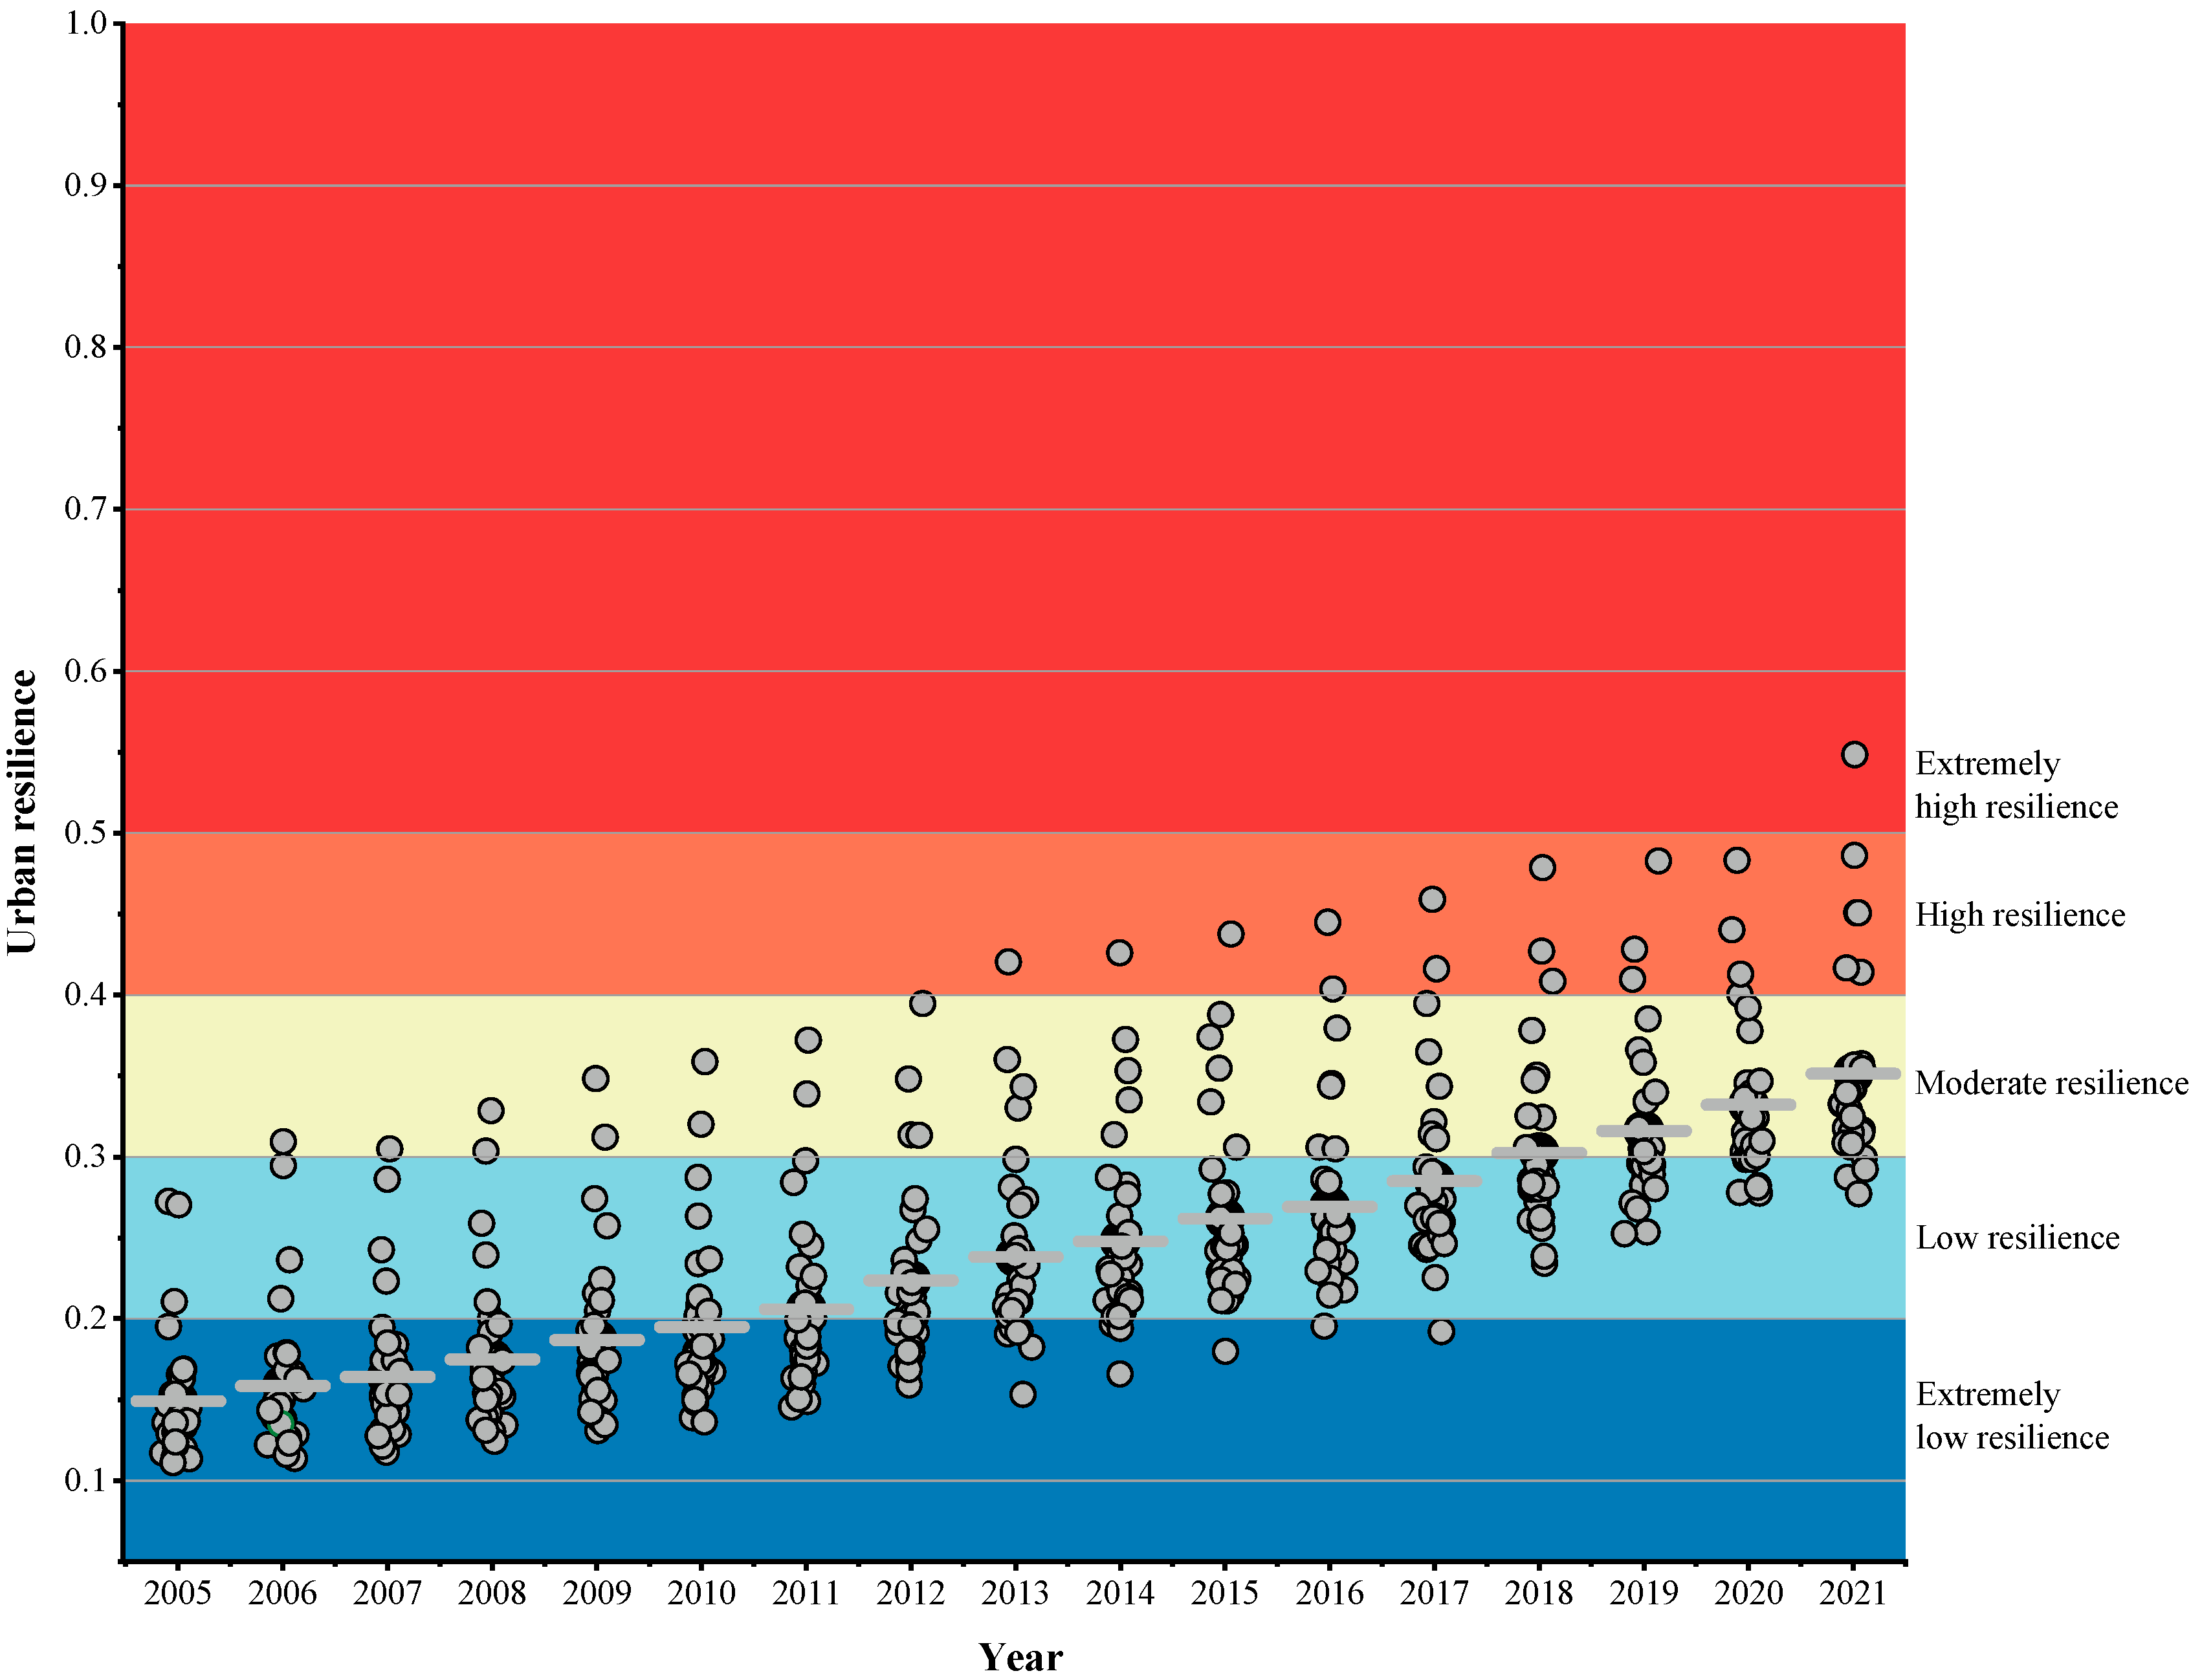
The 31 provinces are classified into five groups in terms of their UR values. The five groups are as follows: extremely low resilience (UR < 0.2), low resilience (0.2 ≤ UR < 0.3), moderate resilience (0.3 ≤ UR < 0.4), high resilience (0.4 ≤ UR < 0.5), and extremely high resilience (UR ≥ 0.5). The details of the annual overall UR performance of the five groups are presented in Figure 3. Furthermore, Table 5 shows significant differences in the distribution of provinces among the five specified groups throughout the study period.

Figure 3.
Annual overall UR performance of five groups from 2005 to 2021.
Table 5.
Distribution of provinces among five groups from 2005 to 2021.
Figure 3 and Table 5 show that the overall UR across China was relatively low. From 2005 to 2021, the majority of provinces fell into the extremely low resilience group (37.19%) or the low resilience group (40.99%). Throughout the study period, only one city achieved a score exceeding 0.5, indicating significant room for improvement in UR.
However, UR showed an overall increasing trend. According to the average UR value of the 31 provinces, the average UR value was 0.1492 in 2005, and it increased to 0.3515 in 2021. Moreover, all provinces exhibited extremely low or low resilience in 2005. However, in 2021, no province exhibited extremely low.
Table 5 also reveals a noticeable improvement in average UR values since 2018. In 2005, no province belonged to the moderate resilience group. In 2018, only six provinces (corresponding to 19.35%) belonged to the moderate resilience group. However, in 2021, 21 of the sample provinces (67.74%) achieved moderate resilience, indicating a significant overall improvement in UR performance across the country from 2018 to 2021.
3.3. Regional Perspective on Urban Resilience
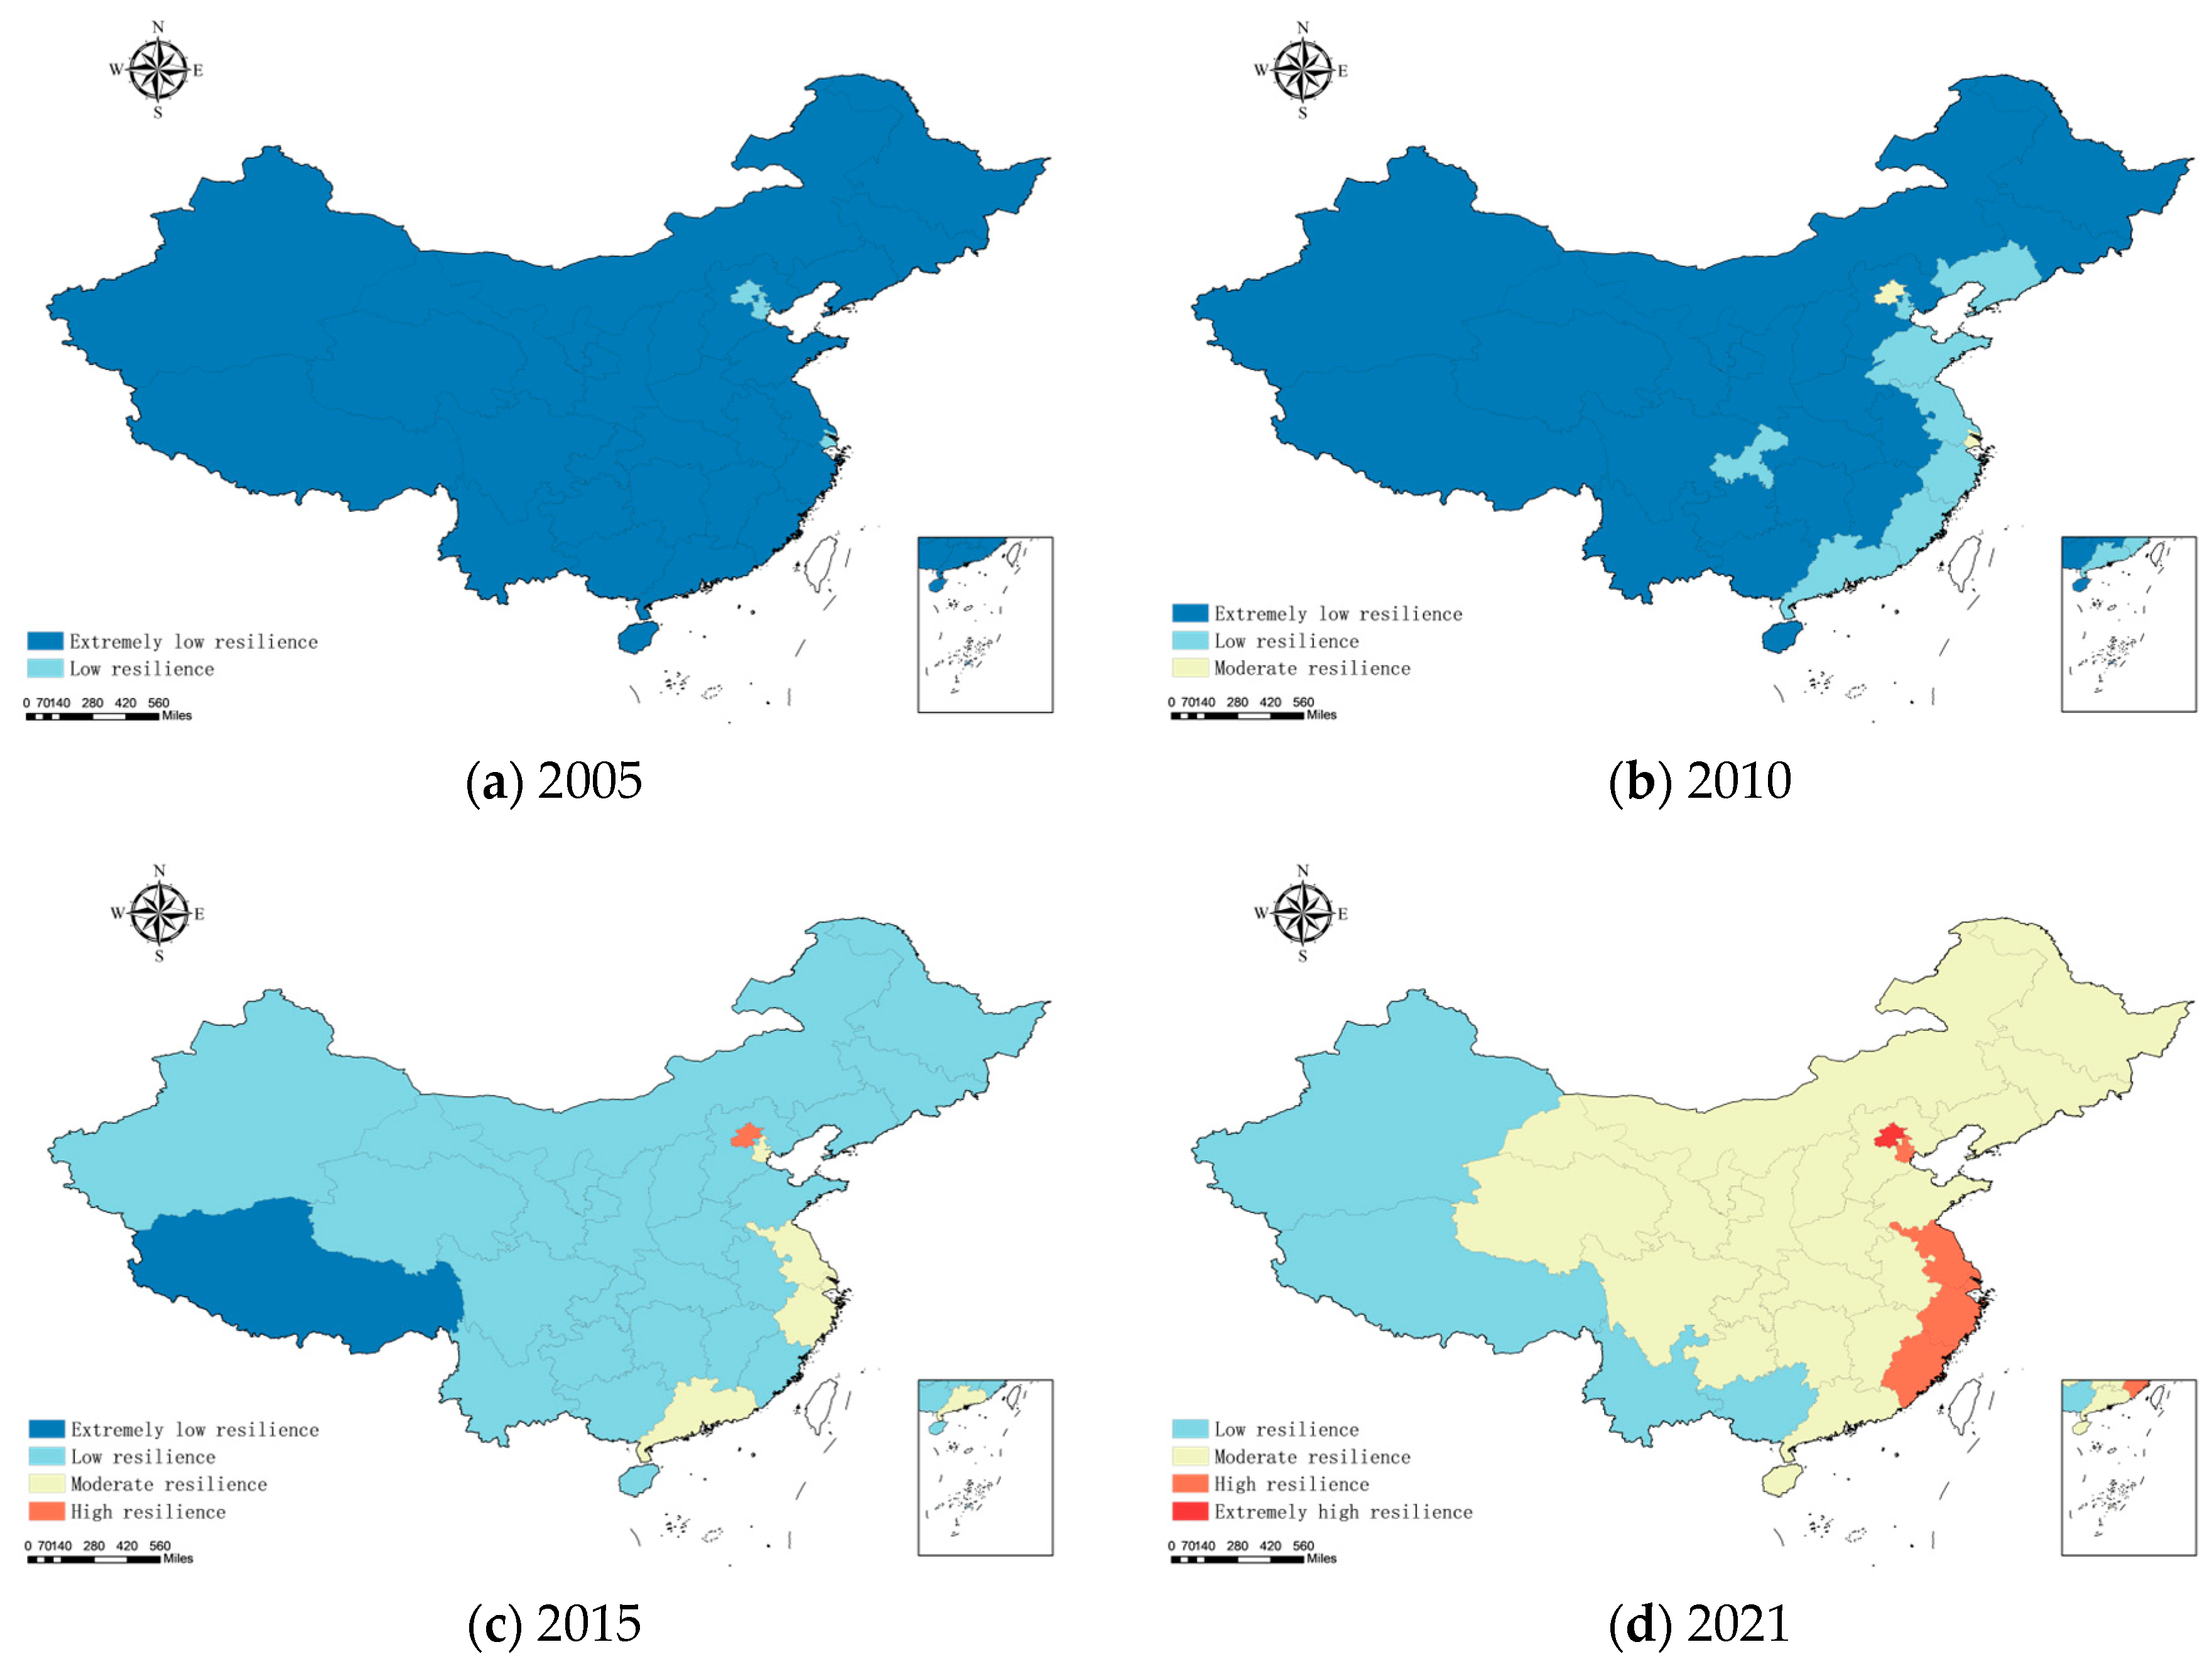
Wide variations in geographical characteristics exist among the provinces. To comprehensively analyze the UR across different provinces, the distribution of UR values for the 31 provinces is illustrated on a map of China (Figure 4). According to the UR classification described in Section 3.2, Figure 4a–d presents the spatial distribution of the five groups of provinces for the sample years of 2005, 2010, 2015, and 2021. Generally, the eastern, middle, and western regions exhibited relatively high, medium, and low average UR values, respectively.
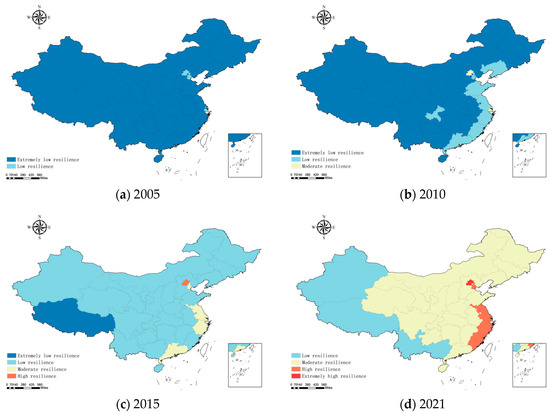
Figure 4.
Regional perspective on UR from 2005, 2010, 2015, and 2021.
In 2005, the overall performance of UR in China was relatively low. Three cities were in the low resilience group, and all other provinces were in the extremely low resilience group. The low-resilience cities, namely Beijing, Tianjin, and Shanghai, were all situated in the eastern region.
In 2010, there were two cities in the moderate resilience group: Beijing and Shanghai (Figure 4b). Moreover, some provinces in the eastern region, such as Jiangsu, Zhejiang, Fujian, and Guangdong, transitioned from the extremely low resilience group in 2005 to the low resilience group in 2010.
As shown in Figure 4c, most provinces exhibited an increase in UR value in 2015 compared with previous years. One city, Beijing, climbed from the moderate resilience group in 2010 to the high resilience group in 2015. Some provinces in the eastern region, including Jiangsu, Zhejiang, Tianjin, and Guangdong, climbed up to the moderate resilience group. The remaining provinces, except for Tibet, were in the low resilience group.
As shown in Figure 4d, most provinces exhibited a rise in UR in 2021. Beijing exhibited the highest increase, climbing up to the extremely high resilience group. Five provinces, namely Tianjin, Shanghai, Jiangsu, Zhejiang, and Fujian, all situated in the coastal eastern region, climbed up to the high resilience group. Some border provinces of the western region, such as Xinjiang, Tibet, Yunnan, and Guangxi, remained in the low resilience group. About 21 other provinces moved up to the moderate resilience group.
4. Discussion
4.1. Reasons for the Best and Worst Performers in Urban Resilience
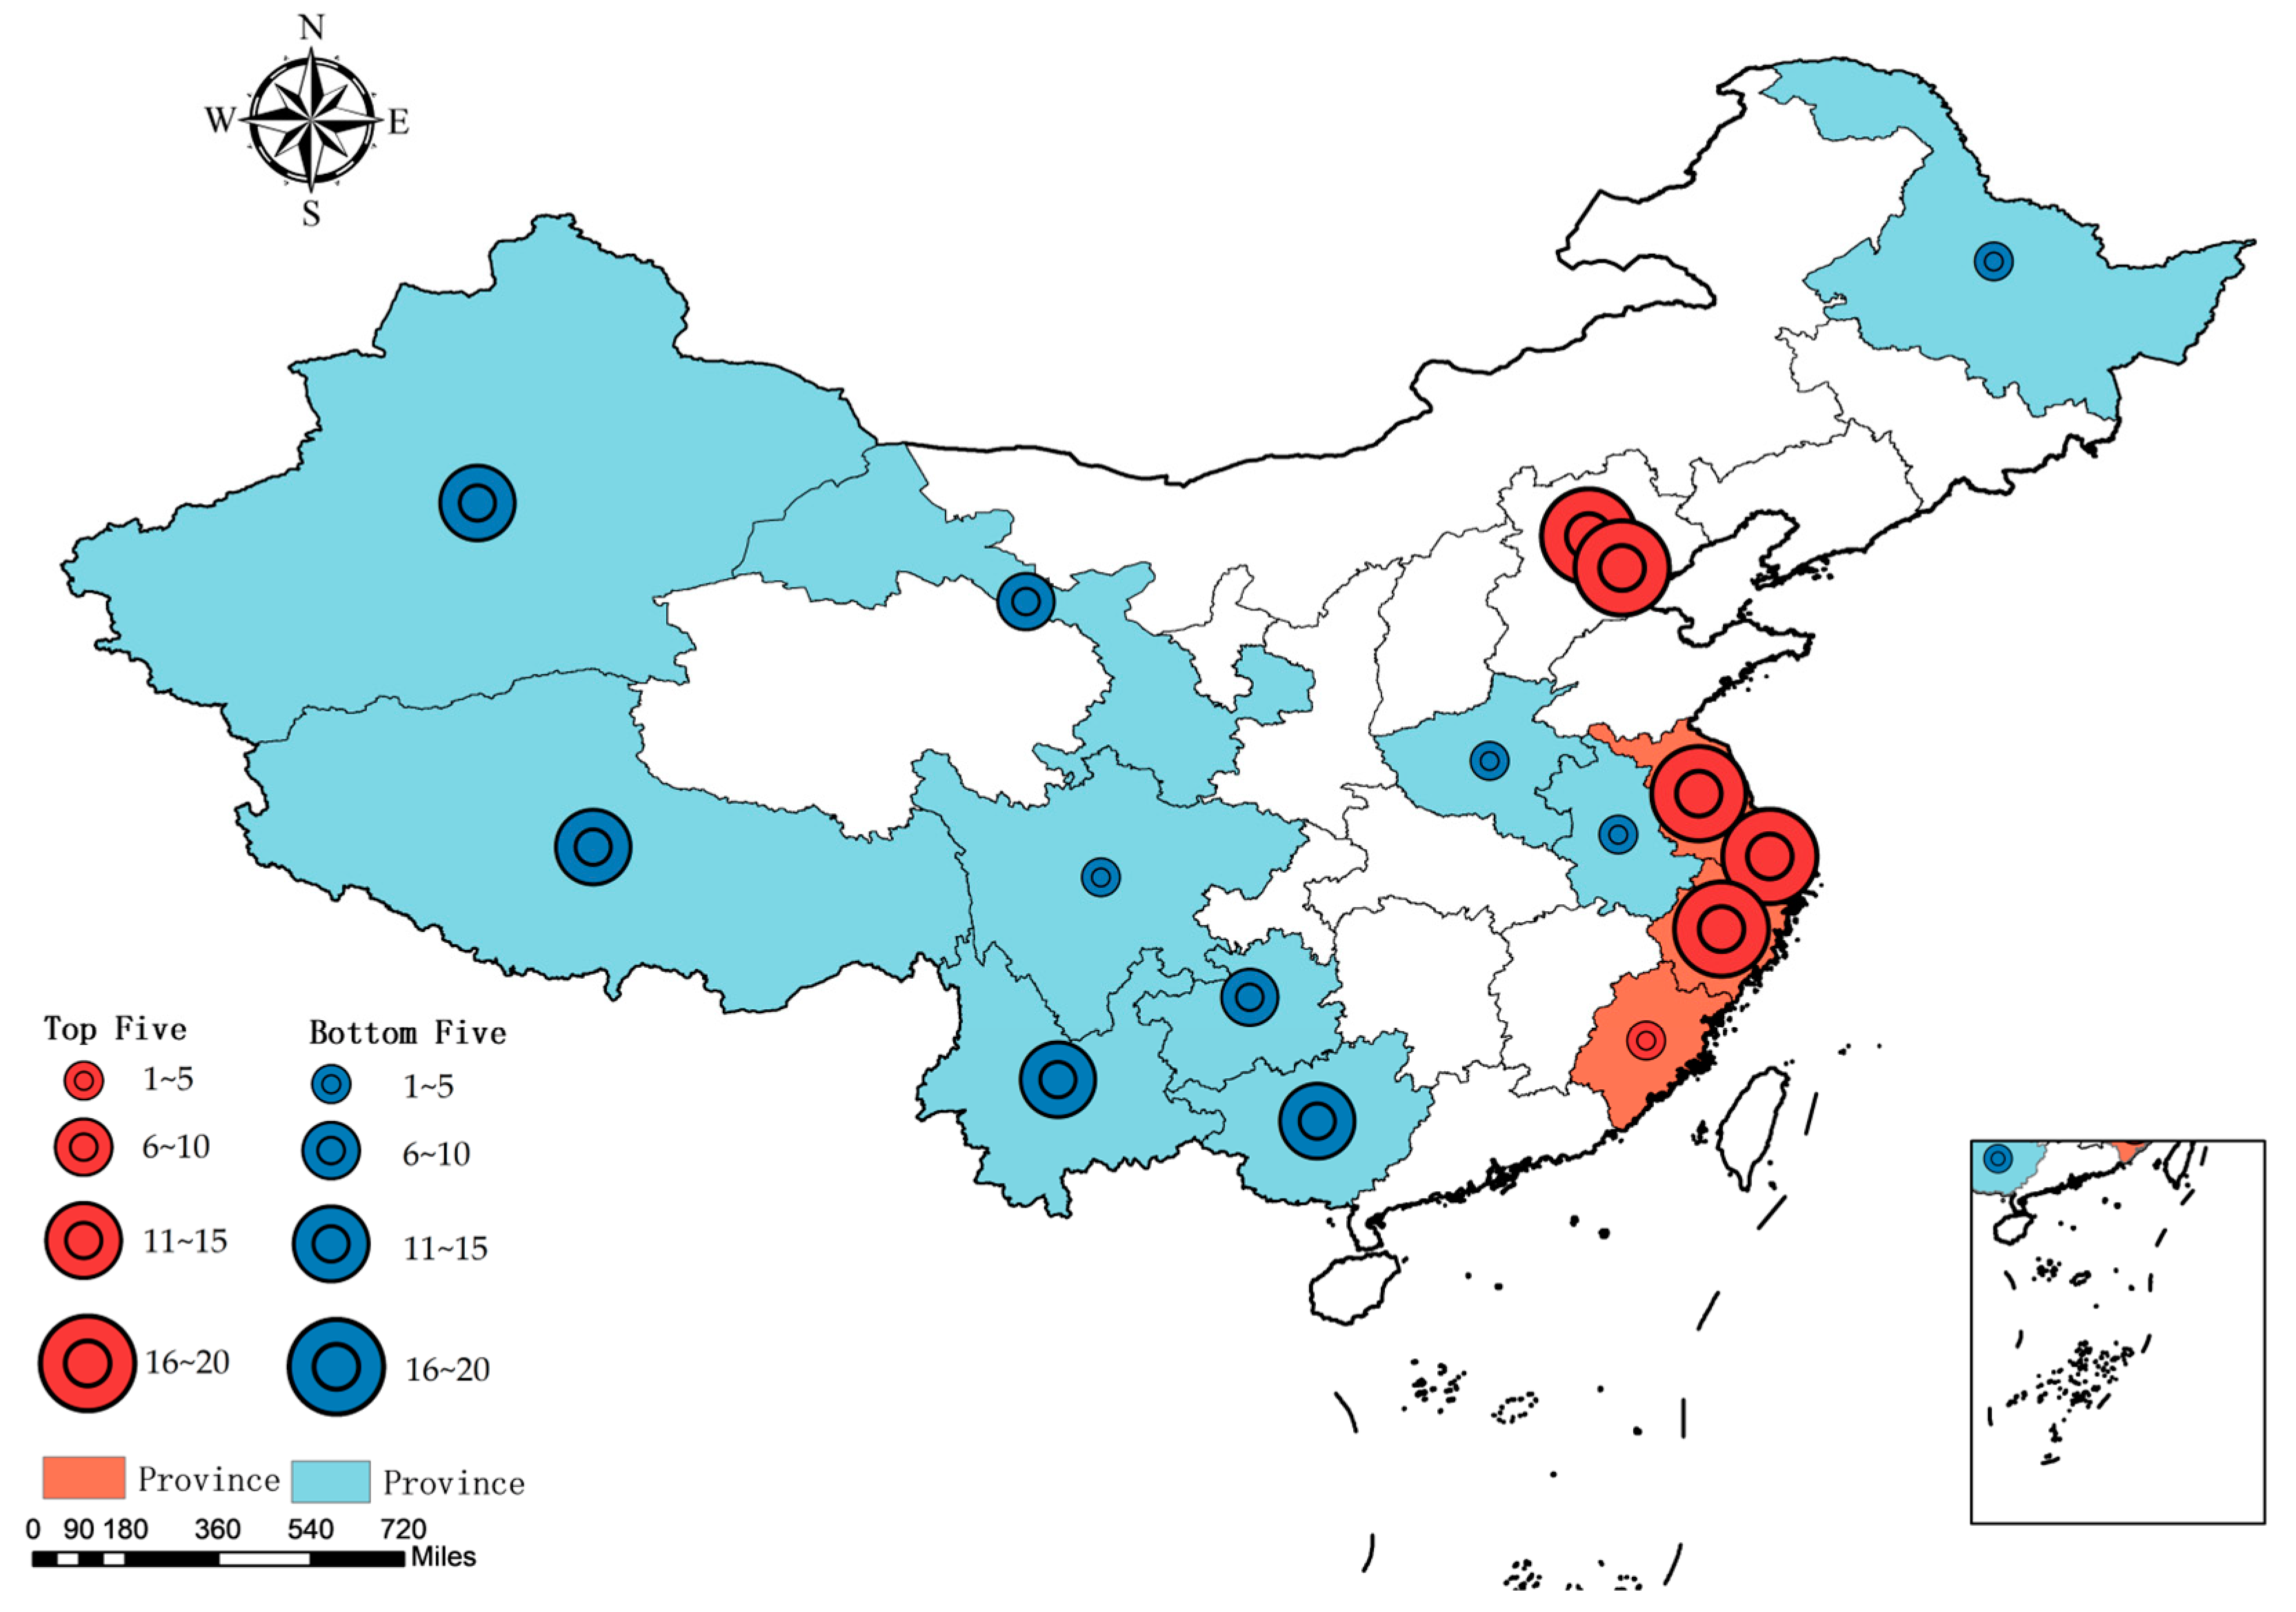
The results show that Beijing, Shanghai, Tianjin, Zhejiang, Jiangsu, and Fujian were the top performers in terms of resilience, respectively; however, Guangxi, Yunnan, Xinjiang, and Tibet presented the highest number of occurrences among the five bottom performers. Figure 5 illustrates the accumulated top five performers and bottom five performers in UR from 2005 to 2021.

Figure 5.
Accumulated top five performers and bottom five performers in UR from 2005 to 2021.
Beijing exhibited the highest UR value, attributable to its special status as the capital of China. Beijing has been concentrating on urban management and emphasizing the enhancement of UR to disasters. Specifically, the city has focused on aspects such as urban spatial resilience, urban engineering resilience, urban management resilience, and urban social resilience, which leads to higher levels of infrastructure resilience and disaster early warning capacity and the effective operation of lifeline projects. To obtain higher UR levels, Beijing plans to build 50 resilient communities by 2025 to serve as iconic communities [10,30].
Shanghai and Tianjin are municipalities in China with convenient transportation locations. Their geographical advantage has resulted in highly developed industrial, financial, commercial, and service sectors. These two cities have implemented several measures or policies to obtain higher well-being levels. For example, they have focused on the development of infrastructure resilience and the enhancement of earthquake monitoring and early warning systems, contributing to a higher level of UR [11,31].
Zhejiang, Jiangsu, and Fujian are economically active provinces in China, benefiting from their favorable geographic locations and national policy support. Located in the center of the Yangtze River Delta Economic Zone, Zhejiang has a competitive manufacturing industry in the global market, which mainly consists of light industry, textile industry, and machinery manufacturing. Jiangsu has highly competitive manufacturing and service industries, including world-leading steel, automobile, electronics, and telecommunication equipment manufacturing industries, and well-developed finance, logistics, and Internet service industries. Benefiting from its unique geographical location, abundant natural resources, and open-door policy, Fujian has first-class ports that serve as a crucial economic pillar for foreign trade. The well-developed economies of the abovementioned three provinces provide economic support for infrastructure and social development, contributing to the attainment of higher levels of UR in economic resilience, infrastructure resilience, and social resilience. Furthermore, numerous measures or policies have been implemented to obtain higher UR levels. For example, Fujian has been concentrating on enhancing resilience to disasters. This includes the improvement of safe operation monitoring systems for water supply, gas, roads, and bridges; the construction of an engineering system for urban drainage and flood control; the implementation of projects to improve emergency response capacity; and the strengthening of the stockpile of emergency supplies. These initiatives contribute to a higher level of UR [32].
The abovementioned Beijing, Shanghai, Tianjin, Zhejiang, Jiangsu, and Fujian provinces are regarded as exemplary provinces in improving UR. The provinces share common features in terms of economic development and UR enhancement. (1) Dominant geographic location: As shown in Figure 5, Beijing is the capital of China, and the other provinces are coastal and open. Zhejiang and Jiangsu are located in the Yangtze River Delta economic zone. Fujian is located near the Pearl River Delta economic zone, the Yangtze River Delta economic zone, and Taiwan. Na et al. [33] and Xinmeng et al. [34] also reported that the UR value of cities on the eastern coast is higher than that of other areas. (2) Relatively prosperous economy: The dominant geographic locations contribute to a relatively prosperous economy in these six provinces. This prosperity results in a higher proportion of talented individuals in the socio-demographic structure and a better infrastructure and social security system. (3) UR enhancement regulation: All six provinces have enacted disaster prevention and reduction measures in urban planning. The provinces are positive models for other Chinese provinces; they demonstrate the enhanced resilience of cities, particularly large urban centers (megacities), to disasters while pursuing rapid economic development.
Nevertheless, Guangxi, Yunnan, Xinjiang, Gansu, and Tibet are the bottom performers. The reasons for their poor performance are multifaceted, with the primary factor being their disadvantageous geographic locations. As depicted in Figure 5, these four provinces are all border provinces in China, grappling with unfavorable natural conditions such as deserts in Xinjiang and high altitudes in Tibet. Disadvantageous geographic locations and unfavorable natural conditions limit economic development and make it more challenging to build infrastructure. This contributes to lower economic resilience and infrastructure resilience. For example, according to the China Statistical Yearbook, Guangxi’s GDP per capita was the third lowest among the four provinces [35]. As an economically disadvantaged region, Guangxi has made fewer investments in addressing healthcare- and education-related issues [36]. Furthermore, owing to their low economic development standards, these four provinces have limited resources for implementing environmental protection measures. A previous study reported that Yunnan’s economy was dominated by an extensive development mode, resulting in a significant increase in pollutants and a decline in ecological resilience in recent years [37]. The limited vitality in city development also hinders talent attraction, which further reduces the UR in these border provinces. This finding is similar to that of Jiang, Li, Cong, Wu and Peng [19], who opined that economic structure, environmental governance capabilities, and insufficient national policy support have become obstacles for the border cities to improve resilience.
4.2. Reasons for Urban Resilience Improvement in China
This research indicates that the overall performance of UR in China was relatively low. This finding is consistent with that of Na, Guanglai, and Ning [33], who assessed UR levels based on statistics from 289 cities in China during 2011–2018 and found that the overall UR level in China is low. But, it is worth noting that the results in Figure 3 and Table 5 reveal that the average UR value of the 31 Chinese provinces significantly improved from 2005 to 2021. This finding is similar to that of Xinmeng, Min, Rui, and Jun [34], who evaluated the UR of 267 prefecture-level cities in China and held an opinion that the overall UR level in China increased from 2010 to 2017. Actually, as depicted in Table 5, there was a significant overall improvement in UR performance across the country from 2018 to 2021. The significant improvement in UR in these provinces was due to a combination of factors.
First, reform and restructuring of the social security system. China has established a social security system that includes components such as social residents’ insurance and social assistance for people experiencing poverty. This system was developed through two phases: consolidation (from 2012 to 2016) and optimization (from 2017 to 2020). This enhanced the ability of the population, particularly vulnerable groups such as older people and those experience poverty, to face disaster risks.
Second, the breakthrough in social resilience. In response to COVID-19, which emerged in 2019, the Chinese government has taken a series of preventive and control measures. For example, a large number of community institutions have invested in monitoring residential mobility status. According to the China Statistical Yearbook, there were a total of 459,617 community institutions in 2018; however, this number increased to 929,021 in 2021 [35]. This has led to a closer correlation between social individuals and social groups.
Third, increased environmental protection efforts. In recent years, the Chinese government has been implementing environmental protection policies. For example, the government established the Central Environmental Inspection Group in 2015 to evaluate the effectiveness of the implementation of environmental policies at both national and city levels [38]. Furthermore, Chinese President Xi Jinping has advocated for a shift in China’s economy from a rapid growth model to a quality development model [39].
Finally, emergency management system reforms. In recent years, the Chinese government has made substantial efforts to enhance disaster resilience by implementing a series of reforms in the emergency management system. For example, the Program for Deepening the Reform of Party and State Institutions in 2018 introduced an emergency management system tailored to Chinese characteristics [40]. As part of this reform program, the Chinese government established the Ministry of Emergency Management of the People’s Republic of China in 2018 to centrally manage disaster-related emergencies. Moreover, urban disaster management in China transitioned from an ad hoc command structure to a permanent governance organization and shifted from a focus on response and recovery to a more comprehensive process that includes preparedness. This shift has made cities transition from a reactive stance to a proactive stance.
The above enhancements to UR in China are also positive responses to the Paris Agreement. In order to promote the improvement of UR to climate change, this global regulation proposes specific lines of action, namely (1) Early warning systems, (2) Emergency preparedness, (3) Slow onset events, (4) Events that may involve irreversible and permanent loss and damage, (5) Comprehensive risk assessment and management, (6) Risk insurance facilities, climate risk pooling and other insurance solutions, (7) Non-economic losses, and (8) Resilience of communities, livelihoods and ecosystems [6]. In recent years, the Chinese government has made extensive changes in the areas of early warning systems, emergency preparedness, ecosystem protection, and assistance for vulnerable people. The effectiveness of these changes is evident in disaster prevention efforts. For instance, the number of seismic monitoring stations increased from 2253 in 2018 to 6503 in 2021 [35]. Although China has made achievements in improving UR, there are still some areas that need to be upgraded according to the Paris Agreement. For example, when assessing climate change impacts and resilience, more attention should be given to vulnerable places, especially border cities such as Guangxi, Yunnan, Xinjiang, Gansu, and Tibet.
4.3. Regional Characteristics of Urban Resilience in China
The results in Figure 2 and Figure 4 show that the eastern, middle, and western regions exhibited relatively high, medium, and low average UR values, respectively. This finding is consistent with that obtained in Ref. [41], which calculated 30 provinces in China from 2007 to 2016 and opined that the eastern region is far higher than the central and western regions, and the western region is the lowest. This is attributable to the geographic locations and national policy support. As major municipalities in China, cities in the eastern region have been given priority in terms of economic development. Owing to sustained economic growth resulting from China’s reform and opening-up policies since 1978, these cities have better infrastructure development and social security systems. In addition, the policy of “the eastern region taking the lead” in China since 2006, which facilitated the economic development transformation in eastern provinces, also contributed to UR improvement in the eastern region. This policy primarily focused on enhancing the independent innovation capability in science and technology, adjusting the industrial structure, achieving industrial upgrading, and expanding and deepening access to the outside world. Furthermore, the policy emphasized that the eastern region should take the lead in development by strengthening its capacity for sustainable development. Emphasis was placed on improving the efficiency of natural resource utilization, addressing environmental pollution problems, and building an ecologically sustainable environment [42]. Therefore, the cities in the eastern region have demonstrated relatively strong UR.
Although UR values are relatively low in the middle and western regions, the results in Figure 4 also reveal that the UR values of the provinces in both regions significantly improved over the study period. Most of these provinces may have benefited from the policies of “the great development of the western region”, “promoting the rise of the central region”, and “revitalizing old industrial bases in the northeast and other areas” in China. These policies have promoted urban infrastructure construction, the development of industries with special characteristics and advantages, and ecological protection in the central and western regions.
According to the results shown in Figure 4, with the growth of cities, the regionalization of resilient cities becomes more pronounced, creating a clear class. Table 6 presents the five groups of provinces for the eastern, central, and western regions in 2021. The provinces in the extremely high resilience group and the high resilience group are all in the eastern region. However, the provinces in the low resilience group are all in the western region. The remaining provinces in the eastern and western regions and the provinces in the central region are in the moderate resilience group. The UR results suggest that China’s provinces can be categorized into four classes. The first category comprises only Beijing, which, being the capital of the country, exhibits the highest UR. The second category comprises coastal municipalities and provinces with excellent economic development, such as Tianjin, Shanghai, Jiangsu, Zhejiang, and Fujian. The third category comprises the remaining provinces except for the border provinces of the western region; this category includes some eastern provinces, all central provinces, and some western provinces. The fourth category comprises relatively low-performing provinces, which are the border provinces of the western region, including Xinjiang, Tibet, Yunnan, and Guangxi. Therefore, the development of UR in China’s 31 provinces is led by Beijing, followed by the coastal provinces in the eastern region, and gradually decreasing with greater proximity to the border western region.
Table 6.
Five groups of provinces for the eastern, central, and western regions in 2021.
4.4. Policy Implications
Some policy suggestions are thus proposed to improve UR in Chinese provinces:
First, emergency management policies should be explored and developed in echelons, considering the varying levels of UR across provinces. Provinces with the best UR performance, namely the first-tier and second-tier provinces in Section 4.3, such as Beijing, Tianjin, Shanghai, Jiangsu, Zhejiang, and Fujian, should be promoted as exemplary models for sharing experiences with other provinces. These provinces need to further improve UR by upgrading urban emergency infrastructure construction and promoting environmental protection. The local governments in the third-tier provinces, belonging to the moderate resilience group, including some eastern provinces, all central provinces, and some western provinces, need to establish relevant policies to promote UR, not only economic development. The fourth-tier provinces feature a low economic development status, which are the border provinces of the western region, including Xinjiang, Tibet, Yunnan, and Guangxi. While these provinces need to prioritize economic development, taking measures for UR building is also important. For example, the local governments should improve the economy without increasing ecological pressure [43] and should promote education, which improves the awareness of disaster prevention and reduction among the public.
Second, governments should consider establishing a unified UR monitoring platform and implementing a regional UR information-sharing and monitoring mechanism. This monitoring platform would play a crucial role in monitoring, early warning, command, and information sharing, adapting to the needs of management during normal, non-emergency periods, and efficient dispatching during emergencies. The central government should design a framework and define the type, scope, and conditions of data sharing according to the framework. Basic data standards and norms should be established to promote the convergence and integration of various types of data and their orderly flow in accordance with the law.
Third, local governments should establish mechanisms to cooperate particularly closely with the high-performance provinces. Furthermore, all Chinese provinces should be encouraged to cooperate with other high-UR cities internationally. The central government should design a framework that provides guidelines for cities to share UR experiences and practices gained in an international context. The sharing of UR experiences is also encouraged by the Paris Agreement [6], which specified requirements for the sharing of information, good practices, experiences, and lessons learned, including, as appropriate, as these relate to science, planning, policies, and implementation in relation to adaptation actions.
Finally, industries should be restructured and upgraded. China should vigorously develop UR industries. This approach could provide specialized products and services for natural disasters, accidents, calamities, public health incidents, social security incidents, and other types of emergencies (such as safety precautions, emergency preparedness, monitoring, early warning, disposal, and rescue).
Despite the contributions of this study, further research is needed to address its limitations. First, the spatial correlation among various provinces in terms of UR should be further studied. Second, the driving mechanism of UR should be explored. Third, a complex system based on urban complex systems theory should be considered in future studies, and predictions should be made so as to compensate for the lag in data release as well as to provide a reference for future UR development.
5. Conclusions
The UR performance indicates the resilience of urban regions to frequent extreme weather events and natural disasters. Studying the UR levels of Chinese provinces is crucial. This study constructed an index system for evaluating the UR performance. The UR of 31 provinces from 2005 to 2021 was measured using the entropy method. The empirical results showed that (1) the UR was significantly different between provinces in China, with Beijing, Shanghai, Tianjin, Zhejiang, Jiangsu, and Fujian being the top performers and Guangxi, Yunnan, Xinjiang, and Tibet being the bottom. (2) The overall performance of UR in China was relatively low, with an average value of 0.2390, but UR significantly improved over the years from 2005 to 2021. (3) Different regions significantly differed in UR values. Generally, the eastern, middle, and western regions exhibited relatively high, medium, and low average UR values, respectively.
Overall, this paper provides a comprehensive overview of UR performance at the provincial level in China. It highlights that pursuing UR improvement is a key goal in urban development. The research findings provide valuable references for investigating UR in other countries and contribute to the development of the literature on urban disaster management.
Author Contributions
Conceptualization, T.Y. and L.W.; methodology, T.Y.; software, T.Y.; data curation, T.Y.; writing—original draft preparation, T.Y.; writing—review and editing, L.W. All authors have read and agreed to the published version of the manuscript.
Funding
This research was funded by the Research Center for Construction Economics and Management, grant number 2022CDJSKPT25.
Data Availability Statement
The original contributions presented in the study are included in the article, further inquiries can be directed to the corresponding author.
Conflicts of Interest
The authors declare no conflicts of interest.
Appendix A
Table A1.
Framework of indicators selected for UR assessment.
Table A1.
Framework of indicators selected for UR assessment.
| First Level Indicator | Second Index | Preparedness | Response | Recovery |
|---|---|---|---|---|
| Population resilience | R1. Urban population density | ● | ● | ● |
| R2. Natural growth rate | ● | ● | ● | |
| R3. Proportion of the population aged 65 and over | ● | ● | ● | |
| R4. Urban registered unemployment rate | ● | ● | ● | |
| R5. Proportion of the population with certified disabilities | ● | ● | ● | |
| R6. Proportion of orphans | ● | ● | ● | |
| R7. Illiteracy as a percentage of the population aged 15 years and over | ● | ● | ● | |
| R8. Proportion of the population with higher education | ● | ● | ● | |
| R9. Proportion of the population not attending school | ● | ● | ● | |
| R10. Proportion of urban migrant population | ● | ● | ● | |
| R11. Proportion of rural population | ● | ● | ● | |
| R12. Population affected by natural disasters | ● | ● | ● | |
| R13. Basic medical insurance coverage | ○ | ● | ● | |
| R14. Unemployment insurance coverage | ○ | ○ | ● | |
| R15. Endowment insurance coverage rate | ○ | ○ | ● | |
| R16. Traffic accident rate | ○ | ● | ● | |
| Social resilience | R17. Number of social organizations per 104 persons | ● | ● | ● |
| R18. Number of autonomous organizations per 104 persons | ● | ● | ● | |
| R19. Number of social institutions per 104 persons | ● | ● | ● | |
| Economic resilience | R20. Per capita disposal income | ● | ● | ● |
| R21. Proportion of the population with a minimum living allowance | ● | ● | ● | |
| R22. GDP per capita | ● | ● | ● | |
| R23. Fiscal revenue per capita | ● | ● | ● | |
| R24. Balance of savings deposits per capita | ○ | ○ | ● | |
| R25. Number of banking institutions per 104 persons | ○ | ○ | ● | |
| R26. Ratio of large and medium-sized enterprises to small enterpris-es | ○ | ○ | ● | |
| R27. Ratio of tertiary value added to GDP | ○ | ○ | ● | |
| R28. Ratio of gross domestic fixed investment to GDP | ● | ○ | ● | |
| R29. Ratio of the actual use of foreign capital to GDP | ○ | ○ | ● | |
| R30. Ratio of R&D expenditure to GDP | ○ | ○ | ● | |
| R31. Ratio of direct economic losses due to disasters to regional GDP | ● | ● | ● | |
| Safeguarding facility resilience | R32. Perinatal mortality rate | ○ | ● | ○ |
| R33. Mortality rates of category A and B notifiable infectious diseases | ○ | ● | ○ | |
| R34. Proportion of homes built after 1980 | ● | ● | ● | |
| R35. Proportion of households that own a home | ○ | ● | ● | |
| R36. Comprehensive production capacity of water supply per capita | ○ | ● | ○ | |
| R37. Density of urban drainage network | ○ | ● | ○ | |
| R38. Electricity resources per capita | ○ | ● | ○ | |
| R39. Gas penetration rate | ○ | ● | ○ | |
| R40. Mobile phone penetration | ○ | ● | ○ | |
| R41. Fixed broadband household penetration | ○ | ● | ○ | |
| R42. Private car ownership per person | ○ | ● | ○ | |
| R43. Retail chain stores per 104 persons | ○ | ● | ○ | |
| R44. Public schools per 104 persons | ○ | ● | ○ | |
| R45. Number of accommodation enterprises above quota per 104 persons | ○ | ● | ○ | |
| R46. Number of beds in healthcare facilities per 104 persons | ○ | ● | ○ | |
| R47. Health technicians per 104 persons | ○ | ● | ○ | |
| R48. Road area in built-up areas | ○ | ● | ● | |
| R49. Food production per capita | ○ | ● | ● | |
| R50. Construction workers per 104 persons | ● | ○ | ● | |
| R51. Number of building construction enterprises per 104 persons | ● | ○ | ● | |
| R52. Ratio of investment in geohazard prevention and control to GDP | ● | ● | ● | |
| R53. Density of automatic weather stations | ● | ● | ● | |
| R54. Density of seismic monitoring stations | ● | ● | ● | |
| Ecological resilience | R55. Forest coverage rate | ● | ○ | ○ |
| R56. Green park area per capita | ● | ○ | ○ | |
| R57. Greening coverage in built-up areas | ● | ○ | ○ | |
| R58. Ratio of wetland area to the jurisdictional area | ● | ○ | ○ | |
| R59. Proportion of days with good air quality | ● | ○ | ○ | |
| R60. Sulfur dioxide emissions per unit of GDP | ● | ○ | ○ | |
| R61. Chemical oxygen demand emissions per unit of GDP | ● | ○ | ○ | |
| R62. Ammonia nitrogen emissions per unit of GDP | ● | ○ | ○ | |
| R63. Industrial smoke (dust) emissions per unit of GDP | ● | ○ | ○ | |
| R64. Ratio of domestic garbage harmless treatment | ● | ● | ● | |
| R65. Sewage treatment capacity | ● | ● | ● | |
| R66. Integrated reuse of common industrial solid waste | ● | ● | ● |
● Great impact on the phase; ○ Little or no impact on the phase.
References
- IFRC (International Federation of Red Cross and Red Crescent Societies). 2021 Global Disaster Assessment Report. Available online: https://www.preventionweb.net/publication/2021-global-disaster-assessment-report (accessed on 26 December 2023).
- Sharifi, A. Resilient urban forms: A review of literature on streets and street networks. Build. Environ. 2019, 147, 171–187. [Google Scholar] [CrossRef]
- United Nations; Department of Economic and Social Affairs; Population Division. World Urbanization Prospects: The 2014 Revision: Highlights; United Nations: New York, NY, USA, 2014. [Google Scholar]
- Li, H.; Yu, L. Chinese Eco-city Indictor Construction. Urban Stud. 2011, 18, 81–86. [Google Scholar]
- Cutter, S. Resilience to What? Resilience for Whom? Geogr. J. 2016, 182, 110–113. [Google Scholar] [CrossRef]
- UR (United Nations). Paris Agreement on Framework Convention on Climate Change. Available online: http://unfccc.int/resource/docs/2015/cop21/eng/10a01.pdf (accessed on 25 December 2023).
- UR (United Nations). Sustainable Development Goals. Available online: https://www.un.org/sustainabledevelopment/sustainable-development-goals/ (accessed on 25 December 2023).
- CPGPRC (Central People’s Government of the People’s Republic of China). The 14th Five Year Plan of China. Available online: https://www.gov.cn/zhengce/2020-11/03/content_5556991.htm (accessed on 25 December 2023).
- CPGPRC (Central People’s Government of the People’s Republic of China). Report at the 20th National Congress of the Communist Party of China. Available online: https://www.gov.cn/xinwen/2022-10/25/content_5721685.htm (accessed on 25 December 2023).
- The People’s Government of Beijing Municipality. Guidance on Accelerating the Construction of Resilient Cities. Available online: https://www.beijing.gov.cn/zhengce/zhengcefagui/202111/t20211111_2534214.html?eqid=c5a41298000396630000000464848ff9 (accessed on 25 December 2023).
- The People’s Government of Shanghai. Main Tasks of Shanghai in 2023. Available online: https://www.shanghai.gov.cn/2023nzyrw/20230117/75af03739d34418a8a18a2f390bf45e0.html (accessed on 25 December 2023).
- Leichenko, R. Climate Change and Urban Resilience. Curr. Opin. Environ. Sustain. 2011, 3, 164. [Google Scholar] [CrossRef]
- UNDRR (United Nations Office for Disaster Risk Reduction). Disaster Risk Reduction Terminology. Available online: https://www.undrr.org/drr-glossary/terminology (accessed on 27 December 2023).
- Shi, T.; Qiao, Y.; Zhou, Q. Spatiotemporal evolution and spatial relevance of urban resilience: Evidence from cities of China. Growth Chang. 2021, 52, 2364–2390. [Google Scholar] [CrossRef]
- Ahern, J. From fail-safe to safe-to-fail: Sustainability and resilience in the new urban world. Landsc. Urban Plan. 2011, 100, 341–343. [Google Scholar] [CrossRef]
- Holling, C.S. Resilience and Stability of Ecological Systems. Annu. Rev. Ecol. Syst. 1973, 4, 1–23. [Google Scholar] [CrossRef]
- Motesharrei, S.; Rivas, J.; Kalnay, E.; Asrar, G.R.; Busalacchi, A.J.; Cahalan, R.F.; Cane, M.A.; Colwell, R.R.; Feng, K.; Franklin, R.S. Modeling Sustainability: Population, Inequality, Consumption, and Bidirectional Coupling of the Earth and Human Systems. Natl. Sci. Rev. 2016, 3, 470–494. [Google Scholar] [CrossRef]
- Cutter, S.; Derakhshan, S. Temporal and spatial change in disaster resilience in US counties, 2010–2015. In Environmental Hazards and Resilience; Routledge: London, UK, 2021; pp. 51–70. [Google Scholar]
- Jiang, K.; Li, K.; Cong, N.; Wu, S.; Peng, F. Spatial-Temporal Variation Characteristics and Obstacle Factors of Resilience in Border Cities of Northeast China. Land 2023, 12, 958. [Google Scholar] [CrossRef]
- Chen, Y.; Su, X.; Zhou, Q. Study on the Spatiotemporal Evolution and Influencing Factors of Urban Resilience in the Yellow River Basin. Int. J. Environ. Res. Public Health 2021, 18, 10231. [Google Scholar] [CrossRef] [PubMed]
- Deng, H.; Liu, K. Spatiotemporal Evolution of Urban Resilience and Spatial Spillover Effects in Guangdong Province, China. Land 2023, 12, 1800. [Google Scholar] [CrossRef]
- Zheng, Y.; Xie, X.-L.; Lin, C.-Z.; Wang, M.; He, X.-J. Development as adaptation: Framing and measuring urban resilience in Beijing. Adv. Clim. Chang. Res. 2018, 9, 234–242. [Google Scholar] [CrossRef]
- Chambers, R.; Conway, G. Sustainable rural livelihoods: Practical concepts for the 21st century. In Sustainable Rural Livelihoods: Practical Concepts for the 21st Century; Institute of Development Studies: Brighton, UK, 1992; Volume 296. [Google Scholar]
- Chambers, R. Rapid appraisal for improving existing canal irrigation systems. Int. J. Water Resour. Dev. 1987, 3, 73–87. [Google Scholar] [CrossRef]
- Glavovic, B.; Scheyvens, R.; Overton, J. Waves of adversity, layers of resilience: Exploring the sustainable livelihoods approach. In Proceedings of the 3rd Biennial Conference of the International Development Studies, Network of Aotearoa; Massey University: Auckland, New Zealand, 2002. [Google Scholar]
- Keating, A.; Campbell, K.; Szoenyi, M.; McQuistan, C.; Nash, D.; Burer, M. Development and testing of a community flood resilience measurement tool. Nat. Hazards Earth Syst. Sci. 2017, 17, 77–101. [Google Scholar] [CrossRef]
- Peacock, W. Advancing the Resilience of Coastal Localities: Developing, Implementing and Sustaining the Use of Coastal Resilience Indicators: A Final Report; Hazard Reduction and Recovery Center: College Station, TX, USA, 2010. [Google Scholar]
- Rizzi, P.; Graziano, P.; Dallara, A. A capacity approach to territorial resilience: The case of European regions. Ann. Reg. Sci. 2018, 60, 285–328. [Google Scholar] [CrossRef]
- Zhou, Q.; Zhu, M.; Qiao, Y.; Zhang, X.; Chen, J. Achieving resilience through smart cities? Evidence from China. Habitat Int. 2021, 111, 102348. [Google Scholar] [CrossRef]
- The People’s Government of Beijing Municipality. Beijing Urban Master Plan (2016–2035). Available online: https://www.beijing.gov.cn/gongkai/guihua/wngh/cqgh/201907/t20190701_100008.html?eqid=8ab560dd014ba62c000000026432b5a2 (accessed on 15 December 2023).
- The People’s Government of Tianjin. Tianjin Emergency Management “14th Five-Year” Plan. Available online: https://www.tj.gov.cn/zwgk/szfwj/tjsrmzfbgt/202108/t20210816_5534668.html (accessed on 15 December 2023).
- Fujian Provincial Department of Housing and Urban-Rural Development. Response to “Suggestions on Promoting Resilient Cities in Fujian Province”. Available online: https://zjt.fujian.gov.cn/xxgk/rdjyhzxtabl/rdjyblqk/202305/t20230506_6164003.htm (accessed on 10 December 2023).
- Na, L.; Guanglai, Z.; Ning, Z. Comprehensive evaluation and regional heterogeneity analysis of urban resilience in China. Stat. Decis. 2023, 39, 117–120. [Google Scholar]
- Shan, X.; He, M.; Li, R.; Wang, J. The Spatial-Temporal Differentiation Characteristics of Urban Resilience and Influencing Factors in China. J. Anhui Norm. Univ. (Nat. Sci.) 2022, 45, 476–484. [Google Scholar] [CrossRef]
- CSY(China Statistical Yearbook). China Statistical Yearbook. 2021. Available online: https://www.stats.gov.cn/sj/ndsj/2021/indexch.htm (accessed on 15 December 2023).
- Liu, J. An Empirical Analysis on Urban-rural Disparity of Compulsory Education Resource Allocation in Guangxi. BCP Educ. Psychol. 2022, 4, 173–178. [Google Scholar] [CrossRef]
- Wang, D.; Ding, W. Spatial pattern of the ecological environment in Yunnan Province. PLoS ONE 2021, 16, e0248090. [Google Scholar] [CrossRef]
- Zhang, Y.; Shen, L.; Shuai, C.; Bian, J.; Zhu, M.; Tan, Y.; Ye, G. How is the environmental efficiency in the process of dramatic economic development in the Chinese cities? Ecol. Indic. 2019, 98, 349–362. [Google Scholar] [CrossRef]
- CPGPRC (Central People’s Government of the People’s Republic of China). Report at the 19th National Congress of the Communist Party of China. Available online: https://www.gov.cn/zhuanti/2017-10/27/content_5234876.htm (accessed on 20 December 2023).
- Zheng, Z.; Li, Z.H. Emergency Management System Construction with Chinese Characteristics: Realistic Foundation, Existing Problems and Development Strategy. J. Manag. World 2022, 38, 138–144. [Google Scholar] [CrossRef]
- Zhang, M.D.; Feng, X.Q. Comprehensive evaluation of urban resilience in China. J. Urban Probl. 2018, 10, 27–36. [Google Scholar] [CrossRef]
- CPGPRC (Central People’s Government of the People’s Republic of China). The 11th Five Year Plan of China. Available online: https://www.gov.cn/gongbao/content/2006/content_268766.htm?eqid=961a773e000272db000000036494fdd5 (accessed on 10 December 2023).
- Jorgenson, A.K.; Dietz, T. Economic growth does not reduce the ecological intensity of human well-being. Sustain. Sci. 2015, 10, 149–156. [Google Scholar] [CrossRef]
Disclaimer/Publisher’s Note: The statements, opinions and data contained in all publications are solely those of the individual author(s) and contributor(s) and not of MDPI and/or the editor(s). MDPI and/or the editor(s) disclaim responsibility for any injury to people or property resulting from any ideas, methods, instructions or products referred to in the content. |
© 2024 by the authors. Licensee MDPI, Basel, Switzerland. This article is an open access article distributed under the terms and conditions of the Creative Commons Attribution (CC BY) license (https://creativecommons.org/licenses/by/4.0/).