Abstract
Transportation significantly influences economically underdeveloped arid regions, impacting economic growth and social progress. Analyzing Transport Superiority Degree (TSD) and its implications in such regions is crucial. A new arid region-specific evaluation framework addresses traditional limitations by considering indicators like route connectivity and desert interference. This article conducts an empirical study using Southern Xinjiang as a research case. It combines comprehensive evaluation methods, spatial autocorrelation methods, spatial Durbin models, and coupling coordination models to depict Transport Support Capability (TSC), Transport Access Capacity (TAC), and Transport Guarantee Capacity (TGC) at different scales in Southern Xinjiang from 2000 to 2020. The study reveals spatial patterns, evolutionary characteristics, economic impacts, and social effects of TSD at various scales. Key findings include: (1) Rapid expansion of transportation infrastructure in Southern Xinjiang. The levels of TSD at different scales have gradually increased, and spatial and temporal pattern differences are evident. At the county level, TSD forms a “core-periphery” spatial pattern centered around the Southern Xinjiang Railway, with “high-high” agglomeration areas centered around Kashgar city and “low-low” agglomeration areas centered around Qiemo County. (2) Prefectural-level TSD improvements have limited impacts on regional development, while county-level TSC, TAC, TGC, and TSD positively affect economic and social growth but also exhibit competitive effects. (3) TSD is transitioning from non-coordinated to coordinated development with economic and social progress at different scales. This research informs transportation facility evaluation in arid regions.
1. Introduction
The comprehensive assessment of regional transportation conditions plays a crucial role in regional development, serving as a vital tool to ensure coordination between transportation systems and the economy and society. Initially, scholars evaluated transportation conditions in various regions, including Europe [1], Southeast Asia [2], and France [3], using accessibility methods. However, these evaluations did not fully capture the breadth of regional transportation quality. In 2008, Jin et al. introduced a comprehensive evaluation index known as “Transport Superiority Degree” (TSD), which assesses the quality of regional transportation conditions using three key indicators: road network density, mainline impact degree, and locational advantage [4]. This index aimed to provide a holistic depiction of regional transportation conditions. Subsequently, many scholars applied and further developed TSD assessments in regions with diverse characteristics, including provinces [5], counties [6], rural areas [7], and mountainous terrain [8]. Notable advancements have centered around the following: improved indicator selection: various indicators have been developed to address specific issues, such as accessibility to different transportation modes [9], weighted shortest distance [10], road traffic volume [11], and population density weighting [12]. These indicators aim to capture the nuances of regional transportation service supply and demand; enhanced calculation accuracy: evaluations have been refined by considering factors such as airports [9], seaports [5], proximity to highways and their exits [13], and incorporating terrain correction coefficients or terrain impact factors [8]. These refinements ensure that assessments better reflect real-world conditions, particularly in regions with significant terrain variations; and adapting to transportation trends: the discussion of regional TSD now incorporates considerations of rapid transportation, especially high-speed rail development [6,13]. The existing research literature has predominantly focused on the “Quantity, Quality, Superiority” aspects of TSD, with limited exploration of expanding indicator dimensions based on the concept’s connotations. TSD, which reflects the quality of regional transportation development conditions, should be constructed based on regional characteristics and development goals. In light of the proposal for high-quality development and national spatial planning, defining the connotations of TSD and developing new research methods present fresh challenges and opportunities [14,15]. The development of transportation infrastructure is now expected to be more comprehensive, encompassing not only accessibility but also factors like foresight, resilience, and fairness [16,17]. Consequently, the existing “Quantity, Quality, Superiority” indicators of TSD may fall short in addressing new development connotations and evaluation requirements.
Significant TSD often signifies promising development potential and serves as a fundamental foundation for the spatial layout of regional economic and social activities [18]. However, research on the economic and social effects of TSD remains relatively limited, with most studies focusing on the spatial coupling between transportation and economic and social development [19,20,21]. In reality, the economic and social effects of transportation have long been a prominent topic in transportation geography and related fields [10,18,22,23]. Previous studies have primarily analyzed the impact of virtual variables or single indicators of transportation infrastructure, such as density, accessibility, and connectivity, on economic and social development [13], with limited exploration of comprehensive indicators like TSD. Moreover, there is a paucity of research exploring the differences in economic and social effects of TSD across its various dimensions.
Since the implementation of the Western Development Strategy by the Chinese government, Southern Xinjiang’s transportation system has undergone significant changes over the past two decades. Comprehensive development initiatives have been undertaken in railways, airports, and high-grade highways connecting towns and townships. However, existing research on Southern Xinjiang’s transportation development has primarily focused on transportation volume assessments [24], transportation environmental monitoring [25], and transportation route safety [26]. These studies have primarily utilized easily accessible data from highways and railways due to the challenges associated with obtaining data for county and township roads in Southern Xinjiang. Most research findings are limited to the period around 2015–2020 [25,26], lacking a long-term perspective on the evolution of transportation development. Additionally, the central part of Southern Xinjiang features China’s largest mobile desert, covering 31% of the region’s total area. Transportation routes connecting oasis towns on the desert’s edge are susceptible to wind and sand disturbances [26], presenting challenges to their transportation security capabilities. Southern Xinjiang’s geographical location, situated at the end of China’s economic and social development, has prompted the government to adopt the policy of “building roads before prosperity”. Substantial funding has been allocated to transportation construction in Southern Xinjiang, including the construction of the first Southern Xinjiang railway to Kashgar in 2000 and the completion of the first Southern Xinjiang highway in October 2015. However, the actual impact of government-invested transportation routes on the economic and social development of Southern Xinjiang has been a subject of continuous scrutiny [27].
In light of these considerations, this paper seeks to broaden the connotations of TSD by considering Transport Support Capability (TSC), Transport Access Capacity (TAC), and security capacity. Utilizing Southern Xinjiang as a case study, this research aims to provide a conceptual framework for TSD, enhance the evaluation system for TSD in the new era, unveil the economic and social effects of TSD, and better address the evaluation and application needs of regional transportation facilities in arid regions like Southern Xinjiang. Furthermore, this paper will establish a long-term database of transportation networks at various levels, including airports, highways, railways, national roads, provincial roads, county roads, and township roads for the years 2000, 2010, and 2020. It will consider both prefectural and county scales to cater to the requirements of different levels of government, offering more targeted policy recommendations.
2. Material and Methods
2.1. Study Area
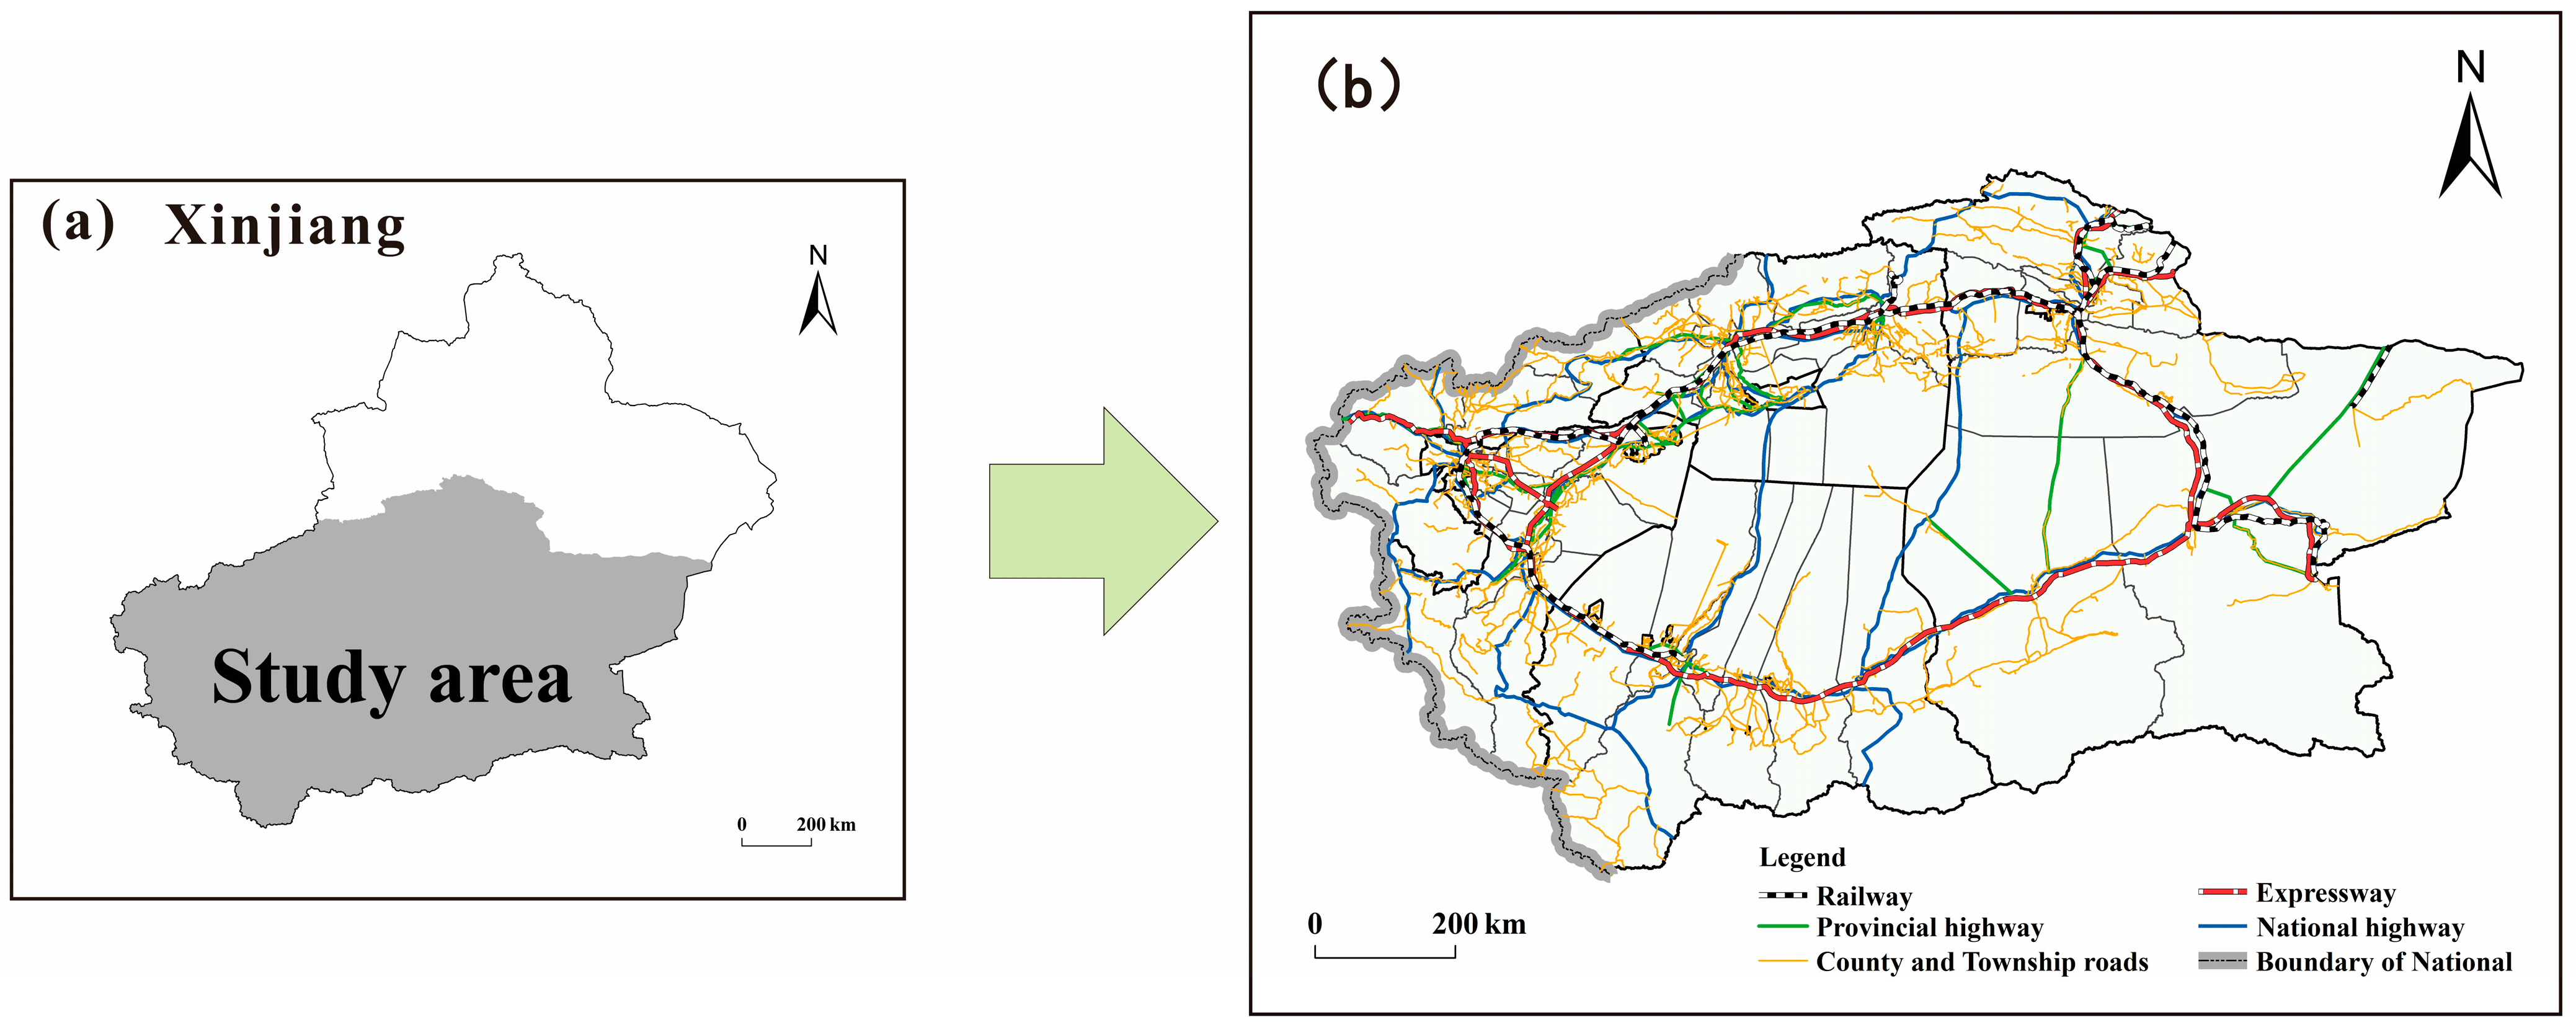
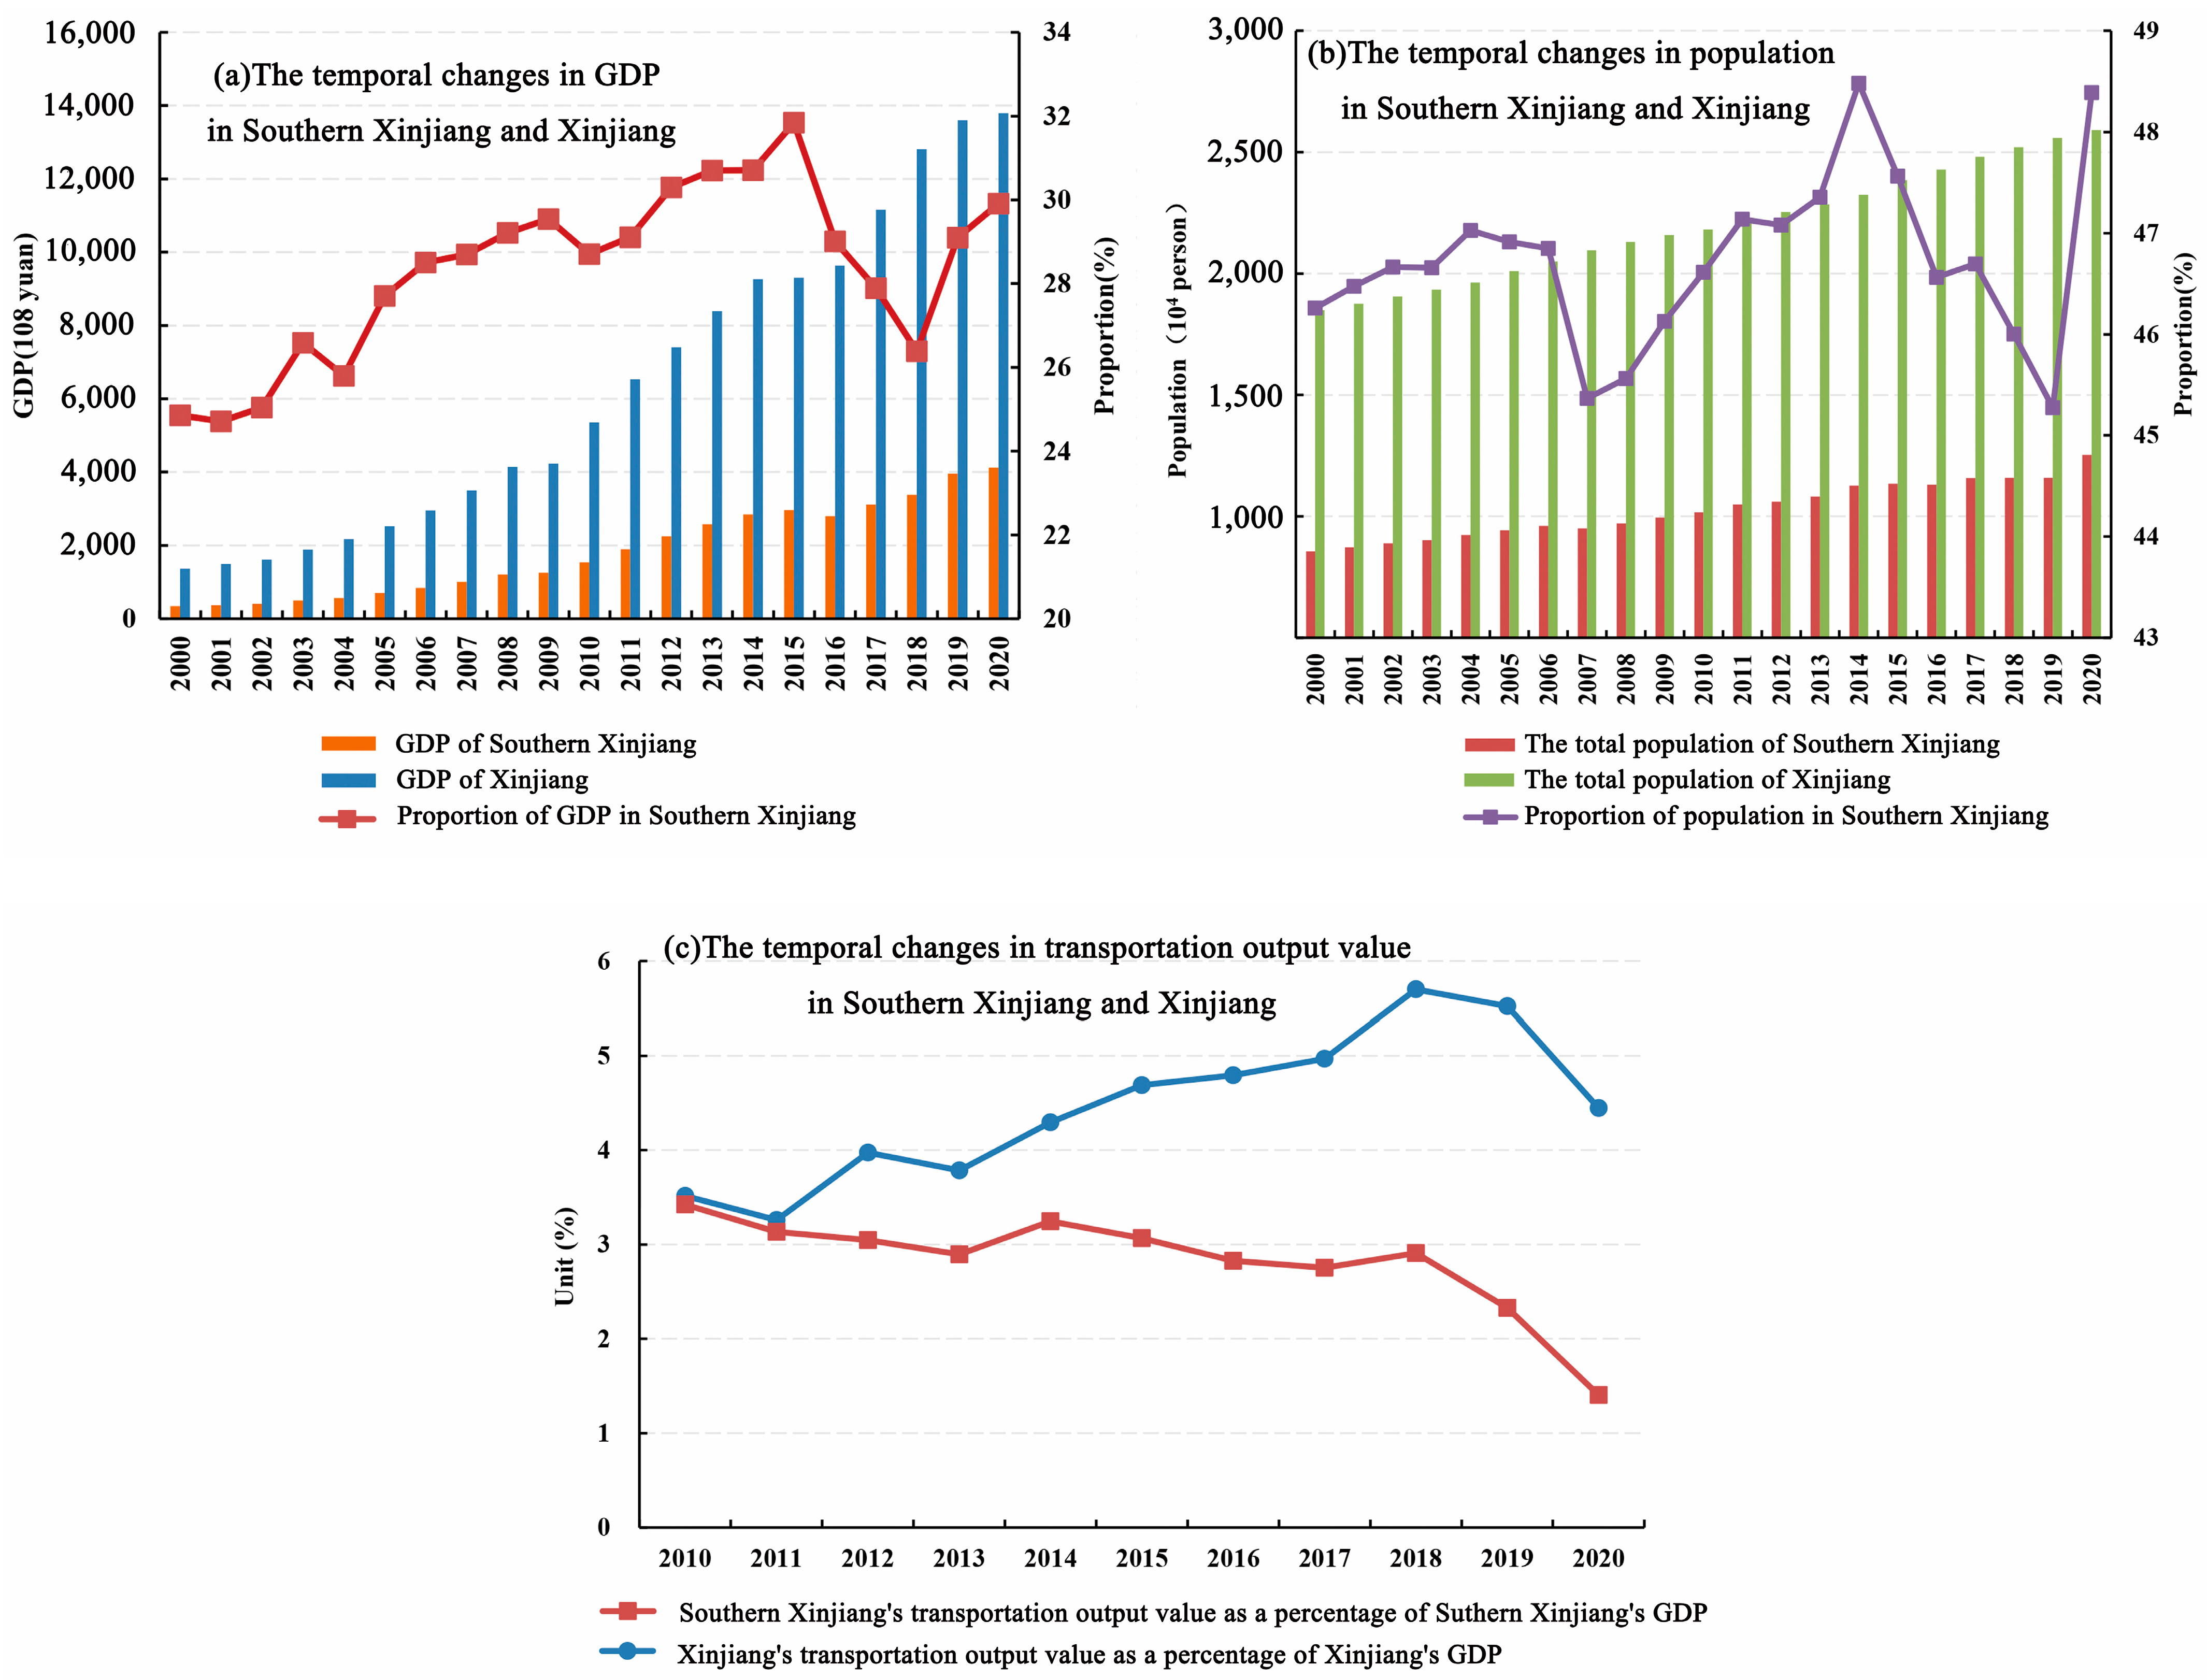
Southern Xinjiang encompasses the region located south of the Tianshan Mountains in the Xinjiang Uygur Autonomous Region, China. This expansive region includes several administrative divisions, such as Aksu Prefecture, Hotan Prefecture, Kashgar Prefecture, Kizilsu Kirghiz Autonomous Prefecture, Bayingolin Mongol Autonomous Prefecture, Aksu City, Tumxuk City, and Kunyu City, comprising a total of five prefectures and 46 county-level administrative areas (Figure 1). Southern Xinjiang is distinguished by its vastness and is home to the Taklimakan Desert, the world’s second-largest mobile desert. It covers a land area of 1.063 million square kilometers, which accounts for 65.135% of Xinjiang’s total land area. Between 2000 and 2020, the Southern Xinjiang region experienced consistent growth in total economic output, achieving an average annual growth rate of 13.312% (Figure 2a). By 2020, the GDP had reached CNY 412.712 billion, constituting 29.912% of Xinjiang’s overall GDP (Xinjiang’s GDP is CNY 13,797.580 billion). Southern Xinjiang supports a relatively substantial population, with a total of 12.532 million people in 2020, representing 48.387% of Xinjiang’s total population. Over the period from 2010 to 2020, the proportion of the transportation and logistics industry’s output value to Xinjiang’s GDP exhibited an overall upward trajectory, whereas in Southern Xinjiang, it displayed a continuous decline (Figure 2c).
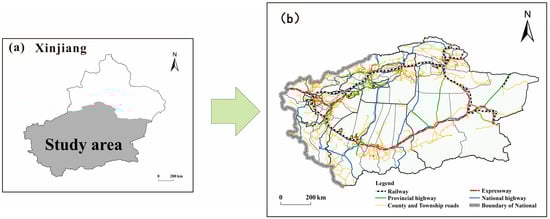
Figure 1.
(a) is the location of Southern Xinjiang in Xinjiang, (b) is the scope of Southern Xinjiang.
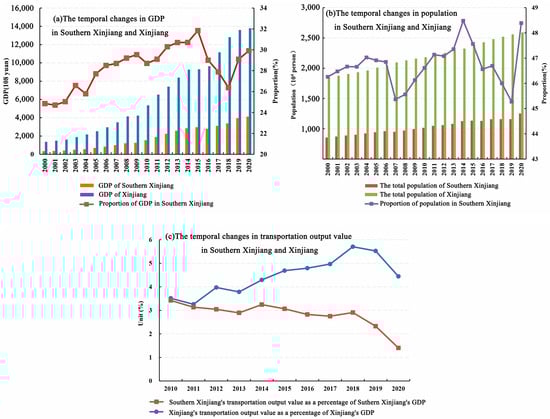
Figure 2.
The temporal changes in population, GDP, and transportation output value in Southern Xinjiang and Xinjiang.
2.2. Data Sources
This study focuses on five prefectures and 46 county-level units located south of the Tianshan Mountains in the Xinjiang Uygur Autonomous Region of China. The spatial scope of the county-level units for the years 2000, 2010, and 2020 has been standardized for the research. Data sources, as presented in Table 1, primarily include administrative data, county seat data, land-use data, transportation data, and socio-economic data. To investigate the evolving patterns of transportation development in the Southern Xinjiang region over a 20-year period and its effects on the economy and society, we utilized transportation data and corresponding socio-economic data for the years 2000, 2010, and 2020 while taking into consideration the data’s availability and comparability.

Table 1.
Data sources and descriptions.
2.3. Research Methods
2.3.1. Evaluation Method for TSD
In this section, we will construct an index system for TSD based on the traditional TSD index system, focusing on three dimensions: “support”, “access”, and “guarantee”. Among these, TSC reflects the quantity and quality of transportation facilities; TAC represents the radiation opportunities and development potential brought by transportation facilities to the region, as seen in internal and external accessibility and connectivity; TGC pertains to the ability of transportation facilities to provide services stably.
Evaluate TSC
The TSC required for regional development is defined as the ability of transportation facilities to support and accommodate various transportation activities. The development of this concept and its theoretical foundation can draw on relevant concepts and theories of carrying capacity [19]. TSC comprehensively assesses the scale and quality of transportation facilities in the region and consists of two indicators: road network density and the impact degree of transportation mainlines. These indicators reflect the ability of transportation facilities in various basic evaluation units to accommodate transportation activities, corresponding to the “quantity” and “quality” in classical TSD, which reflect the scale and grade of transportation facilities. It is worth noting that the assessment indicator of the impact degree of transportation mainlines is not limited to the evaluation object itself but also includes its adjacent facilities, considering them as a certain degree of accessibility, similar to the concept of “accessibility” in transportation systems such as accessible stations, airports, and entry into mainline networks.
(1) Road density (DEN): road density refers to the length of transportation facilities per unit of land area. A higher road density indicates more densely connected accessibility in the region [6].
In the formula, represents the road density of region ; is the total length of the transportation road network within region ; is the land area of region minus the glacier area within region . Generally speaking, a region with denser road density may have better development potential for its economy and society.
(2) Transport trunk line influence degree (TID): the transport trunk line influence degree reflects whether the region has or is adjacent to important transportation facilities or mainlines. The significant infrastructure in this paper includes airports, railways, and roads, including expressways, national highways, provincial highways, county roads, and township roads. Based on the technical and economic characteristics of transportation facilities and following the concept of expert scoring (Table 2), the algorithm and weights are set using classical methods [4].
Table 2.
Scores for different types of transportation.
In the formula, represents the transport trunk line influence degree of county , where m refers to transportation modes such as roads, civil aviation, railways, etc., and represents the technical level score corresponding to types of transportation facilities in county .
Evaluate TAC
TSC cannot directly reflect the opportunities and potential brought by the transportation system to regional development. Therefore, the classic TSD uses “locational advantage” as the evaluation indicator to assess the “radiation opportunities and development potential” of a region. With the advancement of data acquisition and calculation technology, this study proposes the use of TAC to measure the opportunities and potential brought by the transportation system to regional development. Referring to various existing evaluations of internal and external transportation within the region [13] and integrating economic weighting, multiple modes of transportation, etc., it uses internal accessibility and external accessibility to measure transportation access capacity.
(1) Internal accessibility (IA): internal accessibility reflects the development or service opportunities that each evaluation unit obtains through the transportation network within the study area. In this study, with reference to measurement methods from various relevant literature, each of the 46 counties is taken as an evaluation unit. The evaluation is carried out using the respective county government seats as starting points and destinations. It combines the shortest time distance with the potential model approach weighted by regional quality for assessment.
where GDP represents the economic scale of the county, indicating regional quality; is the shortest time distance, and and represent the evaluation unit counties and their respective other destinations (45 counties).
(2) Exterior accessibility (EA): exterior accessibility reflects the extent to which the region receives radiation and opportunities from other central cities in the region [6].
In the formula, represents the locational advantage of the evaluated unit . represents the shortest time distance from the evaluated unit i to the key spatial node j in the region. In this study, based on a 1 km × 1 km grid dataset, the cost-weighted distance method is used to calculate the values, with time costs assigned to each grid cell (Table 3 and Table 4). represents the number of key spatial nodes. This research selects four central cities in the region (Korla, Kashgar, Aksu, and Hotan) as the key spatial nodes, as these nodes play a crucial role in the macro development pattern of the region, radiating and driving its development.
Table 3.
Transport type and time cost scores.
Table 4.
Terrain slope and time cost scores.
Evaluate TGC
Areas with high support or accessibility capacity, if their transportation systems are extremely vulnerable and unable to withstand various risks, will significantly reduce the local TSD. If not considered, this may lead to an “overestimation” of the regional transportation conditions. Therefore, “security capacity” is an important dimension for evaluating transportation conditions based on realism and regional specificity. The security capacity of transportation for regional development is a rather complex concept with multiple perspectives [28], and it is rarely addressed separately in the classical TSD index system. This paper believes that the transportation system does not operate in a completely deterministic environment. TGC aims to reflect whether the regional transportation infrastructure can provide transportation services stably when disturbed. This ability is particularly important for regional security and emergency preparedness. Considering the characteristics of transportation in Southern Xinjiang, this paper will evaluate it from two aspects: route connectivity and desert interference.
(1) Traffic route connectivity (RC): traffic route connectivity is aimed at evaluating the network level of the transportation system, reflecting the inherent network development status of the transportation system, and its structural capacity to resist the impact of events. In this paper, spatial syntax-based route connectivity is used to reflect the stability of its intrinsic structure. The calculation involves averaging the connectivity of all road segments within region . A higher numerical value indicates that there are more road segments connecting various nodes within the region, indicating a better network development status [26].
In the formula, represents the route connectivity of assessment unit , stands for the actual number of connections, and represents the number of transportation nodes.
(2) Desert Interference Index (DI): most of the transportation routes in Southern Xinjiang either encircle or traverse the Taklamakan Desert. These routes are highly susceptible to desert-related issues, such as roads getting submerged by nearby deserts or obstructed by sandstorms, leading to reduced road travel speeds and, consequently, affecting the overall traffic capacity and accessibility over a larger area [26]. In this paper, considering the distribution of deserts in Southern Xinjiang, we propose the Desert Interference Index for transportation routes.
where represents the Desert Interference Index; is the length of transportation routes within evaluation unit that are distributed in the desert, and is the total length of transport ation routes within evaluation unit . Therefore, the specific meaning of this index is as follows: the more transportation routes distributed in the desert within an evaluation unit, the greater the impact of the desert, and consequently, the weaker the transportation security capability.
Evaluate TSD
Based on the above indicators, standardize the results according to the indicator attributes in Table 5. By integrating the calculations of various indicators, obtain the TSD Index.
Table 5.
The TSD evaluation system based on the three capacity dimensions in Southern Xinjiang.
represents the land TSD index for county , where, and represent TSC, TAC, and TGC, respectively. To ensure the comparability of TSD across different years, similar indicators for different years are also standardized together. represents the weights for the three transportation capacities, and they are all set to 1. The resulting TSD values range from 0 to 6.
2.3.2. Spatial Autocorrelation Analysis
Spatial autocorrelation analysis refers to the potential mutual dependence between the attribute data of objects distributed in different spatial locations. Spatial autocorrelation analysis is a fundamental method for describing spatial distribution, identifying spatial outliers, and uncovering hidden spatial relationships. It encompasses both global spatial autocorrelation (Global Moran’s ) and local spatial autocorrelation (Local Moran’s ) analysis methods [29].
Global spatial autocorrelation primarily describes the overall degree of association among all spatial units within the study area.
Local spatial autocorrelation can reflect specific spatial locations of clustering or anomalies.
In the formula, and represent the TSD of research units and , where ≠ ; represents the spatial location weight matrix; represents the mean of TSD; is the variance of TSD; refers to the number of spatial units, which is 4 at the regional level and 46 at the county level. Moran’s value ranges from −1 to 1. If the value is greater than 0 and statistically significant, it indicates positive spatial autocorrelation, meaning that TSD in southern Xinjiang exhibits a significant clustering pattern in space.
2.3.3. Analysis of the Economic and Social Effects of TSD
Traffic not only directly impacts economic growth and social progress but also generates indirect economic and social effects through activities such as driving-related investments, guiding regional trade, and promoting industrial structure optimization [30]. Spatial econometric models are an important method for estimating both direct and indirect economic and social effects. If spatial autocorrelation analysis indicates significant spatial dependence in TSD in southern Xinjiang, it is necessary to use spatial econometric models to estimate the direct and indirect economic and social effects of TSD. Because the spatial Durbin model (SDM) allows for examining the impact of explanatory variables in both the local area and adjacent areas on the dependent variable in the local area simultaneously, it aligns well with the research approach of this study. Therefore, this study constructs a spatial Durbin model [30]:
In this context, represents the dependent variables, including four economic indicators: GDP, value added in the primary sector (PGDP), value added in the secondary sector (SGDP), and value added in the tertiary sector (TGDP) and four social indicators: urban population (UP), general public budget revenue of local finance (BRLF), year-end savings deposits of urban and rural residents (SAV), and total retail sales of consumer goods (TSCG). represents the explanatory variables, which encompass six indicators measuring TSC, TAC, TGC, and TSD. represents the spatial weight matrix, reflecting the spatial relationships among urban entities. is the constant term, while , , , and represent regression coefficients, and denotes the error term. The spatial Durbin model in this section is primarily implemented through programming in Stata software.
2.3.4. The Coupled Coordination Model
Coupling is a physical concept that refers to the state in which two (or more than two) systems influence each other under multiple effects of the internal system and other external systems [31]. This paper studied the coupling coordination relationship between the TSD and the economic or social level of Southern Xinjiang and obtained the coupling degree model of the interaction of the two systems according to the coupling conceptual model, which can be calculated as follows:
where represents the degree of coupling; is TSD; is the economic level (using per capita GDP indicators) or social development level (using urbanization level indicators), and is the model adjustment coefficient, which is greater than or equal to 2, typically, = 2.
The coordination model is expressed as follows:
where is the degree of coupling coordination and T reflects the overall effect and level of the effect or level of TSD and economic or social level. and are the weight of the system to be determined, representing the contributions of TSD and economic or social level of the Southern Xinjiang to the combined system, respectively. = 0.5 is taken based on the consideration that TSD and economic or social are equally important in Southern Xinjiang.
Based on the classification standard of coordination type in physics, coupling types of TSD and economic or social in Southern Xinjiang were divided into 3 types and 8 subtypes. In addition, severely uncoordinated development and medium uncoordinated development are doubled in the range according to the distribution of the coordination index value D, as shown in Table 5. When the per capita GDP or urbanization index is greater than the TSD index, and their difference exceeds the threshold, it indicates that the development of TSD is lagging behind; and when the TSD index is greater than the per capita GDP or urbanization index, and their difference exceeds the threshold, it indicates that the per capita GDP or urbanization development is lagging behind (as shown in Table 6).
Table 6.
TSD and economic or social coupling coordination level classification in Southern Xinjiang.
3. Results
3.1. The Levels of TSD at Different Scales Gradually Increase, and the Spatiotemporal Patterns Show Significant Variation
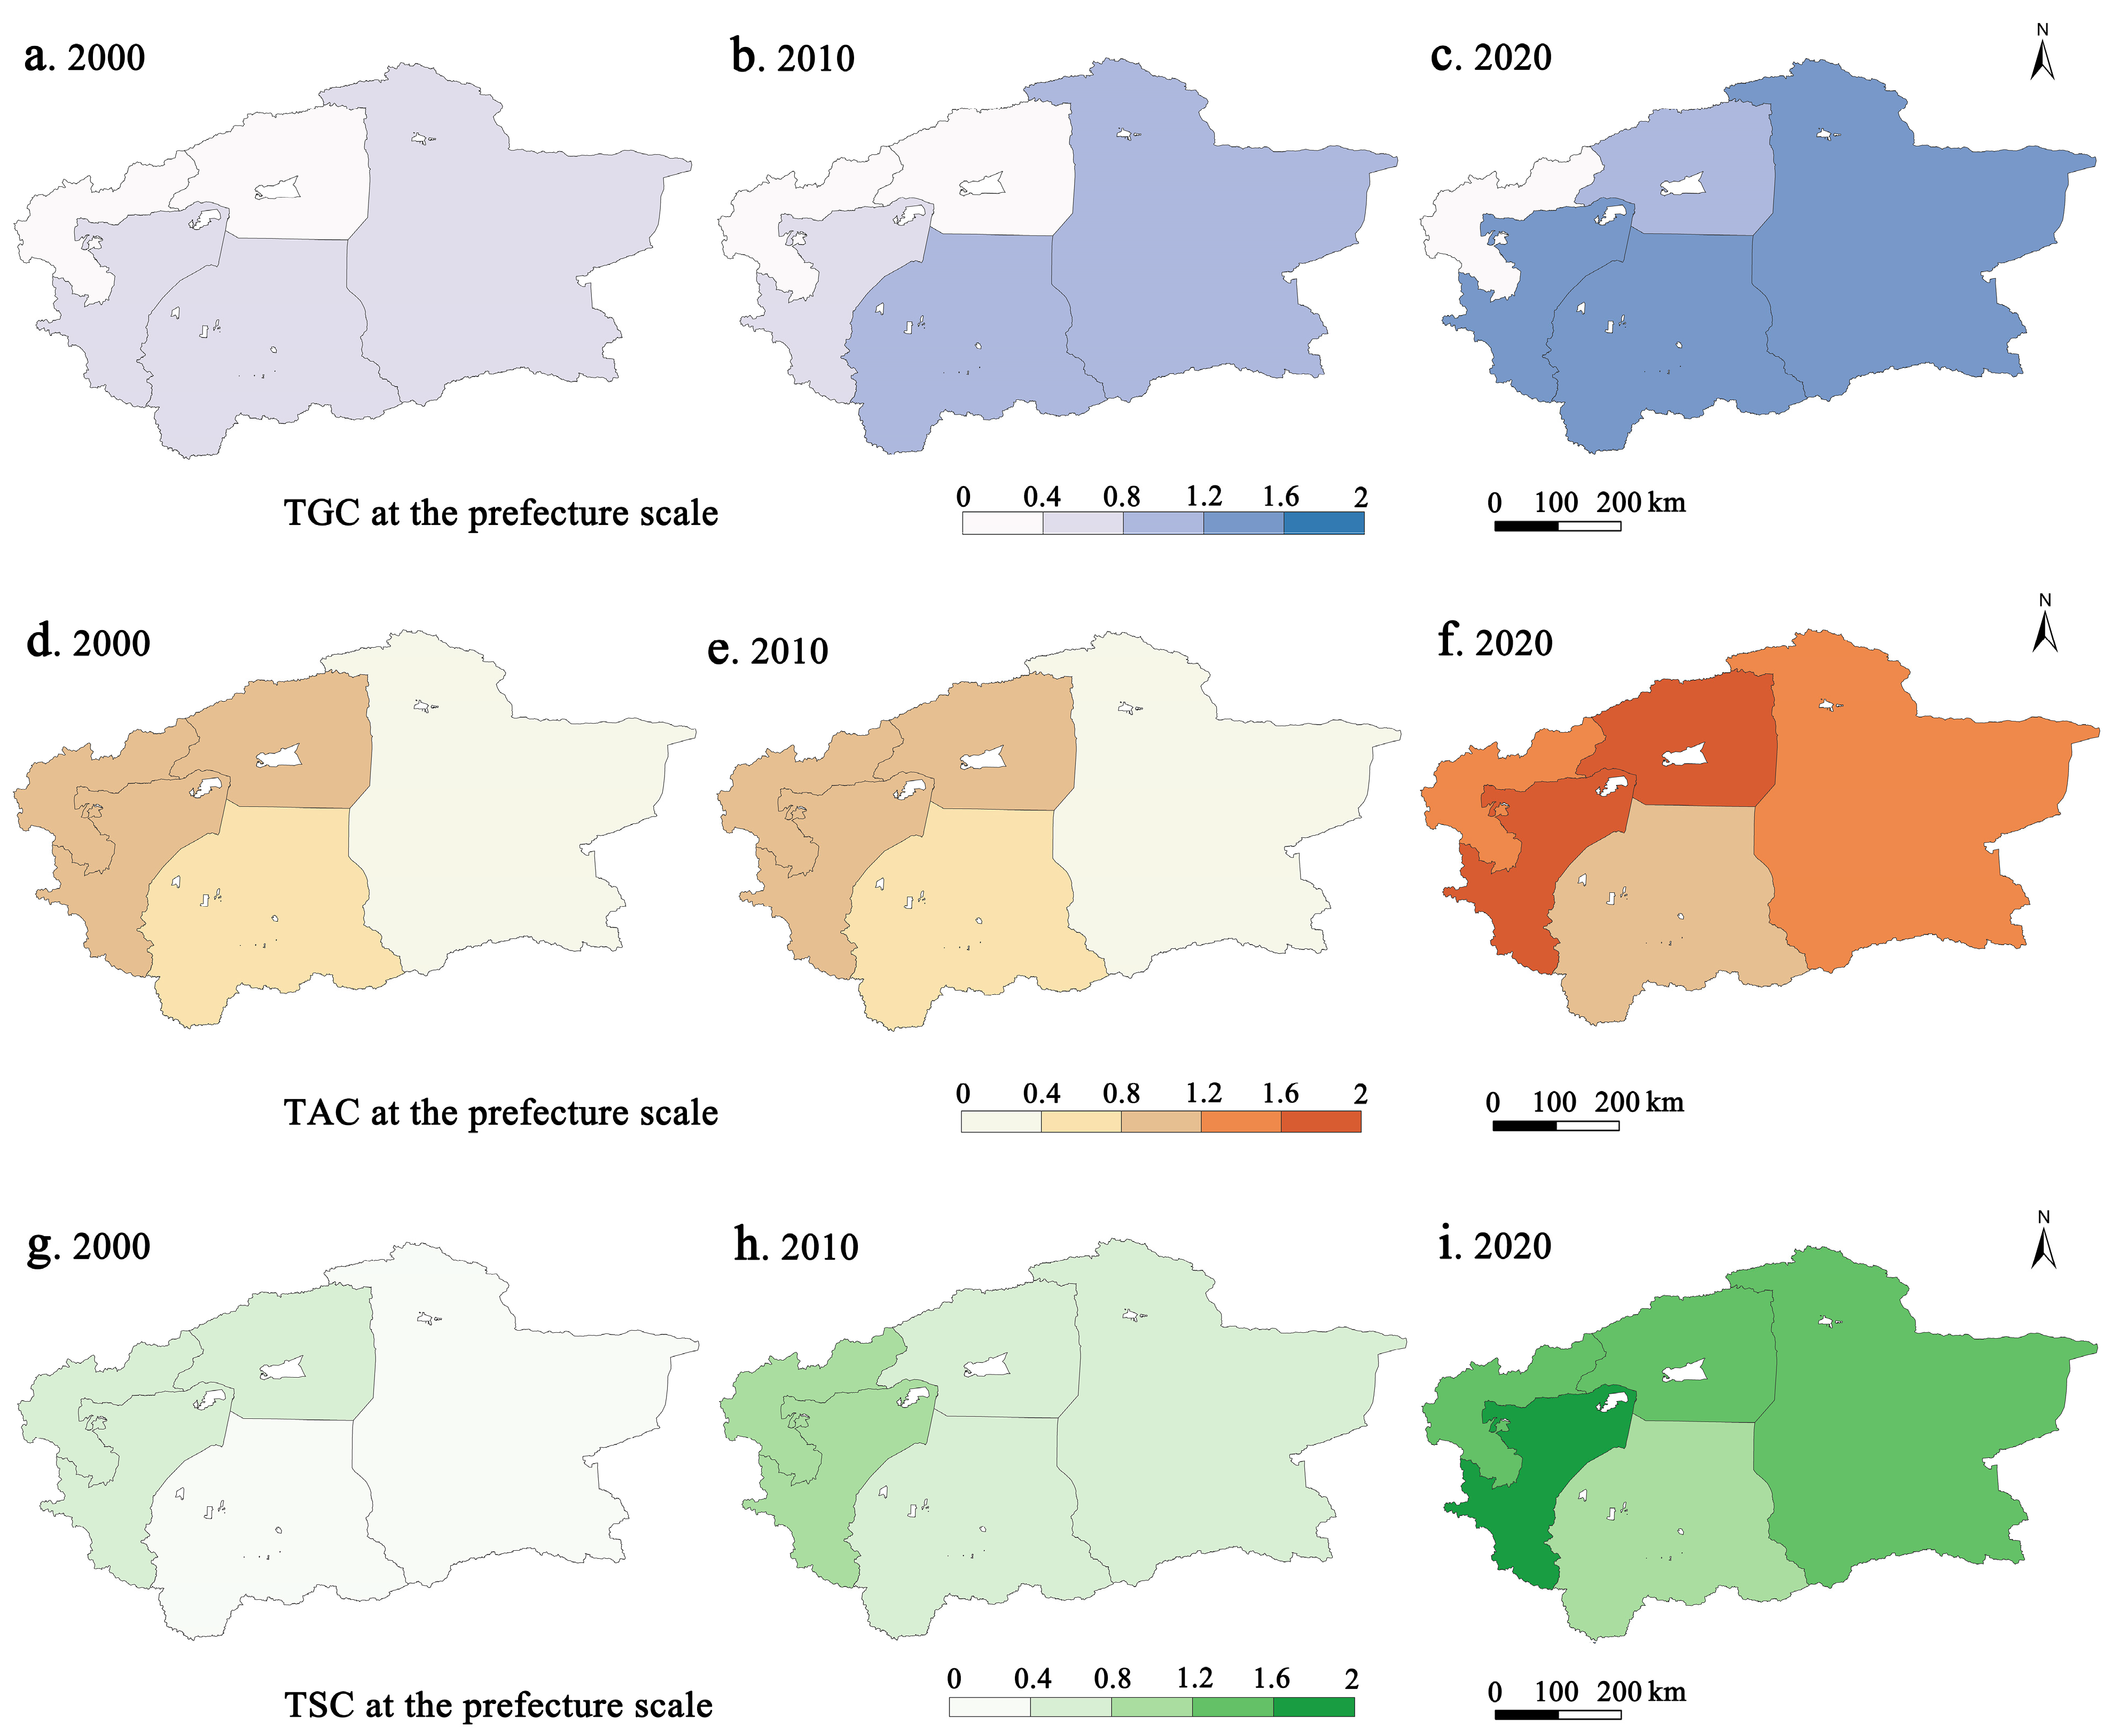
At the prefectural level, TGC, TAC, and TSC have all shown gradual improvements from 2000 to 2020, but with significant spatial differentiation (Figure 3). TGC exhibited an east–high and west–low spatial distribution pattern, with the Kizilsu Kirghiz Autonomous Prefecture consistently having a lower TGC, while Bayingolin Mongol Autonomous Prefecture and Hotan Prefecture showed significant improvements. TAC experienced relatively minor changes from 2000 to 2010, following a west–high and east–low distribution pattern. However, by 2020, TAC had generally improved, especially in Bayingolin Mongol Autonomous Prefecture. TSC notably increased over the years, with most prefectures having values above 1.200 by 2020, indicating significant development in transportation construction at the prefectural level, particularly from 2010 to 2020. Spatial autocorrelation analysis revealed that TSD did not exhibit significant spatial autocorrelation at the prefectural level in Southern Xinjiang in 2000, 2010, and 2020. Regarding spatial patterns, from 2000 to 2020, there were significant spatial differentiation characteristics of TSD (Figure 4). In 2000, TSD gradually decreased from west to east, with Kashgar Prefecture having the highest TSD. By 2020, most prefectures had TSD levels above 3, except for Kizilsu Kirghiz Autonomous Prefecture, with Bayingolin Mongol Autonomous Prefecture experiencing a significant increase in TSD. In 2020, only Kashgar Prefecture, Aksu Prefecture, and Bayingolin Mongol Autonomous Prefecture had TSD levels above 3.600, implying that the basic transportation welfare levels in Hotan Prefecture and Kizilsu Kirghiz Autonomous Prefecture have not yet been fully guaranteed. These findings illustrate the changing dynamics of transportation development in Southern Xinjiang, with improvements in different aspects of TSD across the prefectural level. The spatial variations in TSD also highlight areas that may require further infrastructure development.
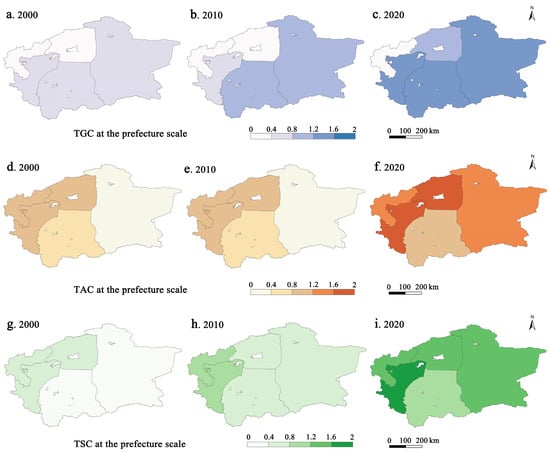
Figure 3.
Spatial-temporal changes in TGC, TAC, and TSC at the prefectural level.
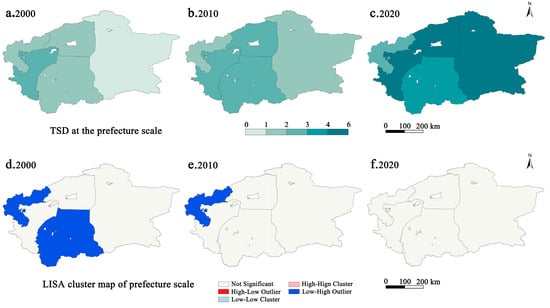
Figure 4.
Spatial-temporal patterns of TSD at the prefecture level and LISA clustering.
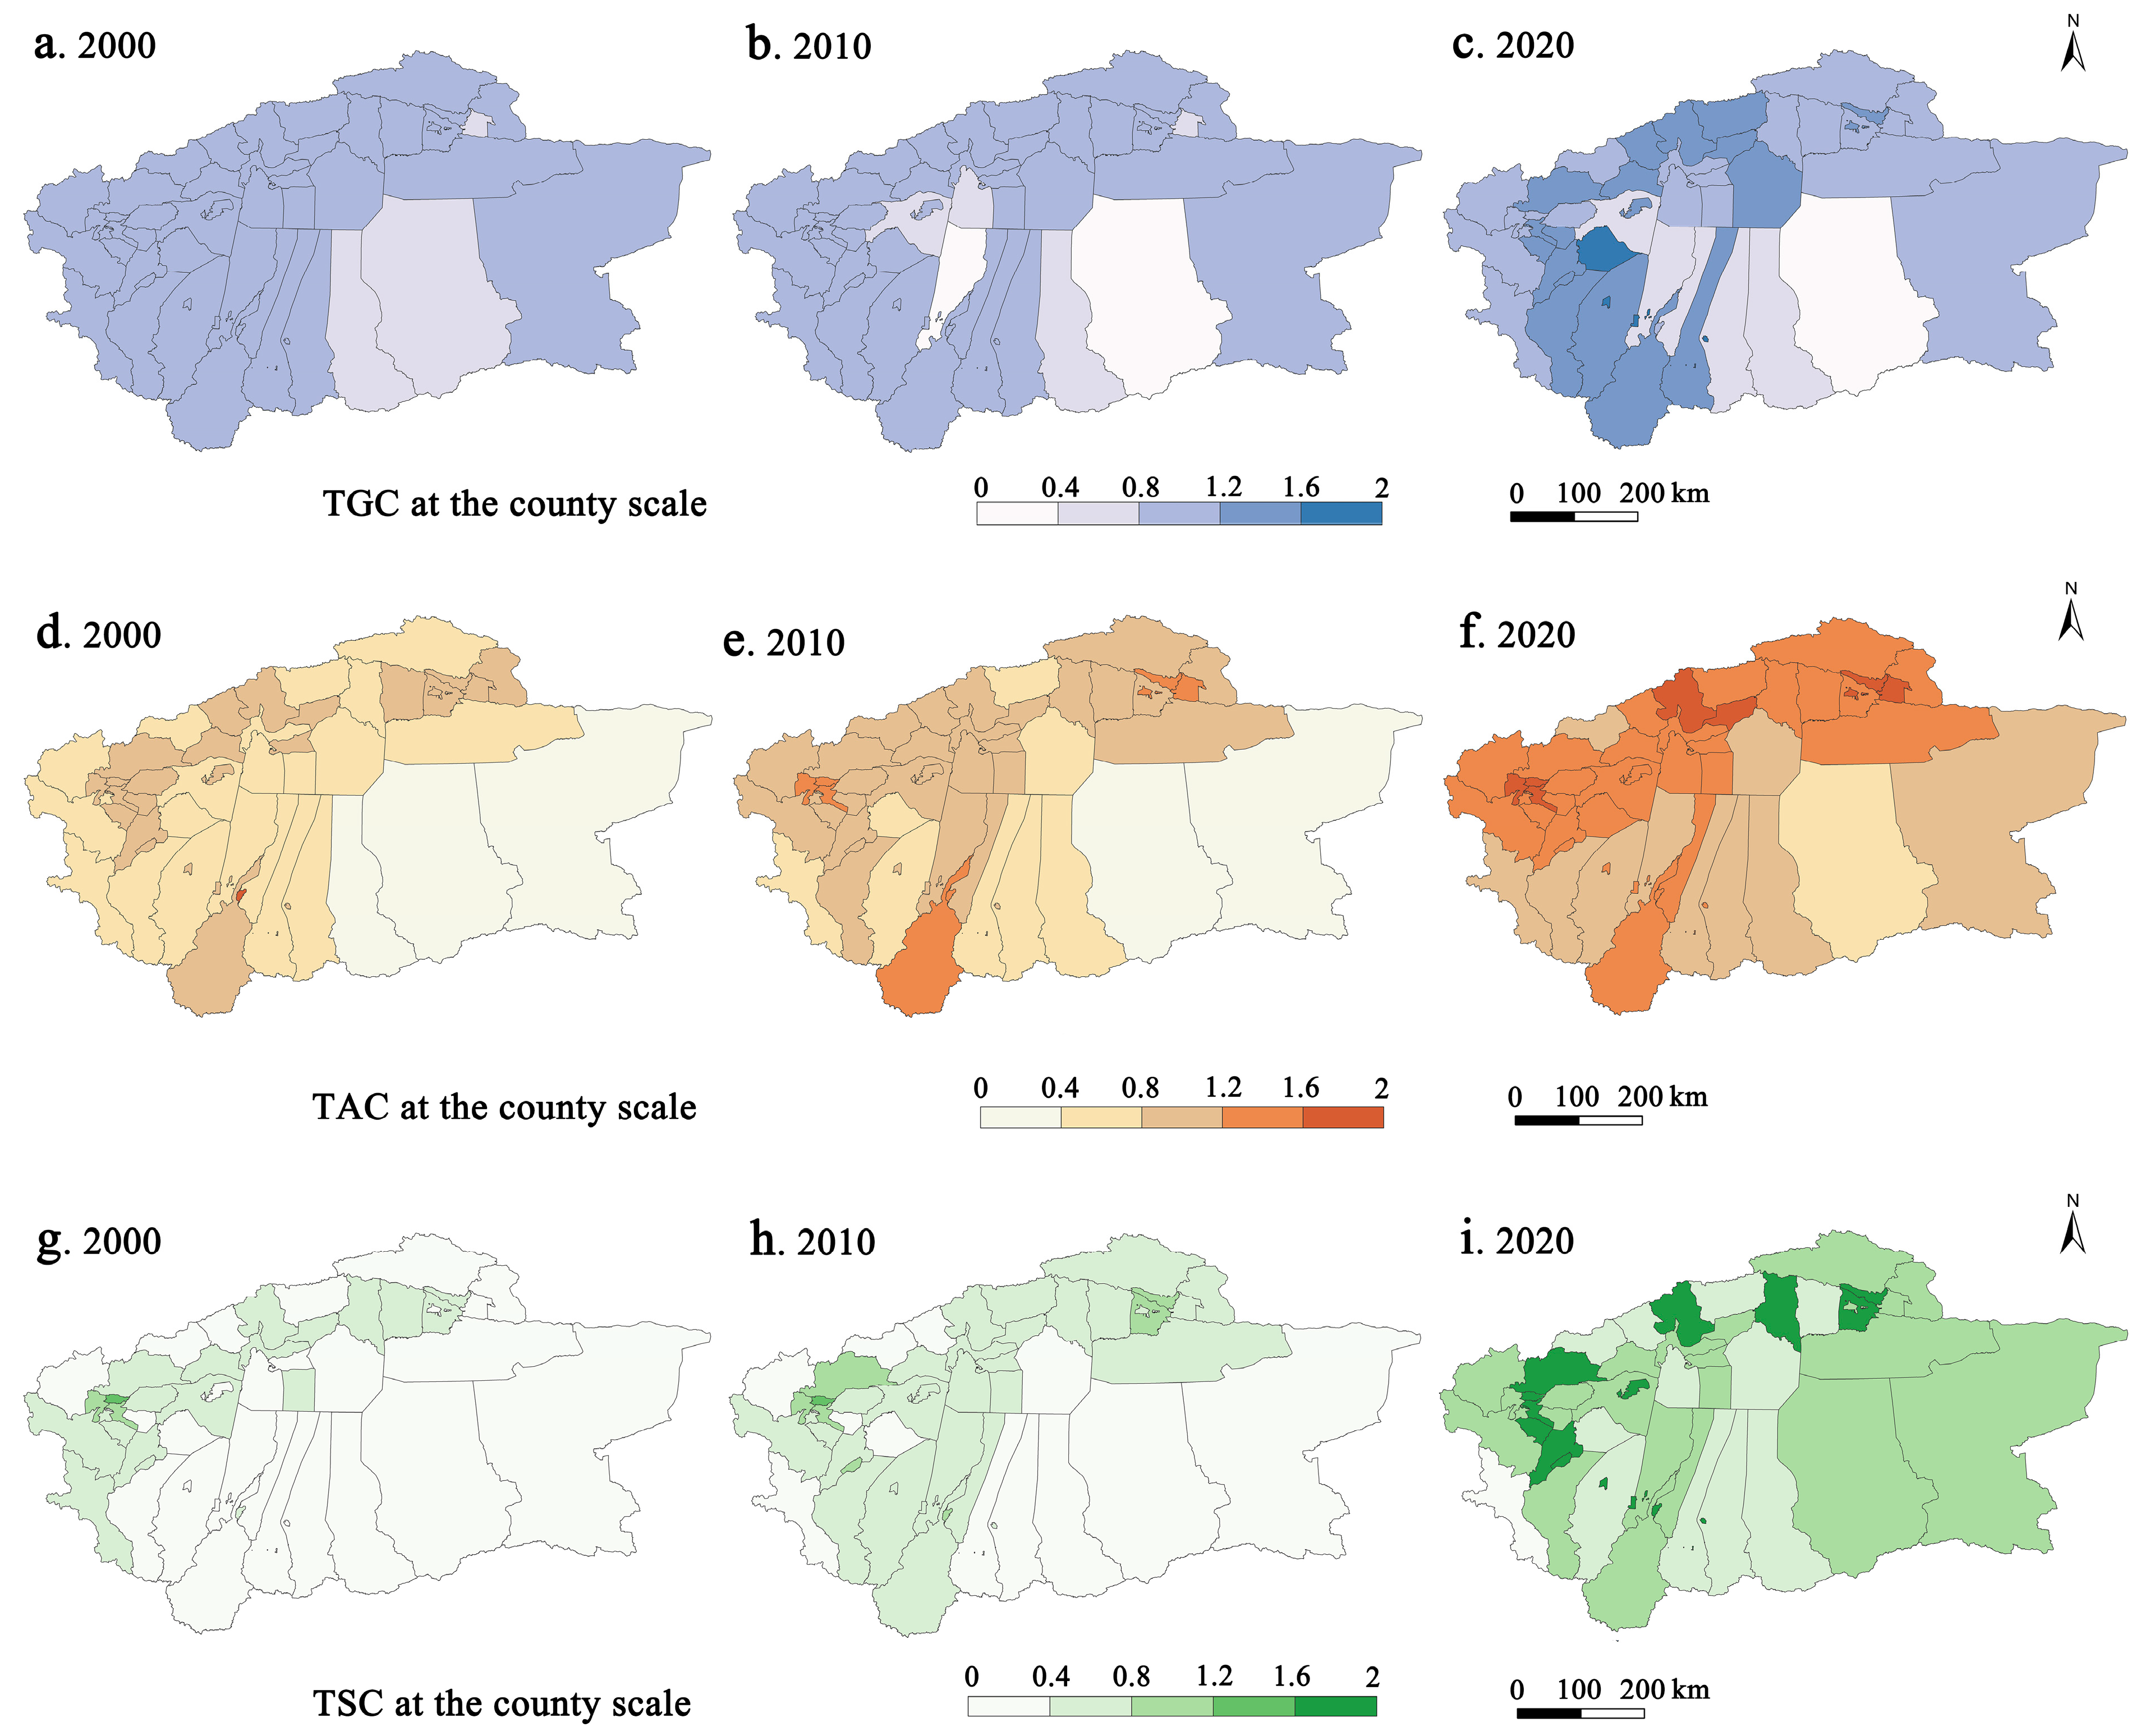
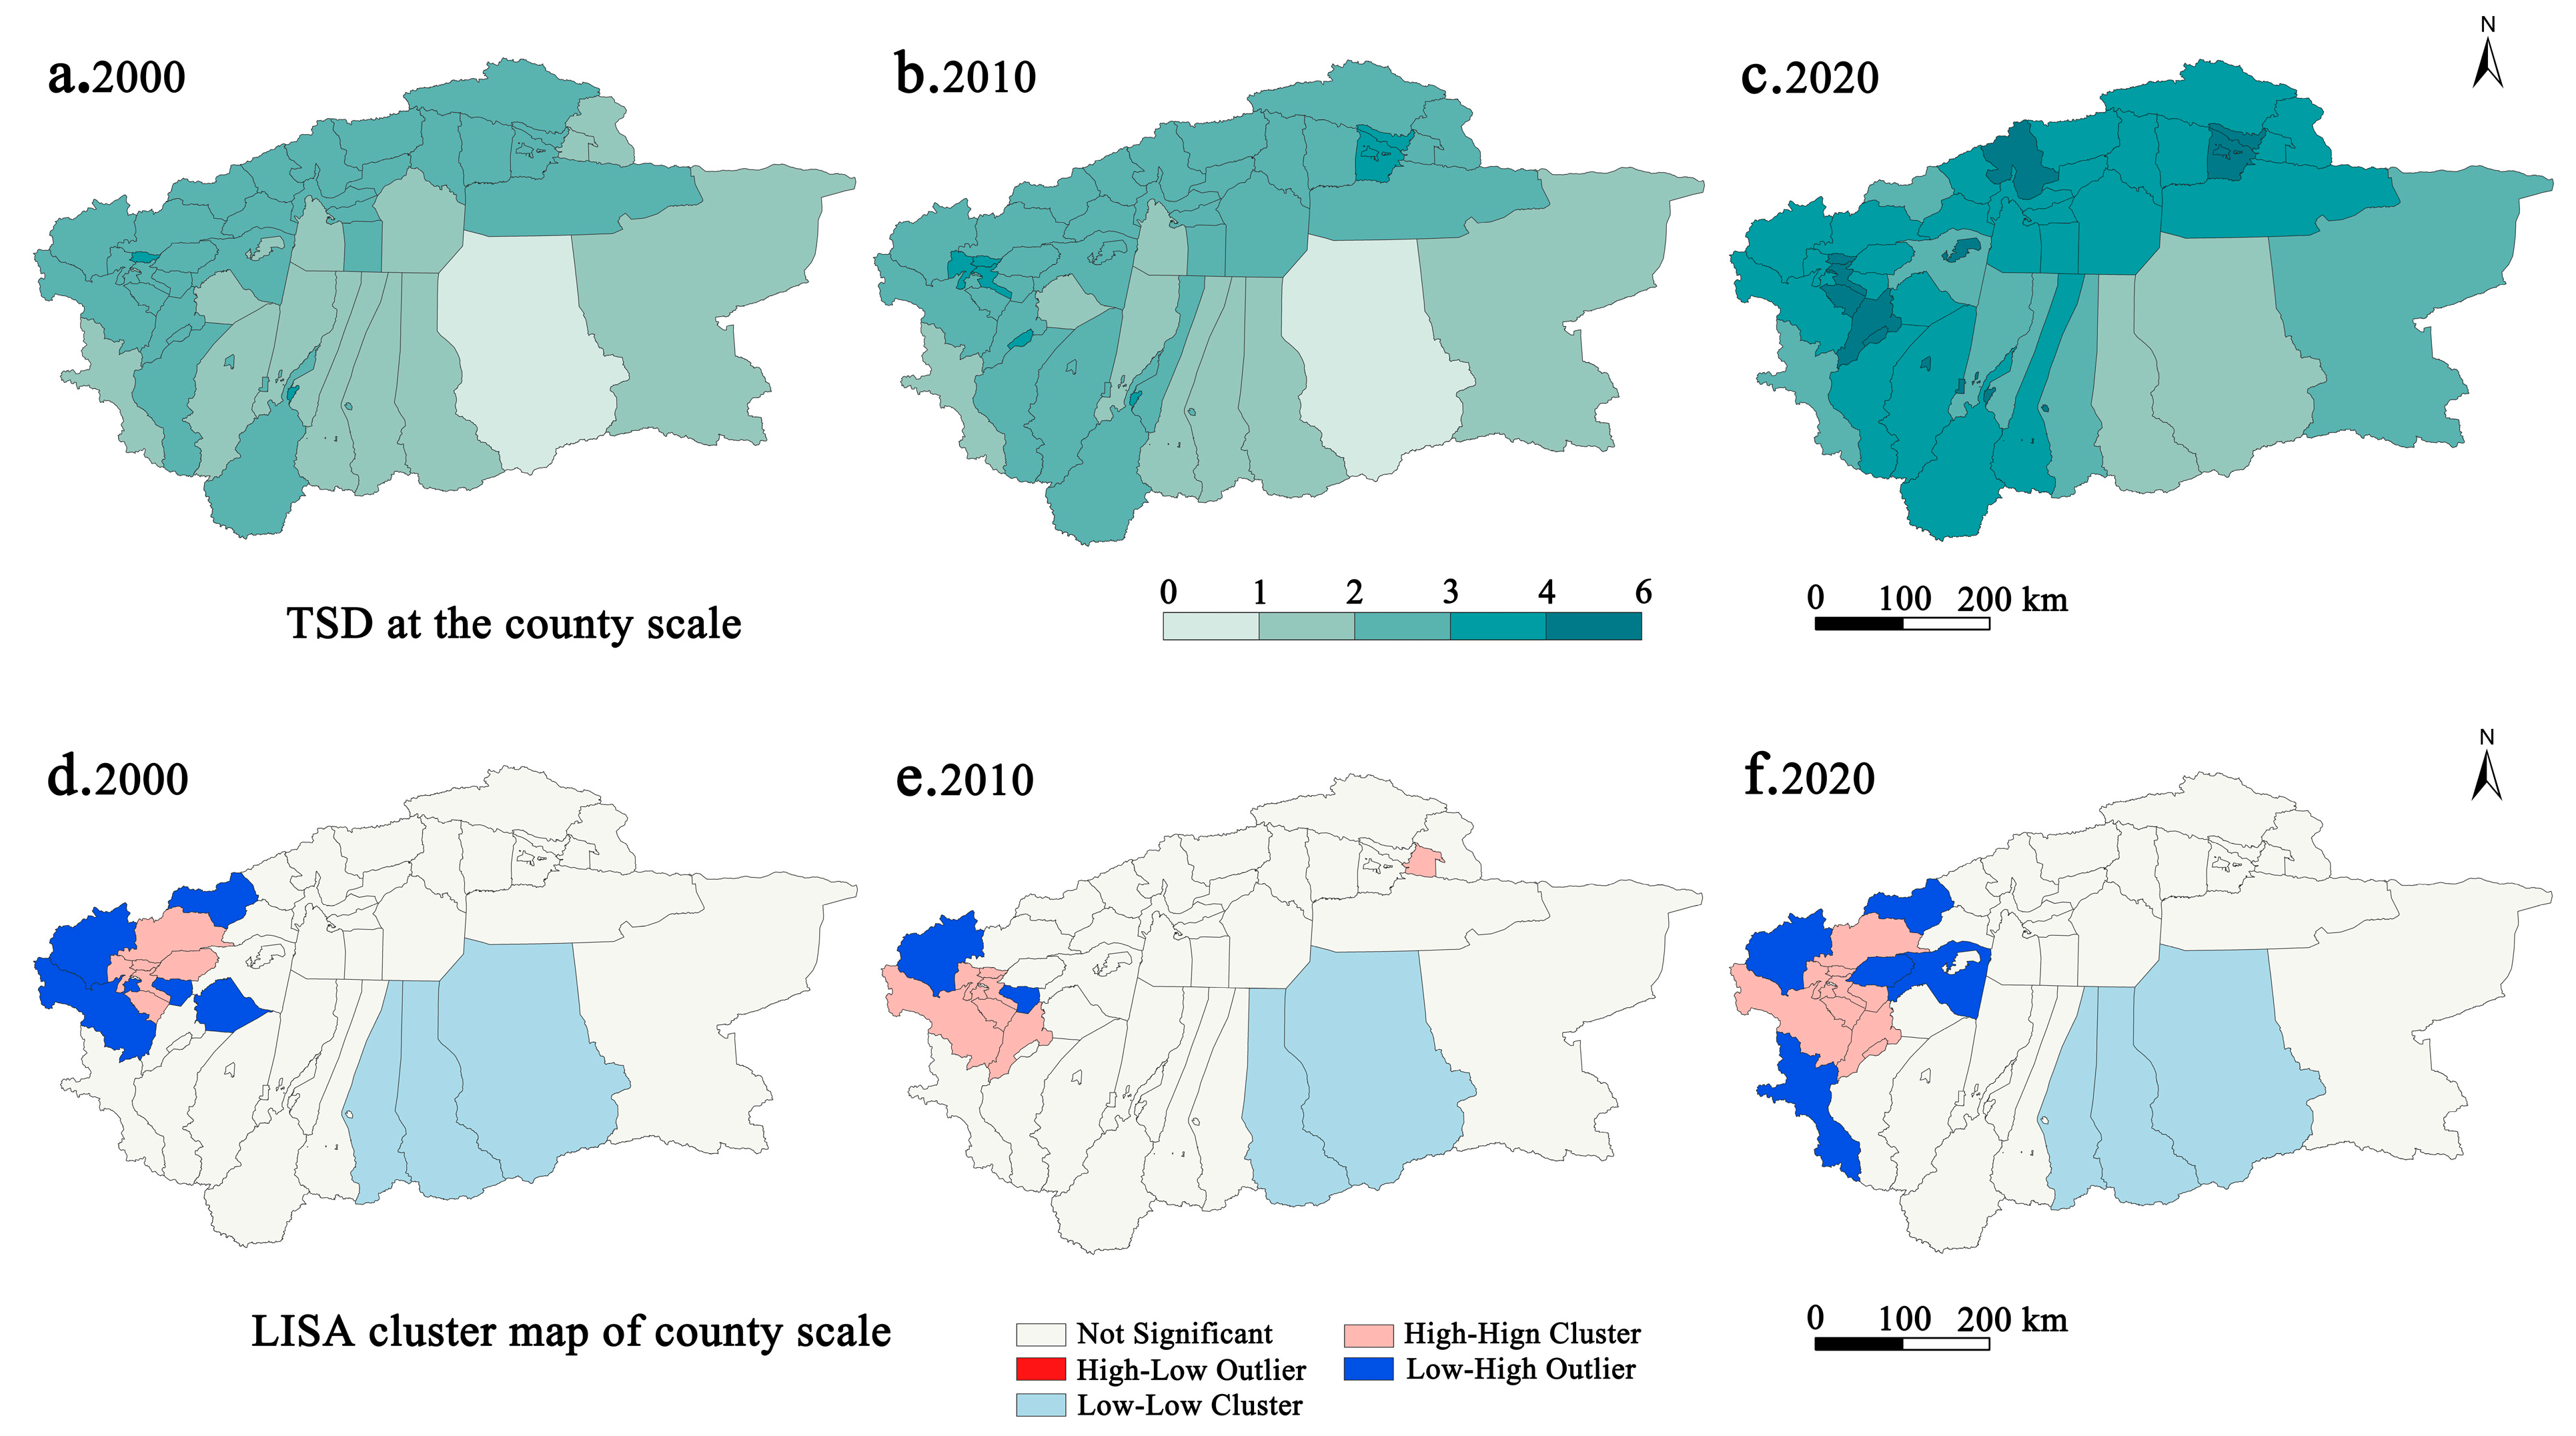
At the county level, there have been significant spatial variations in TGC, TAC, and TSC in Southern Xinjiang from 2000 to 2020 (Figure 5). The average TGC at the county level increased from 0.939 to 1.130, with some counties experiencing declines and central cities like Hotan City, Kashgar City, Tumxuk City, and Tie Menguan City showing gradual improvements in transportation security. TAC generally exhibited a pattern of higher values in the northwest and lower values in the southeast, with higher levels of accessibility in cities like Kashgar, Aksu, and Tie Menguan. County-level TSC showed a steady increase, rising from 0.425 in 2000 to 1.021 in 2020, with Kashgar City consistently having a high TSC. Overall, from 2000 to 2020, the TSD level in different counties and cities of Southern Xinjiang showed an upward trend, but the spatial distribution was uneven, forming a “core-periphery” spatial pattern centered around the Southern Xinjiang Railway axis. High-concentration areas were observed around Kashgar City, while low-concentration areas were around Qiemo County (Figure 6d–f). In 2000, no county units had high TSD levels (TSD ≥ 4), but by 2020, 12 such units existed, mainly concentrated in the Kashgar Oasis and Aksu Oasis regions, indicating a regional advantage due to abundant water resources and larger oasis areas. Counties in the southeastern part of Southern Xinjiang, such as Qiemo and Yutian, with limited water resources and smaller oasis areas, showed relatively lower TSD levels, demonstrating a spatial coupling between the TSD level and the natural environment. If a TSD level of 3.600 is considered the qualifying threshold, it is estimated that from 2000 to 2020, approximately 7.359 million people in the county-level units of Southern Xinjiang lived in areas where the TSD level was below 3.600. This suggests that the basic transportation welfare level for about 7.359 million people was guaranteed in the county-level units of Southern Xinjiang during this period. These findings provide valuable insights into the spatial dynamics of TSD at the county level in Southern Xinjiang and the associated implications for transportation development and regional welfare.
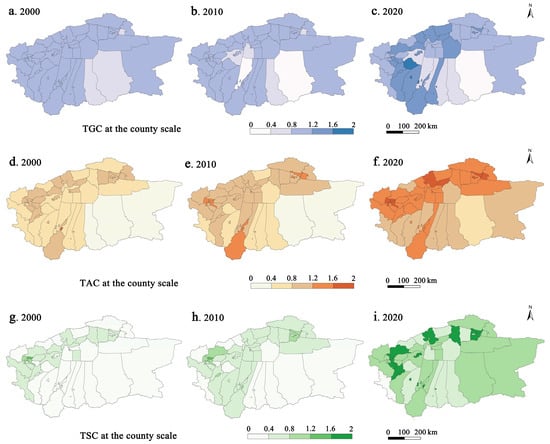
Figure 5.
Spatial-temporal changes in TGC, TAC, and TSC at the county level.
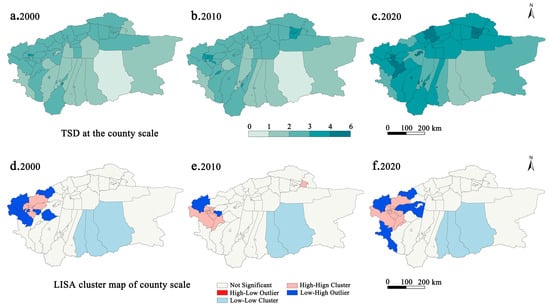
Figure 6.
Spatial-temporal patterns of TSD at the county level and LISA clustering.
3.2. County-Level TSD Has Significantly Impacted Economic and Social Development
The precondition for using the spatial Durbin model is the presence of significant spatial autocorrelation in the explanatory variables. Through a global spatial autocorrelation analysis of the economic and social explanatory variables at the prefectural level, it was found that the indicators representing economic development and social progress from 2000 to 2020 did not exhibit significant spatial autocorrelation. Therefore, the impact of prefectural-scale TSD on the economy and society in Southern Xinjiang is not statistically significant. Through a global spatial autocorrelation analysis at the county level, it was found that there is significant spatial autocorrelation in the eight indicators representing county-level economic development and social progress. Hence, it is possible to further analyze the impact of transportation development on the regional economy and society using the spatial Durbin model.
Based on Equation (8), we estimated the effects of road density, transport trunk line influence degree, interior accessibility, exterior accessibility, transportation route connectivity, and desert disturbance on county-level GDP, PGDP, SGDP, TGDP, UPBRLF, SAV, and TSCG in Southern Xinjiang (Table 7). Overall, the model had a good fit for GDP, PGDP, SGDP, TGDP, UP, BRLF, SAV, and TSCG, with similar goodness of fit across different partitions. Due to space constraints, Table 7 only displays the standardized regression coefficients. Road density, transport trunk line influence degree, interior accessibility, and transportation route connectivity primarily had positive effects on the economy and society, significantly promoting SGDP, PGDP, SGDP, and PGDP, respectively. This indicates that increasing road density, constructing high-grade roads and airports, and improving internal accessibility and connectivity contribute to the economic and social development of Southern Xinjiang at the county level, with a particularly significant impact on economic development. Exterior accessibility and desert disturbance had primarily negative effects on the economy and society at the county level. Counties farther from other central cities in the region had lower opportunities for receiving radiation from central cities and experienced reduced economic and social development. Desert disturbance reduced road accessibility, leading to more significant hindrances to county-level economic and social development. These findings highlight the complex interplay between transportation development, geographical factors (such as desert interference), and economic and social outcomes at the county level in Southern Xinjiang. It underscores the importance of considering these factors in regional planning and policymaking.
Table 7.
Estimation of sub-dimensional economic effects of transportation dominance.
Table 8 presents the direct and indirect effects of TSC, TAC, TGC, and TSD on economic development and social progress at the county level in Southern Xinjiang, as reported by the spatial Durbin model. TSC, TAC, TGC, and TSD all have significant positive direct effects on economic growth and social development at the county level in Southern Xinjiang. However, it is noteworthy that the direct contribution of TSD to county-level SGDP, UP, TSCG, PGDP, TGDP, SAV, GDP, and BRLF successively decreases. Additionally, these three transportation capacities and TSD also have significant negative indirect effects on economic and social development. This indicates that in Southern Xinjiang, TSC, TAC, TGC, and TSD overall exhibit spatial competitive effects rather than spatial spillover effects. This implies that county-level economic and social development in Southern Xinjiang is in the early stage of accelerated development and centripetal concentration. While improved transportation capacity promotes local development, it also intensifies competition with neighboring counties.
Table 8.
The direct effects and indirect effects of TSC, TAC, TGC, and TSD.
3.3. The Coupling Coordination Levels between Different Scales of TSD and Economic and Social Development Have Gradually Improved
Based on Equations (11)–(13), the coupling coordination levels between TSDs at the prefectural scale in Southern Xinjiang and economic and social development for the years 2000–2020 were obtained and categorized. The classification results are presented in Table 9. Overall, the coupling coordination categories between TSDs and economic and social development in various prefectures in Southern Xinjiang have gradually shifted from incoordination to coordination from 2000 to 2020. For example, the TSD of Bayingolin Mongol Autonomous Prefecture has improved from severe imbalance (I) to advanced coordination (VIII). However, the coupling coordination levels for Kizilsu Kirghiz Autonomous Prefecture and Hotan Prefecture have increased at a slower pace, reaching only a basic coordination level by 2020.
Table 9.
The coupling and coordination types between TSD and economic and social at the prefecture scale in southern Xinjiang from 2000 to 2020.
The coupling coordination levels between TSDs at the county scale in Southern Xinjiang and economic and social development for the years 2000–2020 were calculated, and the results were categorized as shown in Table 10. From 2000 to 2020, the coupling coordination categories between county-scale TSDs and economic and social development in Southern Xinjiang have generally shifted from incoordination to coordination. Counties and cities with TSDs that were coupled with economic development coordination categories of severe imbalance (I) and moderate imbalance (II) decreased from 43 in 2000 to 0 in 2020, indicating a significant decline. Counties and cities in a coordinated development category reached 13 by 2020, accounting for 28.261%, indicating that most counties and cities in Southern Xinjiang are still in the transitional development stage concerning the coupling coordination of TSDs and economic development. Regional central cities exhibited higher coupling coordination levels, such as Korla City, Aral City, Tumxuk City, Tiemenguan City, and Kunyu City. The coupling coordination categories of these cities regarding TSDs and economic development were mostly at the intermediate coordination (VI) and good coordination (VII) levels. Regarding the coupling coordination of TSDs and social development, counties and cities with coordination categories of severe imbalance (I) and moderate imbalance (II) decreased from 9 in 2000 to 0 in 2020, indicating a declining trend. Counties and cities in a coordinated development category reached 25 by 2020, accounting for 54.348%, indicating that the overall coupling coordination level between TSDs and social development is relatively high in Southern Xinjiang’s counties and cities.
Table 10.
The coupling and coordination types between TSD and economic, social at the county scale in southern Xinjiang from 2000 to 2020.
4. Discussion
4.1. Constructing Evaluation Indicators for TSD
In most existing studies on TSD, it is a common consensus to measure TSD based on road density, the influence of transportation trunk lines, and locational advantage [10,22]. However, in different regions and at different scales, the measurement of TSD should be tailored to reflect the actual regional conditions. Classic methods for evaluating TSD often overlook the ability of the transportation system to resist risks [6]. Regions with high support or accessibility capabilities may significantly reduce their local TSD if their transportation system is extremely fragile and unable to withstand various risks. Ignoring this aspect could lead to an “overestimation” of the transportation situation in the region. Based on this consideration, this study creatively integrates regional TSD levels from three aspects: TSC, TAC, and TGC, in addition to the traditional evaluation of TSD. This approach addresses the limitations of classic TSD evaluation methods.
4.2. Evolution of TSD Patterns at Different Scales and Their Economic and Social Effects
This study reveals the pattern evolution and economic and social effects of different scales of TSD in Southern Xinjiang from 2000 to 2020. It was found that during this period, significant progress was made in transportation infrastructure development, with rapid expansion in the scale of transportation infrastructure. Additionally, regional disparities in TSD tended to decrease, which is consistent with the findings of Jiang, Sun, and others [24,32]. This outcome can be attributed to the historical inheritance of transportation infrastructure. However, prior studies did not extensively explore the economic and social effects of different-scale TSDs in Southern Xinjiang. This study not only identified that the spatial pattern of TSD in Southern Xinjiang is influenced by both natural topography and socio-economic development but also attempted to analyze the economic and social effects of TSD at the county level. The analysis showed that road density, the influence of transportation trunk lines, internal accessibility, and transportation route connectivity had predominantly positive economic and social effects at the county level in Southern Xinjiang. This suggests that increasing road density, constructing high-grade highways and airports, and improving internal accessibility and connectivity contribute significantly to economic and social development at the county level in Southern Xinjiang. These findings align with the conclusions of previous studies [24]. On the other hand, external accessibility and desert interference had mainly negative economic and social effects at the county level in Southern Xinjiang. This suggests that being farther away from other central cities in the region reduces the opportunities for receiving radiation from central cities and obtaining development opportunities. Furthermore, the accessibility of the transportation network in arid regions is affected by desert interference. As desert interference intensifies, TAC decreases, which, in turn, affects regional economic and social development. This discovery is consistent with the research by Liu [26]. TSC, TAC, TGC, and TSD had significant positive direct effects on economic growth and social development at the county level in Southern Xinjiang. However, they also had significant negative indirect effects on economic and social development, indicating that the current stage of county-level development in Southern Xinjiang involves both promoting its own economic development and social progress while intensifying economic and social competition with neighboring counties. This finding is in line with the characteristics of economic and social development in underdeveloped areas [31].
4.3. The Policy Implications for the Construction of Transportation Infrastructure in Southern Xinjiang
From the perspective of spatial pattern evolution, the main transportation disadvantages in the Southern Xinjiang prefectures are primarily located in Hotan Prefecture. In the future, there should be increased investment and development in the transportation infrastructure of Hotan Prefecture. However, it is worth noting that not all counties and cities within Hotan Prefecture may require enhanced transportation road construction. According to the analysis of county-level TSD in Southern Xinjiang, the focus in Hotan Prefecture should be on improving transportation in Minfeng County and Yutian County. Bayingolin Mongol Autonomous Prefecture has a relatively high level of TSD, but its internal county, Qiemo County, has a lower level of TSD. In the future, transportation infrastructure development in Bayingolin should be further directed towards Qiemo County. It is important to be mindful that improving regional TSD may lead to growth concentration in a few core counties at the expense of many peripheral counties. Therefore, efforts should be made to integrate transportation and local industry development organically. Additionally, the active promotion of the “one Belt and one Road” initiative should be pursued to break the current single-structured layout of transportation channels, which primarily follow the periphery of the Tarim Basin. This can involve building cross-desert highways that accelerate the integration of transportation between prefectures, cities, and urban–rural areas, strengthen connectivity between transportation axes and key corridors, and further enhance the TSC, TAC, and TGC of counties, cities, and prefectures in Southern Xinjiang, thereby promoting regional economic and social development. From 2000 to 2020, both at the prefecture and county levels in Southern Xinjiang, TSD has shown a trend of transitioning from imbalance to coordination in terms of coupling coordination with economic and social development. This finding aligns with some of the results from the research by Du [5]. In the future, attention should continue to be paid to the coordinated relationship between transportation and economic growth as well as social progress to avoid inadequate transportation development or transportation development that significantly outpaces regional economic development and social progress.
4.4. Limitations and Future Research Directions
This article has compiled transportation data for Southern Xinjiang in 2000, 2010, and 2020, and based on this, it has analyzed the pattern evolution of TSD at different scales and its economic and social effects. This has enriched the field of transportation geography research to some extent. However, there are some limitations that should be addressed in future research: ① The analysis of the economic and social effects of transportation could be further developed. Future research should focus on improving econometric methods to explore the indirect effects and time effects of transportation on economic growth and social progress more deeply. ② The discussion of transportation improvement strategies is still relatively preliminary. It would be beneficial to conduct in-depth analyses that take into account the specific circumstances of different counties and regions. Despite these limitations, the transportation dataset and analytical results established in this article provide systematic support for integrated modeling of human–environment systems. They have practical applications in understanding and simulating the evolution of human–environment systems and the integration of urban and rural areas.
5. Conclusions
In this study, our primary objective was to examine the evolution and economic and social effects of the spatial and temporal patterns of Transport Superiority Degree (TSD) in Southern Xinjiang, China, with a particular emphasis on the unique challenges faced by economically underdeveloped arid regions. To achieve this, we developed a specialized evaluation framework that overcame traditional limitations by incorporating indicators such as route connectivity and desert interference. Over the period from 2000 to 2020, we conducted an empirical investigation using comprehensive evaluation methods, spatial autocorrelation techniques, spatial Durbin models, and coupling coordination models. Our methodology allowed us to analyze Transport Support Capability (TSC), Transport Access Capacity (TAC), and Transport Guarantee Capacity (TGC) at various scales, providing a nuanced understanding of the region’s transportation dynamics.
The key findings of our study revealed the significant progress in transportation infrastructure in Southern Xinjiang, characterized by a “core-periphery” spatial pattern of TSD at the county level. Despite limited impact at the prefectural level, county-level analyses demonstrated the positive influence of TSC, TAC, TGC, and TSD on economic and social growth, albeit with competitive effects. The spatial autocorrelation analysis emphasized the pronounced impact of TSD at the county scale on economic and social development. Furthermore, our investigation into the coupling coordination of TSD with economic and social development demonstrated a transition from uncoordinated to coordinated development in Southern Xinjiang’s prefectures over the two decades, providing valuable insights into the region’s evolving dynamics.
In conclusion, our study contributes a novel framework for evaluating transportation in arid regions, offering a comprehensive analysis of the spatial and temporal patterns of TSD in Southern Xinjiang. The findings highlight the intricate relationships between transportation infrastructure, economic development, and social progress, emphasizing the importance of county-level analyses for a more nuanced understanding. The transition towards coordinated development observed over the study period underscores the changing landscape of Southern Xinjiang and provides valuable insights for policymakers and researchers dealing with similar challenges in arid regions globally.
Author Contributions
S.L.: Conceptualization, Methodology, Investigation, Software, Writing—original draft, Writing—review and editing. H.W.: Data curation. X.L.: Visualization. Z.Y.: Writing—review and editing, Supervision. All authors have read and agreed to the published version of the manuscript.
Funding
This research was funded by the National Natural Science Foundation of China (Grant Numbers 41861037).
Institutional Review Board Statement
Not applicable.
Informed Consent Statement
Not applicable.
Data Availability Statement
The raw data supporting the conclusions of this article will be made available by the authors on request.
Acknowledgments
We thank the anonymous experts for their valuable suggestions, which helped to substantially improve the manuscript.
Conflicts of Interest
The authors declare that they have no known competing financial interests or personal relationships that could have appeared to influence the work reported in this paper.
References
- Vickerman, R.W. The Regional Impacts of Trans-European Networks. Ann. Reg. Sci. 1995, 29, 237–254. [Google Scholar] [CrossRef]
- Bowen, J. Airline Hubs in Southeast Asia: National Economic Development and Nodal Accessibility. J. Transp. Geogr. 2000, 8, 25–41. [Google Scholar] [CrossRef]
- Gutiérrez, J. Location, Economic Potential and Daily Accessibility: An Analysis of the Accessibility Impact of the High-Speed Line Madrid–Barcelona–French Border. J. Transp. Geogr. 2001, 9, 229–242. [Google Scholar] [CrossRef]
- Jin, F.J.; Wang, C.J.; Li, X.W. Discrimination Method and Its Application Analysis of Regional Transport Superiority. Acta Geogr. Sin. 2008, 63, 787–798. [Google Scholar]
- Du, Q.; Wang, X.; Li, Y.; Zou, P.X.W.; Han, X.; Meng, M. An Analysis of Coupling Coordination Relationship between Regional Economy and Transportation: Empirical Evidence from China. Environ. Sci. Pollut. Res. 2022, 29, 34360–34378. [Google Scholar] [CrossRef]
- Li, J.; Li, T.; Zhu, B.; Wang, Y.; Chen, X.; Liu, R. The Spatial Pattern and Influencing Factors of Traffic Dominance in Xi’an Metropolitan Area. Land 2023, 12, 1146. [Google Scholar] [CrossRef]
- Aderamo, A.J.; Magaji, S.A. Rural Transportation and the Distribution of Public Facilities in Nigeria: A Case of Edu Local Government Area of Kwara State. J. Hum. Ecol. 2010, 29, 171–179. [Google Scholar] [CrossRef]
- Huang, Y.; Zong, H. Spatiotemporal Evolution of Land Transportation Networks and Accessibility in Inland Mountainous Areas 1917–2017: A Case Study of Southwest China. J. Mt. Sci. 2020, 17, 2262–2279. [Google Scholar] [CrossRef]
- Wang, D.; Wang, K.; Wang, Z.; Fan, H.; Chai, H.; Wang, H.; Long, H.; Gao, J.; Xu, J. Spatial-Temporal Evolution and Influencing Mechanism of Traffic Dominance in Qinghai-Tibet Plateau. Sustainability 2022, 14, 11031. [Google Scholar] [CrossRef]
- Tian, T.; Ma, Y. Interactive Effect and Spatial Characteristics of Agricultural Development Level and Transport Superiority Degree in Main Grain-Producing Areas of the Central Jilin Province, China. Chin. Geogr. Sci. 2022, 32, 643–664. [Google Scholar] [CrossRef]
- Pulugurtha, S.S.; Mathew, S. Modeling AADT on Local Functionally Classified Roads Using Land Use, Road Density, and Nearest Nonlocal Road Data. J. Transp. Geogr. 2021, 93, 103071. [Google Scholar] [CrossRef]
- Aljoufie, M. The Impact Assessment of Increasing Population Density on Jeddah Road Transportation Using Spatial-Temporal Analysis. Sustainability 2021, 13, 1455. [Google Scholar] [CrossRef]
- Jiao, J.; Wang, J.; Zhang, F.; Jin, F.; Liu, W. Roles of Accessibility, Connectivity and Spatial Interdependence in Realizing the Economic Impact of High-Speed Rail: Evidence from China. Transp. Policy 2020, 91, 1–15. [Google Scholar] [CrossRef]
- Donert, K.; de Miguel Gonzalez, R. Innovative Learning Geography in Europe: New Challenges for the 21st Century; Cambridge Scholars Publishing: Cambridge, UK, 2014. [Google Scholar]
- Heppenstall, A.; Crooks, A.; Malleson, N.; Manley, E.; Ge, J.; Batty, M. Future Developments in Geographical Agent-Based Models: Challenges and Opportunities. Geogr. Anal. 2021, 53, 76–91. [Google Scholar] [CrossRef]
- Kasmalkar, I.G.; Serafin, K.A.; Miao, Y.; Bick, I.A.; Ortolano, L.; Ouyang, D.; Suckale, J. When Floods Hit the Road: Resilience to Flood-Related Traffic Disruption in the San Francisco Bay Area and Beyond. Sci. Adv. 2020, 6, eaba2423. [Google Scholar] [CrossRef] [PubMed]
- Nogal, M.; O’Connor, A.; Caulfield, B.; Martinez-Pastor, B. Resilience of Traffic Networks: From Perturbation to Recovery via a Dynamic Restricted Equilibrium Model. Reliab. Eng. Syst. Saf. 2016, 156, 84–96. [Google Scholar] [CrossRef]
- Banister, D.; Berechman, Y. Transport Investment and the Promotion of Economic Growth. J. Transp. Geogr. 2001, 9, 209–218. [Google Scholar] [CrossRef]
- Du, Y.; Wang, Y.; Li, W. Emergy Ecological Footprint Method Considering Uncertainty and Its Application in Evaluating Marine Ranching Resources and Environmental Carrying Capacity. J. Clean. Prod. 2022, 336, 130363. [Google Scholar] [CrossRef]
- Hu, Y.; Chen, Y. Coupling of Urban Economic Development and Transportation System: An Urban Agglomeration Case. Sustainability 2022, 14, 3808. [Google Scholar] [CrossRef]
- Wang, W.; Gong, J.; Yang, W.; Zeng, J. The Ecology-Economy-Transport Nexus: Evidence from Fujian Province, China. Agriculture 2022, 12, 135. [Google Scholar] [CrossRef]
- Cui, X.; Fang, C.; Wang, Z.; Bao, C. Spatial Relationship of High-Speed Transportation Construction and Land-Use Efficiency and Its Mechanism: Case Study of Shandong Peninsula Urban Agglomeration. J. Geogr. Sci. 2019, 29, 549–562. [Google Scholar] [CrossRef]
- Hong, J.; Chu, Z.; Wang, Q. Transport Infrastructure and Regional Economic Growth: Evidence from China. Transportation 2011, 38, 737–752. [Google Scholar] [CrossRef]
- Sun, J.; Li, Z.; Lei, J.; Teng, D.; Li, S. Study on the Relationship between Land Transport and Economic Growth in Xinjiang. Sustainability 2018, 10, 135. [Google Scholar] [CrossRef]
- Zhang, N.; Zhao, X.; Liu, T.; Lei, M.; Wang, C.; Wang, Y. Layout Planning of Highway Transportation Environment Monitoring Network: The Case of Xinjiang, China. Sustainability 2020, 12, 290. [Google Scholar] [CrossRef]
- Liu, T.; Wang, L.; Gao, H.; Xia, Y.; Guo, Z.; Li, W.; Liu, H. Research Progress on Train Operation Safety in Xinjiang Railway under Wind Environment. Transp. Saf. Environ. 2022, 4, tdac005. [Google Scholar] [CrossRef]
- Yu, N.; De Jong, M.; Storm, S.; Mi, J. The Growth Impact of Transport Infrastructure Investment: A Regional Analysis for China (1978–2008). Policy Soc. 2012, 31, 25–38. [Google Scholar] [CrossRef]
- Van Wee, B. Accessible Accessibility Research Challenges. J. Transp. Geogr. 2016, 51, 9–16. [Google Scholar] [CrossRef]
- Anselin, L. Local Indicators of Spatial Association-LISA. Geogr. Anal. 2010, 27, 93–115. [Google Scholar] [CrossRef]
- Wei, F.; Koc, E.; Li, N.; Soibelman, L.; Wei, D. A Data-Driven Framework to Evaluate the Indirect Economic Impacts of Transportation Infrastructure Disruptions. Int. J. Disaster Risk Reduct. 2022, 75, 102946. [Google Scholar] [CrossRef]
- Li, J.; Lei, J.; Li, S.; Yang, Z.; Tong, Y.; Zhang, S.; Duan, Z. Spatiotemporal Analysis of the Relationship between Urbanization and the Eco-Environment in the Kashgar Metropolitan Area, China. Ecol. Indic. 2022, 135, 108524. [Google Scholar] [CrossRef]
- Jiang, X.; He, X.; Zhang, L.; Qin, H.; Shao, F. Multimodal Transportation Infrastructure Investment and Regional Economic Development: A Structural Equation Modeling Empirical Analysis in China from 1986 to 2011. Transp. Policy 2017, 54, 43–52. [Google Scholar] [CrossRef]

Disclaimer/Publisher’s Note: The statements, opinions and data contained in all publications are solely those of the individual author(s) and contributor(s) and not of MDPI and/or the editor(s). MDPI and/or the editor(s) disclaim responsibility for any injury to people or property resulting from any ideas, methods, instructions or products referred to in the content. |
© 2024 by the authors. Licensee MDPI, Basel, Switzerland. This article is an open access article distributed under the terms and conditions of the Creative Commons Attribution (CC BY) license (https://creativecommons.org/licenses/by/4.0/).