


Urban Habitat Quality Enhancement and Optimization under Ecological Network Constraints


Abstract
1. Introduction
2. Materials and Methods
2.1. Study Area
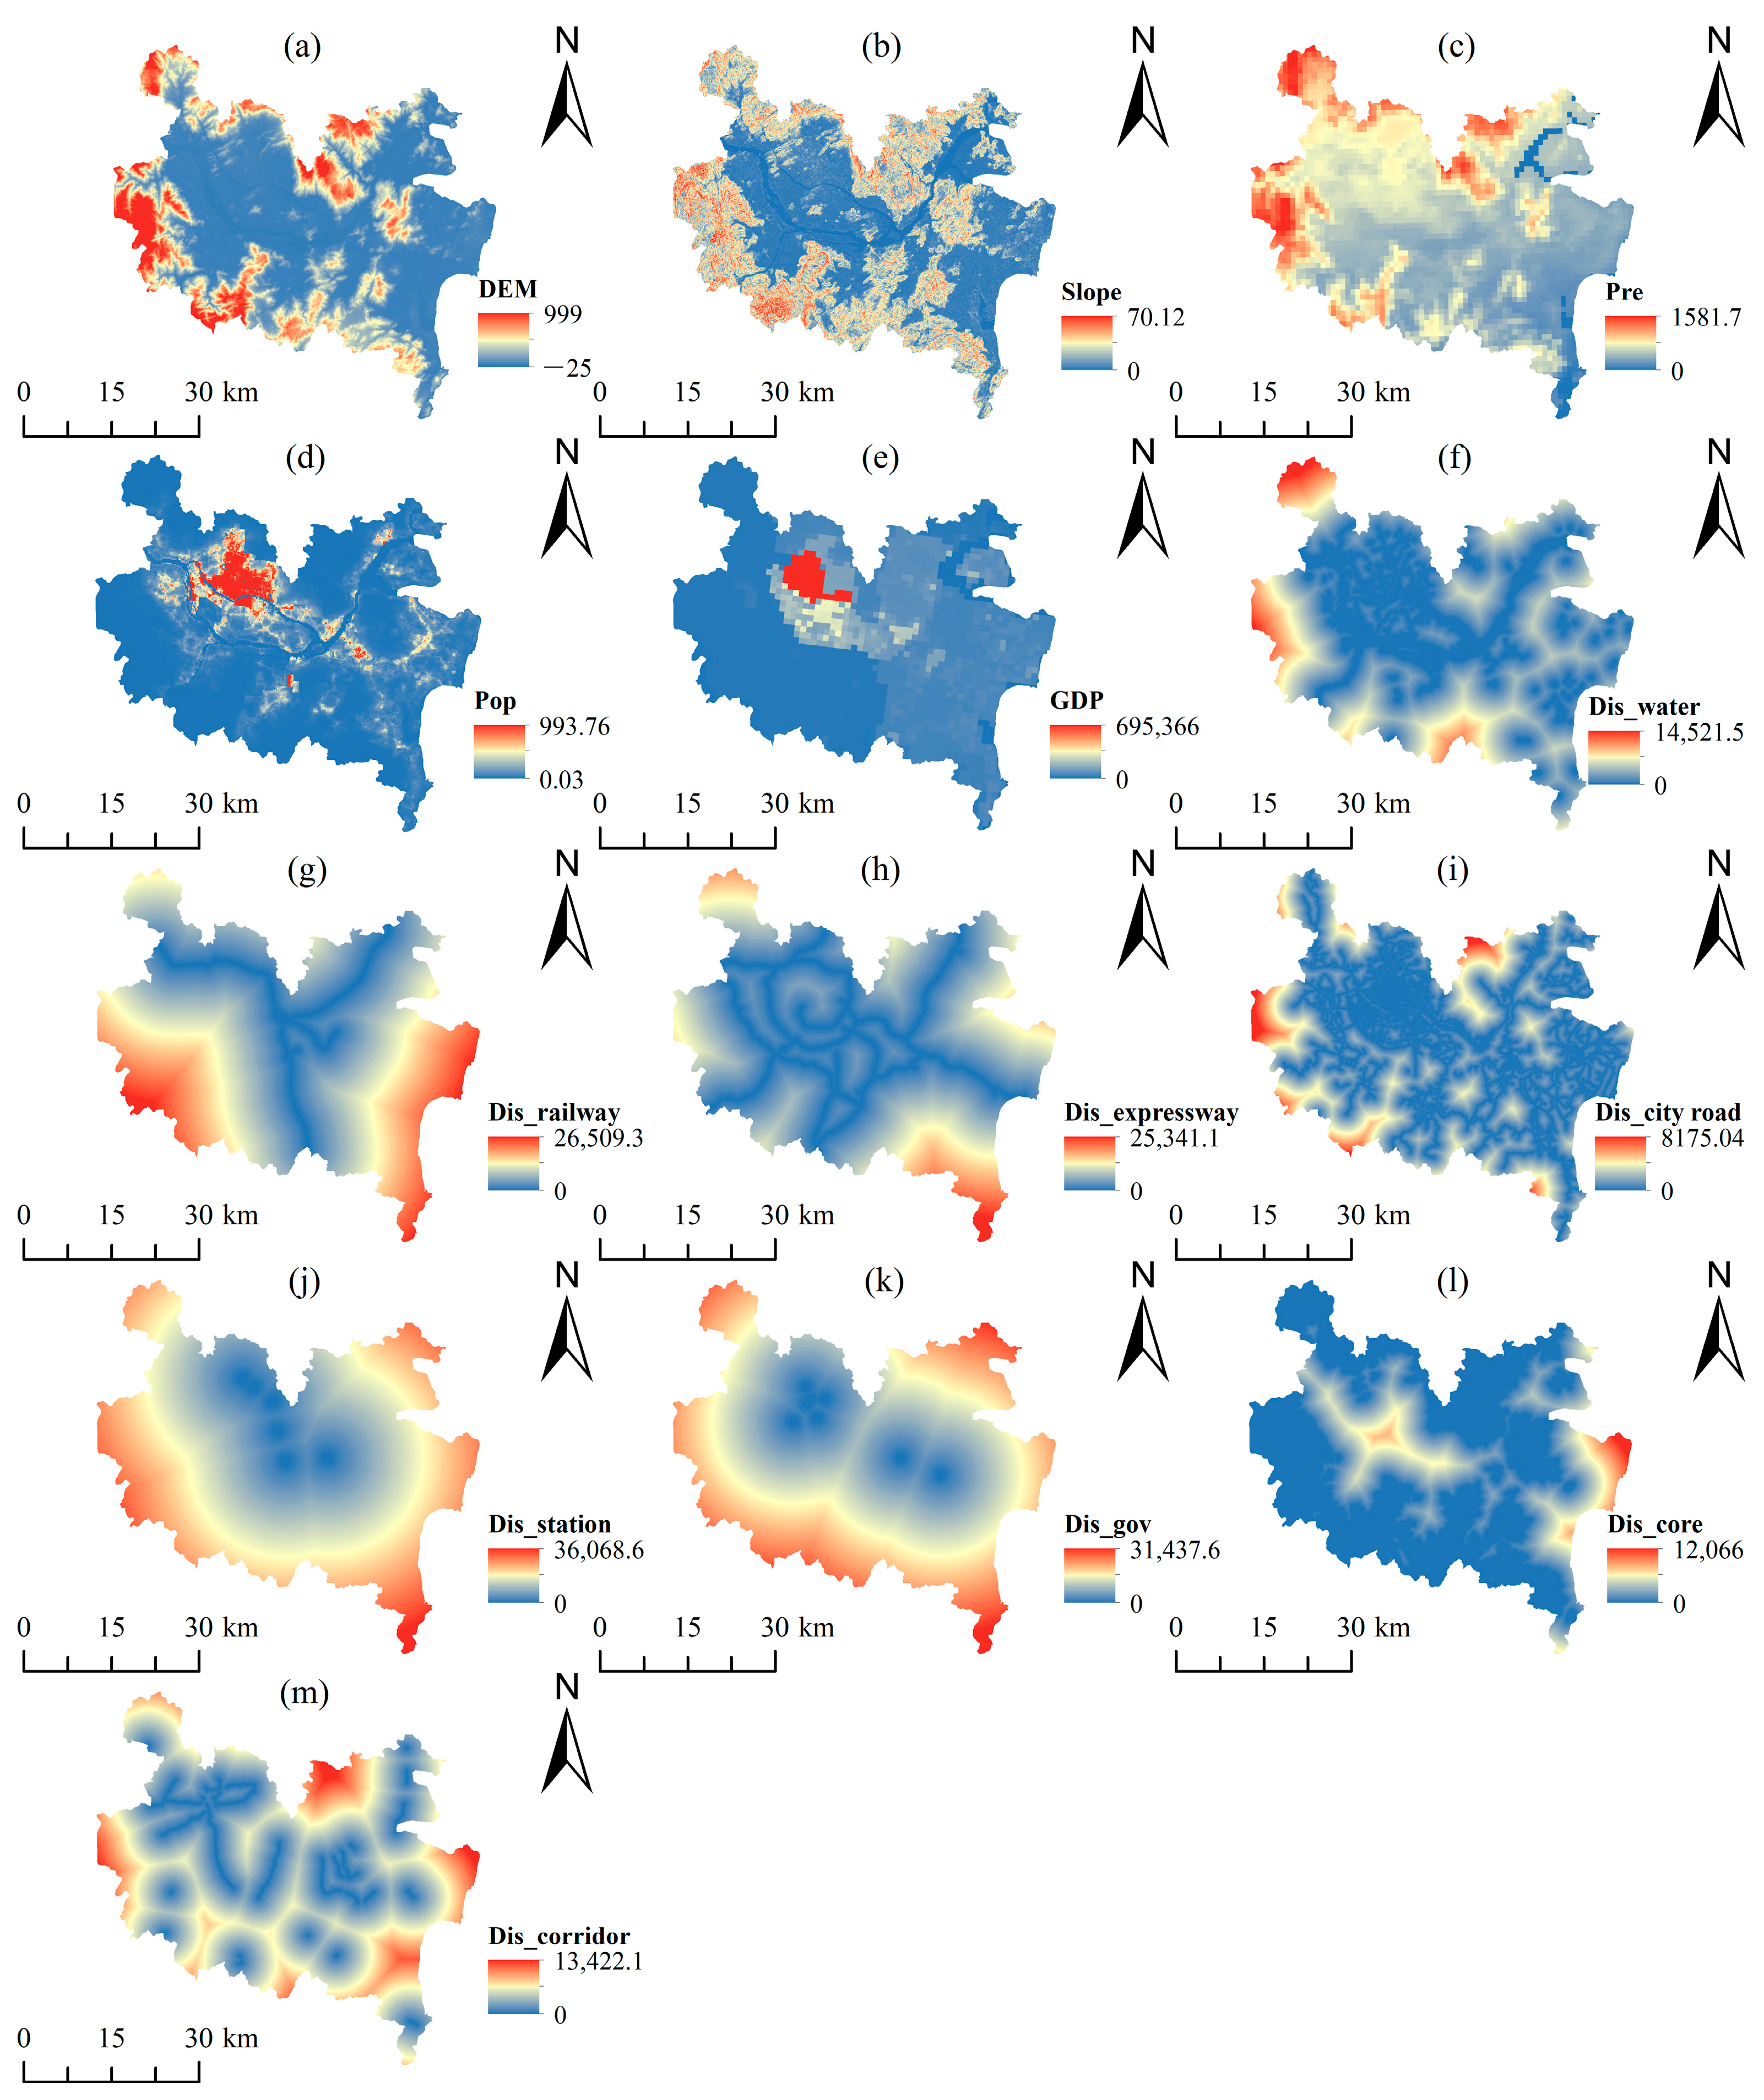
2.2. Data Sources
2.3. Methodology
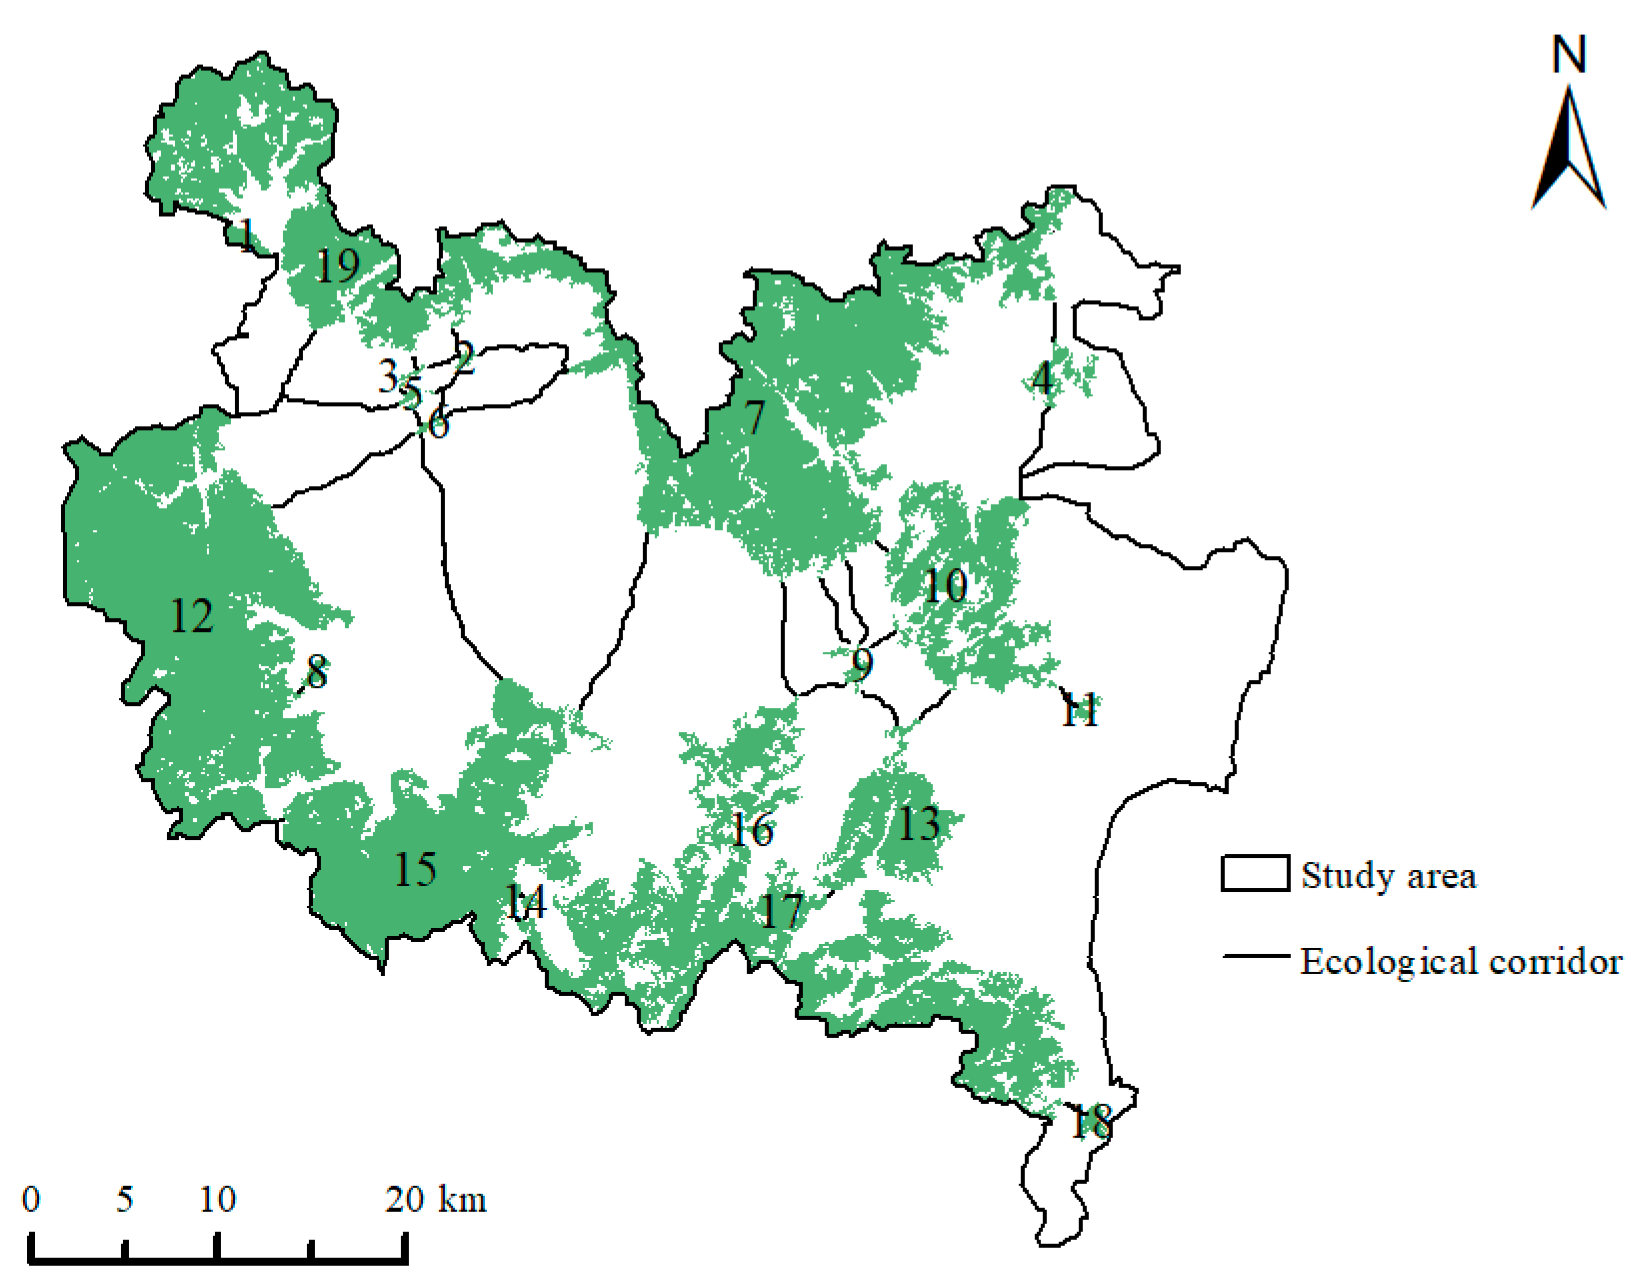
2.3.1. Identification of Ecological Source Areas
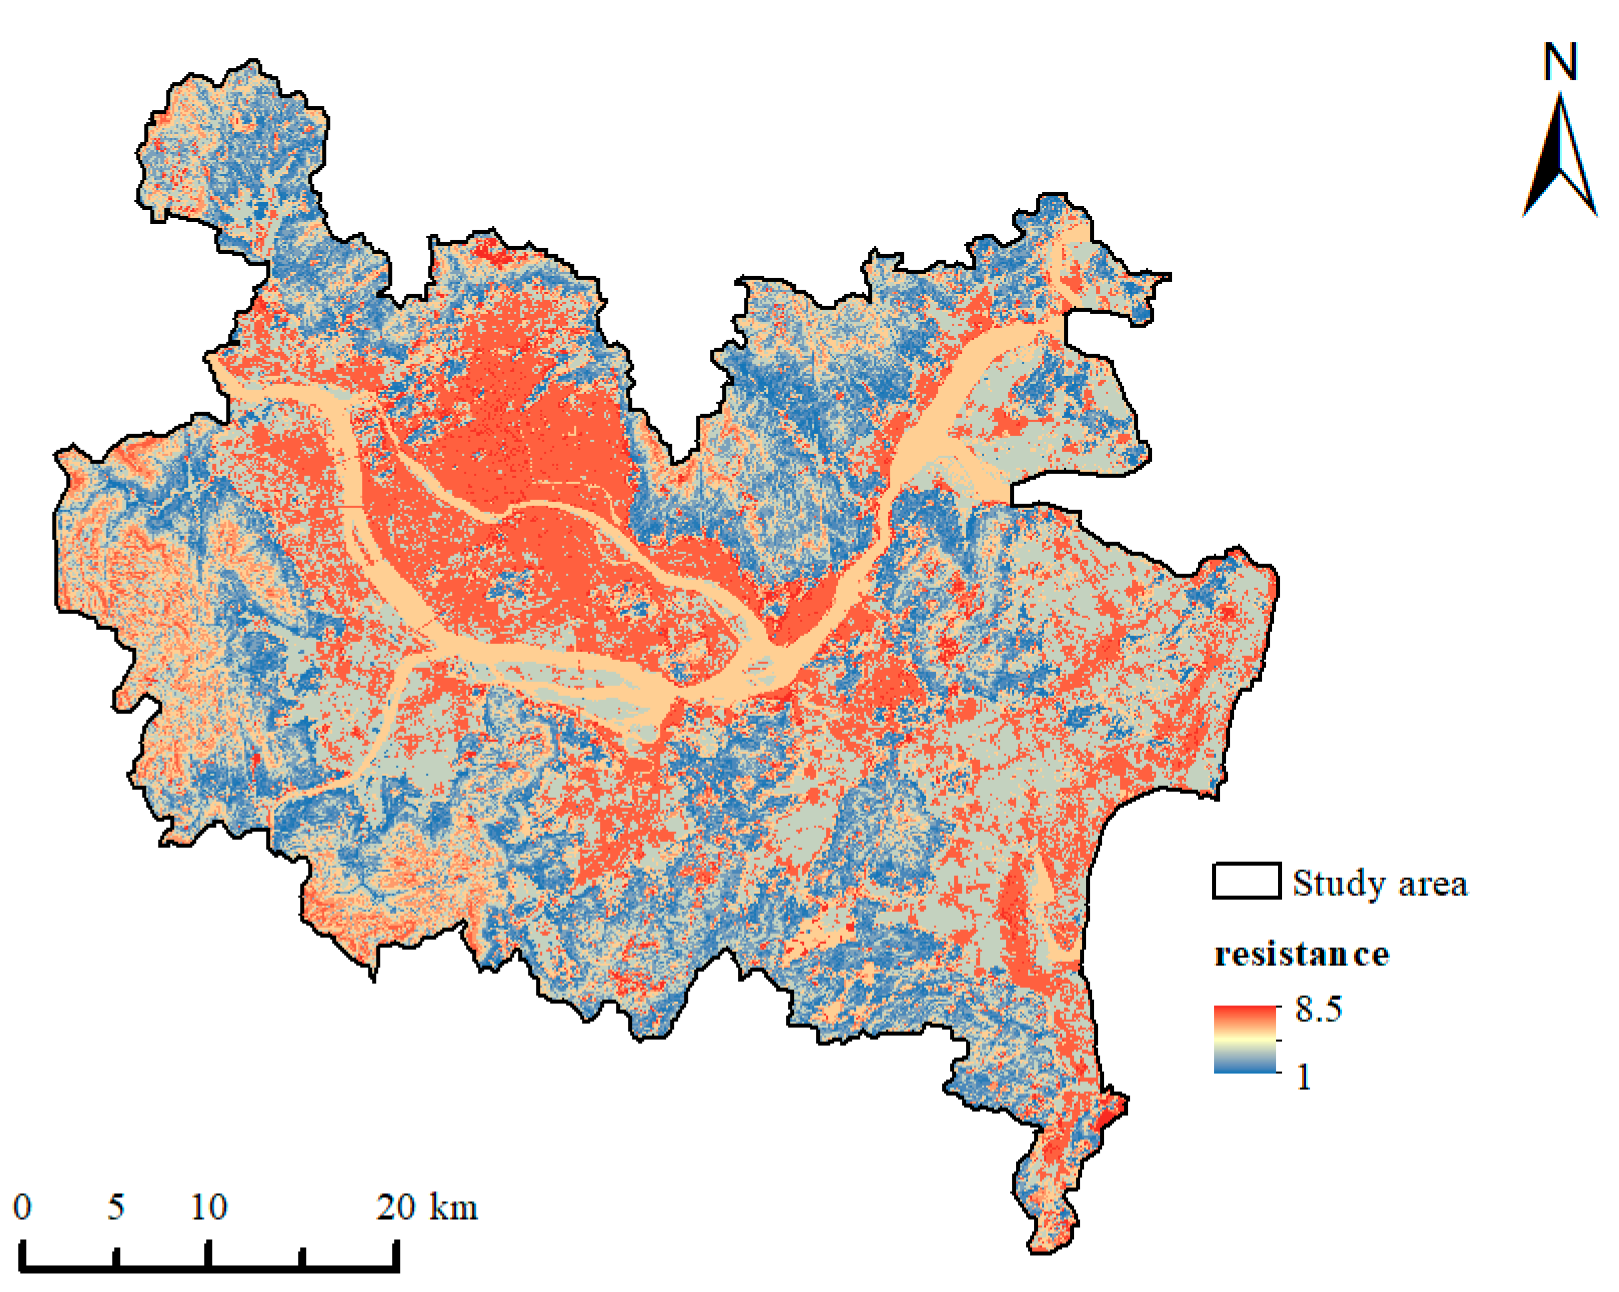
2.3.2. Construction of Integrated Resistance Surfaces and Ecological Corridors
2.3.3. PLUS Model
- (1)
- Land Expansion Analysis Strategy (LEAS)
- (2)
- CA model based on multi-class randomized patch seeding (CARS)
- (3)
- Land use drivers
- (4)
- Parameter setting
- (5)
- Accuracy test
2.3.4. Habitat Quality Model
3. Results
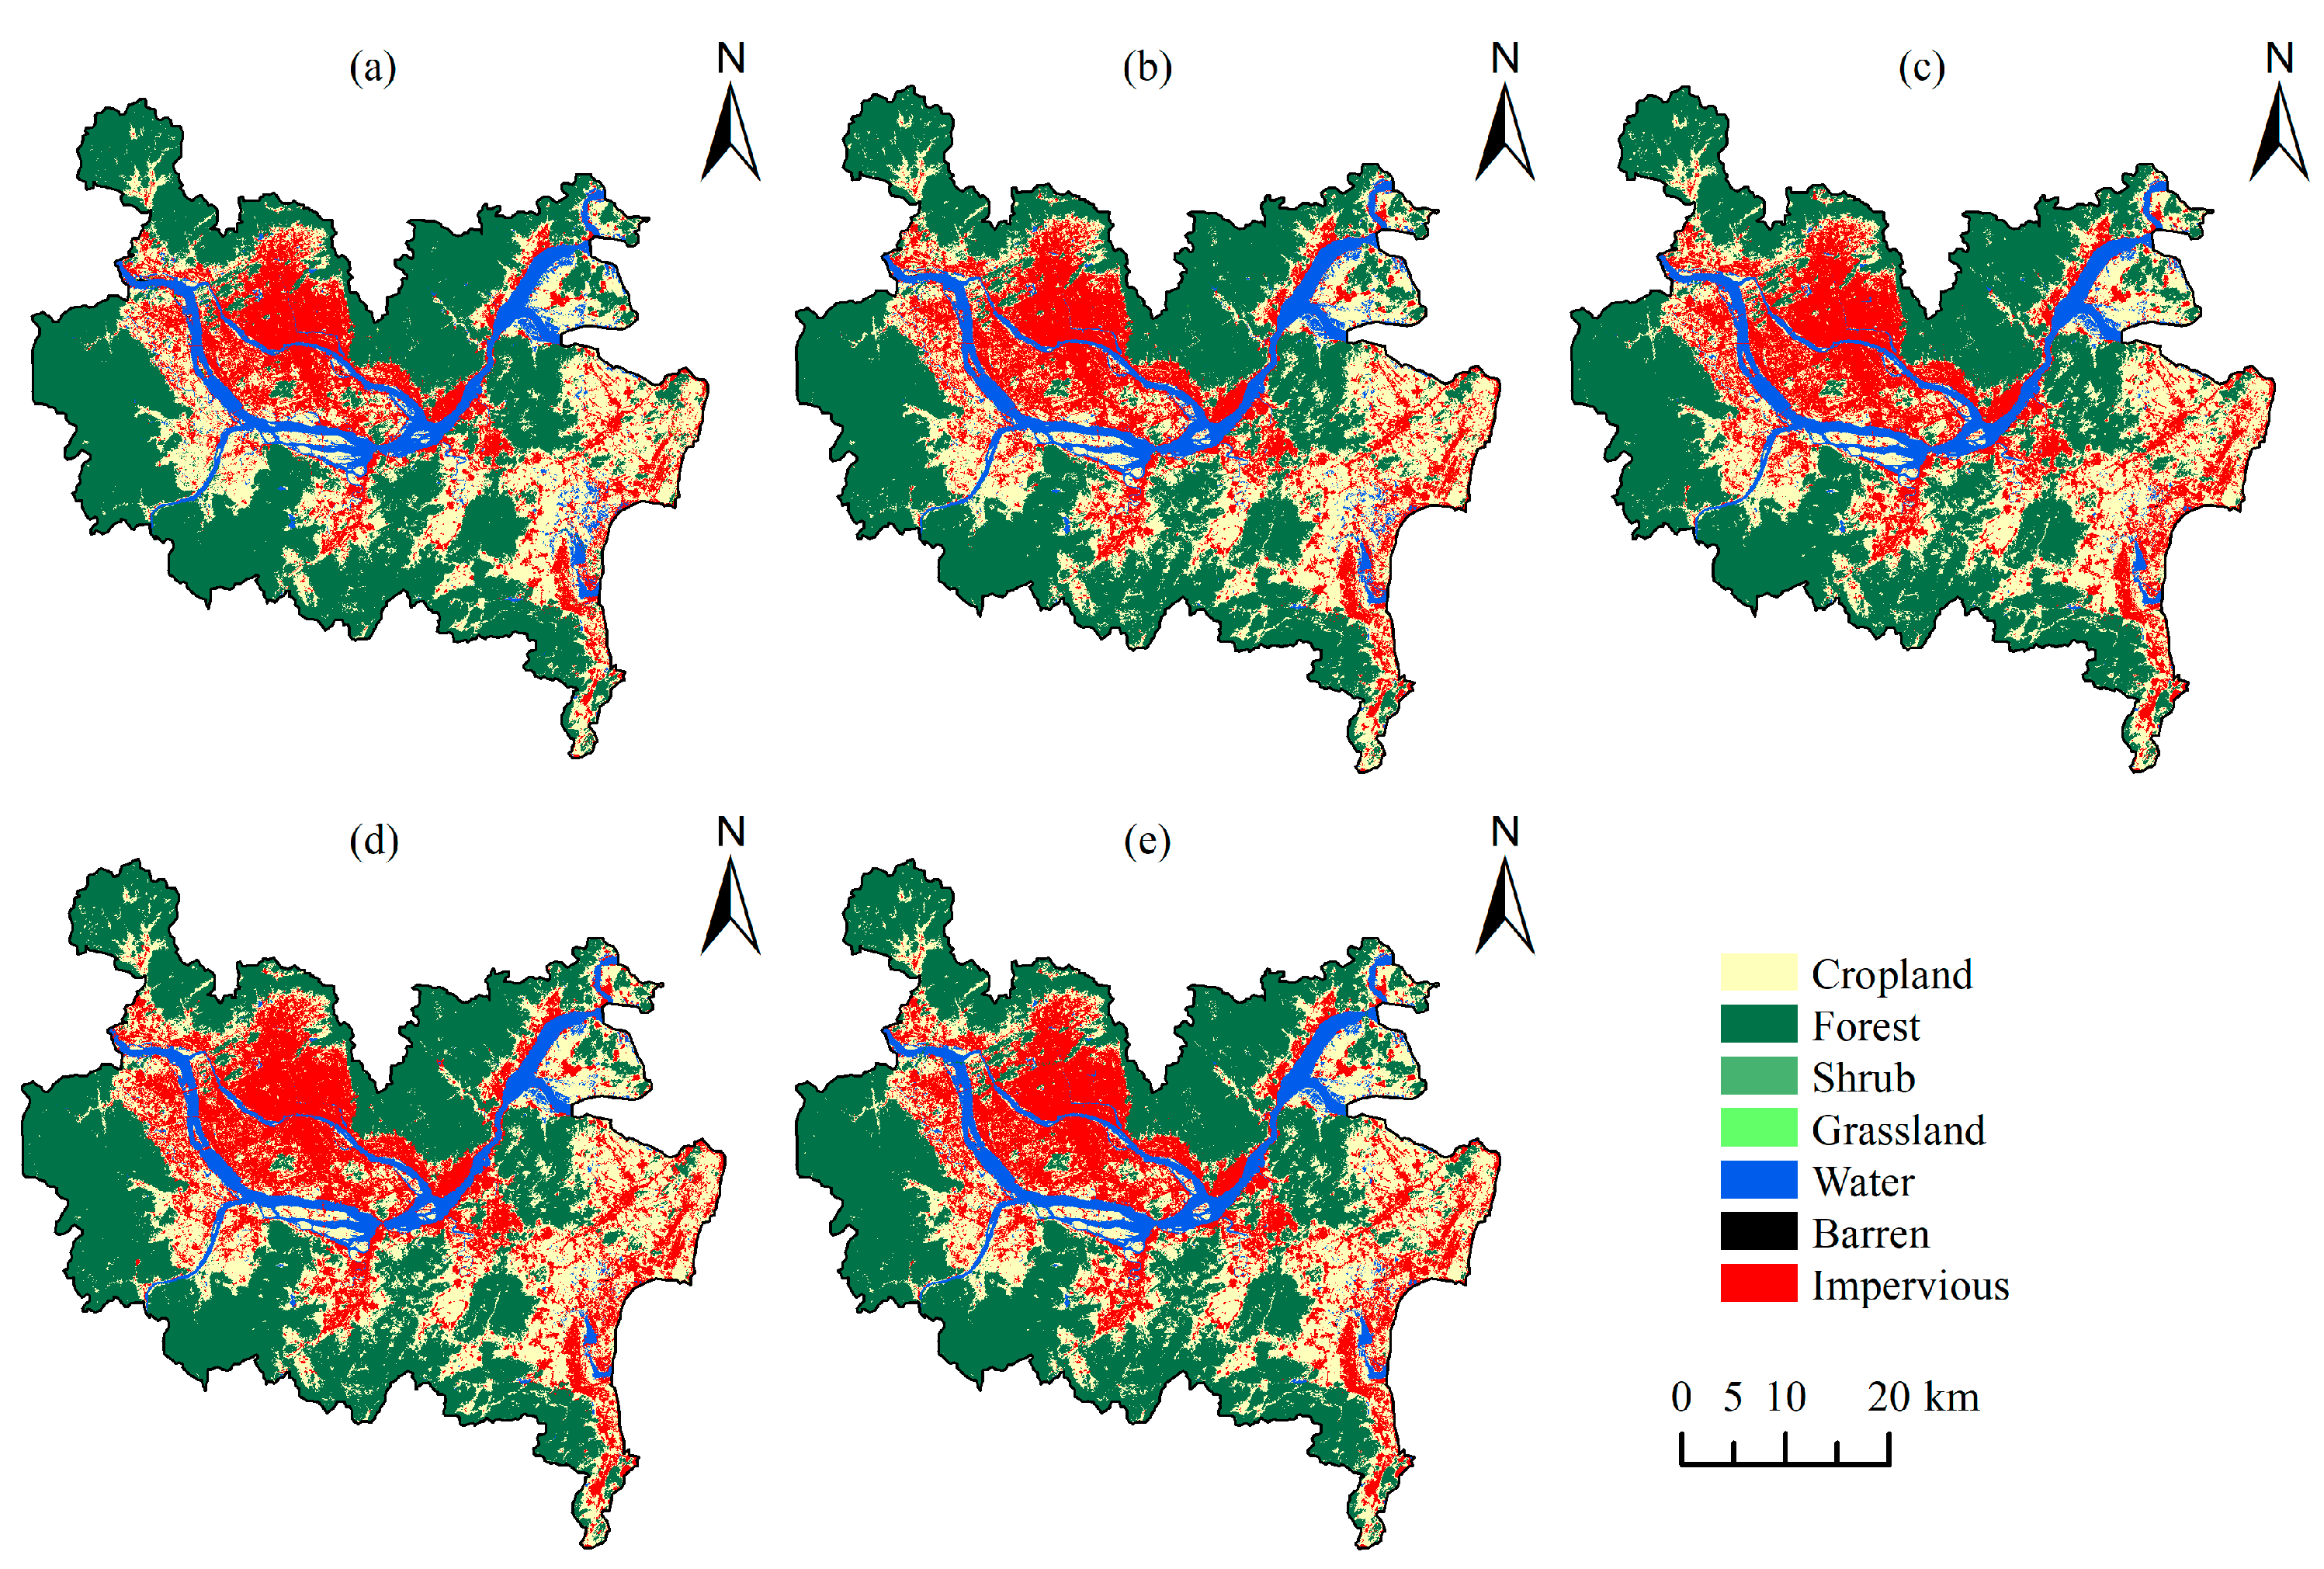
3.1. Landscape Type Dynamics and Ecological Source Extraction Results
3.2. Resistive Surface Construction and Spatial Quantification of Ecological Corridors
3.3. Land Use Modeling and Prediction
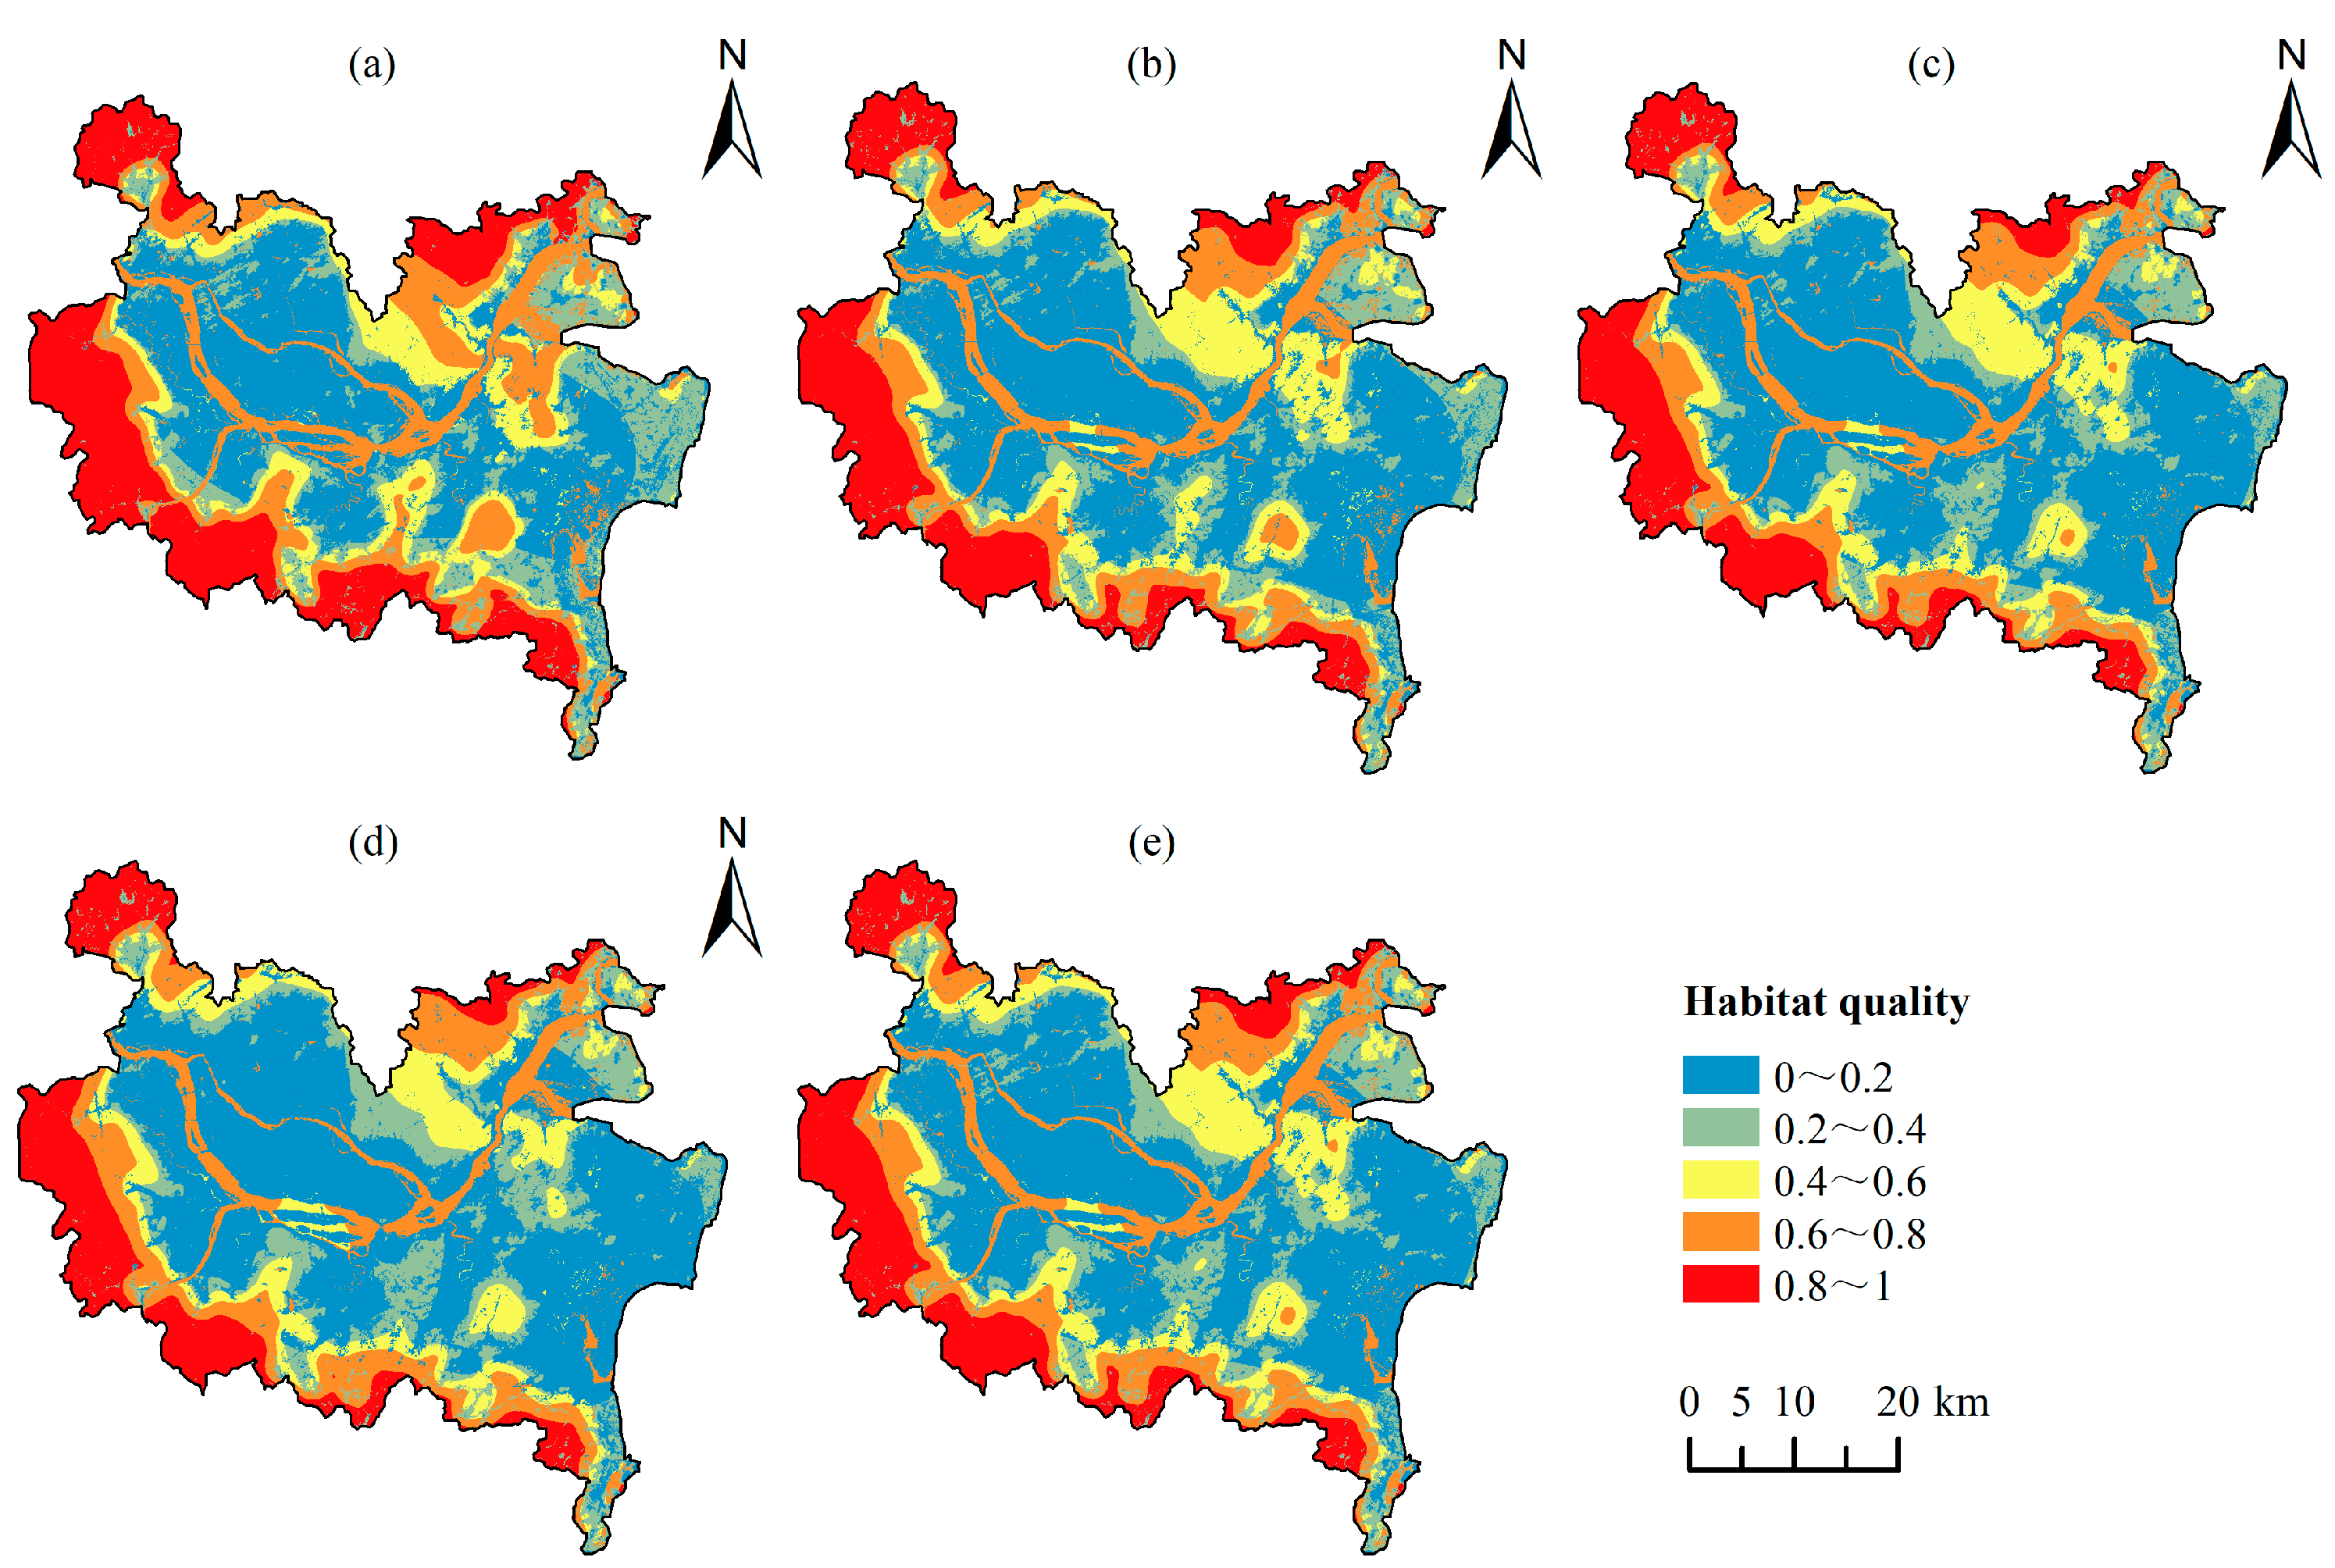
3.4. Land Use Evaluation Based on Habitat Quality
4. Discussion
4.1. Impact of the Construction of Ecological Corridors on Land Use Modeling
4.2. Strategies for Planning and Construction of Ecological Corridors in Fuzhou City
4.3. Shortcomings and Prospects
5. Conclusions
Author Contributions
Funding
Data Availability Statement
Conflicts of Interest
References
- Zhang, W.; Chang, W.J.; Zhu, Z.C.; Hui, Z. Landscape ecological risk assessment of Chinese coastal cities based on land use change. Appl. Geogr. 2020, 117, 102174. [Google Scholar] [CrossRef]
- Wu, W.; Zhao, S.; Zhu, C.; Jiang, J. A comparative study of urban expansion in Beijing, Tianjin and Shijiazhuang over the past three decades. Landsc. Urban Plan 2015, 134, 93–106. [Google Scholar] [CrossRef]
- Li, M.; Zhou, Y.; Xiao, P.; Tian, Y.; Huang, H.; Xiao, L. Evolution of habitat quality and its topographic gradient effect in northwest hubei province from 2000 to 2020 based on the invest model. Land 2021, 10, 857. [Google Scholar] [CrossRef]
- Wu, L.; Sun, C.; Fan, F. Estimating the characteristic spatiotemporal variation in habitat quality using the invest model—A case study from Guangdong–Hong Kong–Macao Greater Bay Area. Remote Sens. 2021, 13, 1008. [Google Scholar] [CrossRef]
- Yang, L.; Yu, K.; Ai, J.; Liu, Y.; Yang, W.; Liu, J. Dominant factors and spatial heterogeneity of land surface temperatures in urban areas: A case study in Fuzhou, China. Remote Sens. 2022, 14, 1266. [Google Scholar] [CrossRef]
- Dong, J.; Peng, J.; Liu, Y.; Qiu, S.; Han, Y. Integrating spatial continuous wavelet transform and kernel density estimation to identify ecological corridors in megacities. Landsc. Urban Plan 2020, 199, 103815. [Google Scholar] [CrossRef]
- Peng, J.; Zhao, H.; Liu, Y. Urban ecological corridors construction: A review. Acta Ecologica Sinica. 2017, 37, 23–30. [Google Scholar] [CrossRef]
- Hu, C.; Wang, Z.; Wang, Y.; Sun, D.; Zhang, J. Combining MSPA-MCR model to evaluate the ecological network in Wuhan, China. Land 2022, 11, 213. [Google Scholar] [CrossRef]
- Guan, D.; Jiang, Y.; Cheng, L. How can the landscape ecological security pattern be quantitatively optimized and effectively evaluated? An integrated analysis with the granularity inverse method and landscape indicators. Environ. Sci. Pollut. Res. 2022, 29, 41590–41616. [Google Scholar] [CrossRef]
- Lalechère, E.; Bergès, L. A validation procedure for ecological corridor locations. Land 2021, 10, 1320. [Google Scholar] [CrossRef]
- Wang, S.; Wu, M.; Hu, M.; Fan, C.; Wang, T.; Xia, B. Promoting landscape connectivity of highly urbanized area: An ecological network approach. Ecol. Indic. 2021, 125, 107487. [Google Scholar] [CrossRef]
- Dai, Y. Identifying the ecological security patterns of the Three Gorges Reservoir Region, China. Environ. Sci. Pollut. Res. 2022, 29, 45837–45847. [Google Scholar] [CrossRef] [PubMed]
- Geng, J.; Yu, K.; Sun, M.; Xie, Z.; Huang, R.; Wang, Y.; Zhao, Q.; Liu, J. Construction and Optimisation of Ecological Networks in High-Density Central Urban Areas: The Case of Fuzhou City, China. Remote Sens. 2023, 15, 5666. [Google Scholar] [CrossRef]
- Li, Y.; Zhang, Y.; Jiang, Z.; Guo, C.; Zhao, M.; Yang, Z.; Guo, M.; Wu, B.; Chen, Q. Integrating morphological spatial pattern analysis and the minimal cumulative resistance model to optimize urban ecological networks: A case study in Shenzhen City, China. Ecol. Process. 2021, 10, 63. [Google Scholar] [CrossRef]
- Huang, K.; Peng, L.; Wang, X.; Deng, W. Integrating circuit theory and landscape pattern index to identify and optimize ecological networks: A case study of the Sichuan Basin, China. Environ. Sci. Pollut. Res. 2022, 29, 66874–66887. [Google Scholar] [CrossRef] [PubMed]
- Wang, Y.; Qu, Z.; Zhong, Q.; Zhang, Q.; Zhang, L.; Zhang, R.; Yi, Y.; Zhang, G.; Li, X.; Liu, J. Delimitation of ecological corridors in a highly urbanizing region based on circuit theory and MSPA. Ecol. Indic. 2022, 142, 109258. [Google Scholar] [CrossRef]
- Hamad, R.; Balzter, H.; Kolo, K. Predicting land use/land cover changes using a CA-Markov model under two different scenarios. Sustainability 2018, 10, 3421. [Google Scholar] [CrossRef]
- Liu, X.; Liang, X.; Li, X.; Xu, X.; Ou, J.; Chen, Y.; Li, S.; Wang, S.; Pei, F. A future land use simulation model (FLUS) for simulating multiple land use scenarios by coupling human and natural effects. Landsc. Urban Plan 2017, 168, 94–116. [Google Scholar] [CrossRef]
- Liang, X.; Guan, Q.; Clarke, K.C.; Liu, S.; Wang, B.; Yao, Y. Understanding the drivers of sustainable land expansion using a patch-generating land use simulation (PLUS) model: A case study in Wuhan, China. Comput. Environ. Urban Syst. 2021, 85, 101569. [Google Scholar] [CrossRef]
- Gao, L.; Tao, F.; Liu, R.; Wang, Z.; Leng, H.; Zhou, T. Multi-scenario simulation and ecological risk analysis of land use based on the PLUS model: A case study of Nanjing. Sust. Cities Soc. 2022, 85, 104055. [Google Scholar] [CrossRef]
- Tang, W.; Cui, L.; Zheng, S.; Hu, W. Multi-scenario simulation of land use carbon emissions from energy consumption in Shenzhen, China. Land 2022, 11, 1673. [Google Scholar] [CrossRef]
- Wang, Z.; Zeng, J.; Chen, W. Impact of urban expansion on carbon storage under multi-scenario simulations in Wuhan, China. Environ. Sci. Pollut. Res. 2022, 29, 45507–45526. [Google Scholar] [CrossRef] [PubMed]
- Cao, M.; Chang, L.; Ma, S.; Zhao, Z.; Wu, K.; Hu, X.; Gu, Q.; Lü, G.; Chen, M. Multi-scenario simulation of land use for sustainable development goals. IEEE J. Sel. Top. Appl. Earth Observ. Remote Sens. 2022, 15, 2119–2127. [Google Scholar] [CrossRef]
- Xiong, N.; Yu, R.; Yan, F.; Wang, J.; Feng, Z. Land use and Land cover changes and prediction based on Multi-Scenario Simulation: A case study of Qishan County, China. Remote Sens. 2022, 14, 4041. [Google Scholar] [CrossRef]
- Li, Y.; Liu, Z.; Li, S.; Li, X. Multi-scenario simulation analysis of land use and carbon storage changes in changchun city based on FLUS and InVEST model. Land 2022, 11, 647. [Google Scholar] [CrossRef]
- Li, X.; Liu, Z.; Li, S.; Li, Y. Multi-scenario simulation analysis of land use impacts on habitat quality in Tianjin based on the PLUS model coupled with the InVEST model. Sustainability 2022, 14, 6923. [Google Scholar] [CrossRef]
- Liu, Y.; Jing, Y.; Han, S. Multi-scenario simulation of land use/land cover change and water yield evaluation coupled with the GMOP-PLUS-InVEST model: A case study of the Nansi Lake Basin in China. Ecol. Indic. 2023, 155, 110926. [Google Scholar] [CrossRef]
- Jiang, H.; Peng, J.; Zhao, Y.; Xu, D.; Dong, J. Zoning for ecosystem restoration based on ecological network in mountainous region. Ecol. Indic. 2022, 142, 109138. [Google Scholar] [CrossRef]
- Lv, L.; Zhang, S.; Zhu, J.; Wang, Z.; Wang, Z.; Li, G.; Yang, C. Ecological restoration strategies for mountainous cities based on ecological security patterns and circuit theory: A case of Central Urban Areas in Chongqing, China. Int. J. Environ. Res. Public Health 2022, 19, 16505. [Google Scholar] [CrossRef]
- Xu, X.; Wang, S.; Rong, W. Construction of ecological network in Suzhou based on the PLUS and MSPA models. Ecol. Indic. 2023, 154, 110740. [Google Scholar] [CrossRef]
- Li, L.; Huang, X.; Wu, D.; Yang, H. Construction of ecological security pattern adapting to future land use change in Pearl River Delta, China. Appl. Geogr. 2023, 154, 102946. [Google Scholar] [CrossRef]
- Liu, J.; Liu, B.; Wu, L.; Miao, H.; Liu, J.; Jiang, K.; Ding, H.; Gao, W.; Liu, T. Prediction of land use for the next 30 years using the PLUS model’s multi-scenario simulation in Guizhou Province, China. Sci. Rep. 2024, 14, 13143. [Google Scholar] [CrossRef] [PubMed]
- Wang, S.; Ge, Y. Ecological quality response to multi-scenario land-use changes in the Heihe River Basin. Sustainability 2022, 14, 2716. [Google Scholar] [CrossRef]
- Yang, J.; Huang, X. The 30 m Annual Land Cover Datasets and Its Dynamics in China from 1985 to 2022. Earth Syst. Sci. Data 2023, 13, 3907–3925. [Google Scholar] [CrossRef]
- Soille, P.; Vogt, P. Morphological segmentation of binary patterns. Pattern Recognit. Lett. 2009, 30, 456–459. [Google Scholar] [CrossRef]
- Vogt, P.; Ferrari, J.R.; Lookingbill, T.R.; Gardner, R.H.; Riitters, K.H.; Ostapowicz, K. Mapping functional connectivity. Ecol. Indic. 2009, 9, 64–71. [Google Scholar] [CrossRef]
- Tang, Y.; Gao, C.; Wu, X. Urban ecological corridor network construction: An integration of the least cost path model and the InVEST model. ISPRS Int. J. Geo-Inf. 2020, 9, 33. [Google Scholar] [CrossRef]
- Hou, W.; Zhou, W.; Li, J.; Li, C. Simulation of the potential impact of urban expansion on regional ecological corridors: A case study of Taiyuan, China. Sust. Cities Soc. 2022, 83, 103933. [Google Scholar] [CrossRef]
- Li, Q.; Zhou, Y.; Yi, S. An integrated approach to constructing ecological security patterns and identifying ecological restoration and protection areas: A case study of Jingmen, China. Ecol. Indic. 2022, 137, 108723. [Google Scholar] [CrossRef]
- Knaapen, J.P.; Scheffer, M.; Harms, B. Estimating habitat isolation in landscape planning. Landsc. Urban Plan 1992, 23, 1–16. [Google Scholar] [CrossRef]
- McRae, B.H.; Kavanagh, D.M. Linkage Mapper Connectivity Analysis Software; The Nature Conservancy: Seattle, WA, USA, 2011. [Google Scholar]
- Xu, L.; Liu, X.; Tong, D.; Liu, Z.; Yin, L.; Zheng, W. Forecasting urban land use change based on cellular automata and the PLUS model. Land 2022, 11, 652. [Google Scholar] [CrossRef]
- Chen, C.; Liu, J.; Bi, L. Spatial and temporal changes of habitat quality and its influential factors in China based on the InVEST model. Forests 2023, 14, 374. [Google Scholar] [CrossRef]
- Terrado, M.; Sabater, S.; Chaplin-Kramer, B.; Mandle, L.; Ziv, G.; Acuña, V. Model development for the assessment of terrestrial and aquatic habitat quality in conservation planning. Sci. Total Environ. 2016, 540, 63–70. [Google Scholar] [CrossRef] [PubMed]
- Luo, X.; Le, F.; Zhang, Y.; Zhang, H.; Zhai, J.; Luo, Y. Multi-scenario analysis and optimization strategy of ecological security pattern in the Weihe river basin. J. Environ. Manag. 2024, 366, 121813. [Google Scholar] [CrossRef] [PubMed]


| Data Type | Data Format | Resolution | Source |
|---|---|---|---|
| 2012–2022 Land use type data | .tif | 30 m | https://zenodo.org/records/8176941, accessed on 7 August 2024 |
| Boundary of the study area | .shp | / | http://zygh.fuzhou.gov.cn/, accessed on 7 August 2021 |
| DEM | .tif | 12.5 m | https://asf.alaska.edu/, accessed on 7 August 2024 |
| City roads, railroads, highways, etc. | .shp | / | https://www.openstreetmap.org/, accessed on 7 August 2024 |
| Population density | .tif | 100 m | https://www.worldpop.org/, accessed on 7 August 2024 |
| GDP | .tif | 1000 m | https://www.resdc.cn/, accessed on 7 August 2024 |
| Average annual precipitation | .tif | 1000 m | http://www.geodata.cn/, accessed on 7 August 2024 |
| Type of Resistance | Resistance Factor | Resistance Value |
|---|---|---|
| Land use type | Cropland | 3 |
| Forest, Shrub, Grassland | 1 | |
| Water | 5 | |
| Barren | 7 | |
| Impervious | 9 | |
| MSPA landscape types | Core | 1 |
| Bridge, Loop | 3 | |
| Branch, Islet | 5 | |
| Edge, Perforation | 7 | |
| Background | 9 | |
| Slope | <5° | 1 |
| 5–15° | 3 | |
| 15–25° | 5 | |
| 25–35° | 7 | |
| >35° | 9 | |
| DEM | <200 | 1 |
| 200–300 | 3 | |
| 300–400 | 5 | |
| 400–600 | 7 | |
| >600 | 9 |
| Cropland | Forest | Shrub | Grassland | Water | Barren | Impervious | |
|---|---|---|---|---|---|---|---|
| Cropland | 1 | 1 | 1 | 1 | 0 | 1 | 1 |
| Forest | 0 | 1 | 0 | 0 | 0 | 0 | 0 |
| Shrub | 0 | 1 | 1 | 1 | 0 | 0 | 1 |
| Grassland | 0 | 1 | 1 | 1 | 0 | 0 | 1 |
| Water | 0 | 1 | 0 | 0 | 1 | 0 | 0 |
| Barren | 1 | 1 | 1 | 1 | 1 | 1 | 1 |
| Impervious | 1 | 1 | 0 | 0 | 0 | 0 | 1 |
| Cropland | Forest | Shrub | Grassland | Water | Barren | Impervious | |
|---|---|---|---|---|---|---|---|
| Neighborhood Weight | 0.2 | 0.7 | 0.2 | 0.1 | 0.1 | 0.1 | 0.7 |
| THREAT | MAX_DIST | WEIGHT | DECAY |
|---|---|---|---|
| Cropland | 2 | 0.6 | linear |
| Barren | 3 | 0.5 | exponential |
| Impervious | 8 | 1 | exponential |
| LULC | HABITAT | Cropland | Barren | Impervious |
|---|---|---|---|---|
| Cropland | 0.3 | 0 | 0.1 | 0.8 |
| Forest | 1 | 0.3 | 0.2 | 0.6 |
| Shrub | 0.8 | 0.6 | 0.3 | 0.9 |
| Grassland | 0.6 | 0.8 | 0.4 | 0.8 |
| Water | 0.8 | 0.1 | 0.1 | 0.2 |
| Barren | 0.2 | 0.7 | 0 | 0.9 |
| Impervious | 0 | 0.1 | 0 | 0 |
| 2012 (km2) | 2017 (km2) | 2022 (km2) | Rate of Change 2012–2022 | |
|---|---|---|---|---|
| Core | 949.35 | 872.19 | 865.54 | −8.83% |
| Islet | 7.98 | 7.72 | 5.89 | −26.10% |
| Perforation | 20.11 | 26.08 | 26.51 | 31.86% |
| Edge | 53.83 | 58.63 | 59.64 | 10.80% |
| Loop | 9.92 | 10.62 | 7.99 | −19.48% |
| Bridge | 6.51 | 5.82 | 4.25 | −34.68% |
| Branch | 15.02 | 16.55 | 13.76 | −8.44% |
| Land Use Type | 2012 (km2) | 2017 (km2) | 2022 (km2) | 2027 State of Nature (km2) | 2027 Corridor Constraints (km2) |
|---|---|---|---|---|---|
| Cropland | 543.29 | 568.38 | 562.12 | 555.10 | 547.54 |
| Forest | 1061.60 | 997.09 | 983.31 | 968.87 | 998.79 |
| Shrub | 0.04 | 0.03 | 0.03 | 0.02 | 0.02 |
| Grassland | 1.09 | 0.51 | 0.24 | 0.16 | 0.13 |
| Water | 163.48 | 152.65 | 141.70 | 131.66 | 143.45 |
| Barren | 0.72 | 0.46 | 0.35 | 0.27 | 0.22 |
| Impervious | 352.75 | 403.84 | 435.20 | 466.86 | 432.80 |
| Habitat Quality Rating | 2012 | 2017 | 2022 | 2027 State of Nature | 2027 Corridor Constraints |
|---|---|---|---|---|---|
| Lowest (0~0.2) | 688.78 | 836.41 | 897.14 | 950.28 | 878.83 |
| Lower (0.2~0.4) | 334.19 | 316.10 | 316.86 | 320.56 | 317.29 |
| Medium (0.4~0.6) | 220.00 | 259.40 | 253.86 | 236.55 | 260.04 |
| Higher (0.6~0.8) | 424.55 | 358.38 | 342.13 | 334.30 | 346.68 |
| Highest (0.8~1) | 455.45 | 352.68 | 312.98 | 281.28 | 320.13 |
Disclaimer/Publisher’s Note: The statements, opinions and data contained in all publications are solely those of the individual author(s) and contributor(s) and not of MDPI and/or the editor(s). MDPI and/or the editor(s) disclaim responsibility for any injury to people or property resulting from any ideas, methods, instructions or products referred to in the content. |
© 2024 by the authors. Licensee MDPI, Basel, Switzerland. This article is an open access article distributed under the terms and conditions of the Creative Commons Attribution (CC BY) license (https://creativecommons.org/licenses/by/4.0/).
Share and Cite
Zhou, Y.; Geng, J.; Liu, X. Urban Habitat Quality Enhancement and Optimization under Ecological Network Constraints. Land 2024, 13, 1640. https://doi.org/10.3390/land13101640
Zhou Y, Geng J, Liu X. Urban Habitat Quality Enhancement and Optimization under Ecological Network Constraints. Land. 2024; 13(10):1640. https://doi.org/10.3390/land13101640
Chicago/Turabian StyleZhou, Yanhai, Jianwei Geng, and Xingzhao Liu. 2024. "Urban Habitat Quality Enhancement and Optimization under Ecological Network Constraints" Land 13, no. 10: 1640. https://doi.org/10.3390/land13101640
APA StyleZhou, Y., Geng, J., & Liu, X. (2024). Urban Habitat Quality Enhancement and Optimization under Ecological Network Constraints. Land, 13(10), 1640. https://doi.org/10.3390/land13101640