1. Introduction
Among the several desertification definitions coined since the 1970s, a common factor is the adverse environmental process that results in desert-like conditions [
1]. Desertification is a global land degradation phenomenon, affecting 6% (2.7 million km
2) of the 44.5 million km
2 of drylands [
2]. The Aridity Index (AI), determined by the ratio of precipitation to evapotranspiration, is commonly used to classify a region as a dryland when the AI is less than 0.65 [
3]. In Brazil, drylands predominantly exist in the northeastern region of the country and have been closely associated with extensive droughts and land degradation [
2,
4]. Despite some controversies arising from disagreements between scientific and policy discourses [
1,
5], land desertification process remains a crucial topic, particularly in increasing impacts from agricultural production, deforestation, and climate change [
6,
7,
8].
In addition to the climate, several soil and socioeconomic factors play important roles in driving environmental degradation, especially in areas located in arid and semi-arid regions [
9]. A multi-disciplinary understanding of desertification drivers is essential for implementing monitoring systems to assess land degradation and for developing early warning systems that allow timely mitigation of negative environmental impacts [
10,
11].
Remote sensing techniques have enabled large-scale, cost-effective monitoring in environmentally sensitive areas [
12,
13,
14]. Among desertification monitoring methods, a relatively common approach involves the use of multi-disciplinary techniques to define Environmentally Sensitive Areas (ESAs) [
15]. Overall, this approach integrates qualitative and quantitative factors—encompassing soil and climatic characteristics, as well as human influence on a region—to assess an area’s susceptibility to desertification [
16]. A well-studied multi-disciplinary approach is the Mediterranean Desertification and Land Use (MEDALUS) model, which has been conceived from the parameterization of environmental factors driving the desertification process and is recommended due to its simplicity [
17]. The model integrates climatic, soil, land management, and vegetation factors [
18].
The MEDALUS model, initially proposed for Mediterranean Europe [
19], has been used in other regions of the world to assess land desertification due to the universal characteristics of the model‘s parameters [
20]. The application of this model provided a better understanding of degradation processes in the Peruvian Amazon [
16], revealed regions sensitive to land degradation, and pinpointed management quality as the main driver in Ethiopia [
21]. It assessed the rapid increase in desertification sensitivity in Mongolia between 2003 and 2008 [
22], was adapted to map desertification severity in Egypt [
23], detected desertification risk trends in Greece over 45 years using enhanced ESAs MEDALUS methodology [
24], and underwent a significant update to provide a global assessment and mapping of land degradation and desertification threats, further proving its versatility for both regional and global scales [
25].
In Brazil, the application of the MEDALUS model has shown good performance in mapping areas susceptible to desertification in the Northeast region [
26]. This region is mainly characterized by a semi-arid climate and vast extensions of degraded land, resulting from decades of inadequate land use, such as slash-and-burn, overgrazing, and overexploitation of natural resources [
27]. However, limited computer power has been a major limitation to studies analyzing the many variables involved in desertification and larger regions; therefore, studies have generally focused on small areas to reduce computational requirements [
28]. The high computer power necessary to analyze large amounts of data can be addressed by cloud computing platforms, such as Google Earth Engine, which allow convenient and effective data processing, analysis, and storage [
29,
30,
31,
32].
In this study, we used the MEDALUS model to assess the susceptibility to desertification of the East Atlantic Basin, Brazil, using Google Earth Engine (GEE) in 2019. This model has been widely used in the Mediterranean regions due to its flexibility and rapid implementation strategy. Furthermore, it allows for an in-depth understanding of the parameters causing the desertification threat at a certain location by delivering accurate results and being easily implemented in arid areas [
25]. The objectives were to (i) assess the sensitivity of the East Atlantic Basin to desertification and (ii) evaluate the influence of each component of the MEDALUS model on its overall performance.
2. Materials and Methods
2.1. Study Site and Database
The East Atlantic Basin (
Figure 1) is located within the states of Bahia, Espírito Santo, Minas Gerais, and Sergipe, with a total area of approximately 386,511.95 km
2. The East Atlantic Basin has four distinct climate regimes (arid, semi-arid, humid, and sub-humid), a strong incidence of solar radiation, altitudes ranging from sea level to as high as 1100 m [
33], and average annual precipitation rates ranging from 600 and 2200 mm [
34]. Due to its diversity in climate, relief, and vegetation, the basin is an interesting choice for land desertification assessment and for testing the GEE processing capacity. This basin spans the spatial domains of two distinct biomes: Caatinga, characterized by its arid conditions and unique vegetation, and Atlantic Forest, known for its wetter climate and lush forests.
Identifying and measuring the impacts resulting from the occurrence of desertification in regional ecosystems is an effective method of evaluating the effects of sustainable soil management in rural communities [
35]. In this scenario, the selected study area, a basin situated in a semi-arid region, offers a unique landscape characterized by a gradient of rainfall. Evaluating desertification against this backdrop provides insights into the impacts of climatic shifts on such ecosystems.
Digital geospatial databases were used to map the areas sensitive to desertification in the East Atlantic Basin. Some of these data underwent the removal of topological errors and the addition of population data. These adjustments were made using the open-source software QGIS, version 3.14. Subsequently, these files were uploaded to the GEE platform.
The research data for this study primarily consist of geospatial and environmental datasets that enable the comprehensive application of the MEDALUS model in the Brazilian East Atlantic Region. The datasets include variables related to soil quality, vegetation condition, climatic factors, and land management practices, among others. These variables are meticulously processed and analyzed using advanced geoprocessing techniques on the GEE platform. Given the limited research previously conducted in this region, our research data serves as one of the pioneering datasets that will hopefully stimulate further scientific investigations. The data aims to offer a multifaceted view of land desertification factors, thereby providing a robust foundation for the Quality Indices (QIs) employed in our model.
Before geospatial classification, data preprocessing was conducted on the acquired datasets. Climate determinants were derived from averaged precipitation and potential evapotranspiration data spanning a decade, leading to the computation of the aridity index. Terrain features, including slope and orientation, were deduced from the SRTM digital elevation model. Using land use and land cover data, three risk indices were produced, while the NDVI from Sentinel-2 imagery informed vegetation health assessments. To maintain uniformity across the files, all datasets were projected to the EPSG: 31984 coordinate system. Such preprocessing is indispensable in spatial analyses, ensuring data accuracy and consistency. It rectifies raw data discrepancies, harmonizes diverse datasets, and contextualizes data, bolstering the reliability and depth of ensuing analyses.
2.2. The MEDALUS Model
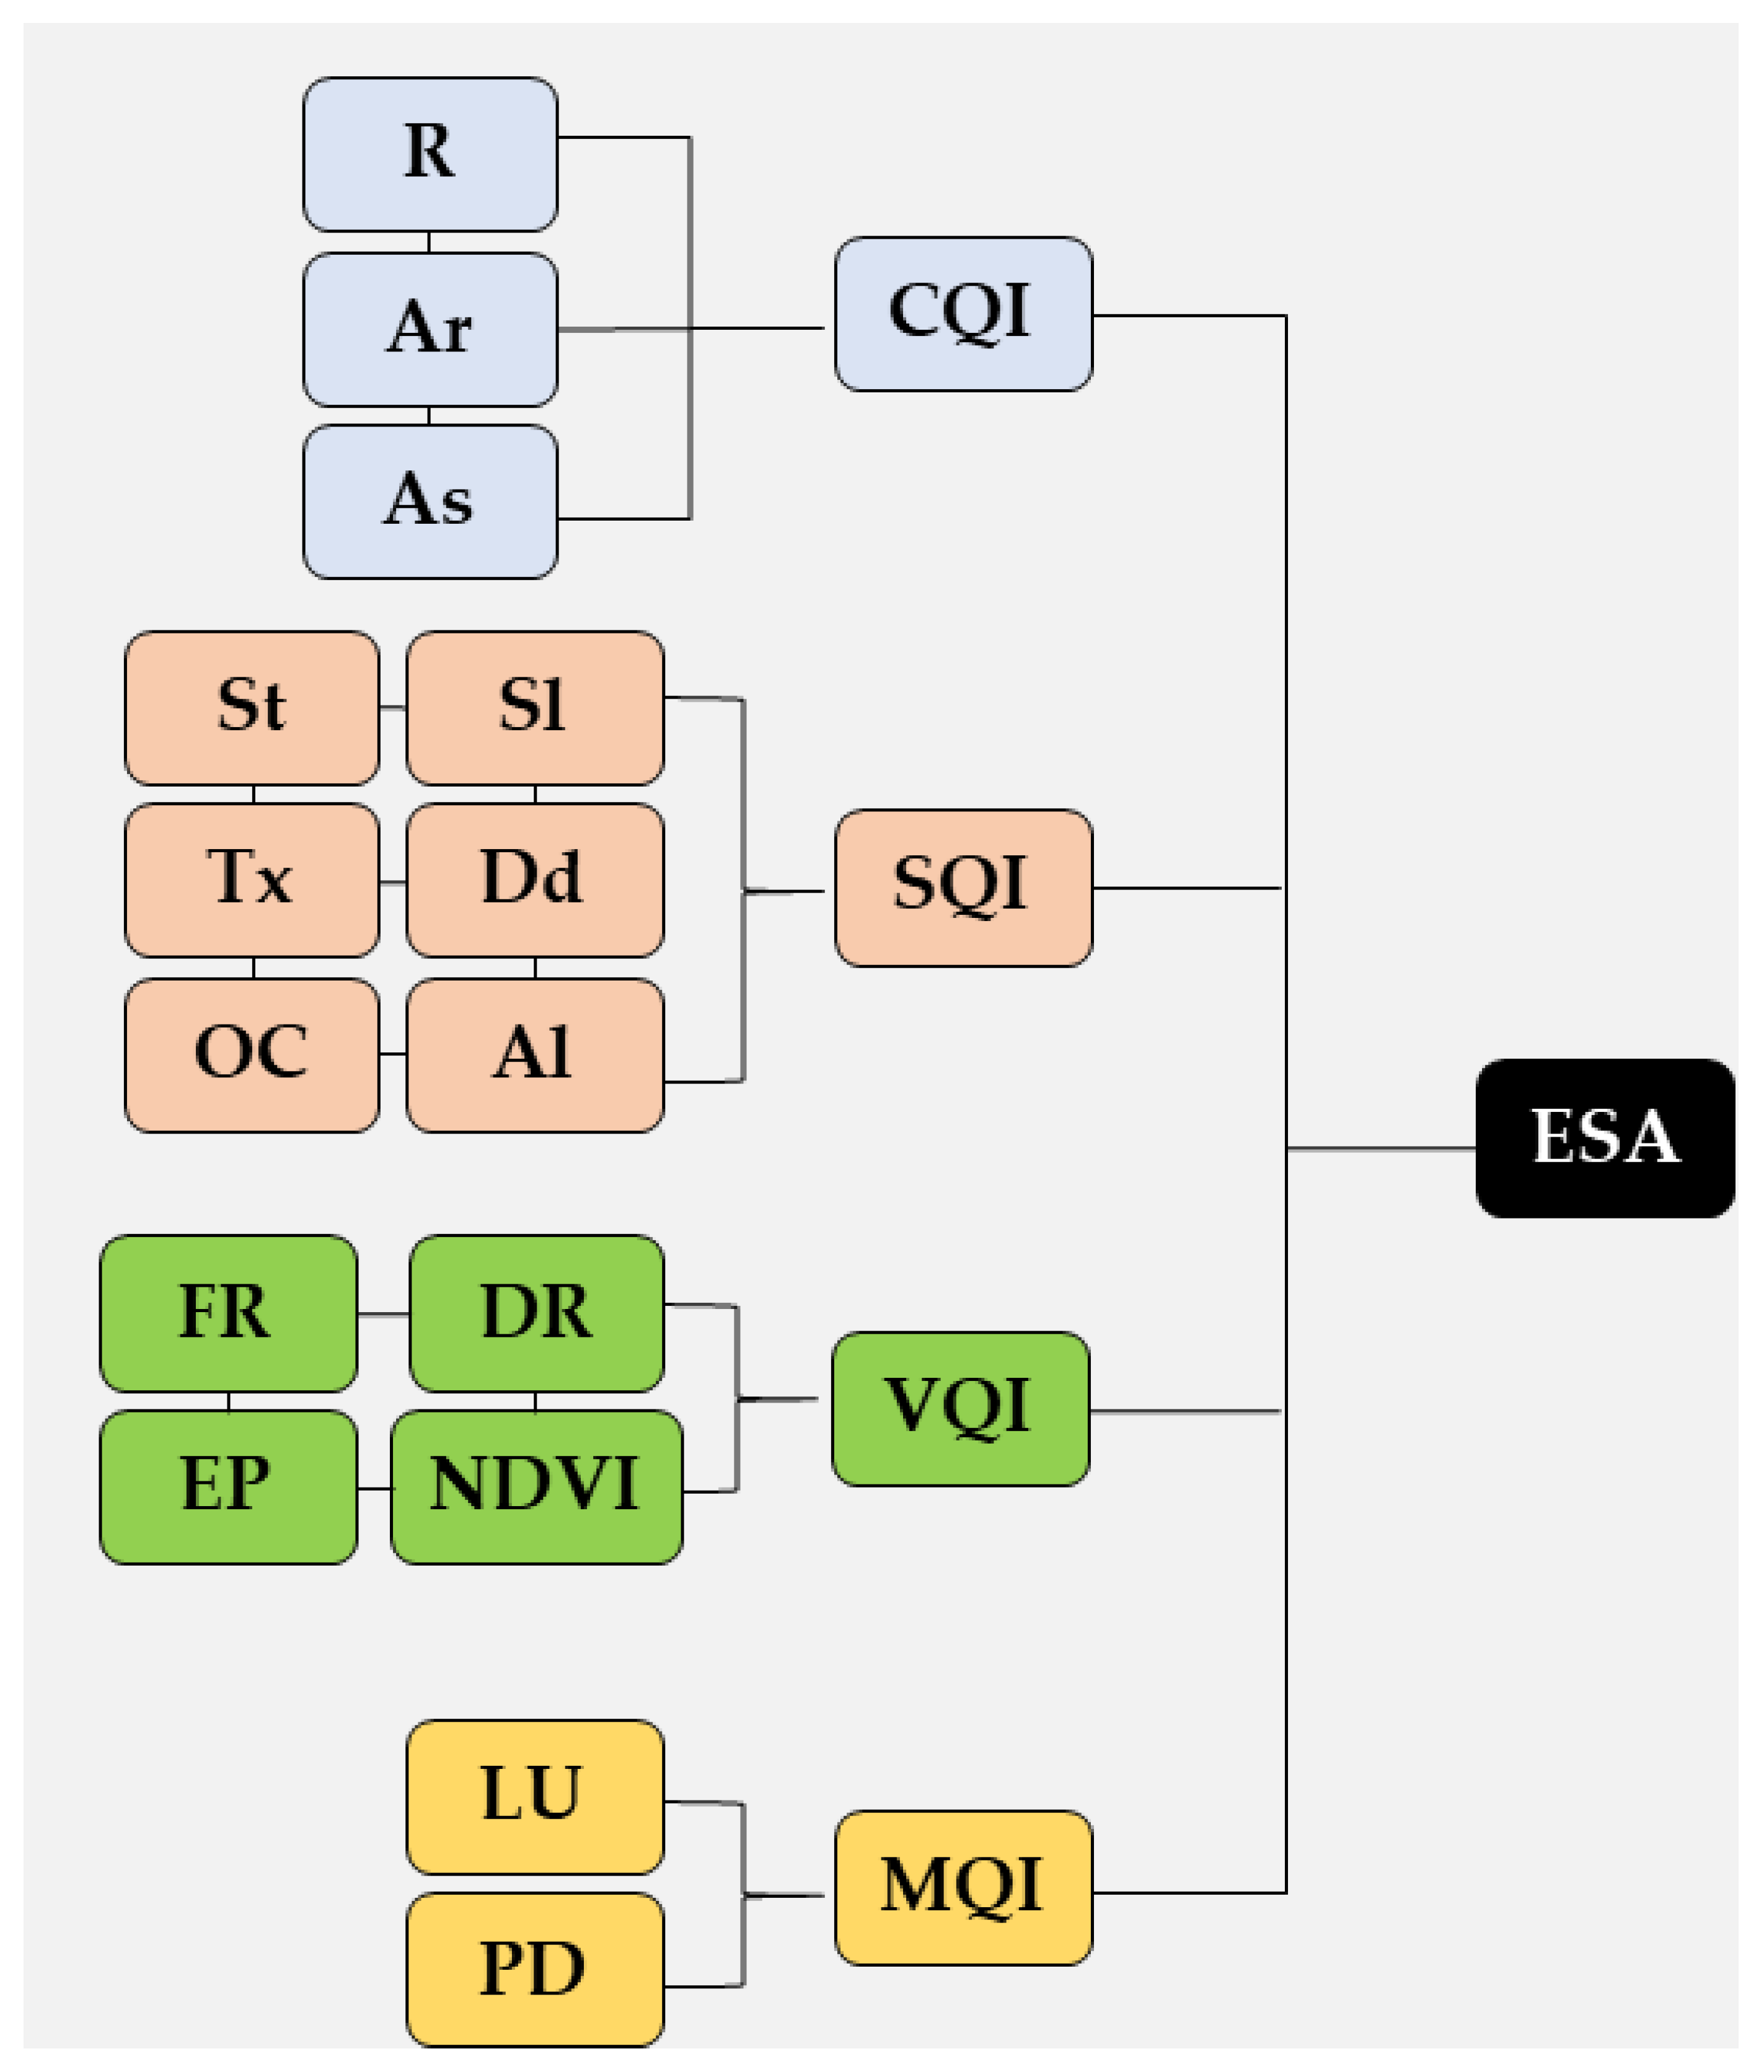
The Environmentally Sensitive Area (ESA) index was based on the modified framework of the MEDALUS model [
19], which uses four quality indices (QI): climate quality index (CQI), soil quality index (SQI), vegetation quality index (VQI), and management quality index (MQI). The framework has variations from that of the original method, such as the addition of information on Soil Carbon Content and Normalized Difference Vegetation Index (NDVI) (
Table 1).
Driving factors of the desertification process were classified according to scores ranging from 1 (least sensitive to desertification) to 2 (most sensitive to desertification) for the determination of quality indices (QIs); values between 1 and 2 indicate intermediate susceptibility. Thus, obtaining the ESAs took place in two stages: in the first stage, the QIs were obtained using the geometric mean of the variables that compose the indices using Equations (1) and (2) [
19].
where: n = number of variables; x = quality indices (CQI, SQI, VQI, and MQI); iej = row and column of a pixel of the used rasters, respectively.
In the second stage, the previously obtained QIs were used to calculate the ESA:
where: i and j = is the row and column, respectively, of a pixel of the rasters.
Thus, ESAs obtained from the listed QIs were classified into eight desertification sensitivity classes [
24]: unaffected (N), potentially affected (P), fragile (F1, F2, F3), and critical (C1, C2 and C3) (
Table 2).
2.3. Quality Scores
The respective QIs were obtained using digital databases in raster format. While some of these databases were already available in the GEE catalog, those not available on the platform were acquired and reclassified according to the weights (
Table 1) established in the methodology. Subsequently, they were uploaded to the GEE platform for the creation of the ESAs map (
Figure 2).
CQI was determined using the variables rainfall (R), aridity (Ar), and basin orientation (As), based on the GEE catalog databases. The mean annual total precipitation information (mm) was derived from the TerraClimate global dataset with a spatial resolution of approximately 4 km [
36]. Aridity was assessed using the UNESCO aridity index [
37], which is the ratio between precipitation (mm) and potential evapotranspiration (mm). The data on potential evapotranspiration for the period 2010 to 2019, essential for obtaining Ar, was sourced from the Terra Net Evapotranspiration digital database. This database utilizes MODIS satellite images, which have a spatial resolution of 500 m and a temporal resolution of 8 days, provided by the Land Processes Distributed Active Archive Center (LPDAAC). The orientation of the basin was determined using SRTM images from the hole-filled SRTM for the globe, version 4, with a spatial resolution of 90 m.
SQI was derived from several variables, including soil type (St), basin slope (Sl), soil texture (Tx), drainage classes (Dd), organic carbon content (OC), and albedo (Al). The basin slope was determined using the previously cited SRTM data. Details on soil texture, drainage classes and organic carbon content were sourced from the Harmonized World Soil Database, which has a spatial resolution of 1 km [
38]. After reclassification based on the predetermined weights, this information was uploaded to the GEE platform. The surface albedo data was acquired from an annual mosaic created for the year 2019, composed with pre-processed images from the Sentinel-2 (S2). These images have a spatial resolution of 10 m and a temporal resolution of 10 days. The albedo was calculated from the S2 images using coefficients defined in an approach proposed by [
39].
VQI is derived from several sub-indices fire risk (FR), drought resistance capacity (DR), erosion protection capacity (EP) and the NDVI. The FR, DR and EP variables were sourced by reclassifying (
Table 1) an annual land use mosaic made available by the Mapbiomas project, which boasts a spatial resolution of 30 m [
27], from the year 2019. This image, available on GEE, was subsequently cropped and reclassified according to the parameters established for each variable that composes the VQI. The NDVI for the study area was calculated using the mosaic of S2 images using the following equation:
where IR is the infrared surface reflectance on band eight; RED is the red surface reflectance on band four of the S2 satellites.
MQI was composed of the variables intensity of land use (LU) and population density (PD) of the municipalities within the study basin. The land use intensity data were sourced from the land cover classification mosaic, with scores designated to each class as outlined in
Table 1. The PD variable was derived from the ratio of a municipality’s population to its area in km
2. Given that the most recent population census in Brazil took place in 2010, it was necessary to use the data for the projected 2020 population.
The indicators employed in this study were selected based on two primary criteria: (i) the significance and relevance of each indicator to the study area; for example, due to the region’s semi-arid climate, indicators directly associated with the area’s rainfall dynamics were given priority; (ii) emphasis was placed on indicators for which consistent and reliable data were readily available. This not only ensured the robustness of our findings but was also imperative due to the limited research available on the basin dynamics of this region. Given the paucity of studies concerning the climate characteristics of the basin in this region, it was essential to adjust the parameter values sourced from other research: R [
19,
25], Ar [
26], As [
18], St [
26,
40], Sl [
19], Tx [
19], Dd [
25], OC [
35], Al [
36], FR [
19,
29], DR [
19,
25], EP [
19,
25], NDVI [
38], LU [
19,
25], and PD [
25].
The maps based on the Environmentally Critical Factors (ECF) index were created to complement the ESA map for the East Atlantic Basin. The composition of the ECF index was performed with the following equation [
25]:
Pixels with values below the critical threshold (C2) of 1.425 were excluded from the processing. Thus, the composition of the ECF index was made from counting the number of variables that exceeded the critical value of 1.425 for each pixel.
2.4. Statistical Analysis
Principal Component Analysis (PCA) was used on the matrix of variables to evaluate the relationship between the component variables of the produced ESAs. The four QIs and the ESA were used as supplementary parameters. The averages of the 20 variables (15 factors, Qis, and ESA) were obtained for each of the 541 municipalities located within the limits of the basin’s area, composing of 10,820 observations. The PCA was performed using the R software.
3. Results
3.1. Quality Scores
The maps, generated using Equation (1) for the creation of QIs, are presented in
Figure 3. Each raster contains pixel values ranging from 1 to 2. A higher value for a particular index indicates a greater contribution to the basin’s sensitivity to desertification.
Upon closer inspection of
Figure 3, distinct spatial patterns emerge in the QIs, highlighting region-specific triggers for heightened sensitivity, particularly in the northern regions. From the CQI map, the existing climatic gradient within the basin becomes apparent, revealing potential micro-climatic zones.
The western and northern parts of the basin are characterized by a more arid climate. However, this area displays a notable presence of arboreal vegetation and less intensive land use, as suggested by VQI and MQI. Despite the considerable diversity in soil quality across the study area, the northwest side appears to be of lesser quality, as indicated by the SQI. Some regions also show high vegetation quality even with a low MQI.
The spatial distribution of the quality indices (
Figure 3) depicts a gradient of sensitivity from the southern to the northern parts of the basin. This pattern hints at specific inherent environmental or geomorphic characteristics influencing the desertification process.
3.2. Environmentally Sensitive Area (ESA)
Using the previously generated QIs and applying Equation (2), we produced an ESAs map (
Figure 4). The ESAs represent the geometric mean of the four QIs derived in the initial phase of the study.
In analyzing the ESA map, areas in the north and central-west regions of the study area exhibit greater vulnerability to desertification. Conversely, areas located closer to the coastal zone and to the southwest of the basin were less susceptible. Only 5.0% of the basin area (
Table 3) can be classified in the “Not affected” category (N), with emphasis on areas located in the region further to the coast and southwest of the basin. It is also worth mentioning when examining the ESA map that it is evident that the central regions are characterized as transition zones between low and high sensitivity areas.
The areas included in the “Potentially affected” (P) class comprise about 10.1% of the total area of the basin and are located, as well as the N class, in the coastal and southern regions. The three levels corresponding to the “Fragile” (F) class have a relatively uniform spatial distribution throughout the basin, occupying around 49.3% of the entire area. In general, subclasses F1 and F2 share similar spatial distribution to classes N and P. In contrast, subclass F3 is predominant in the northern and central portion of the study area, which aligns more closely with the “Critical” class (C). Class C corresponds to a portion of 35.7% of the basin and, as previously mentioned, the areas included in this classification (C1, C2, C3) are located to the north and center of the area under study. The distribution of different desertification susceptibility classes, as shown in
Table 3, highlights a predominant presence of the ‘Fragile’ and ‘Critical’ classes, covering nearly 85% of the basin, indicating a significant portion of the basin requires management intervention.
In the north of the basin, when analyzing areas characterized by high sensitivity to desertification, the presence of low-quality soils and high rates of aridity are predominant factors. A joint analysis of the ECF index (
Figure 5) and ESA enhances our understanding of each model component’s contribution to the desertification process, pinpointing areas where multiple environmental stresses converge. This analysis highlights that even certain areas with identical ESAs can exhibit variables that respond differently to the threat of desertification [
25]. When analyzing the ECF maps, it becomes evident that variables linked to the region’s climate and soil are dominant determinants of sensitivity to desertification in the East Atlantic Basin, underscoring the emergence of both soil and climate factors as pivotal ECFs. Moreover, the analysis reveals potential regional clusters of heightened sensitivity, suggesting specific zones with advanced desertification vulnerability.
The results from the PCA (
Table 4 and
Figure 6) provided a more detailed evaluation of the contributions from each edaphoclimatic and anthropic variable utilized in creating the ESAs maps for the East Atlantic Basin. This analysis paves the way for refining the model in future research.
The PCA results identify three principal components that collectively account for 61.31% of the total variance. This considerable percentage suggests that these components capture much of the data’s variability, providing key insights into the desertification dynamics of the region. Principal component 1 (PC1), which explains 29.65% of the variance, is associated with variables from VQI, including Fire Risk, Resistance to Drought, and Resistance to Erosion, as well as MQI’s Land Use Intensity. PC1 was also associated with albedo, which is not usually a primary factor in such analyses and showed a significant correlation with ESAs in our study, indicating its under-explored potential in desertification assessments, although it did not show a high correlation. Principal component 2 (PC2), which accounts for 18.92% of the variance, correlated prominently with climatic variables from the CQI, namely Rainfall and Aridity, and had an association with the NDVI. Lastly, PC3, responsible for 12.75%, was directly tied to the SQI’s component variables: Soil Texture, Drainage Classes, and Organic Carbon Content.
By analyzing the results in
Figure 6, we can have a better understanding of the relationship between the selected variables, QIs, and ESAs, showing that NDVI, albedo, and VQI are positively correlated with ESAs.
4. Discussion
Analyzing satellite images has often been hindered by limited access to high computing power. The challenge is particularly pronounced in land desertification assessments given the large amount of data involved in the model creation and assessment, such as the MEDALUS. However, our results demonstrate the feasibility of assessing desertification sensitivity in extensive areas, such as the East Atlantic Basin.
4.1. Quality Indices (QIs)
The CQI exhibits a relatively well-defined spatial distribution. Specifically, regions to the east of the basin, characterized by having lower altitudes and proximity to the coastal region, are recognized as areas of better climate quality. This characteristic is often attributed to the substantial rainfall in the region, which can exceed 2000 mm in total per year [
34]. However, regions close to Chapada Diamantina, in the state of Bahia, are an exception to this spatial distribution. These areas, especially those near prominent conservation units like the Chapada Diamantina National Park and the Marimbus/Iraquara Environmental Protection Area, exhibit high CQIs. The presence of fauna and flora conservation areas works as a mechanism for maintaining and conserving environmental resources, with a particular emphasis on water resources.
From a climatic perspective, the areas located to the west and north of the basin stand out as the most sensitive. These drier regions have a semi-arid climate, with the annual aridity index reaching a value of 0.2 and are distributed across northeastern Agreste and Sertão [
26]. These areas are notably associated with low annual average rainfall (around 600 mm) and higher altitudes in comparison to the broader East Atlantic Basin, consequently being exposed to a greater incidence of solar energy [
29].
The vegetation cover within the study displays a diverse spatial distribution, predominantly consisting of pastures, agricultural lands, and forests. Regarding the VQI, one can notice the occurrence of patches or zones of high environmental sensitivity stretching from the northernmost to the southernmost parts of the basin. These patches correspond to areas with arid characteristics and minimal rainfall, such as northern Minas Gerais, western Sergipe, south-central and northern Bahia. These regions also host significant agricultural activities, notably horticulture and cattle raising, which have been expanding in recent decades [
26].
With a pattern similar to that observed for CQI, nearly the entire coastal region of the basin, located within the Atlantic Forest biome, shows high vegetation quality, except in densely urbanized and populated areas. Across the entire eastern side of the basin, agricultural and forestry activities are predominant. Forestry, in particular, serves as a primary economic driver in this region, largely due to eucalyptus plantations and the pulp and paper industry. Therefore, the presence of vigorous vegetation cover, whether cultivated or native, tends to protect the soil against erosion and offer greater resistance to water scarcity when compared to areas with less healthy vegetation cover [
18,
41].
Based on the characteristics used to construct the SQI, most of the basin’s soils range from medium to good quality. The soils generally have good drainage and texture classes. Additionally, a significant portion of the area has low albedo values (<0.20), indicating a minimal bare surface presence. The albedo is indicative of the presence of the forest cover removal process in semi-arid regions; high reflectance values might hint at the presence of environmental degradation and increased sensitivity to desertification, especially in regions with drier climate regimes [
42]. The areas in the basin with the lowest SQI are located in regions that have sandy soils (S), which are, by nature, highly vulnerable to the erosion process and have a low water retention capacity [
20]. These lower-quality areas are found in the northeast, northwest, and south-central portions of the East Atlantic Basin. Compared to the other quality indices, SQI has low temporal variability, especially the variables St, Sl, Tx, and Dd, which take a considerable period to change their characteristics. Thus, when establishing a continuous desertification monitoring program using cloud processing applications supported by edaphoclimatic variables, the soil parameters require only punctual updates in their configurations.
The MQI of the East Atlantic Basin shows, in the western portion, the areas with lower environmental susceptibilities. These areas, located further inland on the continent, are characterized by having low population density rates (<100 inhabitants/km
2). The western areas of the basin also exhibit low intensity of land use, particularly concerning grazing, suggesting a tendency to maintain natural vegetation cover, especially the savanna forest formation [
26]. Additionally, these regions have experienced minimal soil disturbance, although this trend has been shifting in recent years, primarily for the expansion of pastures [
43].
Municipalities located closer to the coastal zone of the basin have historically shown higher population densities (>100 inhabitants/km
2). The high rainfall that occurs in most of these regions makes them suitable for the development of rural activities, as in the extreme south of Bahia [
26].
4.2. Environmentally Sensitive Areas (ESAs)
Overall, in the East Atlantic Basin, sensitivity to desertification is closely associated with the distribution of rainfall and the presence of vigorous vegetation. A considerable portion of the western face of the basin, near the protection areas in Chapada Diamantina, shows reduced susceptibility to desertification. This indicates that such areas contribute to the mitigation of impacts and desertification expansion on these ecosystems. In contrast, areas to the north of the basin, which are characterized by high sensitivity to desertification, have predominantly low-quality soils and high rates of aridity. Regions with high potential evapotranspiration rates and low precipitation rates tend to be more susceptible to degradation from desertification [
44,
45].
Both VQI and MQI jointly contributed to the definition of levels of sensitivity to desertification. This relationship is likely due to the Land Use variable being derived from the basin’s vegetation classification. Conversely, SQI and CQI shaped the basin’s environmental sensitivity independently, without a synergistic effect with the other quality indices. These findings diverge from other studies, in which the CQI and VQI had a correlated influence on the desertification classifications while the MQI operated separately [
40]. Nevertheless, in both scenarios, the SQI had an autonomous contribution compared to the other indices.
Using the modified MEDALUS model framework, we effectively identified areas within the East Atlantic Basin that are vulnerable to desertification. The model offers valuable insights for shaping public policies and measures against the environmental degradation impacts resulting from desertification. The creation of online and universally accessible tools for monitoring and assessment of desertification is necessary to help mitigate the impacts of this phenomenon in regions with few economic resources. Hence, facilitated access to geoprocessing technologies with high computational capacity for public institutions may significantly help and improve decision-making strategies. For methodological improvements, assessing and evaluating the contribution of additional socio-ecological factors in the emergence of environmental degradation processes due to desertification is crucial. Such enhancements can potentially be integrated into future iterations of the MEDALUS model [
25], contingent upon the development and dissemination of up-to-date databases regarding these parameters.
Spectral indices, such as the NDVI, are effective tools for monitoring and understanding environmental degradation due to desertification in arid regions. Conversely, it is possible to observe the existence of a negative correlation between slope and sensitivity to desertification. The slope plays a pivotal role in analyzing the existence of degradation and desertification processes in an area, primarily because it is instrumental in the onset of erosion processes [
19]. Just as with NDVI, slope can be used to monitor areas under environmental pressure and degradation processes [
42]. The identification of the existence of a correlation between ESA, slope, and NDVI variables is important given the potential of using these factors as responses to desertification-induced environmental degradation [
46].
When assessing susceptibility to desertification in Mongolia in different years, a similar trend has been observed between ESA and NDVI over time. This suggests that areas with low NDVI values may signify regions in critical situations of desertification [
22]. Under conditions of low information availability, knowing the most important variables can facilitate the construction of environmental sensitivity models, treating these factors as independent variables [
47,
48,
49]. However, it is important to mention that the monitoring of the desertification process using the NDVI does not allow obtaining information about the causes and factors influencing this phenomenon, thereby constraining the planning and management of specific regions.
Compared to traditional GIS software, using cloud GEE offers distinct advantages, especially in terms of processing speed and capacity [
28,
30,
31]. Further, GEE also stands out because of the high-quality digital databases already available in its public catalog, significantly streamlining the workflow. The development of an environmental monitoring model related to desertification in a cloud processing system allows the creation and analysis of historical series from smaller time intervals, given its fewer constraints on processing and storage capacity.
A considerable portion of the East Atlantic Basin showed susceptibility to desertification, requiring greater attention from public entities and civil society to mitigate the possible impacts of this phenomenon on the local communities. The regions further north and west of the basin, spanning areas in the states of Bahia and Sergipe, are in a more critical state. Thus, it is vital to prioritize the establishment of public policies interventions in municipalities within these areas. Given the significance of vegetation-related parameters for the ESA, implementing measures to promote, recover, and conserve forested areas, combined with sustainable soil management practices, can help reduce the area’s vulnerability to degradation.
5. Conclusions
In the present study, we have used the Google Earth Engine platform to carry out the first land desertification assessment of the East Atlantic Basin, Brazil. The study underscores the possibility of using an open-access cloud computing platform to perform relevant analysis of an extensive area, yielding key insights. For instance, (i) approximately 36% of the total area of the East Atlantic Basin exhibits a critical state of sensitivity to desertification, with areas located in the north and midwest portions exhibiting the highest levels of sensitivity to desertification. Conversely, coastal regions had the lowest levels of environmental vulnerability across the basin; (ii) the NDVI, slope, and VQI emerged as the edaphoclimatic variables most closely correlated with the East Atlantic Basin’s ESA Index; (iii) the analysis of the Environmentally Critical Factors Index, in parallel with the Environmentally Sensitive Index, offers valuable insights for understanding the importance of each variable in the MEDALUS model’s composition.
The study sets the stage for future research using cloud computing platforms to best describe, monitor, and assess land degradation not only in Brazil but also in other global regions where such studies have historically been hindered due to computational limitations. Furthermore, we believe that incorporating ground-based measurements could enhance the analysis, addressing what was a primary limitation of this study.


 ,
, 


