Abstract
The variation in the urban spatial structure (USS) has profound impacts on carbon emissions. Studying the relationship between the two can provide guidance for carbon neutrality strategies and the construction of low-carbon cities in China. However, there is currently a lack of comparative research on the different regions within a province. In this paper, the spatiotemporal evolution of the USS and carbon emissions, at five-year intervals from 2000 to 2020, is investigated in 21 prefecture-level cities in Guangdong Province, China, and the overall relationship of the USS to carbon emissions and their spatiotemporal variations are analyzed by using a two-way fixed-effects model and a geographically and temporally weighted regression model, respectively. The results show that, first, over the past twenty years, the scale of cities has continued to expand, with increasing continuity and aggregation in the built-up areas, while the complexity and fragmentation of their shapes have gradually decreased. Second, the gap in carbon emissions between the Pearl River Delta and other regions in Guangdong shows a trend of first decreasing and then increasing, with high values concentrated in the Pearl River Delta region and the city of Shantou in the east. Third, compared to socio-economic factors, the USS has a more direct and pronounced impact on carbon emissions. Urban expansion and the increased complexity of land patches promote carbon emissions, whereas improving urban spatial continuity and compactness can reduce carbon emissions. Fourth, the dominant spatial structure indicators of carbon emissions differ among the regions of eastern, western, and northern Guangdong and the Pearl River Delta. This study proposes spatial optimization strategies for the low-carbon development of cities in Guangdong Province, providing a new perspective for integrating urban layout and emission reduction policies.
1. Introduction
In recent years, there has been an increasingly clear consensus on climate change [1]. In 2015, representatives from nearly 200 countries and regions signed the Paris Agreement, unanimously agreeing to limit the global average temperature increase to below 2 °C above pre-industrial levels, and striving to limit it to 1.5 °C [2]. It is estimated that cities, occupying only 2% of the global land area, are responsible for over 70% of anthropogenic carbon emissions [3]. As a representative of developing countries, China’s urban carbon emissions account for over 80% of the country’s total emissions [4]. The conflict between China’s rapid urbanization and the constraints on carbon emissions for high-quality development poses a significant challenge. In response, the Chinese government has set strategic goals for reaching peak carbon emissions by 2030 and achieving carbon neutrality by 2060. In this complex context, sustainability scientists, urban planning experts, and policymakers must develop effective measures for reducing CO2 emissions and mitigating climate change. Apart from the traditional emission reduction measures which rely on technology and policy solutions, there has been a growing recognition of the relationship between the urban spatial structure (USS) and urban carbon emissions, leading to an upsurge in research exploring the direct link between the two [5,6,7].
USS refers to the layout of urban components and primarily examines the spatial distribution characteristics and patterns of activities (e.g., population and industry, respectively) within urban areas [8]. Landscape indicators are a typical and widely used quantitative method in USS research, encompassing land-use patterns and urban form [9,10]. Numerous studies have demonstrated the significant role of structural elements such as urban scale, shape, and morphology in carbon emissions [11,12,13]. For example, Albert et al. (2015) found through their study on European cities that a higher density of urban patches is conducive to carbon reduction [14]. Yi et al. (2017) analyzed the spatiotemporal evolution of the impact of spatial forms on carbon emissions in 108 cities in China using a panel data model, and identified compact urban patterns as a key factor for constructing low-carbon cities [15]. Sarkodie et al. (2020) revealed that urban expansion leads to a reduction in urban carbon sink space, increased energy consumption in daily life, and increased carbon emissions [16]. Some researchers have focused solely on the influence of socio-economic factors (e.g., total population, per capita GDP, technological progress, and industrial structure adjustments) on urban carbon emissions [17,18,19]. For example, Martínezzarzoso et al. (2007) suggested that climate change policies should consider the positive impact of population changes on CO2 emissions [20]. Zhou et al. (2016), in a study using a regional dynamic assessment model, found that promoting technological innovation through environmental regulations can suppress CO2 emissions and energy consumption [21]. Economic development and population changes are important indicators that are traditionally used to quantify urbanization as the key socio-economic variables in regional development. Urbanization has been shown to be related to carbon emission levels and efficiency [22,23]. Therefore, it is essential to integrate physical factors, such as the USS, with the socio-economic characteristics of cities to comprehensively explore the mechanisms influencing urban CO2 emissions.
On the other hand, no specific answer has been given as to what type of USS will minimize CO2 emissions. It is generally believed that a USS characterized by a higher density, a smaller scale, regular shapes, and compact and intensive development will result in lower carbon emissions [14,24,25,26]. However, some studies have found that the effects vary depending on the size and development level of the city. For example, Holden and Norland (2005) found that appropriately dispersed urban forms in the greater Oslo area were conducive to reducing household energy consumption, promoting decentralized transportation, and mitigating the urban heat island effect [27]. Shu et al. (2018) found that an increase in the degree of urban agglomeration had a positive impact on carbon emissions when they explored the effect of urban form on carbon emissions in the Yangtze River Delta urban agglomeration [28]. Similar conclusions were drawn by Lee et al. (2014) in their study of the 125 largest urbanized areas in the United States [29], suggesting that highly compact urban spatial structures of this kind have reached a state of excessive concentration. Han et al. (2020), focusing on Chinese prefecture-level cities, constructed an interaction term between spatial structure indices and population density. The empirical results showed that in low-density cities, a single-center structure was advantageous for reducing pollution concentration, whereas in high-density cities, a multi-center structure resulted in lower pollution concentration [30]. Zhu et al. (2022) further found that the effect of polycentricity on carbon emissions can be moderated by the level of urban economic development [31]. Overall, although studies have shown some regularities regarding the optimal USS under low-carbon constraints, different types of cities have different demands for low-carbon spatial development models [32]. However, most existing studies have focused on mega-cities or independent urban areas such as capital cities [7,33,34,35], neglecting large-scale provincial analyses and heterogeneous research on the carbon emission determinants of the cities within them. Research conclusions based on provincial divisions with urban clusters as the main units, which represent more advanced forms of urbanization, would be more helpful to decision makers when adjusting spatial strategic policies and to efficiently promoting carbon reduction [36].
This study selects Guangdong Province as the research area. As the largest provincial-level economy in China with a large population, Guangdong Province exhibits diverse characteristics in its four distinct regions, due to differences in natural resources, culture, and socio-economic development conditions. As one of the provinces with the most rapid economic development in China, Guangdong Province bears responsibility for sustainable development and must urgently explore emission reduction techniques for USS management. This paper utilizes urban-level panel data for Guangdong Province for five periods from 2000 to 2020 to evaluate the USS from various aspects (e.g., scale, morphology, and shape), and to reveal the spatiotemporal characteristics of the USS and carbon emissions. By employing various spatial econometric models, this paper assesses the overall impact of the regional spatial structure and socio-economic variables on carbon emissions, and further analyzes the temporal evolution of this relationship with internal city differentiation. The empirical results of this paper show that the USS and socio-economic indicators that influence the carbon emissions of the four major regions of Guangdong Province are not consistent. This enriches the research on the mechanisms underlying the impact of the USS on carbon emissions. The multidimensional indicators of the USS can be combined with the controlling indicators in territorial spatial planning and within urban development boundaries to provide targeted optimization strategies for the low-carbon development of cities and urban clusters, thereby promoting overall regional sustainability.
2. Data Sources and Methods
2.1. Study Area
This paper selects Guangdong Province in China as the research area, with prefecture-level cities as the basic research units. Guangdong Province is located in southern China, adjacent to the Hong Kong and Macau Special Administrative Regions. It has a total area of 179,725 km2 and a population of 126.568 million at the end of 2022, with an urbanization rate of 74.79%. The province is currently divided into 21 prefecture-level cities and can be categorized into four regions [17] based on the different natural and economic conditions: the Pearl River Delta, northern Guangdong, eastern Guangdong, and western Guangdong, as shown in Figure 1. The Pearl River Delta region includes Guangzhou, Shenzhen, Dongguan, Foshan, Zhuhai, Jiangmen, Zhaoqing, Zhongshan, and Huizhou. This region is economically and culturally prosperous, and is one of the core areas of Guangdong Province. Northern Guangdong consists of five cities: Qingyuan, Yunfu, Shaoguan, Meizhou, and Heyuan. Eastern Guangdong includes four cities: Shantou, Shanwei, Chaozhou, and Jieyang. Western Guangdong includes three cities: Zhanjiang, Yangjiang, and Maoming.

Figure 1.
Distribution of the four administrative regions of Guangdong Province.
Since the implementation of the reform and opening-up policy in 1978, Guangdong Province has become one of the most developed provinces in China and a gateway for foreign trade. However, more than 40 years of rapid industrialization and urbanization driven by policy orientation have also led to a series of issues, including increased energy demand, intensified greenhouse effects, and regional development imbalances. These trends pose challenges for the future development of Guangdong Province [37]. Therefore, exploring the optimized mode of urban spatial structure under low-carbon constraints holds significant value for environmental improvement, sustainable urban development, and regional coordinated development in Guangdong Province.
2.2. Data Sources
Data for five periods (2000, 2005, 2010, 2015, and 2020) were collected. (1) The Spatial Urban Built-up Area Distribution Dataset (SUBAD-China) [38,39] was used as the primary remote sensing data source for calculating the USS indicators. This dataset is generated from multi-source remote sensing data, including Landsat and Sentinel image time series, with a spatial resolution of 10 m. The overall accuracy (OA) of the impervious surface data for each year exceeds 90%, ensuring high extraction accuracy. (2) Carbon emissions data were obtained from the China Emission Accounts and Datasets (CEADs, https://www.ceads.net.cn/) (accessed on 14 March 2023). This database is known for its multi-scale, comprehensive, and high-precision features, providing support for numerous empirical studies. Due to administrative boundary changes, this study adopted the county-level CO2 emissions inventory for China, compiled by Chen (2020) [40], as the initial data. The inventory study utilized a particle swarm optimization–backpropagation (PSO-BP) algorithm to harmonize the scale of the DMSP/OLS and NPP/VIIRS satellite images, and to estimate the CO2 emissions for the 2735 counties in China. (3) Indicators such as population, wealth, and technological level were sourced from the China City Statistical Yearbook (2000–2020), with data covering the administrative areas of each city.
2.3. Method
2.3.1. Quantification of Urban Spatial Structure
To comprehensively and accurately describe the characteristics of the USS, this study selected indicators based on existing research [7,41,42]. The measurable elements of the USS were initially categorized into four types: scale structure (representing the quantity and proportion of urban patches), shape structure (representing the density and aggregation of urban patches), morphological structure (representing the boundary shape of urban patches), and land-use structure (representing the land mix of urban patches). Although indicators related to land-use structure can be measured, they require high-quality data and are not suitable for the analysis of multiple samples, as in this study. Therefore, this study focused on the dimensions of scale structure, shape structure, and morphological structure, and utilized spatial measurement theory to select the appropriate indicators for analysis.
A multicollinearity test conducted using Stata 16 software revealed that the variance inflation factor exceeded 100 [43], indicating severe multicollinearity among the 12 variables. Through a Pearson coefficient analysis and multiple experimental trials, the highly correlated indicators (i.e., absolute value greater than 0.8) were eliminated, resulting in the final selection of six indicators, with two indicators retained for each feature dimension: total area (TA), largest patch index (LPI), mean perimeter-to-area ratio (PARA_MN), average shape index (SHAPE_MN), aggregation index (AI), and patch cohesion index (COHESION). The calculation methods for each indicator are presented in Table 1.

Table 1.
Final indicator system for urban spatial structure.
2.3.2. Spatiotemporal Characterization of Carbon Emissions
Based on the latest administrative division plan from 2022, this study aggregated the data from the county level to the prefecture level. For the missing individual data, the mean values were interpolated based on the neighboring years before and after to reduce the impact on the overall model fitting effect. This approach resulted in the CO2 emissions data for the urban districts in Guangdong Province at five-year intervals from 2000 to 2020. Building upon the analysis of the spatiotemporal distribution patterns of the CO2 emissions for each city, a further spatial autocorrelation analysis was conducted to characterize their spatial clustering characteristics.
The global Moran’s I index describes the degree of spatial autocorrelation between a spatial unit and its neighboring units within a certain range, measuring the average correlation among adjacent areas for an entire region [44]. The calculation formula for the global Moran’s I index is as follows (Equation (1)):
where n represents the number of spatial units, Wij represents the spatial weight value, yi and yj represent the attribute values of the i-th and j-th spatial units, respectively, and y represents the mean value of all the spatial unit attribute values. Moran’s I ranges from −1 to 1. Under certain significance conditions, when Moran’s I > 0, it indicates a positive spatial autocorrelation, and a larger value indicates a stronger positive spatial autocorrelation. When Moran’s I < 0, it indicates a negative spatial autocorrelation, and a smaller value indicates a stronger negative spatial autocorrelation. When Moran’s I = 0, it indicates that the spatial units are randomly distributed, indicating no spatial autocorrelation.
The local Moran’s I index can overcome the limitations of the global Moran’s I index, as it can identify spatial heterogeneity caused by spatial autocorrelation and determine the hotspots of attribute values for spatial objects [45,46]. A Moran scatterplot is one of the research methods used in local spatial autocorrelation analysis, as it is commonly employed to explore the instability of local spatial patterns. The four quadrants in the scatterplot correspond to four types of spatial relationship patterns between the spatial units and their neighboring units within a region. In this study, a Moran scatterplot analysis was conducted to examine the clustering and dispersion patterns of carbon emissions in the urban areas of Guangdong Province at the local spatial level. After constructing the spatial matrix in GeoDa, the data were imported into Stata 16 to generate the Moran scatterplots for the five-year intervals.
2.3.3. Relationship between Urban Spatial Structure and Carbon Emissions
- (1)
- Econometric models
Wang et al. (2022) argued that, compared to indicators such as population size, population density better represents the influence of population factors on carbon emissions in China’s urbanization process [47]. Therefore, this study selected population density (PopDen) as a proxy for the impact of population changes on urban carbon emissions. Many studies have used the per capita GDP (PGDP) as an economic wealth factor affecting carbon emissions [48,49]. This study also utilized this indicator. Carbon intensity (CI), which is defined as the ratio of regional carbon emissions to gross domestic product, is commonly used to reflect the influence of technological progress on carbon emissions [50,51]. This study selected CI as the measure of the technological level.
Before conducting the panel data regression, it was necessary to test the six explanatory variables representing the USS and the three control variables representing the socioeconomic factors determined earlier, to ensure the stability of the model and the credibility of the results. In addition, a natural logarithmic standardization was applied to all the variables, which aimed to reduce the influence of outliers in some of the variables and make the regression coefficients easier to interpret. The results of the F-test indicated that the F-statistic was 26.29 and p = 0.0000 < 0.05, which rejected the original hypothesis of choosing a mixed-effects model under the constraints, and favored the choice of a fixed-effects model. On the basis of choosing the fixed-effects model, it was necessary to consider whether there was a time effect. Since the time span of the study selected in this paper is long (2000–2020), it is possible that in addition to the variables that change with individuals, there are also variables that change over time. The original hypothesis of the joint significance test for time was that all the variable coefficients for time effects were zero, i.e., there was no individual time effect. The results of the test showed that the F-statistic was 3.7 and p = 0.0077 < 0.05, i.e., there was a time effect. Based on the above analysis, a two-way fixed-effects model was finally chosen as the regression model used in this study. The two-way fixed-effects model is a specific type of multiple linear regression model that estimates the effects of multiple independent variables on the dependent variables through the method of least squares. It is primarily used for panel data analysis, and controls for individual and time fixed effects [52]. This study aimed to quantitatively estimate the relationship between the USS and carbon dioxide emissions in Guangdong Province, so it was necessary to establish a carbon emission model with the following regression equation:
where represents the constant term, represent the regression coefficients of each explanatory variable, represent the regression coefficients of each control variable, I represents the city, t represents the year, represents the individual effect, represents the time effect, and is the random disturbance term.
- (2)
- Spatiotemporal heterogeneity analysis
Building upon the analysis of the overall relationship, and considering the long time span and significant development differences among the cities in the study area, this study further incorporates a geographically and temporally weighted regression (GTWR) model. By integrating the temporal and spatial information into the research model, this study examines the influence of the urban spatial structure on carbon emissions in the various cities of Guangdong Province from a spatiotemporal heterogeneity perspective. Moreover, the GTWR model can help to identify the key areas for optimizing low-carbon spatial structures.
The GTWR model is an effective analytical method for detecting the spatiotemporal non-stationarity characteristics of the panel data. It considers the spatial non-stationarity of the sample data and introduces time-specific parameters. Compared to the geographically weighted regression model, the GTWR model better handles the spatiotemporal relationship between the independent and dependent variables [53]. The basic equation of the GTWR model is shown in Equation (3):
where denotes the spatiotemporal coordinates of the i-th sample point; represent the longitude, latitude, and time, respectively; denotes the k-th independent variable of the i-th sample point; is the residuals; and denotes the regression constant term for the i-th sample point, which is estimated as shown in Equation (4):
where denotes the spatiotemporal weight matrix of i. The Gaussian function is chosen for the weight function, the bandwidth is set using an AICc optimization, and the spatiotemporal distance between samples i and j is computed as shown in Equation (5):
3. Results and Discussion
3.1. Spatiotemporal Characteristics of the Urban Spatial Structure
The spatiotemporal evolution of the USS in Guangdong Province from 2000 to 2020 is illustrated in Figure 2. Regarding the scale structure of the cities, the TA and its growth rate in the Pearl River Delta region are significantly higher than in the other three regions. In addition, the built-up area in the eastern region is slightly larger than that of the other two regions. As one of China’s most developed urban clusters, the economic growth in the Pearl River Delta region has led to the conversion of non-urban land into urban land to support the rapid urban development [17]. The changes in the LPI show an alternating upward trend in all the regions and reached a consistent level by 2020, indicating the good continuity and integrity of the urban patches in each region.

Figure 2.
Spatiotemporal evolution of USS zoning in Guangdong Province, 2000–2020. Total area (TA), largest patch index (LPI), mean perimeter-to-area ratio (PARA_MN), average shape index (SHAPE_MN), aggregation index (AI), and patch cohesion index (COHESION).
In terms of the shape structure of cities, there is a relatively small regional variation in the two indicators. The values and trends for PARA_MN are almost identical among all the regions, while those for SHAPE_MN also exhibit minimal differences. Overall, the built-up areas in the northern region have relatively complex shapes, whereas the shape indices of the built-up areas in the other three regions are quite similar.
Regarding the morphological structure of the cities, there are certain differences among the regions. The AI of the built-up areas in the Pearl River Delta and western regions are higher, whereas the eastern region shows significant growth. In contrast, the northern region exhibits relatively lower levels of spatial clustering, with a slight decline between 2015 and 2020. As for COHESION, the values in each region alternate upward and eventually converge, indicating a high connectivity among the built-up area patches in all the regions.
3.2. Spatiotemporal Characteristics of Carbon Emissions
From the spatial pattern perspective shown in Figure 3, it can be observed that the distribution of urban CO2 emissions exhibits a clear clustering phenomenon. During the study period, the high-carbon cities remained concentrated in the Pearl River Delta, particularly the cities of Guangzhou, Foshan, Dongguan, and Shenzhen. These four cities have been the leading economic powerhouses in Guangdong Province for many years, with a higher level of industrialization compared to the other regions, and they have attracted many manufacturing factories. Apart from the Pearl River Delta, there is little difference in the carbon emissions among the northern, eastern, and western regions, with only the city of Shantou showing higher carbon emissions, as it is predominantly an industrial city. From a temporal evolution perspective, Guangdong Province’s urban carbon emissions exhibit an alternating pattern. The difference in carbon emissions between the northern, eastern, and western regions and the Pearl River Delta region shows a decreasing trend followed by an increasing trend, indicating a significant imbalance in the spatial distribution of carbon emissions.
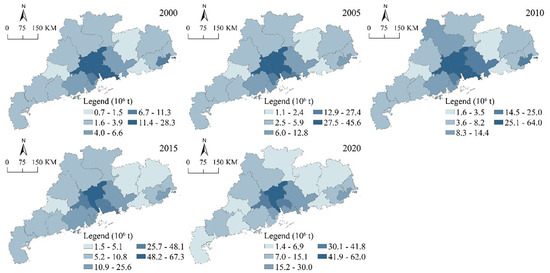
Figure 3.
Spatial distribution of urban CO2 emissions in Guangdong Province.
As shown in Table 2, the global Moran’s I index for urban carbon emissions in Guangdong Province from 2000 to 2020 is positive and statistically significant at the 99% confidence level, indicating a significant positive spatial correlation. Moreover, the Moran’s I index shows an initial increase followed by a decrease over time, with the overall fluctuation within 0.05, indicating that the spatial clustering of carbon emissions in the study area remains relatively stable, and the pattern of spatial clustering is relatively fixed.
Table 2.
Global Moran’s I Index of urban carbon emissions in Guangdong Province.
This study employed Moran scatterplots to analyze the local spatial aggregation and dispersion of urban carbon emissions in Guangdong Province, and the results are shown in Figure 4. Overall, from 2000 to 2020, the local Moran’s I analysis reveals three main types of spatial patterns for urban carbon emissions: high-high (HH) clustering, low-high (LH) clustering, and low-low (LL) clustering. The spatial patterns of each city remain relatively stable with weak temporal variation. The cities exhibiting HH clustering and LH clustering are mainly concentrated in or near the Pearl River Delta, indicating either high carbon emissions themselves or proximity to cities with high carbon emissions. The cities exhibiting an LL clustering pattern are mainly distributed in the northern, eastern, and western regions, which are farther from the Pearl River Delta. Shantou is the only city exhibiting an HL clustering pattern, with a large and continuously increasing carbon emissions base, making this effect more pronounced over time.
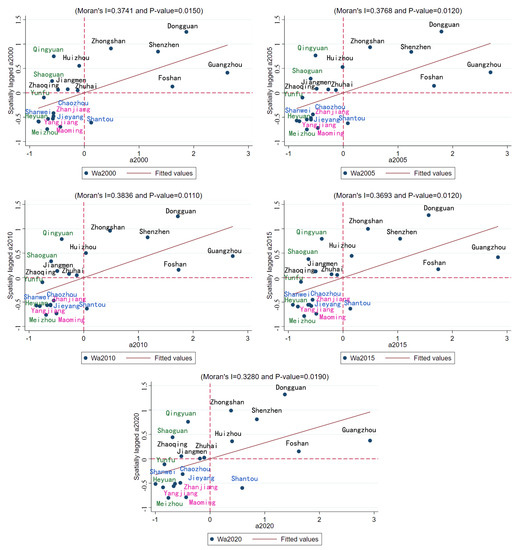
Figure 4.
Moran scatter plot of urban carbon emissions in Guangdong Province, 2000–2020.
3.3. Estimation Results for the Panel Model
The analysis of the two-way fixed-effects model on the research data is presented in Table 3. In terms of the urban scale structure, both the TA and LPI have a significant impact on carbon emissions, but their effects are opposite (coef = 0.322, −0.047). The TA has a positive effect on carbon emissions, indicating that for the overall urban areas in Guangdong Province, expanding the size of the urban built-up areas will lead to more CO2 emissions. This suggests that the current urban development of Guangdong Province has not reached the turning point of the Environmental Kuznets Curve (EKC), and is still in the “high growth, high pollution” stage of the inverted U-shaped curve [54]. On the other hand, the LPI has a negative effect on carbon emissions, indicating that increasing the continuity and integrity of the urban land patches can effectively reduce carbon emissions. Reducing the fragmentation of the urban patches promotes the integrity and continuity of urban development, such as improving transportation accessibility and commuting efficiency, thereby reducing energy consumption at the transportation level.
Table 3.
Regression results of variables with CO2 emission.
In terms of the urban shape structure, SHAPE_MN has a significant positive effect on carbon emissions (coef = 0.427). The shape of the built-up patches can affect carbon emissions in two ways: through building construction and transportation commuting. On the one hand, irregular patches make it difficult to efficiently lay energy networks for heat, water, gas, and electricity in buildings. The transportation of curved and distant pipelines leads to increased carbon emissions from residential and industrial activities. On the other hand, the complex boundaries of urban patches increase commuting time and distance, resulting in increased CO2 emissions.
In terms of the urban morphological structure, the AI has a highly significant negative effect on carbon emissions (coef = −3.074). Compact cities can reduce commuting distances, thereby reducing carbon emissions by reducing the use of transportation vehicles. They can also increase land-use intensity and factor agglomeration, thereby improving energy efficiency in daily life and production. However, it is important to note that many studies have shown that the impact of urban aggregation on carbon emissions varies; different regions and cities at different stages of development have produced different results.
All three socio-economic factors have a significant impact on carbon emissions. An increase in the PopDen reduces carbon emissions (coef = −0.070). A high PopDen is conducive to the development of public transportation and promotes the sharing of facilities, which improves energy efficiency and reduces carbon emissions [55]. On the other hand, the PGDP has a positive impact on carbon emissions (coef = 0.079). Economic growth promotes urban industrialization, leading to an increased demand for fossil fuels and, consequently, higher carbon dioxide emissions. The CI data, representing technological advancement, indicate that the cities in Guangdong Province experienced rapid urbanization during the study period and have not reached the turning point of the EKC. Technological progress implies increased productivity and energy consumption, resulting in higher carbon emissions (coef = 0.059).
3.4. Results of Spatiotemporal Heterogeneity Analysis
Based on the results of the GTWR model, the significance and direction of the regression coefficients for each independent variable were calculated. The effects of the urban spatial structure indicators on carbon emissions exhibit temporal and spatial variations, as analyzed below.
In terms of the urban scale structure, the influence of the urban size on carbon emissions shows minimal temporal variation and displays a certain spatial heterogeneity (see Figure 5). The TA has a consistently positive impact on carbon emissions: the high-value region is concentrated in the cities of Zhongshan, Zhuhai, and Jiangmen in the western part of the Pearl River Delta and the eastern part of Guangdong Province, whereas the low-value region is concentrated in Shaoguan and Heyuan in the northern part of Guangdong Province. Overall, the spatial pattern experienced minimal changes during the study period. The LPI also has a consistently negative impact on carbon emissions. Specifically, the influence of the index gradually increases from the southwest to the northeast in Guangdong Province, with the high-value region concentrated in Shaoguan, Heyuan, and Meizhou in the northern part. The spatial pattern shows limited changes during the study period.
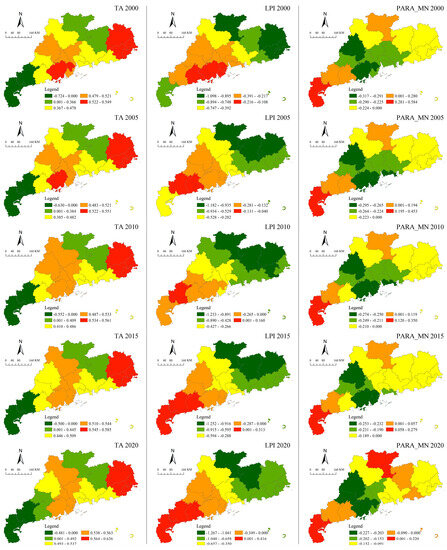
Figure 5.
Spatiotemporal distribution of regression coefficients based on the GTWR model. Variables: total area (TA), largest patch index (LPI), and mean perimeter-to-area ratio (PARA_MN).
The role of the urban shape structure on carbon emissions is influenced by certain spatial and temporal variations, and its evolution shows a certain pattern (Figure 5 and Figure 6). The influence of PARA_MN on carbon emissions is very stable, with all the significant results being negative. The high-value region is mainly concentrated in the Pearl River Delta, whereas the influence of this indicator on carbon emissions in the other three regions is weaker. The spatial variation in the influence of SHAPE_MN on carbon emissions is more pronounced, showing different effects in different cities. In the western region of Guangdong Province and the cities of Huizhou and Shanwei, the index shows a stable positive relationship with carbon emissions, whereas its influence on Heyuan fluctuates over time. The relationship between the indicator and carbon emissions is negative in the remaining cities.
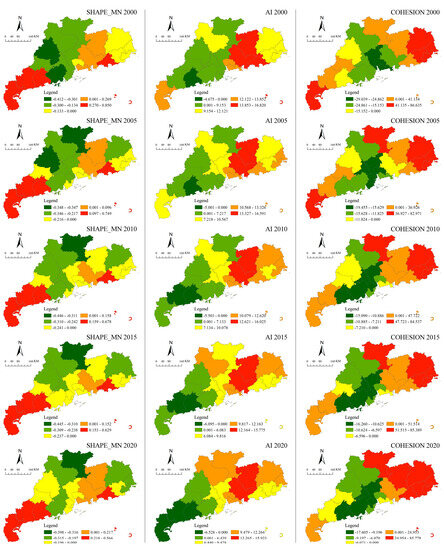
Figure 6.
Spatiotemporal distribution of regression coefficients based on the GTWR model. Variables: average shape index (SHAPE_MN), aggregation index (AI), and patch cohesion index (COHESION).
The role of the urban morphological structure on carbon emissions is also affected by spatial and temporal changes, and shows some spatial heterogeneity characteristics (Figure 6). The influence of the AI on carbon emissions is different from the overall regression results, and most of the cities show the positive influence of this indicator on carbon emissions. Specifically, its influence in the western region changes from positive to negative over time, while its influence remains consistently positive in the other regions. As discussed in a previous analysis of urban spatial structure characteristics, the high AI in Guangdong Province may result in increased carbon emissions due to the spread and connection between the patches [56]. It could also be attributed to factors such as the lack of compactness in urban production and living functions or inefficient resource allocation [57]. The COHESION of the urban patches also exhibits significant spatial variations in its influence on carbon emissions. Specifically, in the eastern, western, and northern regions of Guangdong Province, including the cities of Shaoguan, Heyuan, and Meizhou, the indicator shows a positive impact on carbon emissions. In the Pearl River Delta and the cities of Qingyuan and Yunfu in the northern region, the indicator exhibits a negative impact, demonstrating clear spatial variations.
The socio-economic factors only show noticeable spatial variations in their impact on carbon emissions (see Figure 7). The PopDen has a positive impact on carbon emissions in the western region, whereas it has a negative impact in the other three regions. The PGDP has a positive impact on urban carbon emissions, with its highest influence in the Pearl River Delta and a gradually increasing influence in the western region. The CI has a positive impact on carbon emissions in all the cities in the province, but the regression coefficients are generally small, indicating varying degrees of impact.
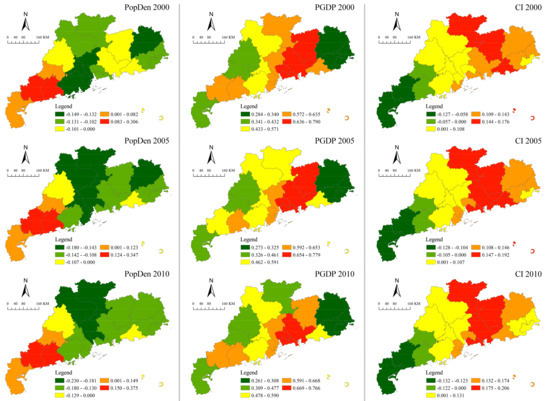
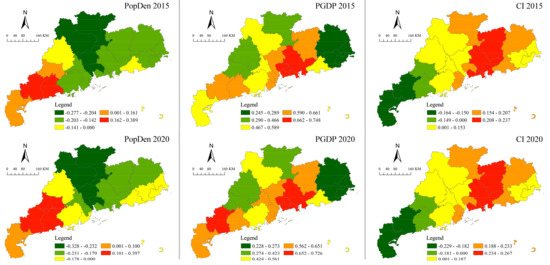
Figure 7.
Spatiotemporal distribution of regression coefficients based on the GTWR model. Variables: population density (PopDen), per capita GDP (PGDP), and carbon intensity (CI).
4. Discussion
4.1. Socio-Economic Factors for Carbon Emission Modeling
In addition to the spatial structure, the variation in urban carbon emissions is also influenced by a series of socio-economic factors, and the effects are quite significant [58]. The IPAT model proposed by Ehrlich and Holdren (1971) explains the relationship between human development and the environment [59]. The model uses population, affluence, and technological level to collectively explain the environmental impact and is still widely applied today [60,61,62]. Based on the IPAT model, this study introduces the relevant socio-economic indicators as control variables to more accurately describe and explain the impact of the USS on carbon emissions.
To better describe and explain the research results, the study data were analyzed using a two-way fixed-effects model, and regression analyses were conducted for two sets of models: one without control variables and one with control variables. When considering the spatial structure factors alone, the goodness-of-fit (R2) of the model is 0.9719, indicating a very high level of explanation, and suggesting that the urban spatial structure has a comprehensive impact on carbon emissions. The indicators for the dimensions of scale structure, shape structure, and morphological structure all have significant effects on carbon emissions. The second set of regression results shows a slightly higher goodness-of-fit (R2 = 0.9766) compared to the first set, demonstrating that even after adding the three socio-economic control variables, the regression results for the explanatory variables on carbon emissions remain significant. This result further confirms the influence of the urban spatial structure on carbon emissions.
4.2. Zoning Optimization Strategies under Low Carbon Constraints
This study found that the influence of the various spatial structure indicators on carbon emissions varies in the different regions or cities. Therefore, it is necessary to propose targeted optimization strategies based on the different regions or cities.
Compared to other regions, the TA has a greater impact on carbon emissions in the Pearl River Delta, particularly in the central and western parts, including cities such as Guangzhou, Foshan, Zhuhai, Zhongshan, and Jiangmen. Therefore, these cities must prioritize the expansion of their built-up areas, with a focus on orderly and rational development. The high-value areas of PARA_MN are concentrated in the Pearl River Delta, especially in cities like Shenzhen, Jiangmen, Zhuhai, and Guangzhou. It is necessary to optimize the shape layout of urban construction land and reduce complexity. Additionally, the AI of the urban built-up areas in the Pearl River Delta is also the highest, especially in the two mega-cities (Guangzhou and Shenzhen) and the two large cities (Dongguan and Foshan). Extra attention should be given to coordinating the functional layout of these cities.
The LPI has the greatest impact on carbon emissions in the northern part of Guangdong, particularly in Shaoguan, Heyuan, and Meizhou. This region must pay attention to the continuity and integrity of the urban built-up areas and accelerate the filling and merging of fragmented land. Moreover, carbon emissions in Shaoguan, Heyuan, and Meizhou are positively correlated with the COHESION, suggesting the need to consider whether certain areas within the cities have excessively high levels of agglomeration.
The morphological structure of the cities has the greatest impact on carbon emissions in the eastern part of Guangdong. The AI of the urban areas in the eastern region rose rapidly during the study period, indicating its stronger influence on carbon emissions. The COHESION within the patches also has a positive effect on carbon emissions. Therefore, the relevant authorities should appropriately regulate and alleviate the high-aggregation areas to promote balanced urban development. Additionally, the TA has a significant impact on carbon emissions in the eastern region, emphasizing the need for the rational expansion of the built-up areas there.
The shape structure of the cities has a greater impact on carbon emissions in the western part of Guangdong. The SHAPE_MN of the urban areas in the western region has a positive effect on carbon emissions, which is contrary to most of the other regions. Therefore, attention should be given to the complexity of city boundaries and optimizing the layout of built-up areas. Furthermore, the COHESION within patches has a strong positive impact on carbon emissions in this region, indicating the need to avoid the excessive integration of functional zones.
4.3. Limitations and Future Research
The selection of indicators and the depth of research in this paper have certain limitations. The focus on the USS is limited to a two-dimensional spatial level, mainly considering the scale, shape, and morphological elements of the built-up patches. However, cities exist in a three-dimensional space, and factors such as building density, shape, and agglomeration can also have an impact on carbon emissions. Additionally, the extent of the impact that spatial variations in Guangdong’s USS have on carbon emissions have not been thoroughly explored, and the underlying mechanisms remain unclear. Therefore, there are potential directions for future research, which are described below.
First, it would be beneficial to pay more attention to the vertical dimension of urban space and select the appropriate indicators to measure the three-dimensional structure of cities. Second, the factors influencing carbon emissions in urban spaces are diverse. Future research could further expand the dimensions of study, such as the layout characteristics of urban transportation and residents’ travel behavior, to provide a more detailed characterization of the spatial features of each city. This approach would help to explore the specific reasons behind the occurrence of spatial variations.
5. Conclusions
With the 21 cities in Guangdong Province as the research object, this study collected the relevant data and constructed indicators of the USS to analyze the characteristics and changes in the USS and carbon emissions from 2000 to 2020. It quantitatively explored the overall impact of and spatial-temporal variations in the USS on carbon emissions and proposed corresponding optimization strategies. This study addressed the shortcomings of existing research scales and heterogeneity studies, providing references for similar research areas.
It was found that for the period 2000–2020, the scale of the cities in Guangdong Province were expanding, the degree of continuity and agglomeration of the built-up areas were high and increasing, and the complexity and fragmentation of the spatial shapes were gradually decreasing. At the scale structure level, the built-up area of the cities in the Pearl River Delta greatly exceeded that of the other three regions. In terms of the shape structure, there were small differences among the regions whereas, in terms of the morphological structure, the level of urban agglomeration in the northern part of Guangdong was relatively low, and that of the eastern part showed significant growth. The carbon emissions of the cities in Guangdong Province showed rapid growth, but after 2010, the emission rates of most of the cities began to slow down or decline. In terms of the carbon emissions, there was a spatial clustering effect, with the high-carbon cities concentrated in the Pearl River Delta and the eastern city of Shantou in Guangdong, whereas the carbon emissions of the cities in the other regions were relatively low, indicating a continued significant regional imbalance.
The USS and socio-economic indicators are significantly correlated with carbon emissions, and the results of our heterogeneity analysis showed a high overall significance for the individual cities. For the cities in Guangdong Province, the expansion of their built-up areas and the increasing complexity of their urban patches will increase carbon emissions, whereas improving their internal continuity and compactness could reduce carbon emissions. Moreover, there is a certain degree of spatiotemporal heterogeneity in the impact of the spatial structure indicators on carbon emissions in different dimensions. The spatial structure indicators that dominate carbon emissions in the eastern, western, and northern parts of Guangdong, as well as in the Pearl River Delta cities, are the morphology structure, shape structure, and scale structure (LPI and TA), respectively. Among the socio-economic indicators, the PopDen and PGDP have significant positive impacts on western Guangdong and the Pearl River Delta region, respectively. The different regions or cities must develop targeted spatial structure optimization strategies, with the regions as the main focus and the cities as the complement.
Author Contributions
Methodology, S.C. (Shuo Chen) and S.C. (Shixi Cui); Investigation, K.L. and S.C. (Shuo Chen); Writing—original draft, K.L., S.C. (Shuo Chen), S.C. (Shixi Cui), Y.L., Y.H. and C.Z.; Supervision, S.W. All authors have read and agreed to the published version of the manuscript.
Funding
This work was supported by the Guangzhou Philosophy and Social Science Planning Project (No. 2023GZYB81), the Guangzhou Urban Planning & Design Survey Research Institute Research Project (No. RDP2220202074), and the Collaborative Innovation Center for Natural Resources Planning and Marine Technology of Guangzhou (No. 2023B04J0046).
Data Availability Statement
The data are contained within the article.
Conflicts of Interest
The authors declare no conflict of interest.
References
- Wallace, J.M.; Held, I.M.; Thompson, D.W.; Trenberth, K.E.; Walsh, J.E. Global warming and winter weather. Science 2014, 343, 729–730. [Google Scholar] [CrossRef] [PubMed]
- Clark, P.U.; Shakun, J.D.; Marcott, S.A.; Mix, A.C.; Eby, M.; Kulp, S.; Levermann, A.; Milne, G.A.; Pfister, P.L.; Santer, B.D. Consequences of twenty-first-century policy for multi-millennial climate and sea-level change. Nat. Clim. Chang. 2016, 6, 360–369. [Google Scholar] [CrossRef]
- Shi, F.; Liao, X.; Shen, L.; Meng, C.; Lai, Y. Exploring the spatiotemporal impacts of urban form on CO2 emissions: Evidence and implications from 256 Chinese cities. Environ. Impact Assess. Rev. 2022, 96, 106850. [Google Scholar] [CrossRef]
- Shi, K.; Chen, Y.; Li, L.; Huang, C. Spatiotemporal variations of urban CO2 emissions in China: A multiscale perspective. Appl. Energy 2018, 211, 218–229. [Google Scholar] [CrossRef]
- Wang, S.; Fang, C.; Wang, Y.; Huang, Y.; Ma, H. Quantifying the relationship between urban development intensity and carbon dioxide emissions using a panel data analysis. Ecol. Indic. 2015, 49, 121–131. [Google Scholar] [CrossRef]
- Ou, J.; Liu, X.; Li, X.; Chen, Y. Quantifying the relationship between urban forms and carbon emissions using panel data analysis. Landsc. Ecol. 2013, 28, 1889–1907. [Google Scholar] [CrossRef]
- Fang, C.; Wang, S.; Li, G. Changing urban forms and carbon dioxide emissions in China: A case study of 30 provincial capital cities. Appl. Energy 2015, 158, 519–531. [Google Scholar] [CrossRef]
- Yousefi, Z.; Dadashpoor, H. How do ICTs affect urban spatial structure? A systematic literature review. J. Urban Technol. 2020, 27, 47–65. [Google Scholar] [CrossRef]
- Zhou, B.; Rybski, D.; Kropp, J.P. The role of city size and urban form in the surface urban heat island. Sci. Rep. 2017, 7, 4791. [Google Scholar] [CrossRef]
- Herold, M.; Scepan, J.; Clarke, K.C. The use of remote sensing and landscape metrics to describe structures and changes in urban land uses. Environ. Plan. A 2002, 34, 1443–1458. [Google Scholar] [CrossRef]
- Vaccari, F.P.; Gioli, B.; Toscano, P.; Perrone, C. Carbon dioxide balance assessment of the city of Florence (Italy), and implications for urban planning. Landsc. Urban Plan. 2013, 120, 138–146. [Google Scholar] [CrossRef]
- Warren, R. Rail and the City: Shrinking Our Carbon Footprint While Reimagining Urban Space; MIT Press: Cambridge, MA, USA, 2014. [Google Scholar]
- Vaughn, R.M.; Hostetler, M.; Escobedo, F.J.; Jones, P. The influence of subdivision design and conservation of open space on carbon storage and sequestration. Landsc. Urban Plan. 2014, 131, 64–73. [Google Scholar] [CrossRef]
- Baur, A.H.; Förster, M.; Kleinschmit, B. The spatial dimension of urban greenhouse gas emissions: Analyzing the influence of spatial structures and LULC patterns in European cities. Landsc. Ecol. 2015, 30, 1195–1205. [Google Scholar] [CrossRef]
- Yi, Y.; Wang, Y.; Li, Y.; Qi, J. Impact of urban density on carbon emissions in China. Appl. Econ. 2021, 53, 6153–6165. [Google Scholar] [CrossRef]
- Sarkodie, S.A.; Owusu, P.A.; Leirvik, T. Global effect of urban sprawl, industrialization, trade and economic development on carbon dioxide emissions. Environ. Res. Lett. 2020, 15, 034049. [Google Scholar] [CrossRef]
- Li, Z.; Wu, H.; Wu, F. Impacts of urban forms and socioeconomic factors on CO2 emissions: A spatial econometric analysis. J. Clean. Prod. 2022, 372, 133722. [Google Scholar] [CrossRef]
- Pu, Y.; Wang, Y.; Wang, P. Driving effects of urbanization on city-level carbon dioxide emissions: From multiple perspectives of urbanization. Int. J. Urban Sci. 2022, 26, 108–128. [Google Scholar] [CrossRef]
- Ma, C.; Yang, H.; Zhang, W.; Huang, S. Low-carbon consumption with government subsidy under asymmetric carbon emission information. J. Clean. Prod. 2021, 318, 128423. [Google Scholar] [CrossRef]
- Martínez-Zarzoso, I.; Bengochea-Morancho, A.; Morales-Lage, R. The impact of population on CO2 emissions: Evidence from European countries. Environ. Resour. Econ. 2007, 38, 497–512. [Google Scholar] [CrossRef]
- Zhou, Y.; Liu, Y. Does population have a larger impact on carbon dioxide emissions than income? Evidence from a cross-regional panel analysis in China. Appl. Energy 2016, 180, 800–809. [Google Scholar] [CrossRef]
- Gudipudi, R.; Fluschnik, T.; Ros, A.G.C.; Walther, C.; Kropp, J.P. City density and CO2 efficiency. Energy Policy 2016, 91, 352–361. [Google Scholar] [CrossRef]
- Wu, D.; Lin, J.C.; Oda, T.; Kort, E.A. Space-based quantification of per capita CO2 emissions from cities. Environ. Res. Lett. 2020, 15, 035004. [Google Scholar] [CrossRef]
- Wang, S.; Liu, X.; Zhou, C.; Hu, J.; Ou, J. Examining the impacts of socioeconomic factors, urban form, and transportation networks on CO2 emissions in China’s megacities. Appl. Energy 2017, 185, 189–200. [Google Scholar] [CrossRef]
- Zhao, P.; Diao, J.; Li, S. The influence of urban structure on individual transport energy consumption in China’s growing cities. Habitat Int. 2017, 66, 95–105. [Google Scholar] [CrossRef]
- Reis, J.P.; Silva, E.A.; Pinho, P. Spatial metrics to study urban patterns in growing and shrinking cities. Urban Geogr. 2016, 37, 246–271. [Google Scholar] [CrossRef]
- Holden, E.; Norland, I.T. Three challenges for the compact city as a sustainable urban form: Household consumption of energy and transport in eight residential areas in the greater Oslo region. Urban Stud. 2005, 42, 2145–2166. [Google Scholar] [CrossRef]
- Shu, H.; Xiong, P.-p. Reallocation planning of urban industrial land for structure optimization and emission reduction: A practical analysis of urban agglomeration in China’s Yangtze River Delta. Land Use Policy 2019, 81, 604–623. [Google Scholar] [CrossRef]
- Lee, S.; Lee, B. The influence of urban form on GHG emissions in the US household sector. Energy Policy 2014, 68, 534–549. [Google Scholar] [CrossRef]
- Han, S.; Sun, B.; Zhang, T. Mono-and polycentric urban spatial structure and PM2. 5 concentrations: Regarding the dependence on population density. Habitat Int. 2020, 104, 102257. [Google Scholar] [CrossRef]
- Zhu, K.; Tu, M.; Li, Y. Did polycentric and compact structure reduce carbon emissions? A spatial panel data analysis of 286 Chinese cities from 2002 to 2019. Land 2022, 11, 185. [Google Scholar] [CrossRef]
- Ou, J.; Liu, X.; Wang, S.; Xie, R.; Li, X. Investigating the differentiated impacts of socioeconomic factors and urban forms on CO2 emissions: Empirical evidence from Chinese cities of different developmental levels. J. Clean. Prod. 2019, 226, 601–614. [Google Scholar] [CrossRef]
- Hong, S.; Hui, E.C.-m.; Lin, Y. Relationship between urban spatial structure and carbon emissions: A literature review. Ecol. Indic. 2022, 144, 109456. [Google Scholar] [CrossRef]
- Sun, C.; Zhang, Y.; Ma, W.; Wu, R.; Wang, S. The impacts of urban form on carbon emissions: A comprehensive review. Land 2022, 11, 1430. [Google Scholar] [CrossRef]
- Zheng, Y.; Cheng, L.; Wang, Y.; Wang, J. Exploring the impact of explicit and implicit urban form on carbon emissions: Evidence from Beijing, China. Ecol. Indic. 2023, 154, 110558. [Google Scholar] [CrossRef]
- Wang, F.; Fan, W.; Liu, J.; Wang, G.; Chai, W. The effect of urbanization and spatial agglomeration on carbon emissions in urban agglomeration. Environ. Sci. Pollut. Res. 2020, 27, 24329–24341. [Google Scholar] [CrossRef] [PubMed]
- Wang, J.; Wang, S.; Li, S.; Feng, K. Coupling analysis of urbanization and energy-environment efficiency: Evidence from Guangdong province. Appl. Energy 2019, 254, 113650. [Google Scholar] [CrossRef]
- Jiang, H.; Sun, Z.; Guo, H.; Xing, Q.; Du, W.; Cai, G. A standardized dataset of built-up areas of China’s cities with populations over 300,000 for the period 1990–2015. Big Earth Data 2022, 6, 103–126. [Google Scholar] [CrossRef]
- Sun, Z.; Sun, J.; Guo, H.; Jiang, H.; Gao, J.; Wang, J. A Dataset of Built-Up Areas of Chinese Cities in 2020. Sci. Data Bank 2021. [Google Scholar] [CrossRef]
- Chen, J.; Gao, M.; Cheng, S.; Hou, W.; Song, M.; Liu, X.; Liu, Y.; Shan, Y. County-level CO2 emissions and sequestration in China during 1997–2017. Sci. Data 2020, 7, 391. [Google Scholar] [CrossRef]
- Jia, Y.; Tang, L.; Xu, M.; Yang, X. Landscape pattern indices for evaluating urban spatial morphology—A case study of Chinese cities. Ecol. Indic. 2019, 99, 27–37. [Google Scholar] [CrossRef]
- Bereitschaft, B.; Debbage, K. Urban form, air pollution, and CO2 emissions in large US metropolitan areas. Prof. Geogr. 2013, 65, 612–635. [Google Scholar] [CrossRef]
- Balsalobre-Lorente, D.; dos Santos Parente, C.C.; Leitão, N.C.; Cantos-Cantos, J.M. The influence of economic complexity processes and renewable energy on CO2 emissions of BRICS. What about industry 4.0? Resour. Policy 2023, 82, 103547. [Google Scholar] [CrossRef]
- Feng, Y.; Wang, X.; Du, W.; Wu, H.; Wang, J. Effects of environmental regulation and FDI on urban innovation in China: A spatial Durbin econometric analysis. J. Clean. Prod. 2019, 235, 210–224. [Google Scholar] [CrossRef]
- Zhu, E.; Qi, Q.; Chen, L.; Wu, X. The spatial-temporal patterns and multiple driving mechanisms of carbon emissions in the process of urbanization: A case study in Zhejiang, China. J. Clean. Prod. 2022, 358, 131954. [Google Scholar] [CrossRef]
- Anselin, L. Local indicators of spatial association—LISA. Geogr. Anal. 1995, 27, 93–115. [Google Scholar] [CrossRef]
- Wang, Q.; Wang, X.; Li, R. Does population aging reduce environmental pressures from urbanization in 156 countries? Sci. Total Environ. 2022, 848, 157330. [Google Scholar] [CrossRef]
- Wang, M.; Wang, P.; Wu, L.; Yang, R.-P.; Feng, X.-Z.; Zhao, M.-X.; Du, X.-L.; Wang, Y.-J. Criteria for assessing carbon emissions peaks at provincial level in China. Adv. Clim. Chang. Res. 2022, 13, 131–137. [Google Scholar] [CrossRef]
- Liu, L.-L.; Feng, T.-T.; Kong, J.-J. Can carbon trading policy and local public expenditures synergize to promote carbon emission reduction in the power industry? Resour. Conserv. Recycl. 2023, 188, 106659. [Google Scholar] [CrossRef]
- Tian, G.; Yu, S.; Wu, Z.; Xia, Q. Study on the emission reduction effect and spatial difference of carbon emission trading policy in China. Energies 2022, 15, 1921. [Google Scholar] [CrossRef]
- Zhao, Y.; Chen, R.; Zang, P.; Huang, L.; Ma, S.; Wang, S. Spatiotemporal patterns of global carbon intensities and their driving forces. Sci. Total Environ. 2022, 818, 151690. [Google Scholar] [CrossRef]
- Wooldridge, J.M. Two-way fixed effects, the two-way mundlak regression, and difference-in-differences estimators. Soc. Sci. Res. Netw. 2021, 3906345. [Google Scholar] [CrossRef]
- Huang, B.; Wu, B.; Barry, M. Geographically and temporally weighted regression for modeling spatio-temporal variation in house prices. Int. J. Geogr. Inf. Sci. 2010, 24, 383–401. [Google Scholar] [CrossRef]
- Zhou, C.; Wang, S.; Wang, J. Examining the influences of urbanization on carbon dioxide emissions in the Yangtze River Delta, China: Kuznets curve relationship. Sci. Total Environ. 2019, 675, 472–482. [Google Scholar] [CrossRef] [PubMed]
- He, X.; Yu, Y.; Jiang, S. City centrality, population density and energy efficiency. Energy Econ. 2023, 117, 106436. [Google Scholar] [CrossRef]
- Raihan, A.; Ibrahim, S.; Muhtasim, D.A. Dynamic impacts of economic growth, energy use, tourism, and agricultural productivity on carbon dioxide emissions in Egypt. World Dev. Sustain. 2023, 2, 100059. [Google Scholar] [CrossRef]
- Lu, X.; Zhang, Y.; Li, J.; Duan, K. Measuring the urban land use efficiency of three urban agglomerations in China under carbon emissions. Environ. Sci. Pollut. Res. 2022, 29, 36443–36474. [Google Scholar] [CrossRef]
- Dong, F.; Wang, Y.; Su, B.; Hua, Y.; Zhang, Y. The process of peak CO2 emissions in developed economies: A perspective of industrialization and urbanization. Resour. Conserv. Recycl. 2019, 141, 61–75. [Google Scholar] [CrossRef]
- Ehrlich, P.R.; Holdren, J.P. Impact of Population Growth: Complacency concerning this component of man’s predicament is unjustified and counterproductive. Science 1971, 171, 1212–1217. [Google Scholar] [CrossRef]
- Yin, Q.; Wang, Y.; Xu, Z.; Wan, K.; Wang, D. Factors influencing green transformation efficiency in China’s mineral resource-based cities: Method analysis based on IPAT-E and PLS-SEM. J. Clean. Prod. 2022, 330, 129783. [Google Scholar] [CrossRef]
- Kim, J.; Lim, H.; Jo, H.-H. Do aging and low fertility reduce carbon emissions in Korea? Evidence from IPAT augmented EKC analysis. Int. J. Environ. Res. Public Health 2020, 17, 2972. [Google Scholar] [CrossRef]
- Chontanawat, J. Driving forces of energy-related CO2 emissions based on expanded IPAT decomposition analysis: Evidence from ASEAN and four selected countries. Energies 2019, 12, 764. [Google Scholar] [CrossRef]
Disclaimer/Publisher’s Note: The statements, opinions and data contained in all publications are solely those of the individual author(s) and contributor(s) and not of MDPI and/or the editor(s). MDPI and/or the editor(s) disclaim responsibility for any injury to people or property resulting from any ideas, methods, instructions or products referred to in the content. |
© 2023 by the authors. Licensee MDPI, Basel, Switzerland. This article is an open access article distributed under the terms and conditions of the Creative Commons Attribution (CC BY) license (https://creativecommons.org/licenses/by/4.0/).