Article

Spatial and Temporal Variability Characteristics of Future Carbon Stocks in Anhui Province under Different SSP Scenarios Based on PLUS and InVEST Models

1
College of Resources and Environment, Henan Agricultural University, Zhengzhou 450046, China
2
Henan Engineering Research Center of Land Consolidation and Ecological Restoration, Zhengzhou 450046, China
*
Author to whom correspondence should be addressed.
Land 2023, 12(9), 1668; https://doi.org/10.3390/land12091668
Submission received: 12 July 2023 / Revised: 20 August 2023 / Accepted: 24 August 2023 / Published: 25 August 2023
(This article belongs to the Special Issue Land Use Effects on Carbon Storage and Greenhouse Gas Emissions)

Abstract

:
With the rapid development of the social economy, human activities have had a severe impact on the environment. The global climate issue caused by CO2 emissions has attracted the attention of various countries around the world, and reducing CO2 emissions is urgent. This article simulates the changes in carbon storage in Anhui Province from 2030 to 2070 based on SSP1-2.5, SSP2-4.5, and SSP5-5.8 scenarios. First, based on the land use data of Anhui Province in 2010, the PLUS model was used to simulate the land use data of 2015, and the accuracy of the simulation results was verified against real data. Then, the land use data of Anhui Province were simulated in the future period from 2030 to 2070 under different SSP scenarios. Finally, based on the InVEST model, the spatiotemporal changes in future carbon storage were calculated. The research showed that, during the period of 2030 to 2070, the spatial distribution of carbon storage in Anhui Province under three scenario simulations generally showed a distribution pattern of high carbon storage in the north and south, and low carbon storage in the central region. Under the SSP1-2.6 scenario, Anhui Province’s carbon storage decreased by 0.33 million tons, a decrease of 0.029%. Under the SSP2-4.5 scenario, carbon storage increased by 0.25 million tons, an increase of 0.021%. Under the SSP5-8.5 scenario, carbon storage decreased by 1.54 million tons, a decrease of 0.133%. The reasons for the changes in carbon storage were related to the areas of arable land, forest land, and grassland. This study can provide a reference for future low-carbon land use planning.

1. Introduction

With the rapid development of the global economy and explosive population growth, human beings have gained unrestricted access to land resources. Deforestation and land reclamation, as well as reclaiming land from lakes, not only plunder ecological land, but also significantly reduce the carbon sequestration capacity of terrestrial ecosystems. The development of human industry often uses non-renewable fossil fuels such as coal, oil, and natural gas, which emit a large amount of greenhouse gases, such as carbon dioxide, into the atmospheric system, leading to an increasingly severe global greenhouse effect [1]. The melting of icebergs, increase in extreme weather phenomena, frequent natural disasters, and climate degradation are seriously affecting global environmental construction and sustainable human development. China is the world’s largest carbon emitter, and its government explicitly stated during the 75th United Nations General Assembly in 2020 that “carbon dioxide emissions should reach their peak by 2030” and China would “strive to achieve carbon neutrality by 2060” [2]. The government has continuously proposed a planned and step-by-step implementation of carbon peaking actions [3]. China is currently in a critical period of industrialization and urbanization, and reducing carbon emissions while ensuring economic growth is a huge challenge currently being faced. As one of the important ecosystems on the surface, the carbon storage changes in land play an important role in regulating and mitigating the greenhouse effect [4]. The carbon sequestration capacity of different land use types varies, and changes in land use cause changes in carbon storage [5,6,7]. Simulating and predicting changes in carbon storage can provide a scientific basis for effective utilization of national spatial resources and ensure improved carbon storage in regions [8].
Scenario simulation is a hot topic in land use simulation, but current studies mainly simulate spatial patterns of land use under the scenarios of natural development, ecological protection, and cultivated land protection. Sun et al. [9] analyzed the spatiotemporal evolution characteristics of land use types and carbon storage in Anhui Province from 1990 to 2018 and predicted the change trends of carbon storage in Anhui Province under scenarios of natural development and ecological protection. The study found that compared with the natural development scenario, the expansion of construction land under the ecological protection scenario was limited, high-carbon density land such as forest land and grassland was protected, and carbon storage capacity was improved. By contrast, with the boom in global scenario research, the 6th phase of the International Coupled Mode Comparison Program (CMIP6) proposed the Shared Socioeconomic Path (SSP) and Representative Concentration Path (RCP) scenarios to describe some possible development pathways for future socio-economic development under different socio-economic conditions and evaluate the social capacity to respond to and adapt to challenges. There is still little simulation work on carbon storage under the SSP-RCP scenario, which urgently needs to be strengthened.
China has a vast territory, and there are differences in industrial structure, economic level, and development methods among different regions. In order to effectively implement carbon reduction goals, it is necessary to select provinces with high carbon reduction potential for the development of targeted carbon reduction policies [10]. Qiu et al. [3] found that Anhui Province has great potential to increase carbon storage. In the new development stage, Anhui has been included in the national development strategy of integrating the Yangtze River Delta region. At the same time, Anhui’s development is also in a critical period of transformation and upgrading. By simulating carbon storage under different SSP scenarios, a reference can be provided for future low-carbon land use planning in Anhui Province. Simulating and predicting the trends of carbon storage change caused by changes in land use types can provide a scientific basis for the effective utilization of national spatial resources, improvement of carbon storage in the region, and provide an important reference for the formulation of future regional ecological protection policies [11,12].
There are many existing methods for evaluating regional carbon storage [13], including sample land inventory [14,15], remote sensing estimation [16,17], and model simulation [18,19]. The traditional field investigation method involves collecting soil samples for physical and chemical tests by selecting sample areas within the research area, or obtaining data through vegetation and soil inventory data calculations [20]. This method has a large workload, long cycle, and is not suitable for large-scale environmental research. This method is applicable to small areas, but it cannot reflect the dynamic changes in carbon storage [21]. With the development of remote sensing technology, scholars at home and abroad have begun to combine remote sensing with modeling methods to study carbon storage. Remote sensing inversion methods are often used for studying aboveground and soil biomasses in specific ecosystems, such as forests [22]. The commonly used models include CASA [23], FORCCHN [24], LPJ-GUESS [25], and DNDC [26], which have problems with complex data acquisition and poor applicability. Compared to other modeling methods, the InVEST model simulation method has less data acquisition, accurate evaluation results, and can be applied to study regional carbon stock changes at different research scales, making it more widely used [27,28]. Nelson et al. [29] analyzed and studied the carbon storage of the Willamette River basin in North America using the InVEST model to explore its spatiotemporal change law. Baral et al. [30] combined the InVEST model with land use change to analyze and evaluate biodiversity and carbon sinks. Babbar et al. [31] used the InVEST model to evaluate and predict carbon sequestration in protected areas in India.
Scholars have conducted relevant research on the impact of land use change on carbon storage. Michel et al. [32] found that land use change can cause changes in carbon storage, and optimizing land use cover can slow down the decline in carbon storage. Feng et al. [33,34,35] showed that a decrease in arable land and vegetation area led to a significant reduction in carbon storage. Xia et al. [36] used the InVEST model to study the carbon sequestration capacity and influencing factors of Wuhu City, Anhui Province. The study found that the total carbon sequestration amount in Wuhu City decreased year by year from 2011 to 2021, and land use changes led to a decrease in carbon storage. Wang et al. [37] conducted a study on the changes in soil organic carbon storage of non-construction land caused by land use changes in Chuzhou City, Anhui Province. The study found that construction occupation led to a significant reduction in agricultural land, and the carbon storage of non-construction land showed a trend of decreasing quickly and then slowly. Chen et al. [38] used the “unit soil carbon content” method to calculate soil carbon storage and sequestration potential in Anhui Province at a micro level. In summary, the impact of land use changes on carbon storage in Anhui Province is still unclear.
Land use is an important factor that restricts the calculation of carbon storage in terrestrial ecosystems. Previous studies have mostly explored carbon storage or spatiotemporal changes in ecosystems based on past land use changes. There is little research on simulating the carbon storage status under future SSP development scenarios. Therefore, this study combines the InVEST model with the PLUS model to more accurately measure the future carbon storage of the research area. This article is based on the land use data of Anhui Province in 2010, using the PLUS model to simulate the land use data of 2015. The accuracy of the simulation results is verified against real data, and then the future land use data of Anhui Province from 2030 to 2070 under different SSP scenarios are simulated. Finally, based on the InVEST model, the spatiotemporal changes in carbon storage in Anhui Province from 2030 to 2070 were calculated.

2. Materials and Methods

2.1. Research Area

Anhui Province is located in the central eastern part of China, with a length of approximately 570 km from north to south and a width of approximately 450 km from east to west. The total area is 140,100 square kilometers, accounting for approximately 1.45% of China’s land area. At the end of 2022, the permanent population of the province was 61.27 million.
Anhui Province spans the two major river basins of the Yangtze and Huai Rivers, serving as an ecological barrier for water resource security and biodiversity protection. The terrain and landforms are diverse, and the natural geographical conditions vary significantly. To the north of the Huai River is an endless plain with flat and fertile land. The southern Anhui region south of the Yangtze River is characterized by undulating mountains and abundant forest resources. There are numerous lakes within the territory, with Chaohu Lake covering an area of nearly 800 square kilometers, making it one of the five largest freshwater lakes in China. There are significant regional differences in land use and soil types. In recent years, significant changes in land use types have occurred due to Anhui Province being located in overlapping zones of national strategies, including the Yangtze River Economic Belt, integration of the Yangtze River Delta, high-quality development in the central region, rapid development of the economy, and continuous improvement of the urbanization level [9,38].

2.2. Data Sources

The data involved in this paper include land use data and driving factor data (socio-economic and natural condition data). Land use types are divided into six major land use types, namely cultivated land, forest land, grassland, water bodies, construction land, and unused land. Other data sources are shown in Table 1. The data from different sources were processed with a resolution of 1 km × 1 km.

2.3. Research Methods

2.3.1. PLUS Model

The PLUS model is a newly developed model based on traditional land use simulation models, such as random forest models [39], which was developed by Liang et al. [40] from the China University of Geosciences. The latest version of PLUS v1.4 software and user manual can be found online (https://github.com/HPSCIL/Patch-generating_Land_Use_Simulation_Model (accessed on 10 June 2023)). The PLUS model proposes a rule mining framework based on the Land Expansion Analysis Strategy (LEAS) and a CA model based on Multi Type Random Seeds (CARS). The LEAS module uses data analysis to explore the causes of land use changes, and CARS accurately simulates the changes of each patch-level land use. The two are coupled with multi-objective algorithms to present the contribution of each driving factor to land use change. Using the LEAS and CARS modules [41] better simulates patch-level changes in various land uses, enabling the evaluation of various land use types [42]. The PLUS model has higher simulation accuracy and more similar landscapes.
First, the suitability probability of each category was calculated based on the two land use datasets of 2010 and 2015, using the driving factors as predictor variables. Then, the 2010 land use dataset was used as the simulation base map. The 2015 land use simulation data were obtained by running the PLUS model. The simulation results were compared with the real data in 2015. In order to meet different development needs combined with global future development scenarios, the land use distribution types in the region during 5-year intervals of 2030–2070 under different SSP scenarios were predicted by changing the transfer matrix settings.

2.3.2. SSP Scenario Simulation

The coupled model intercomparison project (CMIP) developed by the World Climate Research Program (WCRP) has now been updated to version six. New scenarios cover future social and economic changes in demographic, economic, ecological, resource, and institutional factors, as well as various climate change mitigation, adaptation, and response measures. Future land use data under eight different combinations of SSPs scenarios and RCPs scenarios are modeled in the CMIP6 Land Use Harmonisation dataset (LUH2) [43]. Land use types are expressed as fractions and at a resolution of only 0.25°. Most of the land-use projections that have been studied are displayed at a coarse spatial resolution. Differences at the regional and local levels are ignored, resulting in the blurring of the significant effects of small-scale environmental variables such as soil, topography, and local climate on local land-use dynamics. The results of land-use projections at a coarse spatial resolution can also cause a degree of uncertainty in the results of environmental impact assessments.
This article used the PLUS model to simulate the newly released CMIP6 Land Use Coordination Dataset (LUH2), simulating the land use situation at a 1 km resolution from 2030 to 2070 in Anhui Province under three scenarios: SSP1-2.6 (sustainable development path), SSP2-4.5 (intermediate path), and SSP5-8.5 (fossil fuel-dominated development path).
Notably, the amount of each LULC type in 2015 in the RESDC Land Cover Product did not match that in the LUH2-converted dataset. To maintain consistency, we further calibrated the future LULC amount constraints from the LUH2 converted datasets to match the 2015 RESDC dataset. Specifically, the future amount of each LULC type was determined by multiplying its area in the 2015 RESDC dataset with the relative change from its area in 2015 to its projected area at the future year based on the LUH2-converted dataset (i.e., the relative change for each LULC was calculated as future LUH2-converted area divided by 2015 LUH2-converted area).

2.3.3. InVEST Model

The InVEST model, jointly developed by Stanford University, The Nature Conservancy (TNC), and the World Wide Fund for Nature (WWF) [44]. It is used to simulate different land use covers in order to explore patterns of ecosystem service changes [45]. This model combines economic development with social needs to effectively allocate resources. It has been widely used in multiple countries and regions, and its accuracy has been verified. The InVEST model has the advantage of low data demand and easy access in calculating carbon storage, and it is widely used in carbon storage calculations.
Terrestrial ecosystem carbon stocks are the sum of soil organic carbon pools, underground biomass carbon pools, aboveground biomass carbon pools, and dead organic matter carbon pools stocks [46]. Aboveground biomass refers to non-dead plants above the soil, such as herbaceous plants, tree trunks, and leaves. Underground biomass refers to the root systems of plants that expand from the aboveground biomass to the soil. Dead organic matter carbon mainly originates from vegetation types such as trees or forests, including litter, roots, and buds, as well as carbon generated during the decomposition of animal manure and other organic matter. Soil carbon storage refers to the organic matter content stored within a range of 20–100 cm below the surface of the soil [47]. Due to the extremely low carbon storage content of dead organic matter and the difficulty in obtaining data [48], it will not be considered in this study.
Carbon density refers to the carbon storage capacity per unit area, which is an important indicator of the carbon storage capacity of ecosystems. It is a necessary data for the InVEST model carbon module to calculate carbon storage. This article refers to the research data of Sun et al. [9], as shown in Table 2.
The formula for calculating carbon storage is as follows:
C i = C i a b o v e + C i b e l o w + C i s o i l
C i t o t a l = C i × A i
where C i is the total carbon density of land type i, C i a b o v e is the aboveground carbon density of ground type i, C i b e l o w is the underground carbon density of land type i, C i s o i l is the soil carbon density of land type i, C i t o t a l is the total carbon storage of land type i, and A i is the area of land type i.

3. Results

3.1. PLUS Model Accuracy Verification

In order to verify the accuracy of the PLUS model in simulating land use prediction in Anhui Province, Kappa and FoM coefficients were used for testing. The Kappa coefficient is one of the common methods used for analog verification, which can detect and analyze the simulation results of the land use data used, revealing the feasibility and reliability of the data and simulation results. A Kappa coefficient of the simulation results greater than 0.8 indicates that the PLUS model has good simulation accuracy and can accurately reflect the land use changes in the study area. A higher FoM coefficient indicates better simulating accuracy [40].
The accuracy of the land use prediction data in 2015 and the actual land use data in 2015 in Anhui Province was tested. The results showed that the overall accuracy and Kappa coefficient were 0.96 and 0.95, respectively. The FoM coefficient was 0.09. The results of this study were similar to those of Mao et al. [2]. Mao et al. used the PLUS model to simulate and predict land use, and the accuracy verification FoM value was 0.13. Therefore, the PLUS model has good applicability in the land use simulation of Anhui Province.
Different driving factors have different effects under different SSP scenarios. The effects of natural and socio-economic driving factors in this paper refer to the research results of Geng et al. [43]. DEM, slope, slope aspect, annual average precipitation, soil oxygen content, soil salt content, and workability of soil represent the actions of natural factors. GDP, population, distance to city, distance to township, distance to highway, distance to national road, distance to railway, and distance to river represent the roles of socio-economic factors. These influencing factors are applicable to all SSP scenarios and will affect changes in land use type, which will then affect changes in carbon storage. Figure 1 shows the contribution of driving factors to the area growth of different land use types. Due to the basic lack of changes in water bodies and unused land, they will not be displayed.

3.2. Spatiotemporal Analysis of Land Use Simulation

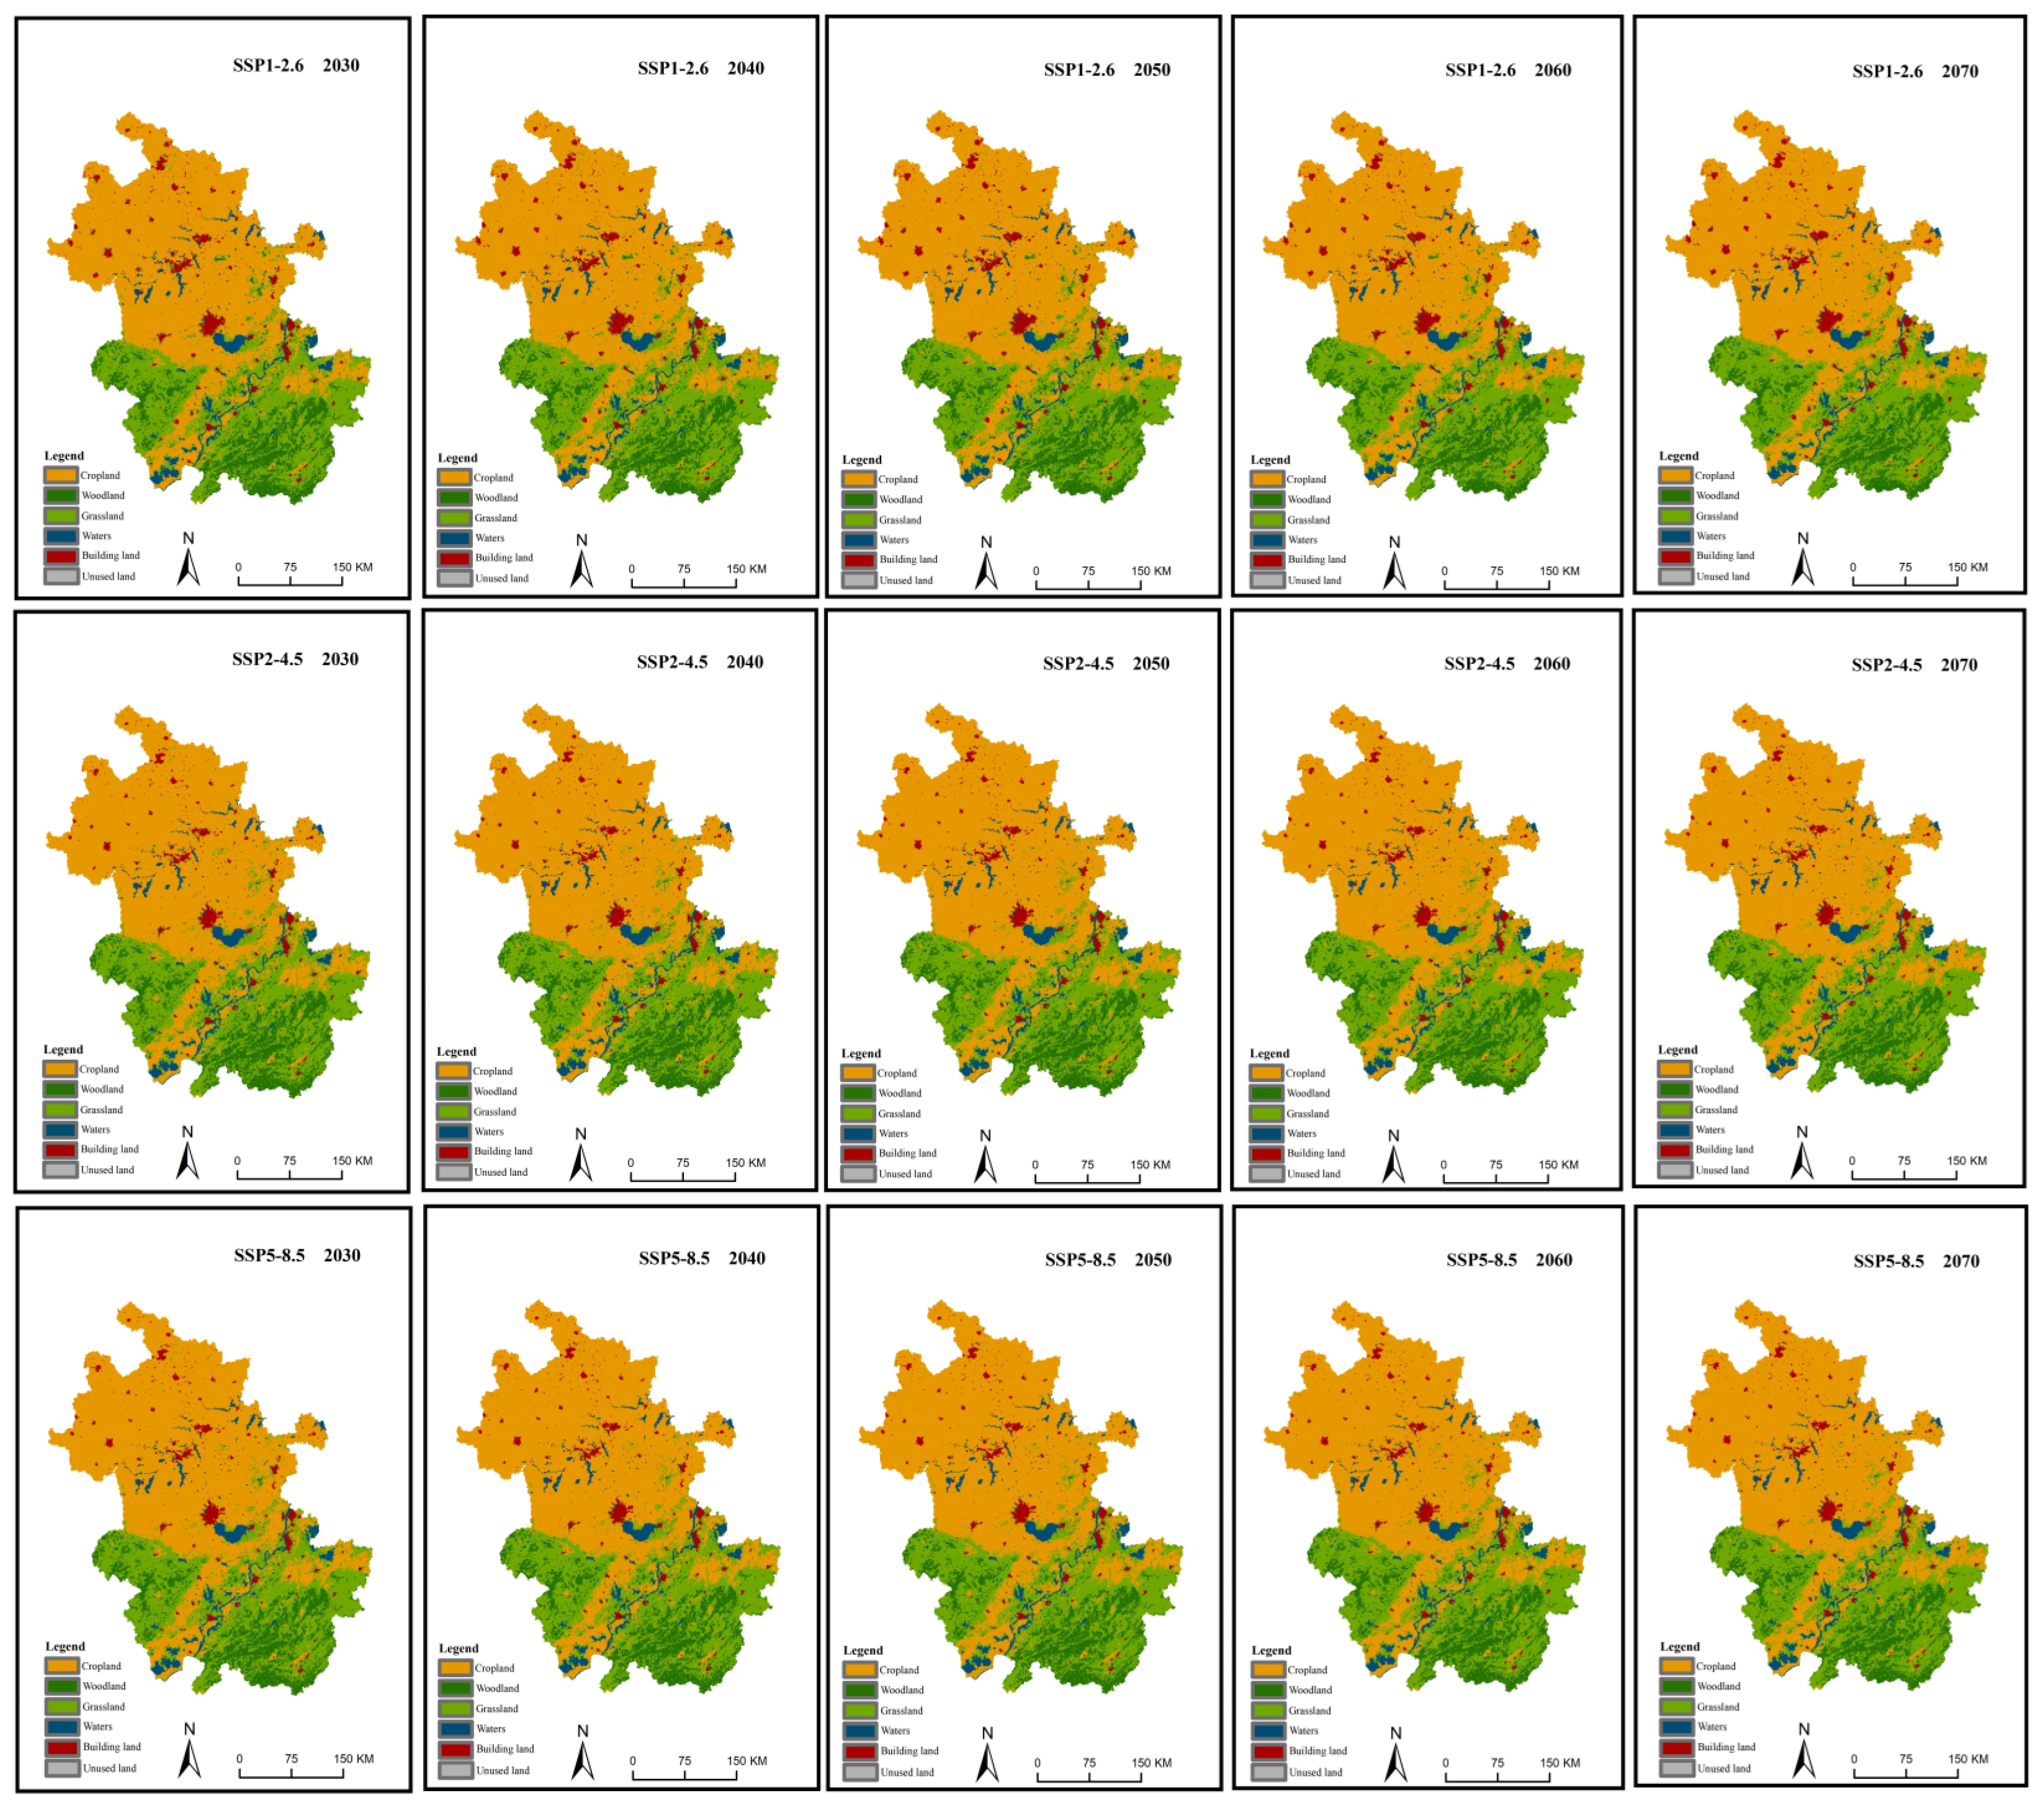
Through the PLUS model simulation, we obtained the spatiotemporal distribution of land use in Anhui Province during 5-year intervals under the SSP1-2.6, SSP2-4.5, and SSP5-5.8 scenarios from 2030 to 2070. Data from 2030, 2040, 2050, 2060, and 2070 were selected for analysis, as shown in Figure 2.
In Figure 2, it can be seen that under different scenarios, cultivated land is mainly distributed in the central and northern regions of Anhui Province, with sporadic distribution in the southwest and southeast regions. Forests and grasslands are mainly distributed in the western and southern regions of Anhui Province. Overall, there was no significant change in the spatial distribution of land use between 2030 and 2070.
Table 3 shows the land use transfer in Anhui Province under the SSP1-2.6 scenario from 2030 to 2070.
Under the SSP1-2.6 scenario, the proportion of arable land in Anhui Province increased from 56.73% to 57.29% between 2030 and 2070. The proportion of forest land decreased from 9.66% to 9.13%. The proportion of grassland decreased from 26.51% to 26.13%, and the proportion of construction land increased from 3.25% to 3.61%. A total of 591.39 km2 of arable land was converted into grassland, and 149.28 km2 of arable land was converted into construction land. A total of 61.72 km2 of forest land was converted into farmland, and 623.69 km2 of forest land was converted into grassland. Additionally, 1283.98 km2 of grassland was converted into arable land, 83.97 km2 of grassland was converted into forest land, and 241.87 km2 was converted into construction land.
Table 4 shows the land use transfer in Anhui Province under the SSP2-4.5 scenario from 2030 to 2070.
Under the SSP2-4.5 scenario, the proportion of arable land in Anhui Province increased from 58.25% to 58.80% between 2030 and 2070. The proportion of forest land decreased from 9.73% to 9.36%, and the proportion of grassland decreased from 25.38% to 25.04%. The proportion of construction land increased from 2.79% to 2.95%. A total of 0.72 km2 of arable land was converted into forest land, 394.74 km2 of arable land was converted into grassland, and 58.13 km2 of arable land was converted into construction land. Additionally, 22.25 km2 of forest land was converted into farmland, and 410.53 km2 of forest land was converted into grassland. Finally, 965.32 km2 of grassland was converted into arable land, 49.52 km2 of grassland was converted into forest land, and 107.66 km2 of grassland was converted into construction land.
Table 5 shows the land use transfer in Anhui Province under the SSP5-8.5 scenario from 2030 to 2070.
Under the SSP5-8.5 scenario, the proportion of arable land in Anhui Province increased from 58.48% to 58.64% between 2030 and 2070. The proportion of forest land decreased from 9.69% to 9.26%, and the proportion of grassland increased from 25.18% to 25.35%. The proportion of urban areas increased from 2.81% to 2.91%. A total of 272.73 km2 of arable land was converted into grassland, and 44.50 km2 of arable land was converted into construction land. A total of 54.55 km2 of forest land was converted into farmland, and 422.73 km2 of forest land was converted into grassland. Additionally, 423.45 km2 of grassland was converted into farmland, 20.10 km2 of grassland was converted into forest land, and 50.96 km2 of grassland was converted into construction land.

3.3. Spatiotemporal Analysis of Carbon Storage Simulation

Based on the future land use situation of Anhui Province under different SSP scenarios and using the InVEST model, we obtained the future carbon storage of Anhui Province under the SSP1-2.6, SSP2-4.5, and SSP5-8.5 scenarios. ArcGIS 10.8 software was employed to visualize the distribution of carbon storage, as shown in Figure 3.
Under different scenarios, from a spatial perspective, areas with high carbon reserves were mainly concentrated in the southern mountainous areas and northern plain areas of Anhui. The southern region was mainly composed of forest and grassland, with high soil carbon storage. The northern region had a large amount of arable land. The regions with low carbon reserves were mainly scattered in the central and southern regions of Anhui Province. Low carbon storage areas were mainly distributed in water bodies (rivers, lakes, etc.), with a minimum value of 0. The spatial change in carbon storage from 2030 to 2070 was not significant, and most regions showed basically unchanged states of carbon storage spatial distribution during different periods.
Through calculation, it could be concluded that under different scenarios, from 2030 to 2070 in Anhui Province, the soil carbon storage accounted for the largest proportion of total carbon storage, accounting for over 85%. The proportion of soil carbon storage was on the rise, while the proportion of aboveground carbon storage in Anhui Province was on the decline. The proportion of underground carbon storage in Anhui Province showed a downward trend.
As shown in Table 6, according to the prediction under the SSP1-2.6 scenario, the carbon storage of Anhui Province in 2030 was 1151.13 million tons, including 732.65 million tons of carbon storage in arable land, 139.01 million tons in forest land, 246.17 million tons in grassland, and 33.28 million tons in construction land. In 2070, the carbon storage of Anhui Province was 1150.80 million tons, including 739.92 million tons in arable land, 131.36 million tons in forest land, 242.6 million tons in grassland, and 36.91 million tons in construction land.
Between 2030 and 2040, the total carbon storage in Anhui Province decreased by 0.12 million tons, with an increase of 2.03 million tons in arable land, a decrease of 2.54 million tons in forest land, a decrease of 1.82 million tons in grassland, and an increase of 2.22 million tons in construction land. During the period from 2040 to 2050, the total carbon storage in Anhui Province decreased by 0.78 million tons, including an increase of 0.40 million tons in arable land, a decrease of 2.13 million tons in forest land, an increase of 0.83 million tons in grassland, and an increase of 0.91 million tons in construction land. During the period from 2050 to 2060, the total carbon storage in Anhui Province increased by 0.36 million tons, including an increase of 3.23 million tons in arable land, a decrease of 1.60 million tons in forest land, a decrease of 1.47 million tons in grassland carbon storage, and an increase of 0.20 million tons in construction land carbon storage. During the period from 2060 to 2070, the total carbon storage of Anhui Province increased by 0.21 million tons, including an increase of 2.41 million tons in arable land, a decrease of 1.38 million tons in forest land, a decrease of 1.11 million tons in grassland, and an increase of 0.30 million tons in construction land.
From 2030 to 2070, carbon storage decreased by 0.33 million tons, a decrease of 0.029%. The carbon storage of arable land increased by 7.27 million tons, an increase of 0.65%. The carbon storage of forest land decreased by 7.65 million tons, a decrease of 0.66%. The carbon storage of grassland decreased by 3.57 million tons, a decrease of 0.30%. The carbon storage of construction land increased by 3.63 million tons, an increase of 0.32%. During these 40 years, the carbon storage of arable land showed an upward trend. The carbon storage of forest land was continuously decreasing, the carbon storage of grassland showed a downward trend, and the carbon storage of construction land showed an upward trend.
As shown in Table 7, according to the prediction under the SSP2-4.5 scenario, the carbon storage of Anhui Province in 2030 was 1156.62 million tons, including 752.27 million tons of arable land carbon storage, 140.12 million tons of forest land carbon storage, 235.72 million tons of grassland carbon storage, and 28.51 million tons of construction land carbon storage. In 2070, the carbon storage of Anhui Province was 1156.87 million tons, including 759.40 million tons in arable land, 134.74 million tons in forest land, 232.52 million tons in grassland, and 30.21 million tons in construction land.
During 2030–2040, the total carbon storage of Anhui Province increased by 0.68 million tons, of which cultivated land carbon storage increased by 2.82 million tons, forest carbon storage decreased by 0.49 million tons, grassland carbon storage decreased by 2.33 million tons, and construction land carbon storage increased by 0.69 million tons. During the period of 2040–2050, the total carbon storage of Anhui Province increased by 0.19 million tons, of which the carbon storage of cultivated land increased by 2.01 million tons, the carbon storage of forest land decreased by 1.20 million tons, the carbon storage of grassland decreased by 1.19 million tons, and the carbon storage of construction land increased by 0.57 million tons. During 2050–2060, the total carbon storage of Anhui Province decreased by 0.52 million tons, of which the carbon storage of cultivated land increased by 0.86 million tons, the carbon storage of forest land decreased by 2.18 million tons, the carbon storage of grassland increased by 0.66 million tons, and the carbon storage of construction land increased by 0.14 million tons. During 2060–2070, the total carbon storage of Anhui Province decreased by 0.11 million tons, of which the cultivated land carbon storage increased by 1.44 million tons, the forest carbon storage decreased by 1.52 million tons, the grassland carbon storage decreased by 0.34 million tons, and the construction land carbon storage increased by 0.31 million tons.
From 2030 to 2070, carbon stocks increased by 0.25 million tons, an increase of 0.021%. Cultivated land carbon storage increased by 7.13 million tons, an increase of 0.60%. Forest land carbon storage decreased by 5.38 million tons, a decrease of 0.47%. Grassland carbon storage decreased by 3.20 million tons, a decrease of 0.28%. Construction land carbon storage increased by 1.71 million tons, an increase of 0.15%. The carbon storage of water bodies and unused land remained largely unchanged. In these 40 years, the carbon storage of cultivated land increased continuously, the carbon storage of forest land decreased continuously, the carbon storage fluctuation of grassland decreased, and the carbon storage of construction land increased continuously.
As shown in Table 8, it was predicted that under the SSP5-8.5 scenario, Anhui Province’s carbon reserves in 2030 would be 1157.22 million tons, including 755.19 million tons in cultivated land, 139.50 million tons in forest land, 233.81 million tons in grassland, and 28.69 million tons in construction land. In 2070, Anhui’s carbon reserves would be 1155.68 million tons, including 757.25 million tons in cultivated land, 133.23 million tons in forest land, 235.42 million tons in grassland, and 29.77 million tons in construction land.
During 2030–2040, the total carbon storage of Anhui Province increased by 0.33 million tons, of which the carbon storage of cultivated land increased by 1.70 million tons, the carbon storage of forest land decreased by 0.56 million tons, the carbon storage of grassland decreased by 1.36 million tons, and the carbon storage of construction land increased by 0.33 million tons. During the period of 2040–2050, the total carbon storage of Anhui Province decreased by 0.73 million tons, of which the carbon storage of cultivated land increased by 1.34 million tons, the carbon storage of forest land decreased by 3.20 million tons, the carbon storage of grassland increased by 0.85 million tons, and the carbon storage of construction land increased by 0.28 million tons. During 2050–2060, the total carbon storage of Anhui Province decreased by 0.55 million tons, of which the carbon storage of cultivated land decreased by 0.52 million tons, the carbon storage of forest land decreased by 1.17 million tons, the carbon storage of grassland increased by 1.05 million tons, and the carbon storage of construction land increased by 0.10 million tons. During 2060–2070, the total carbon storage of Anhui Province decreased by 0.59 million tons, of which the carbon storage of cultivated land decreased by 0.46 million tons, the carbon storage of woodland decreased by 1.33 million tons, the carbon storage of grassland increased by 1.06 million tons, and the carbon storage of construction land increased by 0.14 million tons.
Between 2030 and 2070, carbon stocks were reduced by 1.54 million tons, a decrease of 0.133%. Cultivated land carbon storage increased by 2.06 million tons, an increase of 0.27%. Forest land carbon storage decreased by 6.27 million tons, a decrease of 0.53%. Grassland carbon storage increased by 1.61 million tons, an increase of 0.17%. Construction land carbon storage increased by 1.08 million tons, an increase of 0.10%. During this 40-year period, cultivated land carbon storage first increased and then decreased, reaching a peak of 758.23 million tons in 2050. Carbon storage in forest land decreased continuously, and carbon storage in grassland decreased first and then increased, reaching the lowest level in 2040 (232.45 million tons). The carbon storage of construction land was increasing.

4. Discussion

From the perspective of land use, under the SSP1-2.6 scenario, the reason for the decrease in carbon storage in Anhui Province from 2030 to 2070 is that a large portion of forest land with high carbon density was converted to farmland and grassland with low carbon density, and a considerable portion of farmland was converted to construction land with low carbon density. However, due to the shift of a large amount of grassland area to farmland and forest land, the overall reduction in carbon storage was not significant. Under the SSP2-4.5 scenario, the main reason for the increase in carbon storage in Anhui Province from 2030 to 2070 is that a large amount of grassland with low carbon density was converted into forest land, farmland, and construction land with high carbon density, resulting in a continuous increase in overall carbon storage. As a considerable amount of forest land area was transferred to grassland and farmland, the growth in carbon storage was limited. Under the SSP5-8.5 scenario, the main reason for the decrease in carbon storage in Anhui Province from 2030 to 2070 is that a large area of forest land with high carbon density was shifted to grassland with low carbon density, and a portion of farmland with high carbon density was shifted to grassland with low carbon density and construction land, resulting in decreased carbon storage in farmland. Hou et al. [49] believe that 2050 is the critical point for human land use change. We can also see in Table 6 and Table 7 that there were fluctuations in carbon storage in Anhui Province in 2050.
In this study, we found that land type transfer was mainly characterized by mutual conversion between forest land, grassland, and cultivated land. The expansion of construction land led to a decrease in carbon storage, which was consistent with the research results of Wu et al. [50]. Forest land and arable land were the main carbon storage areas, which was consistent with the research results of Gong et al. [51]. Li et al. [52] found that forest vegetation in Anhui Province was the main contributor to carbon sequestration. Forest land is high-carbon density ecological land, and Anhui Province has achieved significant results since the implementation of ecological engineering. However, with the rapid development of urbanization, the development of tourism projects in scenic areas, and the establishment of resorts, the phenomena of logging, deforestation, reclamation, and land reclamation still occur in mountainous areas, resulting in a significant loss of carbon reserves. Therefore, in any scenario in which more forest land is converted, carbon storage will decrease. This finding was the same as the research results of Sun et al. [9]. Land use was the dominant factor in carbon storage transfer, which was consistent with the research results of Wei et al. [53]. Due to the global scope of the SSP scenarios, they may not necessarily be applicable to carbon development in various countries and regions. Based on the changes in carbon storage from 2030 to 2070, we conclude that Anhui Province may be more suitable for the SSP2-4.5 development path in order to achieve low-carbon development.
The impact of land use cover change on the overall carbon storage is not simply a positive or negative correlation. Therefore, adopting a scientific and reasonable land use planning implementation plan can not only maximize the protection of the natural environment, but also promote regional socio-economic development. Compared with traditional land use simulation predictions, this study established three different land use development scenarios, providing a more comprehensive theoretical reference for the formulation and development of land use policies. Under the guidance of different development scenarios and goals, there were significant differences in the dynamic process of land use in Anhui Province. While vigorously developing the economy, there is an urgent need to protect farmland and ecology and control the expansion of construction land, since rough use of land by humans will significantly reduce the carbon storage in nature. Due to the serious impact of land type changes on carbon storage, it is necessary to strengthen forest and farmland protection, adjust planting and breeding strategies, improve carbon sequestration levels, and enhance soil carbon sequestration levels in the future. In addition, the consolidation and concentration of rural residential areas, creation of intensive and efficient towns, and limiting the encroachment of construction land on farmland, forests, and grasslands must be guided in a orderly manner.
Natural and socio-economic factors first affect land use and then carbon storage through land use change. This article used the PLUS model to explore the trends of spatiotemporal change in carbon storage in Anhui Province under three future scenarios. Rong et al. [54] also used the PLUS model method to estimate land use changes under future scenarios. In terms of using the InVEST model to estimate carbon storage, the model is based on the estimation of carbon storage by land use type, so it weakens the specific process of carbon cycling and has some uncertainty [2]. The InVEST model estimates carbon storage based on land use and carbon density data from various regions in the four major carbon reservoirs. The accuracy of land use and carbon density data is crucial for accurate estimation of carbon storage. In this study, there was no interannual variation in carbon density, but in reality, carbon density is influenced by a combination of factors, such as vegetation growth, environmental water and heat conditions, and human activities [55]. Carbon density exhibits dynamic differences in different periods. The future development of land use may also be influenced by policies (such as ecological protection red lines, basic farmland protection, etc.) and future planning. The land use impact factors in this study did not include policy and future planning factors. Therefore, further research will focus on the above aspects to make the simulation results more scientific and reliable. From the three future scenarios, it can be seen that human attitudes towards the environment have a significant impact on carbon storage. Therefore, it is necessary to develop ecological and farmland protection policies to reduce environmental damage and increase natural carbon storage. In order to reduce carbon pressure, the government should restrict the development of high-carbon density land to low-carbon density land and protect arable land, forest land, and grassland.

5. Conclusions

This article first used the PLUS model to simulate the land use data of Anhui Province in 2010, and then verified the accuracy of the simulation results against real data. Then, the land use situation in Anhui Province from 2030 to 2070 was simulated under scenarios SSP1-2.6, SSP2-4.5, and SSP5-5.8. Finally, the spatiotemporal distribution of future carbon storage in Anhui Province was simulated using the InVEST model. The research results showed that: the spatial distribution of carbon storage in Anhui Province showed significant heterogeneity under three scenarios from 2030 to 2070. Overall, there was a distribution pattern of high, middle, and low levels in the north, south, and middle regions. The soil carbon storage in Anhui Province accounted for the largest proportion of the total carbon storage and had a significant advantage. The proportion of aboveground carbon storage ranked second. The proportion of underground carbon reserves ranked third. During the period of 2030 to 2070, under the SSP1-2.6 scenario, Anhui Province’s carbon storage decreased by 0.33 million tons, a decrease of 0.029%. Under the SSP2-4.5 scenario, carbon storage increased by 0.25 million tons, an increase of 0.021%. Under the SSP5-8.5 scenario, carbon storage decreased by 1.54 million tons, a decrease of 0.133%.
This study can provide a reference for simulating the carbon storage changes caused by land use changes under different SSP scenarios, thus providing a basis for the future government to implement more effective land policies.

Author Contributions

Conceptualization: J.H.; methodology: G.J.; data curation: G.J.; writing—original draft preparation and review and editing: S.Y. and M.C.; project administration: Y.G. and W.C. All authors have read and agreed to the published version of the manuscript.

Funding

This research was funded by the National Key R&D Program of China (2021YFD1700900), the Special Fund for Top Talents of Henan Agricultural University (30501031), the Henan Soft Science Research Project (232400410328), and the Research Project of Henan Federation of Social Sciences (2023-ZZJH-189).

Data Availability Statement

Not applicable.

Conflicts of Interest

The authors declare no conflict of interest.

References

  1. Shi, S. Study on the Spatiotemporal Evolution of Land Use Carbon Storage in the Huanghuaihai Plain. Master’s Thesis, Hubei University, Wuhan, China, 2019. [Google Scholar]
  2. Mao, Y.F.; Zhou, Q.G.; Wang, T.; Luo, H.R.; Wu, L.J. The spatiotemporal changes and quantitative attribution of carbon storage in the Three Gorges Reservoir area coupled with the PLUS InVEST Geodector model. Resour. Environ. Yangtze River Basin 2023, 32, 1042–1057. [Google Scholar]
  3. Qiu, H.; Wang, J.J. Current situation, problems and countermeasures of forestry carbon sink in Anhui. Agric. Sci. Anhui 2023, 51, 76–79. [Google Scholar]
  4. Xiang, S.J.; Zhang, Q.; Wang, D.; Wang, S.; Wang, Z.F.; Xie, Y.Q.; Gao, M. Response and Vulnerability Analysis of Carbon Storage in the Main Urban Area of Chongqing to Land Use/Cover Change in the Last 20 Years. J. Nat. Resour. 2022, 37, 1198–1213. [Google Scholar]
  5. Zhao, X.C.; Tian, Y.D.; Zhang, X.X. Analysis on spatial-temporal relationship between land use carbon emissions and ecosystem service value of Changzhutan. J. Soil Water Conserv. 2023, 1, 1–11. [Google Scholar] [CrossRef]
  6. Chen, G.S.; Tian, H.Q. Impact of land use/cover change on Carbon cycle of Terrestrial ecosystem. J. Plant Ecol. 2007, 189–204. [Google Scholar]
  7. Cantarello, E.; Newton, A.C.; Hill, R.A. Potential effects of future land-use change on regional carbon stocks in the UK. Environ. Sci. Policy 2010, 14, 40–52. [Google Scholar] [CrossRef]
  8. Chen, F.H.; Wu, S.H.; Cui, P.; Cai, Y.L.; Zhang, Y.L.; Yin, Y.H.; Li, S. Progress in Applied Research on Physical geography and Living Environment in China from 1949 to 2019. J. Geogr. 2020, 75, 1799–1830. [Google Scholar]
  9. Sun, F.H.; Fang, F.M.; Hong, W.L.; Luo, H.; Yu, J.; Fang, L.; Miao, Y.Q. Analysis and prediction of carbon storage evolution in Anhui Province based on PLUS and InVEST models. J. Soil Water Conserv. 2023, 37, 151–158. [Google Scholar]
  10. Han, C.; Zhang, L.X.; Yue, M.T. Analysis of spatiotemporal evolution and influencing factors of carbon emission intensity in Beijing Tianjin Hebei County based on GWR model. J. Hunan Univ. Technol. 2023, 37, 68–77. [Google Scholar]
  11. Wu, P.J.; Liu, X.P.; Li, X.; Chen, Y.M. Assessment of the impact of urban expansion on carbon storage of Terrestrial ecosystem based on InVEST model and cellular automata—Taking Guangdong Province as an example. Geogr. Geogr. Inf. Sci. 2016, 32, 22–28+36+2. [Google Scholar]
  12. Sun, X.X.; Xue, J.H.; Dong, L.N. Spatial and temporal changes and prediction of carbon storage in Nanjing ecosystem based on PLUS model and InVEST model. J. Ecol. Rural Environ. 2023, 39, 41–51. [Google Scholar]
  13. Zhao, S.Q.; Liu, S.G.; Sohl, T.; Young, C.; Werner, J. Land use and carbon dynamics in the southeastern United States from 1992 to 2050. Environ. Res. Lett. 2013, 8, 575–591. [Google Scholar] [CrossRef]
  14. Li, Z.P.; Wang, X.J. Simulation of dynamic changes in soil organic carbon after land use changes in red soil hilly areas. J. Appl. Ecol. 1998, 30–35. [Google Scholar]
  15. Zhang, C.H.; Ju, W.M.; Chen, J.M.; Wang, X.Q.; Yang, L.; Zheng, G. Disturbance-induced reduction of biomass carbon sinks of China’s forests in recent years. Environ. Res. Lett. 2015, 10, 114021. [Google Scholar] [CrossRef]
  16. Xie, X.L.; Sun, B.; Zhou, H.Z.; Li, Z.P.; Li, A.B. Estimation and spatial distribution analysis of soil organic carbon density and storage in China. J. Soil Sci. 2004, 35–43. [Google Scholar]
  17. Chen, L.J.; Liu, G.H.; Li, H.G. Remote sensing dynamic monitoring of net primary productivity of vegetation in China. J. Remote Sens. 2002, 6, 129–135+164. [Google Scholar]
  18. Nelson, E.; Sander, H.; Hawthorne, P.; Conte, M.; Ennaanay, D.; Wolny, S.; Manson, S.; Polasky, S. Projecting global land-use change and its effect on ecosystem service provision and biodiversity with simple models. PLoS ONE 2010, 5, e14327. [Google Scholar] [CrossRef] [PubMed]
  19. Terry, L.; Sohl, B.M.; Zhu, Z.L.; Kristi, L.; Sayler, S.B.; Michelle, B.R.; Todd, H.; Anne, W.; Liu, S.G.; Ronald, K.; et al. A land-use and land-cover modeling strategy to support a national assessment of carbon stocks and fluxes. Appl. Geogr. 2012, 34, 111–124. [Google Scholar]
  20. Fang, J.Y.; Chen, A.P.; Peng, C.H.; Zhao, S.Q.; Ci, L.J. Changes in Forest Biomass Carbon Storage in China Between 1949 and 1998. Science 2001, 292, 2320–2322. [Google Scholar] [CrossRef]
  21. Zhang, M.M.; Liu, M.Y.; Chang, Q.R.; Liu, H.; Zhang, J. Spatial Distribution of Organic Carbon in Topsoil of the Loess Tableland in Shaanxi Province during 1985-2015. J. Nat. Resour. 2018, 33, 2032–2045. [Google Scholar]
  22. Zhao, M.; Yue, T.; Zhao, N.; Sun, X. Spatial distribution of forest vegetation carbon stock in China based on HASM. Acta Geogr. Sin. 2013, 68, 1212–1224. [Google Scholar]
  23. Wu, G.W.; Zhao, Y.L.; Fu, Y.H.; Ni, W.; Zhang, Y.; Yu, J.X. The impact of land use type changes in reclaimed mining areas on vegetation carbon storage. Chin. J. Ecol. Agric. 2015, 23, 1437–1444. [Google Scholar]
  24. Zhao, J.F.; Cao, Y.; Ma, J.Y.; Jiang, Y.Q. NPP and ecological service function evaluation of forest ecosystems in China based on remote sensing and FORCCHN. J. Ecol. Environ. 2018, 27, 1585–1592. [Google Scholar]
  25. Zhao, M.W.; Yue, T.X.; Zhao, N.; Sun, X.F.; Zhang, X.Y. Combining LPJ-GUESS and HASM to simulate the spatial distribution of forest vegetation carbon stock in China. J. Geogr. Sci. 2014, 24, 249–268. [Google Scholar] [CrossRef]
  26. Qiu, J.J.; Tang, H.J. Simulation study on changes of soil organic carbon storage of cultivated land in the northern farming pastoral ecotone: A case study of Inner Mongolia. Chin. J. Ecol. Agric. 2003, 91–93. [Google Scholar]
  27. Zhang, K.Q.; Chen, J.J.; Hou, J.K.; Zhou, G.Q.; You, H.T.; Han, X.W. Research on the sustainable development of Guilin’s carbon reserves by coupling the InVEST and GeoSOS-FLUS models. China Environ. Sci. 2022, 42, 2799–2809. [Google Scholar]
  28. Houghton, A.R.; Nassikas, A.A. Global and regional fluxes of carbon from land use and land cover change 1850–2015. Glob. Biogeochem. Cycles 2017, 31, 456–472. [Google Scholar] [CrossRef]
  29. Nelson, E.; Mendoza, G.; Regetz, J. Modeling Multiple Ecosystem Services, Biodiversity Conservation, Commodity Production, and Tradeoffs at Landscape Scales. Front. Ecol. Environ. 2009, 7, 4–11. [Google Scholar] [CrossRef]
  30. Baral, H.; Keenan, R.J.; Sharma, S.K.; Stork, N.E.; Kasel, S. Spatial assessment and mapping of biodiversity and conservation priorities in a heavily modified and fragmented production landscape in north-central Victoria, Australia. Ecol. Indic. 2014, 36, 552–562. [Google Scholar] [CrossRef]
  31. Babbar, D.; Areendran, G.; Sahana, M.; Sarma, K.; Raj, K.; Sivadas, A. Assessment and prediction of carbon sequestration using Markov chain and InVEST model in Sariska Tiger Reserve, India. J. Clean. Prod. 2021, 278, 123333. [Google Scholar] [CrossRef]
  32. Michel, O.O.; Yu, Y.; Fan, W.Y.; Lubalega, T.; Chen, C.; Sudi, K.C.K. Impact of Land Use Change on Tree Diversity and Aboveground Carbon Storage in the Mayombe Tropical Forest of the Democratic Republic of Congo. Land 2022, 11, 787. [Google Scholar] [CrossRef]
  33. Feng, Y.J.; Chen, S.R.; Tong, X.H.; Lei, Z.K.; Gao, C.; Wang, J.F. Modeling changes in China’s 2000–2030 carbon stock caused by land use change. J. Clean. Prod. 2020, 252, 119659. [Google Scholar] [CrossRef]
  34. Jiang, W.G.; Deng, Y.; Tang, Z.H.; Lei, X.; Chen, Z. Modelling the potential impacts of urban ecosystem changes on carbon storage under different scenarios by linking the CLUE-S and the InVEST models. Ecol. Model. 2017, 345, 30–40. [Google Scholar] [CrossRef]
  35. Gao, J.; Wang, L. Embedding spatiotemporal changes in carbon storage into urban agglomeration ecosystem management—A case study of the Yangtze River Delta, China. J. Clean. Prod. 2019, 237, 117764.1–117764.12. [Google Scholar] [CrossRef]
  36. Xia, H.Q.; Hong, X.; Gui, X.; Shen, G.P.; Deng, L.; Yao, Z.H.; Peng, P.; Chu, Y.Z.; Xu, S.; Xu, W. Research on carbon fixation capacity and influencing factors of Wuhu City based on InVEST model. Water Soil Conserv. Bull. 2023, 1–10. [Google Scholar] [CrossRef]
  37. Wang, R.; He, R.H.; Luan, Q.; Wang, J.Z.; Yang, B. Response of soil carbon storage of Chuzhou Terrestrial ecosystem to land use change. Land Nat. Resour. Res. 2015, 7–11. [Google Scholar] [CrossRef]
  38. Chen, F.R.; Liang, H.X.; Xing, R.H.; Tao, C.J.; Jia, S.J. Research on Soil Carbon Fixation Potential and Organic Carbon Sink (Source) in Anhui Province. Soil Bull. 2017, 48, 843–851. [Google Scholar]
  39. Liu, X.J.; Li, X.; Liang, X.; Shi, H.; Ou, J.P. Simulation of Future Land Use Change and Its Impact on Carbon Storage in China Based on the FLUS InVEST Model. Trop. Geogr. 2019, 39, 397–409. [Google Scholar]
  40. Liang, X.; Guan, Q.F.; Clarke, K.C.; Liu, S.S.; Wang, B.Y.; Yao, Y. Understanding the drivers of sustainable land expansion using a patch-generating land use simulation (PLUS) model: A case study in Wuhan, China. Comput. Environ. Urban Syst. 2021, 85, 101569. [Google Scholar] [CrossRef]
  41. Xu, L.F.; Liu, X.; Tong, D.; Liu, Z.X.; Yin, L.R.; Zheng, W.F. Forecasting Urban Land Use Change Based on Cellular Automata and the PLUS Model. Land 2022, 11, 652. [Google Scholar] [CrossRef]
  42. Gao, L.N.; Tao, F.; Liu, R.R.; Wang, Z.L.; Leng, H.J.; Zhou, T. Multi-scenario simulation and ecological risk analysis of land use based on the PLUS model: A case study of Nanjing. Sustain. Cities Soc. 2022, 85, 104055. [Google Scholar] [CrossRef]
  43. Geng, S.; Yang, Z.; Dang, X.; Sui, B.; Cao, X.; Li, P.; Zheng, Z. Multi scenario simulation of land use in Ningxia based on SD-FLUS model. J. Earth Sci. Environ. 2023, 45, 806–818. [Google Scholar]
  44. Piyathilake, I.D.U.H.; Udayakumara, E.P.N.; Ranaweera, L.V.; Gunatilake, S.K. Modeling predictive assessment of carbon storage using InVEST model in Uva province, Sri Lanka. Model. Earth Syst. Environ. 2021, 8, 2213–2223. [Google Scholar] [CrossRef]
  45. Hou, H.Y.; Dai, E.F.; Zhang, M.Q. Research progress in application of InVEST model. J. Cap. Norm. Univ. Nat. Sci. Ed. 2018, 39, 62–67. [Google Scholar]
  46. Li, J.P.; Xia, S.X.; Yu, X.B.; Li, S.X.; Xu, C.; Zhao, N.; Wang, S.T. Research on carbon storage of Terrestrial ecosystem in Hebei Province based on InVEST model. J. Ecol. Rural Environ. 2020, 36, 854–861. [Google Scholar]
  47. Nel, L.; Boeni, A.F.; Prohászka, V.J.; Szilágyi, A.; Tormáné Kovács, E.; Pásztor, L.; Centeri, C. InVEST Soil Carbon Stock Modelling of Agricultural Landscapes as an Ecosystem Service Indicator. Sustainability 2022, 14, 9808. [Google Scholar] [CrossRef]
  48. Zhang, Y.; Shi, X.Y.; Tang, Q. Assessment of carbon storage in the upper reaches of the Fenhe River under different land use scenarios. J. Ecol. 2021, 41, 360–373. [Google Scholar]
  49. Hou, H.; Zhou, B.; Pei, F.; Hu, G.; Su, Z.; Zeng, Y.; Zhang, H.; Gao, Y.; Luo, M.; Li, X. Future Land Use/Land Cover Change Has Nontrivial and Potentially Dominant Impact on Global Gross Primary Productivity. Earth’s Future 2022, 10, e2021EF002628. [Google Scholar] [CrossRef]
  50. Wu, N.; Chen, N.; Cheng, P.; Song, T. Response of changes in carbon storage of terrestrial ecosystems in Anhui Province to future land cover scenarios. Resour. Environ. Yangtze River Basin 2023, 32, 415–426. [Google Scholar]
  51. Gong, S.; Zhang, Y.; Li, Y. Carbon storage changes and prediction in the Beijing Tianjin Hebei region based on the PLUS InVEST model. Resour. Environ. Arid Reg. 2023, 37, 20–28. [Google Scholar]
  52. Li, A.Q.; Wang, H.R.; Wang, J.J.; Teng, Z.; Xu, X.N. Forest vegetation carbon storage, carbon density dynamics, and carbon sequestration potential in Anhui Province. J. Jiangxi Agric. Univ. 2019, 41, 953–962. [Google Scholar]
  53. Wei, Z.; Dong, B.; Xu, H.; Xu, Z.; Lu, Z.; Liu, X. The spatiotemporal evolution and scenario prediction of carbon storage in typical wetlands in the Poyang Lake region. Water Soil Conserv. Bull. 2023, 43, 290–300. [Google Scholar] [CrossRef]
  54. Rong, T.; Zhang, P.; Zhu, H.; Jiang, L.; Li, Y.; Liu, Z. Spatial correlation evolution and prediction scenario of land use carbon emissions in China. Ecol. Inform. 2022, 71, 101802. [Google Scholar] [CrossRef]
  55. Ke, X.L.; Tang, L.P. The impact of the coupling of urban expansion and farmland protection on the carbon storage of Terrestrial ecosystem—Taking Hubei Province as an example. J. Ecol. 2019, 39, 672–683. [Google Scholar]
Figure 1. The contribution of driving factors to the area growth of different land use types. (a) cropland, (b) woodland, (c) grassland, (d) building land.
Land 12 01668 g001
Figure 2. Land use simulation under different SSP scenarios in Anhui Province from 2030 to 2070.
Land 12 01668 g002
Figure 3. Simulation of spatial distribution of carbon stocks under different SSP scenarios in Anhui Province from 2030 to 2070.
Land 12 01668 g003
Table 1. Data sources.
Data TypeDataData Sources
Land use dataLand use dataResource and Environmental Science Data Center (RESDC) of the Chinese Academy of Sciences (https://www.resdc.cn/ (accessed on 10 June 2023))
Natural factorsDEMGeospatial Data Cloud (https://www.gscloud.cn/ (accessed on 10 June 2023))
Slope
Slope aspect
Annual average precipitationResource and Environmental Science Data Center of the Chinese Academy of Sciences (https://www.resdc.cn/ (accessed on 10 June 2023))
Soil oxygen contentHarmonized World Soil Database v 1.2 (https://webarcgive.Iiasa.ac.at/Research (accessed on 10 June 2023))
Soil salt content
Workability of soil
Socio-economic factorsGDPResource and Environmental Science Data Center of the Chinese Academy of Sciences (https://www.resdc.cn/ (accessed on 10 June 2023))
Population
Distance to cityOpenStreetMap (https://www.openstreetmap.org/ (accessed on 10 June 2023)) ArcGIS Euclidean distance analysis
Distance to township
Distance to highway
Distance to national road
Distance to railway
Distance to river
Table 2. Carbon density of various types of land in Anhui Province (t/hm2).
Aboveground Carbon DensityUnderground Carbon DensitySoil Carbon Density
Cropland1.90.3889.9
Woodland32.286.5763.9
Grassland4.389.452.5
Water bodies000
Building land0073
Unused land0041.41
Table 3. Land use transfer matrix under SSP1-2.6 scenario in Anhui Province from 2030 to 2070 (km2).
CroplandWoodlandGrasslandWater BodiesBuilding LandUnused LandTotal Transferred Out
Cropland61,387.950.00591.390.00149.280.0062,128.63
Woodland61.7210,162.78623.690.000.000.0010,848.20
Grassland1283.9883.9727,927.560.00241.870.0029,537.38
Water bodies0.000.000.004296.930.000.004296.93
Building land0.000.000.000.003580.660.003580.66
Unused land0.721.442.150.000.000.004.31
Transferred to total62,734.3710,248.1929,144.804296.933971.810.00/
Table 4. Land use transfer matrix under SSP2-4.5 scenario in Anhui Province from 2030 to 2070 (km2).
CroplandWoodlandGrasslandWater BodiesBuilding LandUnused LandTotal Transferred Out
Cropland57,823.800.72394.740.0058.130.0058,277.39
Woodland22.259489.57410.530.000.000.009922.35
Grassland965.3249.5224,719.390.00107.660.0025,841.89
Water bodies0.000.000.003897.890.000.003897.89
Building land0.000.000.000.002778.260.002778.26
Unused land0.000.000.000.000.000.000.00
Transferred to total58,811.379539.8125,524.663897.892944.050.00/
Table 5. Land use transfer matrix under SSP5-8.5 scenario in Anhui Province from 2030 to 2070 (km2).
CroplandWoodlandGrasslandWater BodiesBuilding LandUnused LandTotal Transferred Out
Cropland58,171.170.00272.730.0044.500.0058,488.40
Woodland54.559404.16422.730.000.000.009881.44
Grassland423.4520.1025,143.560.0050.960.0025,638.06
Water bodies0.000.000.003897.890.000.003897.89
Building land0.000.000.000.002806.250.002806.25
Unused land2.150.000.720.000.722.155.74
Transferred to total58,651.329424.2625,839.743897.892902.422.15/
Table 6. Future carbon storage under SSP1-2.6 scenario in Anhui Province (million tons).
CroplandWoodlandGrasslandBuilding LandTotal Carbon Storage
Carbon StockPercentageCarbon StockPercentageCarbon StockPercentageCarbon StockPercentage
2030732.6563.65%139.0112.08%246.1721.39%33.282.89%1151.13
2040734.6863.83%136.4711.86%244.3521.23%35.503.08%1151.02
2050734.2863.84%134.3411.68%245.1821.32%36.413.17%1150.23
2060737.5164.10%132.7411.54%243.7221.18%36.613.18%1150.59
2070739.9264.30%131.3611.41%242.6021.08%36.913.21%1150.80
Table 7. Future carbon storage under SSP2-4.5 scenario in Anhui Province (million tons).
CroplandWoodlandGrasslandBuilding LandTotal Carbon Storage
Carbon StockPercentageCarbon StockPercentageCarbon StockPercentageCarbon StockPercentage
2030752.2765.04%140.1212.11%235.7220.38%28.512.46%1156.62
2040755.0965.25%139.6412.07%233.3820.17%29.192.52%1157.30
2050757.1065.41%138.4311.96%232.1920.06%29.762.57%1157.49
2060757.9665.51%136.2511.78%232.8520.13%29.902.58%1156.97
2070759.4065.64%134.7411.65%232.5220.10%30.212.61%1156.87
Table 8. Future carbon storage under SSP5-8.5 scenario in Anhui Province (million tons).
CroplandWoodlandGrasslandBuilding LandTotal Carbon Storage
Carbon StockPercentageCarbon StockPercentageCarbon StockPercentageCarbon StockPercentage
2030755.1965.26%139.5012.05%233.8120.20%28.692.48%1157.22
2040756.8965.39%138.9412.00%232.4520.08%29.242.53%1157.55
2050758.2365.54%135.7411.73%233.3120.17%29.522.55%1156.82
2060757.7165.53%134.5611.64%234.3620.27%29.622.56%1156.27
2070757.2565.52%133.2311.53%235.4220.37%29.772.58%1155.68
Disclaimer/Publisher’s Note: The statements, opinions and data contained in all publications are solely those of the individual author(s) and contributor(s) and not of MDPI and/or the editor(s). MDPI and/or the editor(s) disclaim responsibility for any injury to people or property resulting from any ideas, methods, instructions or products referred to in the content.

