
Long-Term Dynamics of Viticultural Landscape in Cyprus—Four Centuries of Expansion, Contraction and Spatial Displacement

 ,
,  ,
,  , and
, and 
Abstract
1. Introduction
2. Materials
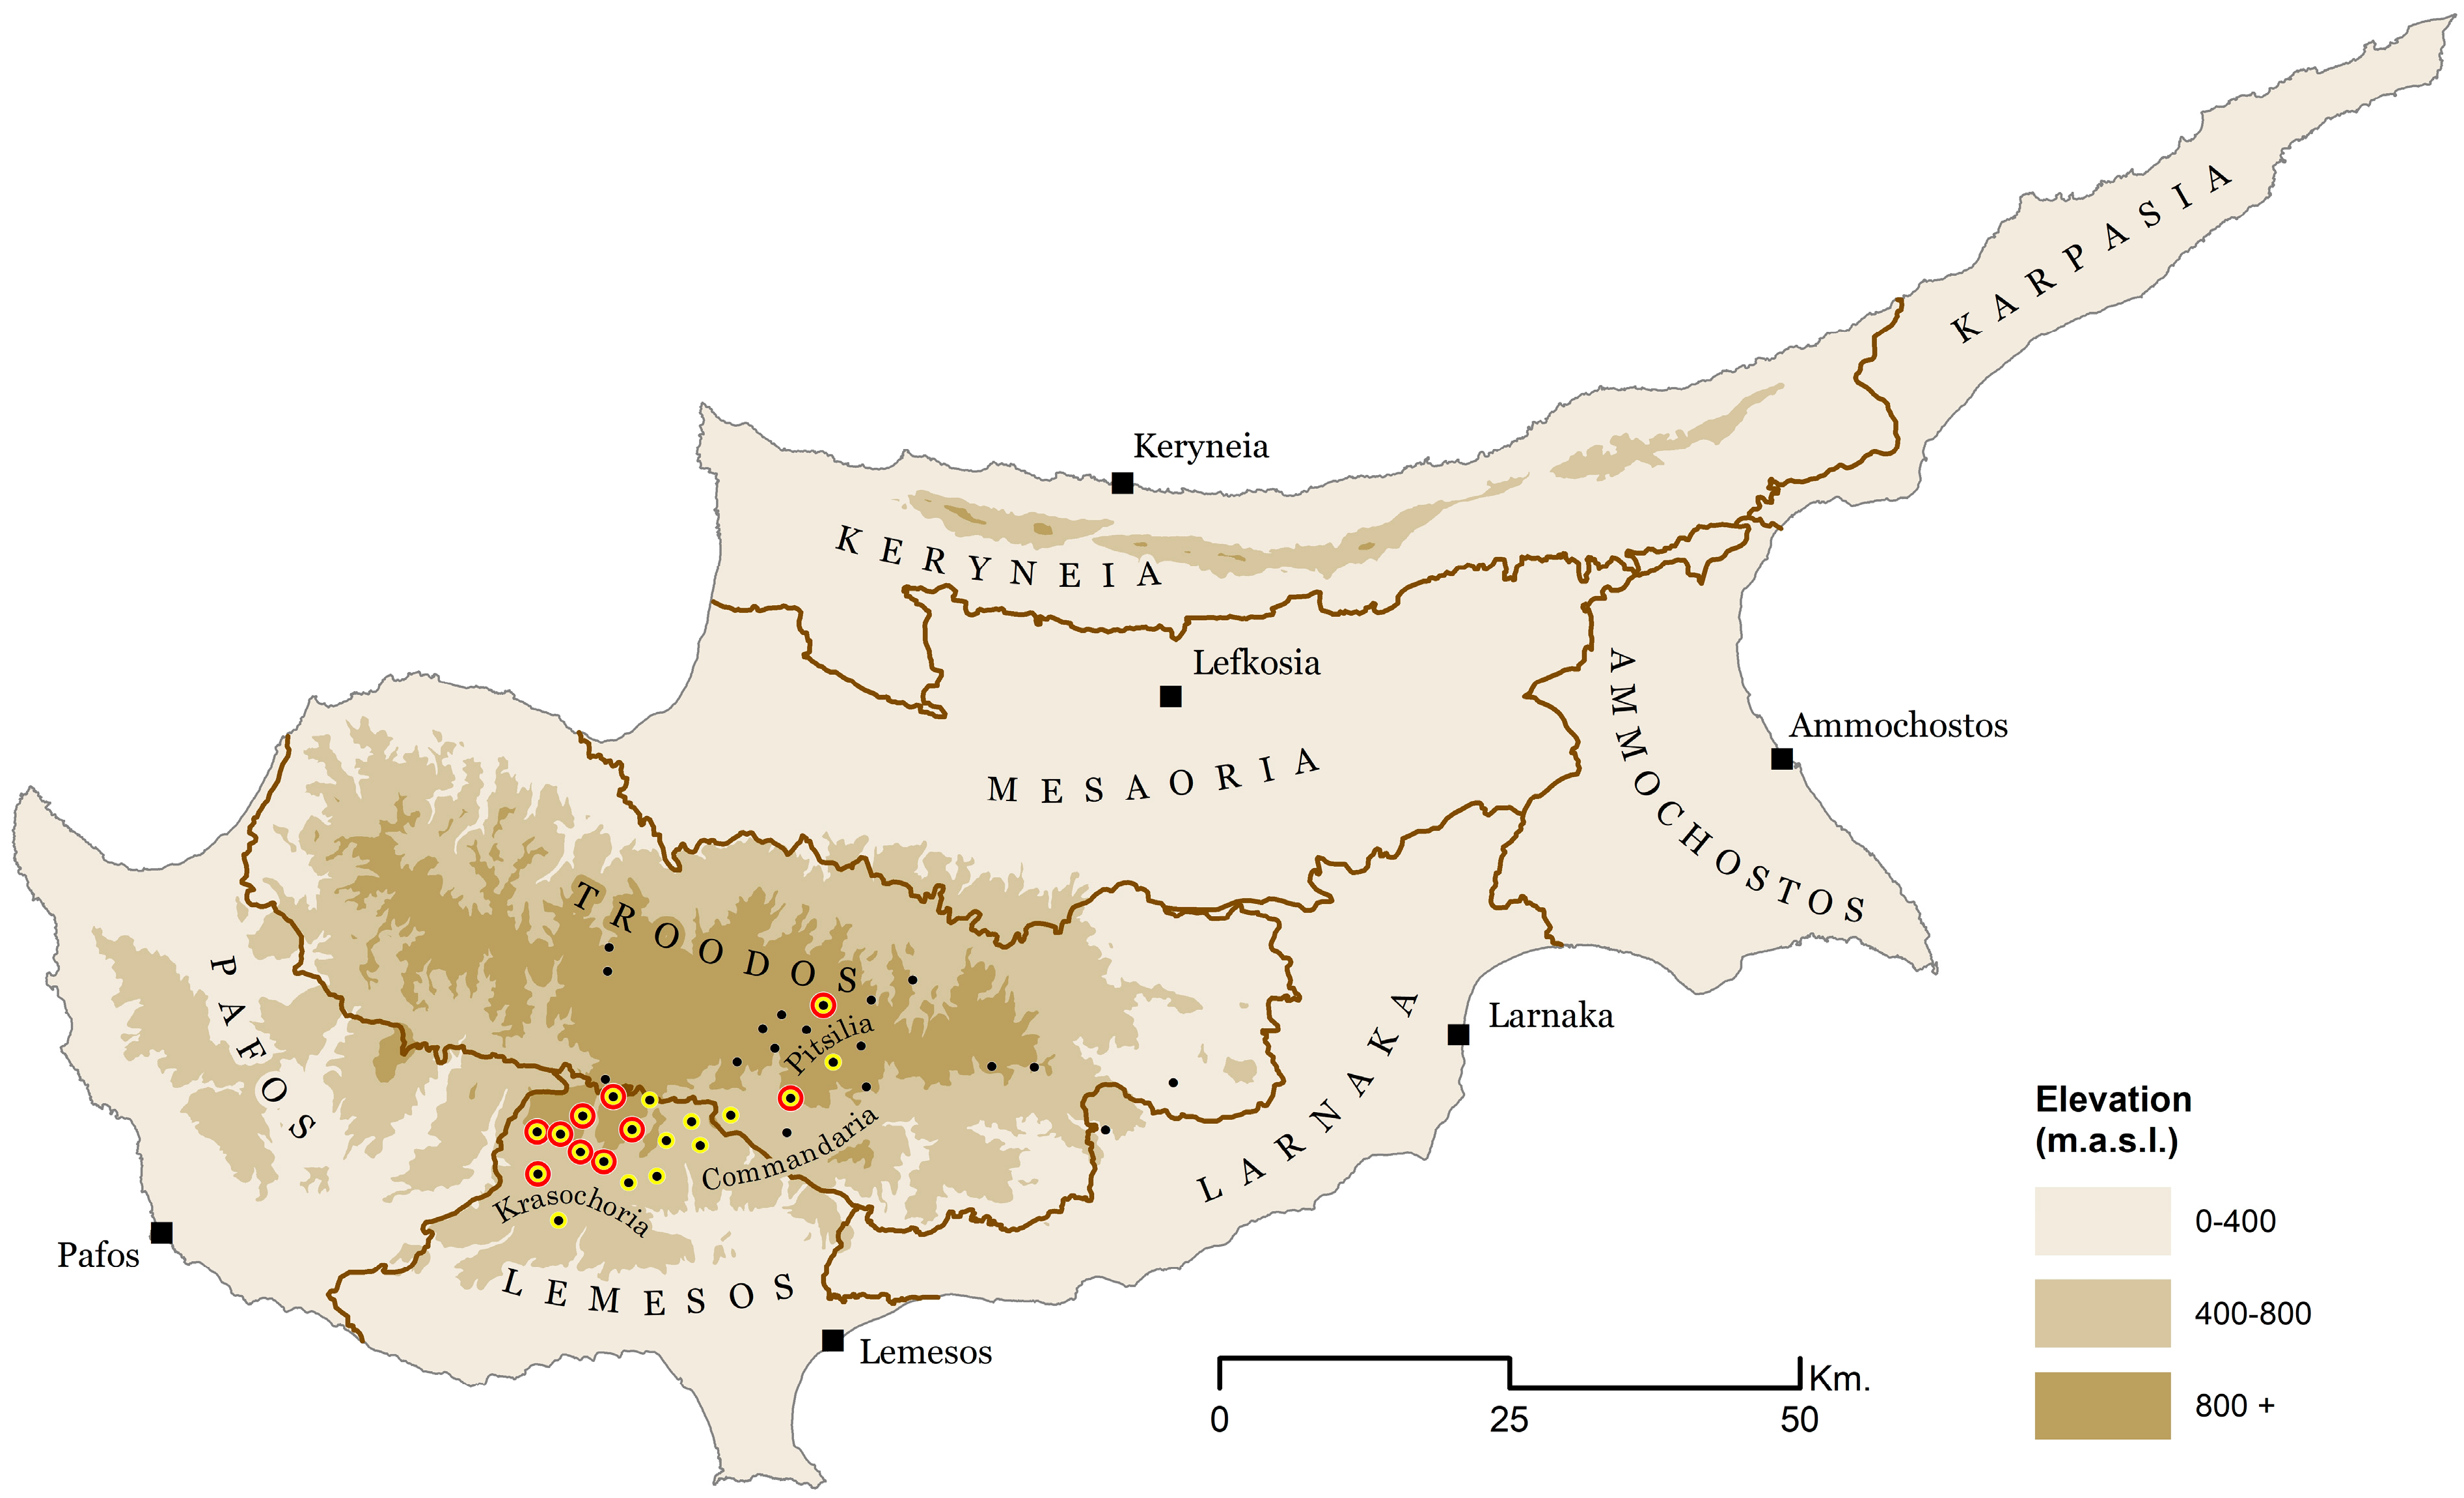
2.1. Study Area
2.2. Sources
2.2.1. Map Data
2.2.2. Censuses/Surveys
2.2.3. Reliability of, and Compatibility, among Sources
3. Methods
3.1. Geodatabase Creation
3.1.1. Map Georeferencing
3.1.2. Censuses Geolocation
3.1.3. Topographic Position Index
3.1.4. Data Integration
3.2. Statistical Analysis
3.2.1. Regression
3.2.2. Spatial Autocorrelation
3.2.3. Weighted Mean Center
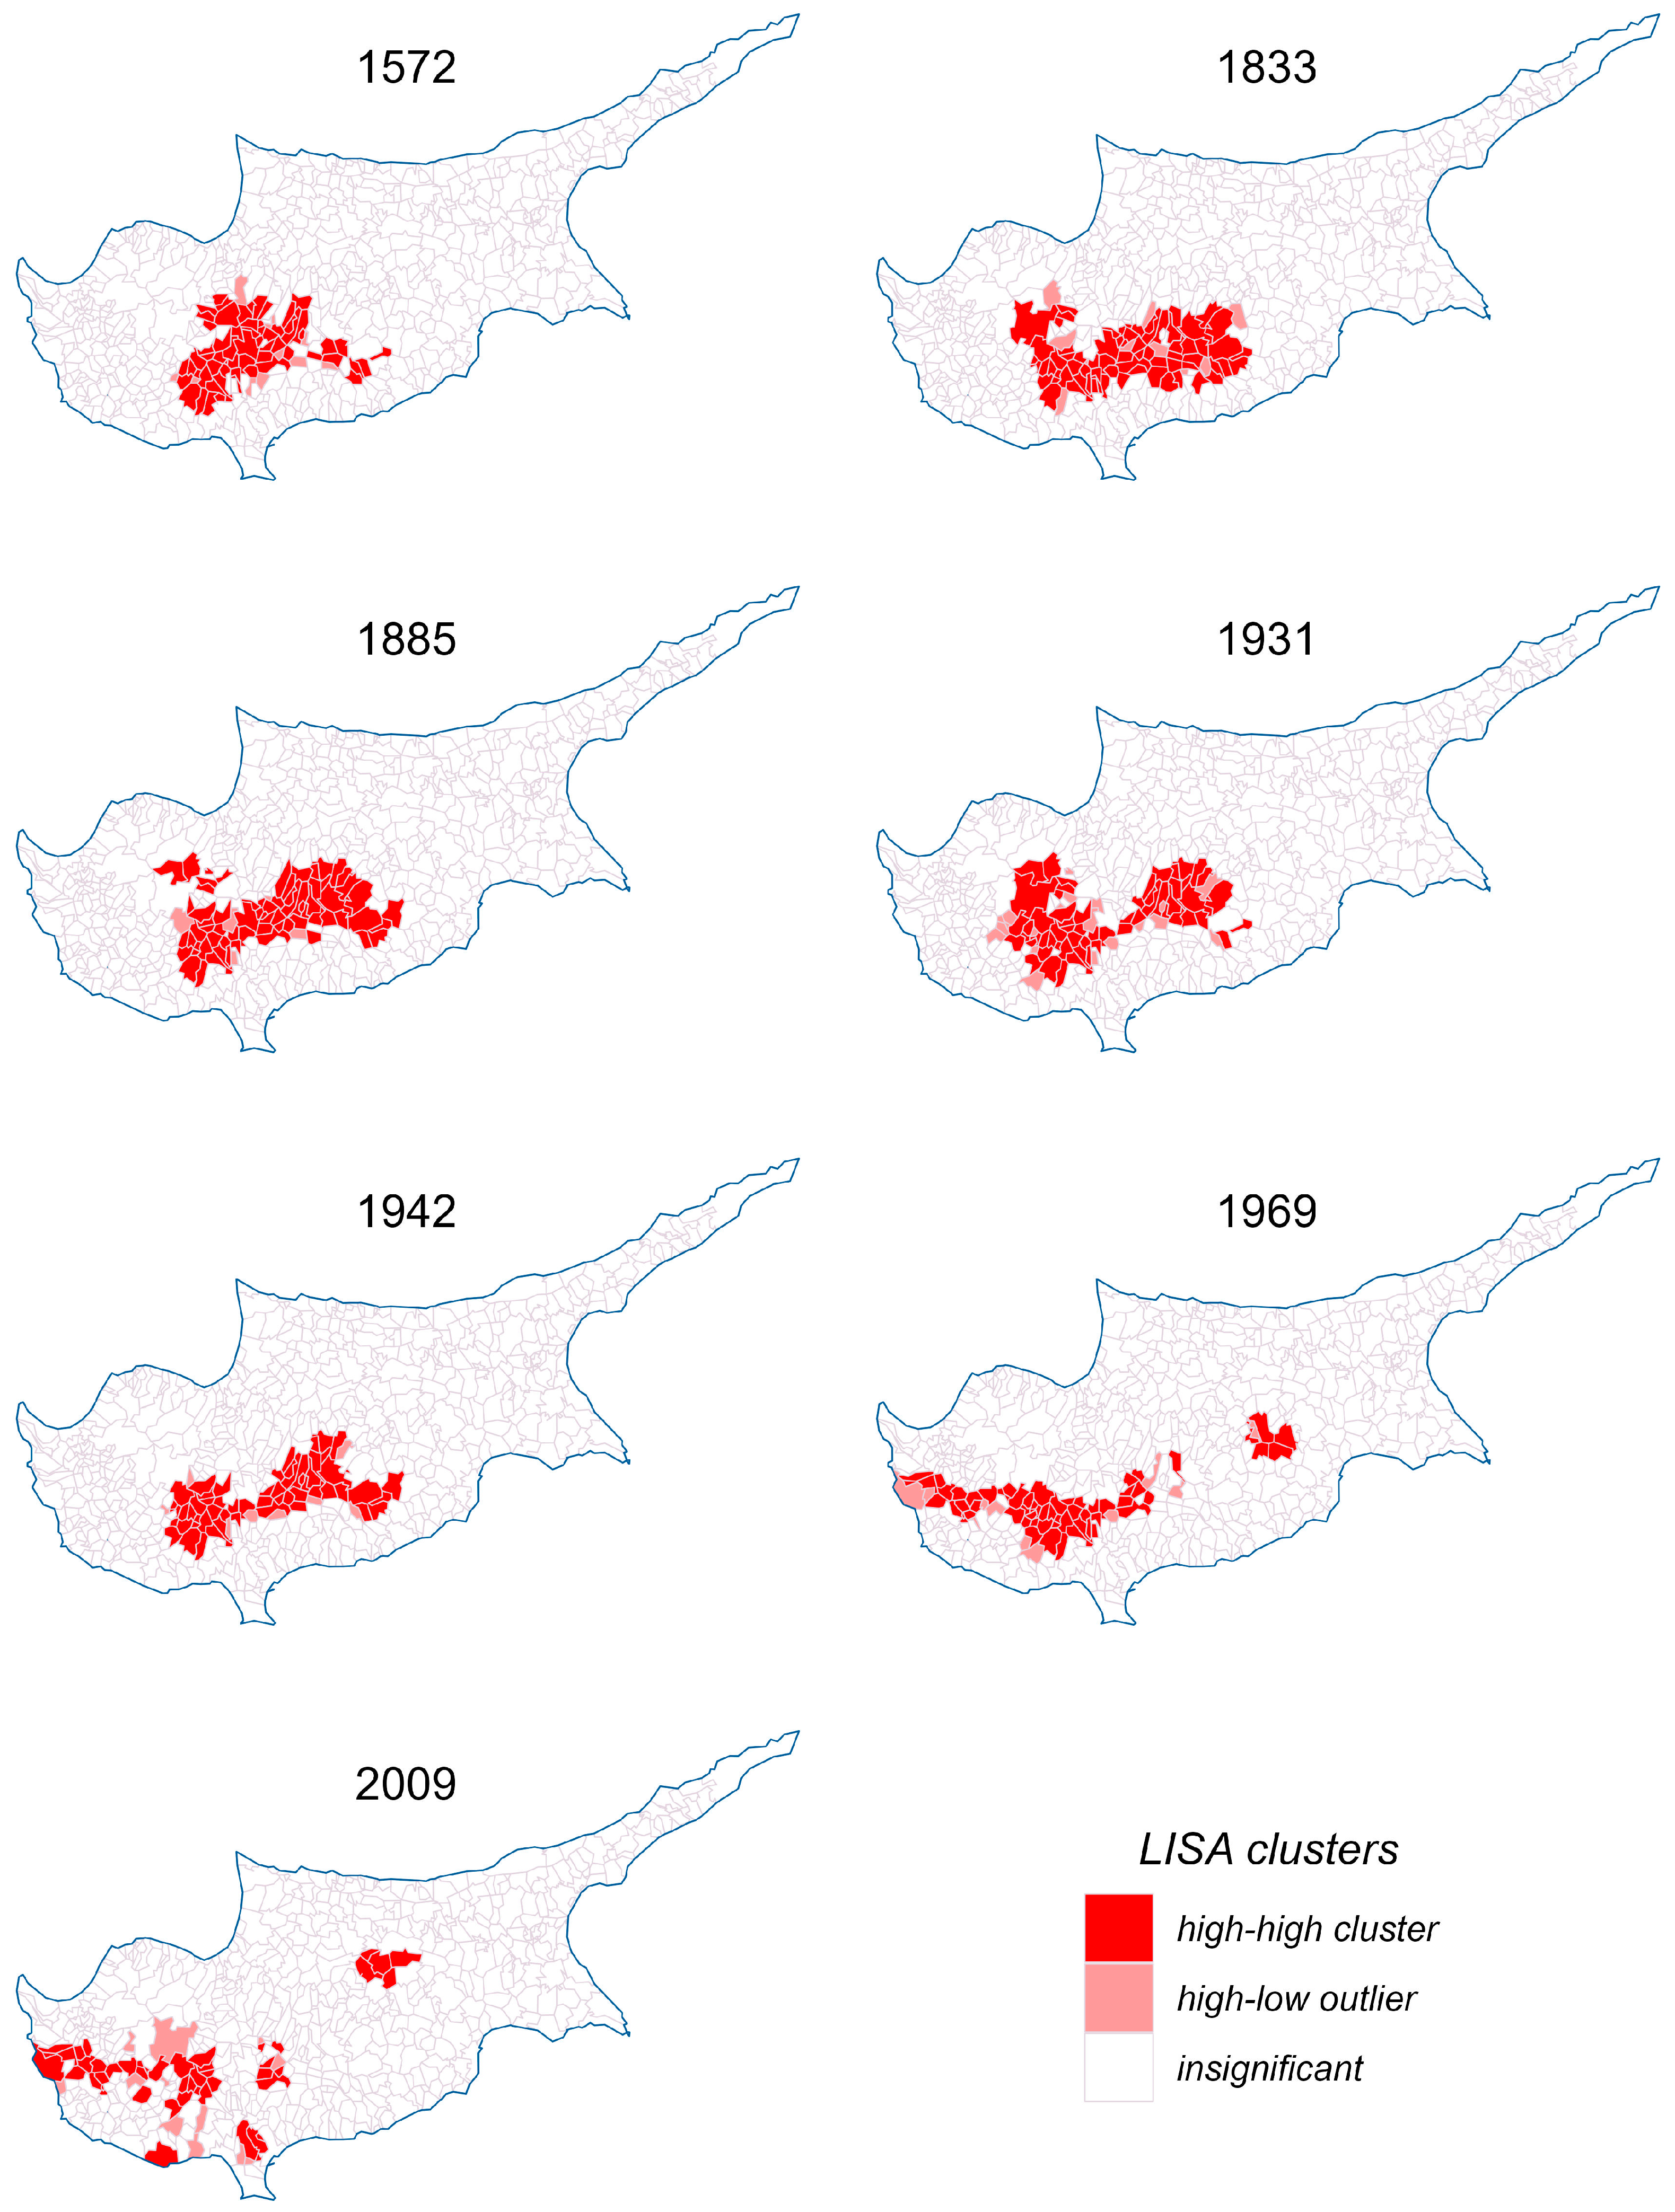
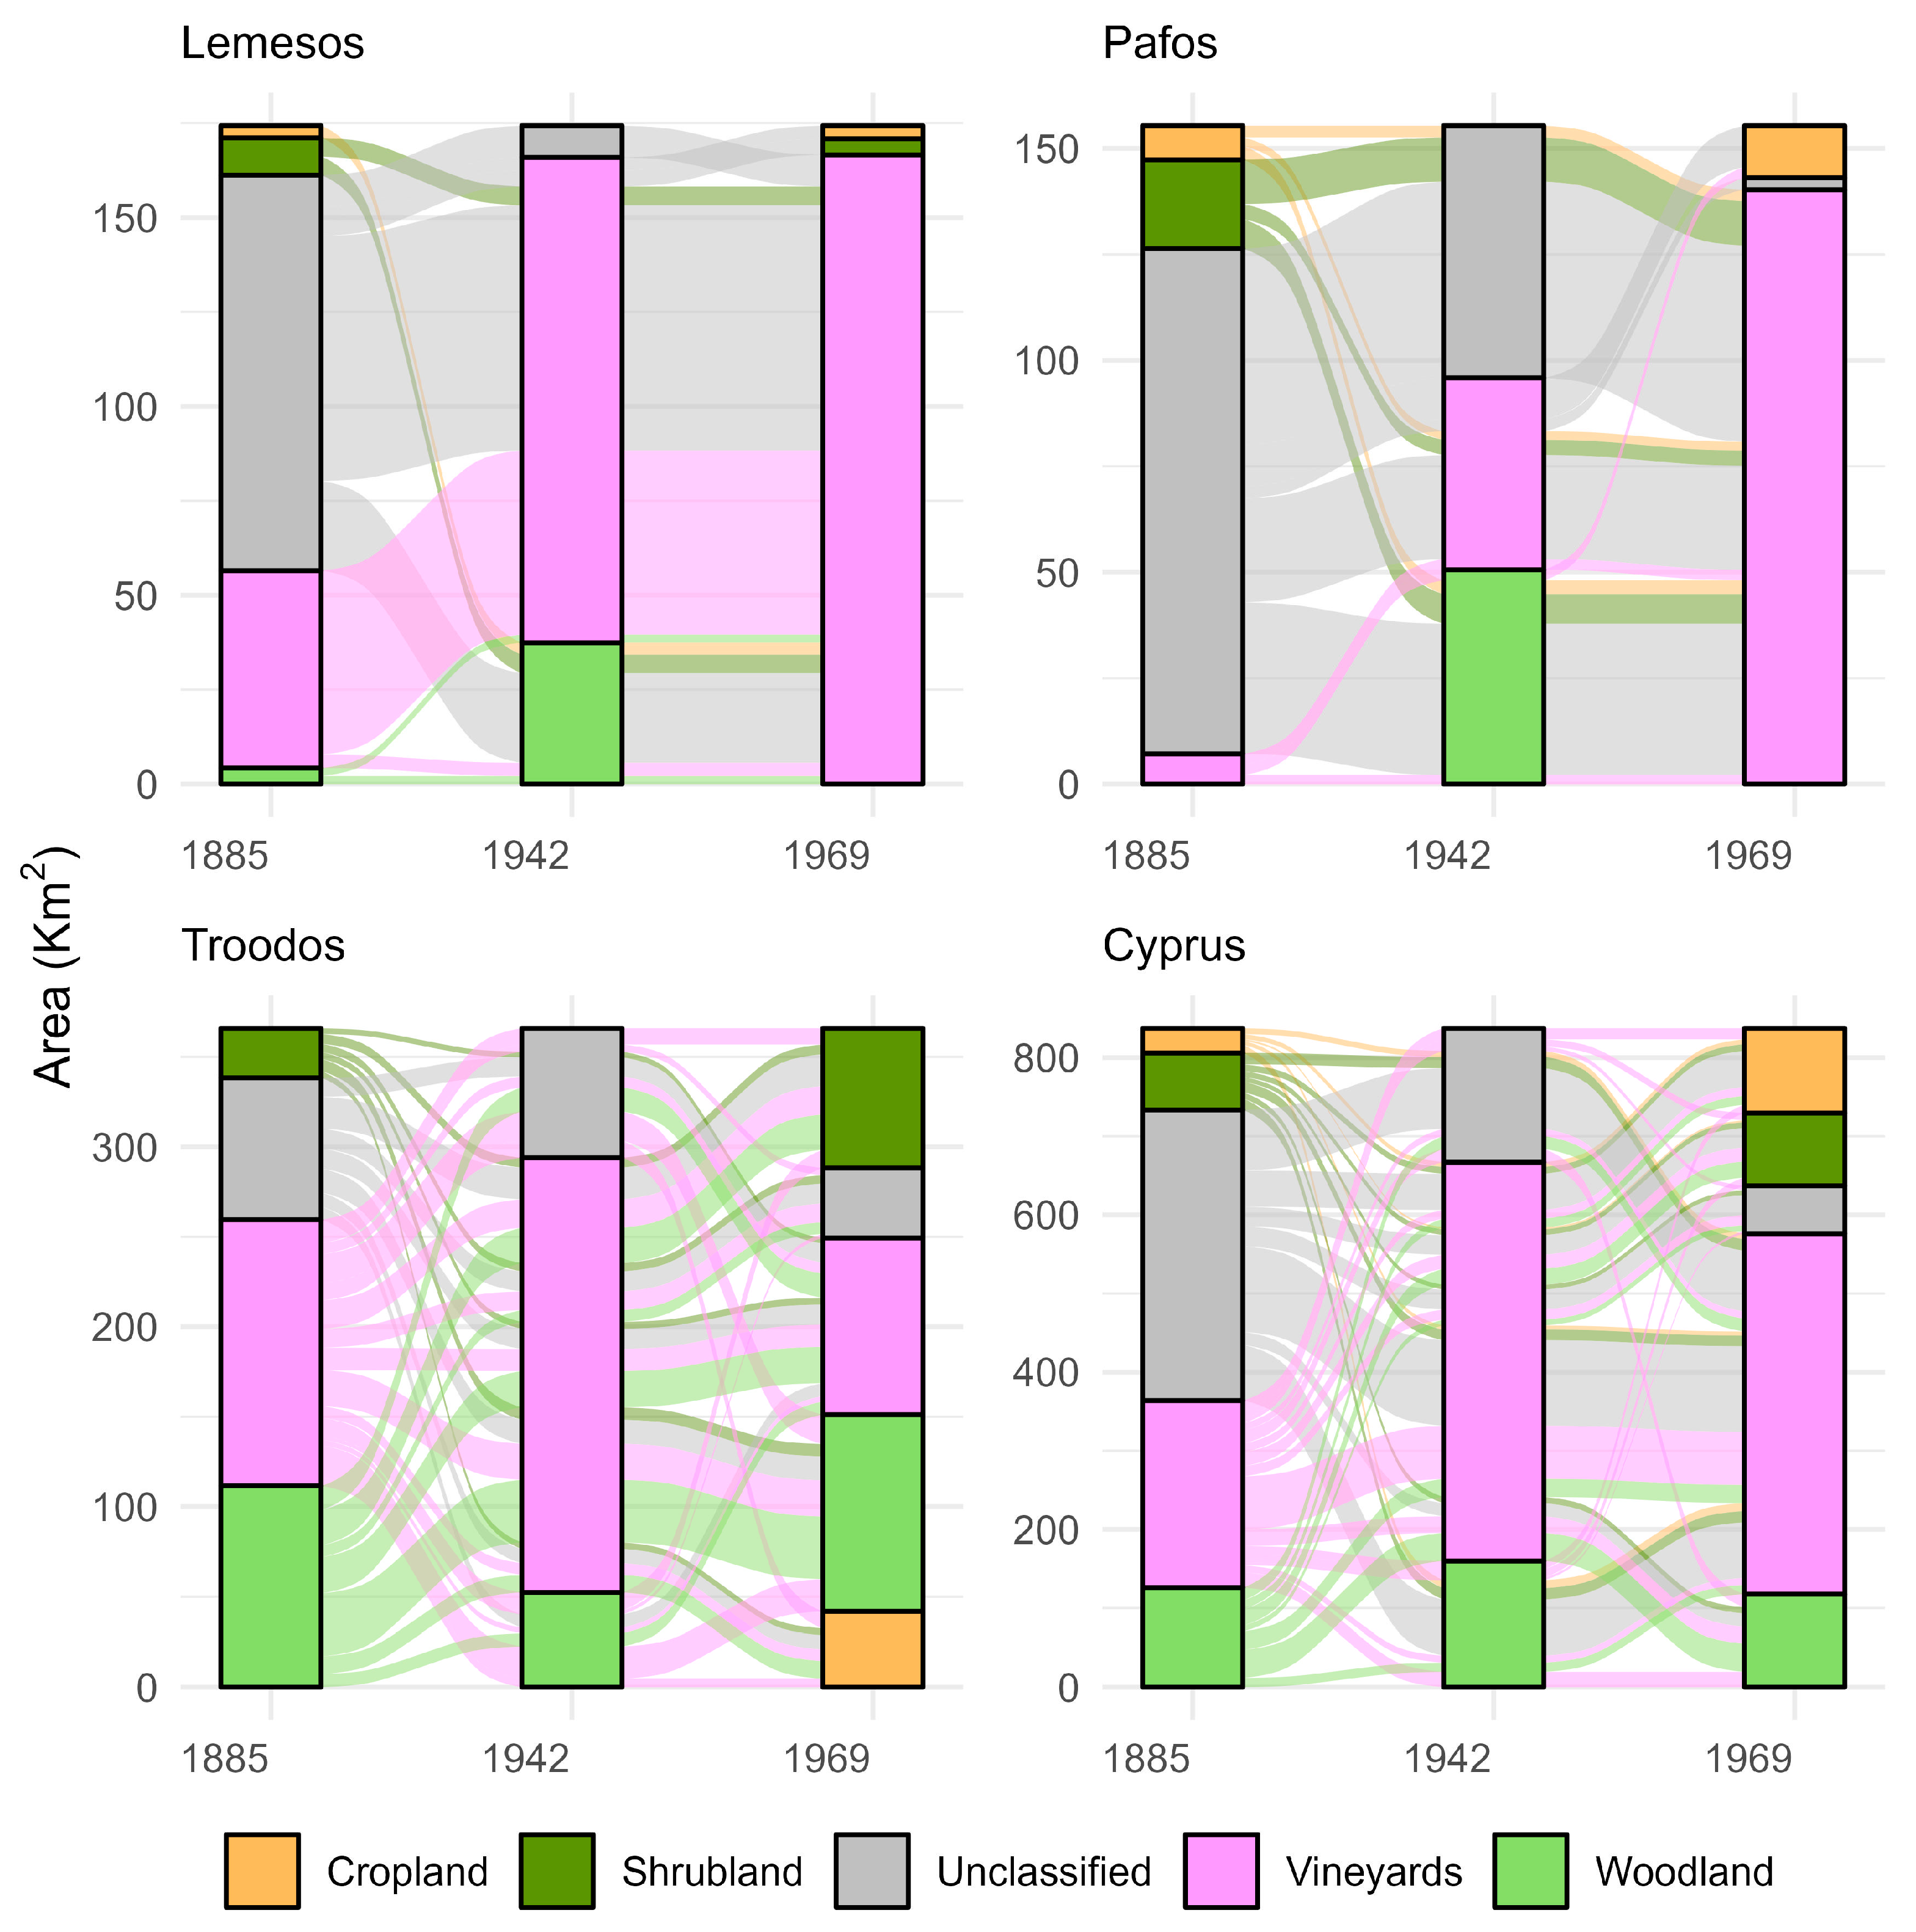
4. Results
5. Discussion
6. Conclusions
Author Contributions
Funding
Data Availability Statement
Acknowledgments
Conflicts of Interest
References
- Plieninger, T.; Draux, H.; Fagerholm, N.; Bieling, C.; Bürgi, M.; Kizos, T.; Kuemmerle, T.; Primdahl, J.; Verburg, P.H. The Driving Forces of Landscape Change in Europe: A Systematic Review of the Evidence. Land Use Policy 2016, 57, 204–214. [Google Scholar] [CrossRef]
- Biró, M.; Bölöni, J.; Molnár, Z. Use of Long-Term Data to Evaluate Loss and Endangerment Status of Natura 2000 Habitats and Effects of Protected Areas. Conserv. Biol. 2018, 32, 660–671. [Google Scholar] [CrossRef] [PubMed]
- Vuorela, N.; Alho, P.; Kalliola, R. Systematic Assessment of Maps as Source Information in Landscape-Change Research. Landsc. Res. 2002, 27, 141–166. [Google Scholar] [CrossRef]
- Levin, N. The Palestine Exploration Fund Map (1871–1877) of the Holy Land as a Tool for Analysing Landscape Changes: The Coastal Dunes of Israel as a Case Study. Cartogr. J. 2006, 43, 45–67. [Google Scholar] [CrossRef]
- Fensham, R.J. Leichhardt’s Maps: 100 Years of Change in Vegetation Structure in Inland Queensland. J. Biogeogr. 2008, 35, 141–156. [Google Scholar] [CrossRef]
- Statuto, D.; Cillis, G.; Picuno, P. Using Historical Maps within a GIS to Analyze Two Centuries of Rural Landscape Changes in Southern Italy. Land 2017, 6, 65. [Google Scholar] [CrossRef]
- Skaloš, J.; Weber, M.; Lipský, Z.; Trpáková, I.; Šantrůčková, M.; Uhlířová, L.; Kukla, P. Using Old Military Survey Maps and Orthophotograph Maps to Analyse Long-Term Land Cover Changes—Case Study (Czech Republic). Appl. Geogr. 2011, 31, 426–438. [Google Scholar] [CrossRef]
- Hill, G. A History of Cyprus. Volume 1: To the Conquest by Richard Lion Heart; Cambridge University Press: Cambridge, UK, 1940. [Google Scholar]
- Unwin, T. Wine and the Vine: An Historical Geography of Viticulture and the Wine Trade; Routledge: Abingdon-on-Thames, UK, 2005. [Google Scholar] [CrossRef]
- Vandyke Price, P. Cyprus Wines as Others Have Known and Loved Them. In Vines and Wines of Cyprus. 4000 Years of Tradition; Vickers, J., Ed.; Vine Products Commission: Limassol, Cyprus, 1993; pp. 73–88. [Google Scholar]
- Zambon, I.; Cerdà, A.; Cividino, S.; Salvati, L. The (Evolving) Vineyard’s Age Structure in the Valencian Community, Spain: A New Demographic Approach for Rural Development and Landscape Analysis. Agriculture 2019, 9, 59. [Google Scholar] [CrossRef]
- McGovern, P.E. Ancient Wine. The Search for the Origins of Viniculture; Princeton University Press: Princeton, NJ, USA, 2019. [Google Scholar]
- Limier, B.; Ivorra, S.; Bouby, L.; Figueiral, I.; Chabal, L.; Cabanis, M.; Ater, M.; Lacombe, T.; Ros, J.; Brémond, L.; et al. Documenting the History of the Grapevine and Viticulture: A Quantitative Eco-Anatomical Perspective Applied to Modern and Archaeological Charcoal. J. Archaeol. Sci. 2018, 100, 45–61. [Google Scholar] [CrossRef]
- Torquati, B.; Giacchè, G.; Venanzi, S. Economic Analysis of the Traditional Cultural Vineyard Landscapes in Italy. J. Rural Stud. 2015, 39, 122–132. [Google Scholar] [CrossRef]
- Taskesenlioglu, M.Y.; Ercisli, S.; Kupe, M.; Ercisli, N. History of Grape in Anatolia and Historical Sustainable Grape Production in Erzincan Agroecological Conditions in Turkey. Sustainability 2022, 14, 1496. [Google Scholar] [CrossRef]
- Narbarte-Hernández, J.; Iriarte, E.; Rad, C.; Tejerizo, C.; Eraso, J.F.; Quirós-Castillo, J.A. Long-Term Construction of Vineyard Landscapes in the Ebro Valley: The Deserted Village of Torrentejo (Basque Country, Spain). CATENA 2020, 187, 104417. [Google Scholar] [CrossRef]
- Macedo, M. Port Wine Landscape: Railroads, Phylloxera, and Agricultural Science. Agric. Hist. 2011, 85, 157–173. [Google Scholar] [CrossRef]
- Quiquerez, A.; Gauthier, E.; Bichet, V.; Petit, C.; Murgia, L.; Richard, H. Reconstructing Patterns of Vegetation Recovery and Landscape Evolution after a Catastrophic Landslide (Mont Granier, French Alps, 1248 CE). Anthropocene 2022, 40, 100352. [Google Scholar] [CrossRef]
- Bonardi, L. Terraced Vineyards in Europe: The Historical Persistence of Highly Specialised Regions; Springer: Cham, Switzerland, 2019; pp. 7–25. [Google Scholar] [CrossRef]
- Greinert, A.; Kostecki, J.; Vystavna, Y. The History of Viticultural Land Use as a Determinant of Contemporary Regional Development in Western Poland. Land Use Policy 2019, 85, 249–258. [Google Scholar] [CrossRef]
- Johnson, H. Vintage: The Story of Wine; Simon and Schuster: New York, NY, USA, 1989. [Google Scholar]
- Schenk, W. Viticulture in Franconia along the River Main: Human and Natural Influences since AD 700. J. Wine Res. 1992, 3, 185–203. [Google Scholar] [CrossRef]
- Lieskovský, J.; Kanka, R.; Bezák, P.; Štefunková, D.; Petrovič, F.; Dobrovodská, M. Driving Forces behind Vineyard Abandonment in Slovakia Following the Move to a Market-Oriented Economy. Land Use Policy 2013, 32, 356–365. [Google Scholar] [CrossRef]
- Kikuchi, Y. Historical Approach to Evaluating Productive Cultural Landscapes: A Case Study of Japanese Vineyard Landscapes. Jpn. Archit. Rev. 2022, 5, 32–43. [Google Scholar] [CrossRef]
- Dobos, A.; Nagy, R.; Molek, Á. Land Use Changes in a Historic Wine Region and Their Connections with Optimal Land-Use: A Case Study of Nagy-Eged Hill, Northern Hungary. Carpathian J. Earth Environ. Sci. 2014, 9, 219–230. [Google Scholar]
- Slámová, M.; Belčáková, I. The Vineyard Landscapes. History and Trends of Viticulture in Case Studies from Slovakia / Los Paisajes de Viñedos. Historia y Tendencias de La Viticultura En Casos de Estudio de Eslovaquia. Pirineos 2020, 175, e056. [Google Scholar] [CrossRef]
- Meyfroidt, P.; Lambin, E.F.; Erb, K.-H.; Hertel, T.W. Globalization of Land Use: Distant Drivers of Land Change and Geographic Displacement of Land Use. Curr. Opin. Environ. Sustain. 2013, 5, 438–444. [Google Scholar] [CrossRef]
- Bürgi, M.; Celio, E.; Diogo, V.; Hersperger, A.M.; Kizos, T.; Lieskovsky, J.; Pazur, R.; Plieninger, T.; Prishchepov, A.V.; Verburg, P.H. Advancing the Study of Driving Forces of Landscape Change. J. Land Use Sci. 2022, 17, 540–555. [Google Scholar] [CrossRef]
- Ellis, E.C.; Kaplan, J.O.; Fuller, D.Q.; Vavrus, S.; Goldewijk, K.K.; Verburg, P.H. Used Planet: A Global History. Proc. Natl. Acad. Sci. USA 2013, 110, 7978–7985. [Google Scholar] [CrossRef] [PubMed]
- Klein Goldewijk, K.; Verburg, P.H. Uncertainties in Global-Scale Reconstructions of Historical Land Use: An Illustration Using the HYDE Data Set. Landsc. Ecol. 2013, 28, 861–877. [Google Scholar] [CrossRef]
- Kizos, T.; Verburg, P.H.; Bürgi, M.; Gounaridis, D.; Plieninger, T.; Bieling, C.; Balatsos, T. From Concepts to Practice: Combining Different Approaches to Understand Drivers of Landscape Change. Ecol. Soc. 2018, 23, 25. [Google Scholar] [CrossRef]
- Munteanu, C.; Kuemmerle, T.; Keuler, N.S.; Müller, D.; Balázs, P.; Dobosz, M.; Griffiths, P.; Halada, L.; Kaim, D.; Király, G.; et al. Legacies of 19th Century Land Use Shape Contemporary Forest Cover. Glob. Environ. Chang. 2015, 34, 83–94. [Google Scholar] [CrossRef]
- Ge, Q.; Dai, J.; He, F.; Zheng, J.; Man, Z.; Zhao, Y. Spatiotemporal Dynamics of Reclamation and Cultivation and Its Driving Factors in Parts of China during the Last Three Centuries. Prog. Nat. Sci. 2004, 14, 605–613. [Google Scholar] [CrossRef]
- Wei, X.; Ye, Y.; Zhang, Q.; Li, B.; Wei, Z. Reconstruction of Cropland Change in North China Plain Area over the Past 300 Years. Glob. Planet. Chang. 2019, 176, 60–70. [Google Scholar] [CrossRef]
- METAKRON Consortium. Study of the Geomorphology of Cyprus. 2010. Available online: http://www.moa.gov.cy/moa/gsd/gsd.nsf/All/395C30D30BC4A078C22588ED0038AAD3?OpenDocument/ (accessed on 23 March 2023).
- United States Army Map Service, Cartographer. Cyprus 1:50,000. [Washington, D.C.: Army Map Service, Army Corps of Engineers, to 1969 Washington: Printed by Army Map Service, Corps of Engineers, 1969], Map. Available online: https://www.loc.gov/item/2017588191/ (accessed on 10 October 2022).
- Great Britain. War Office. General Staff. Geographical Section. Cyprus 1:50,000, 1942, Map. Available online: https://nla.gov.au/nla.obj-233509282 (accessed on 10 October 2022).
- Chalkias, C.; Papadias, E.; Vradis, C.; Polykretis, C.; Kalogeropoulos, K.; Psarogiannis, A.; Chalkias, G. Developing and Disseminating a New Historical Geospatial Database from Kitchener’s 19th Century Map of Cyprus. ISPRS Int. J. Geo-Inf. 2023, 12, 74. [Google Scholar] [CrossRef]
- National Opendata Portal. Available online: https://www.data.gov.cy/node/1393?language=en (accessed on 10 October 2022).
- Χατζηκυριακού, A. Χερσαίο Νησί: H Μεσόγειος Και η Κύπρος Στην Oθωμανική Εποχή Των Επαναστάσεων; ΨHΦΙΔΕΣ: Ελλάδα, Θεσσαλονίκη, 2023. [Google Scholar]
- Θεοχαρίδης, Ι. H Πρώτη Oθωμανική Aπογραφή Της Κύπρου (1572); Εκδόσεις Hλία Επιφανίου: Λευκωσία, Cyprus, 2021. [Google Scholar]
- Hadjikyriacou, A.; Papadias, E.; Vradis, C.; Chalkias, C. Combining Historical Maps and Censuses of Cyprus from the Sixteenth to the Twentieth Century: A Geospatial Approach. Proc. ICA 2021, 3, 7. [Google Scholar] [CrossRef]
- Hart-Davis, C.H. Report of the Census of 1931, Taken on April 27–28, 1931; Government Printing Office: Nicosia, Cyprus, 1932.
- Great Britain, Colonial. Office. The Cyprus Blue Book 1887–1938, 1946; Government Printing Office: Nicosia. Available online: http://www.cyprusdigitallibrary.org.cy/collections/show/3 (accessed on 10 October 2022).
- Percival, D.A. Census of Population and Agriculture 1946 Report; Government Printing Office: Nicosia, Cyprus, 1949.
- Republic of Cyprus. Census of Population and Agriculture, 1960; Government Printing Office: Nicosia, Cyprus, 1962.
- Cyprus Statistical Service. Vines Statistics (Census); Printing Office of the Republic of Cyprus: Nicosia, Cyprus, 2011. Available online: https://library.cystat.gov.cy/Documents/Publication/VINES_STATS-2009-211011.pdf (accessed on 10 October 2022).
- Ünal, u.; kayalar, s. Belgelerle Osmanli Yönetiminde Kibris. Genişletilmiş Ikinci Baski; Türkiye Cumhuriyeti Cumhurbaşkanliği devlet Arşivleri Başkanliği: Istanbul, Turkey, 2020. Available online: https://www.devletarsivleri.gov.tr/Sayfalar/Yayinlar/Yayinlar.aspx (accessed on 2 November 2022).
- Inalcik, H. Introduction to Ottoman Metrology. Turc. Strasbg. 1983, 15, 311–348. [Google Scholar]
- İnalcık, H.; Quataert, D. An Economic and Social History of the Ottoman Empire, 1300-1914, Vol.1; Cambridge University Press: Cambridge, UK, 1994. [Google Scholar]
- Fielding, N.G. Triangulation and Mixed Methods Designs: Data Integration with New Research Technologies. J. Mix. Methods Res. 2012, 6, 124–136. [Google Scholar] [CrossRef]
- Graham, M.; Shelton, T. Geography and the Future of Big Data, Big Data and the Future of Geography. Dialogues Hum. Geogr. 2013, 3, 255–261. [Google Scholar] [CrossRef]
- National Opendata Portal. Available online: https://www.data.gov.cy/node/790?language=en (accessed on 10 October 2022).
- Weiss, A. Topographic Position and Landforms Analysis. In Poster Presentation, ESRI User Conference, San Diego, CA; The Nature Conservancy: Seattle, WA, USA, 2001; Volume 200. Available online: http://www.jennessent.com/downloads/TPI-poster-TNC_18x22.pdf (accessed on 15 February 2023).
- Tağıl, Ş.; Jenness, J. GIS-Based Automated Landform Classification and Topographic, Landcover and Geologic Attributes of Landforms around the Yazoren Polje, Turkey. J. Appl. Sci. 2008, 8, 910–921. [Google Scholar] [CrossRef]
- Argyriou, A.V.; Teeuw, R.M.; Sarris, A. GIS-Based Landform Classification of Bronze Age Archaeological Sites on Crete Island. PLoS ONE 2017, 12, e0170727. [Google Scholar] [CrossRef]
- JAXA EORC. ALOS Global Digital Surface Model “ALOS World 3D—30m” (AW3D30) V3.1 [Data Set]. 2016. Available online: https://www.eorc.jaxa.jp/ALOS/en/index_e.htm (accessed on 12 March 2022).
- Green, J.A. Too Many Zeros and/or Highly Skewed? A Tutorial on Modelling Health Behaviour as Count Data with Poisson and Negative Binomial Regression. Health Psychol. Behav. Med. 2021, 9, 436–455. [Google Scholar] [CrossRef] [PubMed]
- R Core Team. R: A Language and Environment for Statistical Computing; R Foundation for Statistical Computing: Vienna, Austria, 2022; Available online: https://www.R-project.org/ (accessed on 23 March 2023).
- Brooks, M.E.; Kristensen, K.; van Benthem, K.J.; Magnusson, A.; Berg, C.W.; Nielsen, A.; Skaug, H.J.; Maechler, M.; Bolker, B.M. GlmmTMB Balances Speed and Flexibility Among Packages for Zero-Inflated Generalized Linear Mixed Modeling. R. J. 2017, 9, 378–400. [Google Scholar] [CrossRef]
- Hartig, F. DHARMa: Residual Diagnostics for Hierarchical (Multi-Level/Mixed) Regression Models; R Development Core Team: Vienna, Austria, 2022; Available online: https://CRAN.R-project.org/package=DHARMa (accessed on 23 March 2023).
- Zeileis, A.; Kleiber, C.; Jackman, S. Regression Models for Count Data in R. J. Stat. Softw. 2008, 27, 1–25. [Google Scholar] [CrossRef]
- Kleiber, C.; Zeileis, A. Visualizing Count Data Regressions Using Rootograms. Am. Stat. 2016, 70, 296–303. [Google Scholar] [CrossRef]
- Wickham, H. Ggplot2: Elegant Graphics for Data Analysis; Springer: New York, NY, USA, 2016; Available online: https://ggplot2.tidyverse.org (accessed on 23 March 2023).
- Bivand, R.; Wong, D.W.S. Comparing Implementations of Global and Local Indicators of Spatial Association. TEST 2018, 27, 716–748. [Google Scholar] [CrossRef]
- Warren, F. Annual Report of Limassol District after First Year of British Administration; Ψηφιακή Πλατφόρμα Κυπριακής Βιβλιοθήκης: Nicosia, Cyprus, 1879; Available online: http://www.cyprusdigitallibrary.org.cy/items/show/191 (accessed on 15 February 2023).
- Gennadius, P.G. Report on the Agriculture of Cyprus, Part 1; Governmant Printing Office: Nicosia, Cyprus, 1895.
- Meloni, G.; Swinnen, J. The Political Economy of Regulations and Trade: Wine Trade 1860–1970. World Econ. 2018, 41, 1567–1595. [Google Scholar] [CrossRef]
- Mouillefert, P. Translation of a Report on the Vineyards of Cyprus; Government Printing Office: Nicosia, Cyprus, 1893. Available online: https://www.jstor.org/stable/60230144 (accessed on 23 March 2023).
- Bevan, W. Notes on Agriculture in Cyprus and Its Products; Hazell, Watson and Vinery Ld.: London and Aylesbury, UK, 1919; Available online: https://archive.org/details/notesonagricultu00bevarich (accessed on 23 March 2023).
- Myrianthousis, T. The Vine Problem of Cyprus; Agricultural Research Institute, Ministry of Agriculture and Natural Resources: Aglandjia, Cyprus, 1980.
- Zambon, I.; Ferrara, A.; Salvia, R.; Mosconi, E.M.; Fici, L.; Turco, R.; Salvati, L. Rural Districts between Urbanization and Land Abandonment: Undermining Long-Term Changes in Mediterranean Landscapes. Sustainability 2018, 10, 1159. [Google Scholar] [CrossRef]
- Redhouse, J.W. A Turkish and English Lexicon: Shewing in English the Significations of the Turkish Terms; Printed for the American Mission by A.H. Boyajian: Constantinople, Turkey, 1890. [Google Scholar]
- The Statute Laws of Cyprus. No 10. 1901. Available online: http://www.cylaw.org/nomoi/arith/1901_1_010.pdf (accessed on 23 March 2023).
- Shaw, S.J.; Shaw, E.K. The Era of Modern Reform: The Tanzimat, 1839–1876. In History of the Ottoman Empire and Modern Turkey; Cambridge University Press: Cambridge, UK, 1977; Volume 2, pp. 55–171. [Google Scholar] [CrossRef]
- Fourcade, D.; Bonato, L. Mémoire Sur l’état Présent de l’île de Chypre (1844). Cah. Du Cent. D’etudes Chypr. 2000, 30, 127–210. [Google Scholar] [CrossRef]
- Gaudry, A.; Damour, A. Carte Agricole De L’Ile De Chypre. 1854. Available online: https://sylviaioannoufoundation.org/el/collection/digital-library/m0453/ (accessed on 23 March 2023).
- Gaudry, A. Recherches Scientifiques En Orient Entreprises Par Les Ordres Du Gouvernement, Pendant Les Années 1853-1854: Partie Agricole; Impr. Imperiale: Paris, France, 1855. [Google Scholar]
- Christodoulou, D. The Evolution of the Rural Land Use Pattern in Cyprus; Geographical Publications Limited: Bude, UK, 1959. [Google Scholar]
- Triantafyllidou-Baladié, Γ. Το Εμπόριο Και η Oικονομία Της Κρήτης (1669-1795); Βικελαία Βιβλιοθήκη: Ελλάδα, Hράκλειο, 1988. [Google Scholar]
- Greene, M. A Shared World: Christians and Muslims in the Early Modern Mediterranean; Princeton University Press: Princeton, NJ, USA, 2000. [Google Scholar]
- Mariti, G. Del Vino Di Cipro Ragionamento Di Giovanni Mariti Socio Corrispondente Dell’ Accademia Dei Georgofili Di Firenze; Cambiagi: Firenze, Italy, 1772; Available online: https://inspiral.org/en/cyprus/bookpages/?fidf_book=106&fidf_bookpage=all (accessed on 23 March 2023).
- Drummond, A. Travels Through Different Cities of Germany, Italy, Greece, And Several Parts of Asia, as far as The Banks of The Euphrates: In a Series of Letters. Containing, An Account of What is Most Remarkable in Their Present State, as Well as in Their Monuments of Antiquity; HM Consul Aleppo: London, UK, 1754; Available online: https://inspiral.org/en/cyprus/bookpages/?fidf_book=125&fidf_bookpage=all (accessed on 23 March 2023).
- Cobham, C.D. Excerpta Cypria. Meterials for a History of Cyprus; Cambridge University Press: Cambridge, UK, 1908. [Google Scholar]
- Hill, G. A History of Cyprus. Volume 4: The Ottoman Province. The British Colony, 1571–1948; Cambridge University Press: Cambridge, UK, 1952. [Google Scholar]
- Vrontis, D.; Thrassou, A. The Renaissance of Commandaria—A Strategic Branding Prescriptive Analysis. Int. J. Manag. Cases 2011, 14, 302–316. [Google Scholar] [CrossRef]
- Harris, S.A. Colonial Forestry and Environmental History: British policies in Cyprus, 1878–1960. Ph.D. Thesis, The University of Texas at Austin, Austin, TX, USA, August 2007. [Google Scholar]
- Aymes, M. A Provincial History of the Ottoman Empire: Cyprus and the Eastern Mediterranean in the Nineteenth Century; Routledge: Abingdon-on-Thames, UK, 2013. [Google Scholar]
- Braudel, F. The Mediterranean and the Mediterranean World in the Age of Philip II, Vol.1; Collins: New York, NY, USA, 1972. [Google Scholar]
- Tabak, F. The Waning of the Mediterranean, 1550–1870: A Geohistorical Approach; JHU Press: Baltimore, MD, USA, 2008. [Google Scholar]
- Papachristodoulou, S.; Papayiannis, C. Evaluation of the Vine Replanting Project; Agricultural Research Institute, Ministry of Agriculture and Natural Resources: Aglandjia, Cyprus, 1989.
- Panayiotou, G.S. Interregional Variation in Production and Productivity of Wine Grapes in Cyprus; Agricultural Research Institute, Ministry of Agriculture and Natural Resources: Aglandjia, Cyprus, 1980.
- Cyprus Statistical Service. Agricultural Statistics—Timeseries, 1960–2020. Available online: https://www.cystat.gov.cy/en/KeyFiguresList?s=28 (accessed on 8 April 2023).
- Tsangarides, L.M. Economic Influence on the Adjustments of Grape Production and Disposition in Cyprus. Master’s Thesis, Iowa State University, Ames, IA, USA, 1981. [Google Scholar]
- Markou, M.; Papayiannis, C. The Economics of Wine Grape Production in Cyprus, 1995–1996; FAO: Rome, Italy, 1996.
- Afxentiou, G. The Effect of Structural Design on Export Strategy in the Wine Industry of Cyprus. Ph.D. Thesis, University of Gloucestershire, Cheltenham, UK, 2018. [Google Scholar]
- Sluiter, R.; de Jong, S.M. Spatial Patterns of Mediterranean Land Abandonment and Related Land Cover Transitions. Landsc. Ecol. 2007, 22, 559–576. [Google Scholar] [CrossRef]
- Arnaez, J.; Lasanta, T.; Errea, M.P.; Ortigosa, L. Land Abandonment, Landscape Evolution, and Soil Erosion in a Spanish Mediterranean Mountain Region: The Case of Camero Viejo. Land Degrad. Dev. 2011, 22, 537–550. [Google Scholar] [CrossRef]
- Sluis, T.V.D.; Kizos, T.; Pedroli, B. Landscape Change in Mediterranean Farmlands: Impacts of Land Abandonment on Cultivation Terraces in Portofino (Italy) and Lesvos (Greece). J. Landsc. Ecol. 2014, 7, 23–44. [Google Scholar] [CrossRef]
- Pelorosso, R.; Leone, A.; Boccia, L. Land Cover and Land Use Change in the Italian Central Apennines: A Comparison of Assessment Methods. Appl. Geogr. 2009, 29, 35–48. [Google Scholar] [CrossRef]
- Zoumides, C.; Bruggeman, A.; Giannakis, E.; Kyriakou, N. A Future for Mountain Terraces: Experiences from Mediterranean Wineries. Mt. Res. Dev. 2022, 42, R35. [Google Scholar] [CrossRef]
- E.U. Common Agricultural Policy 2023–2027, Strategic Plans. Available online: http://www.paa.gov.cy/moa/paa/paa.nsf/All/C4DA9AB0A2AD27B9C225857B00364F81 (accessed on 4 April 2023).
- Papachristodoulou, S.; Upton, M. The Social and Economic Position of Growers in the Main Viticultural Zones of Cyprus; Agricultural Research Institute, Ministry of Agriculture and Natural Resources: Aglandjia, Cyprus, 1989.


| Type | Year | Reference Unit | Quantity | Units | Area Estimation (km2) |
|---|---|---|---|---|---|
| survey | 1572 | settlement | 85,435 | load | - |
| survey | 1833 | settlement | 39,976 | dönüm | - |
| map | 1885 | area | 238.3 | km2 | 238.3 |
| survey | 1931 | settlement | 162,101 | dönüm | 216.9 |
| map | 1942 | area | 510.8 | km2 | 510.8 |
| map | 1969 | area | 459.4 | km2 | 459.4 |
| survey | 2009 | municipality | 88.29 | km2 | 88.29 |
| Variable | Sub-Categories (Columns) | Units |
|---|---|---|
| Total area of each municipality | 1 | ha |
| Viticulture | 7 | ha, except 1572 |
| Population | 17 | Number of persons |
| Elevation | 1 | m.a.s.l. |
| T.P.I. | 6 | ha |
| Bioclimatic regions | 8 | ha |
| Soil types | 4 | ha |
| Region | Elevation | 1572 | 1833 | 1885 | 1931 | 1942 | 1969 | 2009 |
|---|---|---|---|---|---|---|---|---|
| Ammochostos (0–174) | 0–200 | 0 | 0.11 | 0.01 | 0.75 | 0.25 | 0.47 | 0.15 |
| Karpasia (0–383) | 0–200 | 0 | 0.01 | 0 | 0.44 | 0.34 | 0.19 | - |
| Keryneia (0–1024) | 0–200 | 0 | 1.42 | 0.06 | 1.24 | 0.79 | 0.2 | - |
| 200–400 | 0.02 | 0.1 | 0.01 | 0.43 | 0.32 | 0 | - | |
| 400–600 | 0 | 0.01 | 0 | 0.02 | 0 | 0.04 | - | |
| Total | 0.02 | 1.53 | 0.07 | 1.69 | 1.11 | 0.24 | - | |
| Larnaca (0–752) | 0–200 | 0.64 | 0.55 | 1.22 | 2.92 | 2.13 | 1.34 | 2.04 |
| 200–400 | 3.4 | 6.1 | 5.62 | 2.94 | 8.24 | 1.81 | 0.02 | |
| 400–600 | 0.61 | 1.92 | 0.37 | 0.33 | 0.89 | 0.27 | 0 | |
| Total | 4.65 | 8.57 | 7.21 | 6.19 | 11.26 | 3.42 | 2.06 | |
| Lemesos (0–1153) | 0–200 | 0.66 | 2.68 | 0 | 2.06 | 0.52 | 1.18 | 19.51 |
| 200–400 | 1.02 | 0.74 | 0.15 | 0.46 | 0.04 | 0.37 | 1.07 | |
| 400–600 | 12.76 | 8.57 | 6.09 | 7.83 | 7.68 | 12.21 | 5.41 | |
| 600–800 | 11 | 10.54 | 11.64 | 12.03 | 12.3 | 15.48 | 2.95 | |
| 800–1000 | 8.18 | 6.69 | 7.74 | 6.6 | 7.52 | 7.8 | 5.27 | |
| Total | 33.62 | 29.22 | 25.62 | 28.98 | 28.06 | 37.04 | 34.21 | |
| Mesaoria (0–643) | 0–200 | 0.18 | 0.27 | 1.07 | 3.5 | 1.01 | 0.79 | 4.28 |
| 200–400 | 0.42 | 2.15 | 1.23 | 2.63 | 1.82 | 2.38 | 1.98 | |
| 400–600 | 1.02 | 1.4 | 3.57 | 2.16 | 3 | 0.22 | 0.22 | |
| Total | 1.62 | 3.82 | 5.87 | 8.29 | 5.83 | 3.39 | 6.48 | |
| Pafos (0–1145) | 0–200 | 0 | 0.24 | 0.08 | 1.92 | 0.77 | 0.92 | 14.49 |
| 200–400 | 0.64 | 0.72 | 1.44 | 4.19 | 1.97 | 10.22 | 6.49 | |
| 400–600 | 2.36 | 2.41 | 2.62 | 8.73 | 4.44 | 15.49 | 15.25 | |
| 600–800 | 0.78 | 2.75 | 1.06 | 3.63 | 2.1 | 5.2 | 5.07 | |
| Total | 3.78 | 6.12 | 5.2 | 18.47 | 9.28 | 31.83 | 41.3 | |
| Troodos (0–1950) | 0–200 | 0 | 0.02 | 0.01 | 0.22 | 0.11 | 0.01 | 0.04 |
| 200–400 | 0.5 | 3.33 | 3.39 | 3.15 | 4.62 | 4.35 | 0.06 | |
| 400–600 | 7.47 | 11.73 | 6.83 | 3.29 | 3.21 | 0.66 | 0.31 | |
| 600–800 | 9.65 | 11.55 | 13.51 | 8.8 | 12.28 | 5.68 | 4 | |
| 800–1000 | 19.52 | 13.52 | 21.41 | 13.22 | 17.97 | 8.3 | 6.74 | |
| 1000–1200 | 9.88 | 7.06 | 6.57 | 3.77 | 3.59 | 3.3 | 2.16 | |
| 1200–1700 | 9.28 | 3.43 | 4.31 | 2.75 | 2.09 | 1.11 | 2.47 | |
| Total | 56.3 | 50.64 | 56.03 | 35.2 | 43.87 | 23.41 | 15.78 | |
| Cyprus (0–1950) | 0–200 | 1.49 | 5.3 | 2.44 | 13.04 | 5.91 | 5.1 | 40.52 |
| 200–400 | 6 | 13.14 | 11.84 | 13.8 | 17.01 | 19.14 | 9.63 | |
| 400–600 | 24.22 | 26.03 | 19.48 | 22.37 | 19.23 | 28.89 | 21.19 | |
| 600–800 | 21.43 | 24.83 | 26.21 | 24.45 | 26.68 | 26.36 | 12.02 | |
| 800–1000 | 27.7 | 20.21 | 29.15 | 19.82 | 25.49 | 16.1 | 12.01 | |
| 1000–1200 | 9.88 | 7.06 | 6.57 | 3.77 | 3.59 | 3.3 | 2.16 | |
| 1200–1700 | 9.28 | 3.43 | 4.31 | 2.75 | 2.09 | 1.11 | 2.47 |
| Estimators | 1572 | 1833 | 1885 | 1931 | 1942 | 1969 | 2009 | |
|---|---|---|---|---|---|---|---|---|
| cond | Intercept | 5.3821 (***) | 1.5325 (***) | 3.5712 (***) | 3.4234 (***) | 4.4742 (***) | 4.5831 (***) | 2.37 (***) |
| Population | 0.6138 (***) | 0.9428 (***) | 0.4159 (***) | 0.4614 (***) | −0.1489 (n.s.) | −0.0375 (n.s.) | 0.9185 (***) | |
| Gentle slopes | −0.856 (**) | −0.9501 (***) | −0.8394 (***) | −0.3543 (***) | −0.3707 (**) | −0.358 (**) | −0.2713 (.) | |
| Lower Slopes | −0.0015 (n.s.) | −0.3593 (*) | −0.5289 (***) | −0.1693 (n.s.) | −0.1612 (n.s.) | −0.3983 (**) | −0.2946 (.) | |
| Valleys | −0.6867 (*) | −1.2592 (***) | −1.164 (***) | −0.4317 (***) | −0.5583 (**) | −0.1693 (n.s.) | 1.2242 (***) | |
| Elevation | 0.3578 (**) | 0.9143 (***) | 0.6956 (***) | 0.8737 (***) | 0.7126 (***) | 0.7769 (***) | 0.4702 (***) | |
| calcaric rendzic LEPTOSOLS and calcaric leptic CAMBISOLS | 0.0422 (n.s.) | 0.3598 (***) | 0.4061 (***) | 0.3917 (***) | 0.4099 (***) | 0.5832 (***) | 0.5736 (***) | |
| eutric CAMBISOLS and eutric anthropic REGOSOLS | 0.0474 (n.s.) | 0.3484 (***) | 0.4738 (***) | 0.1942 (**) | 0.3531 (***) | 0.1721 (.) | −0.0308 (n.s.) | |
| eutric lithic LEPTOSOLS and eutric skeletic REGOSOLS | −0.2165 (n.s.) | 0.7037 (**) | 0.7649 (***) | −0.219 (n.s.) | −0.0362 (n.s.) | −0.6337 (**) | −1.997 (***) | |
| sceletic calcaric REGOSOLS and calcaric lithic LEPTOSOLS | −0.1355 (n.s.) | 0.2666 (*) | 0.3513 (**) | 0.1006 (n.s.) | 0.1629 (n.s.) | 0.2151 (*) | −0.3901 (**) | |
| zi | Intercept | 0.2174 (n.s.) | −18.988 (n.s.) | −1.1301 (***) | −4013.335 (n.s.) | −1.332 (***) | −0.5542 (***) | −274.245 (**) |
| elevation | −2.4942 (***) | 0.6504 (n.s.) | −2.502 (***) | 1.7981 (n.s.) | −0.6737 (***) | −0.207 (.) | −2.2762 (n.s.) | |
| population | −0.6807 (***) | −41.952 (n.s.) | −0.389 (.) | −10,021.751 (n.s.) | −2.3966 (***) | −0.0695 (n.s.) | −1389.531 (**) |
Disclaimer/Publisher’s Note: The statements, opinions and data contained in all publications are solely those of the individual author(s) and contributor(s) and not of MDPI and/or the editor(s). MDPI and/or the editor(s) disclaim responsibility for any injury to people or property resulting from any ideas, methods, instructions or products referred to in the content. |
© 2023 by the authors. Licensee MDPI, Basel, Switzerland. This article is an open access article distributed under the terms and conditions of the Creative Commons Attribution (CC BY) license (https://creativecommons.org/licenses/by/4.0/).
Share and Cite
Papadias, E.; Detsis, V.; Hadjikyriacou, A.; Papadopoulos, A.G.; Vradis, C.; Chalkias, C. Long-Term Dynamics of Viticultural Landscape in Cyprus—Four Centuries of Expansion, Contraction and Spatial Displacement. Land 2023, 12, 1143. https://doi.org/10.3390/land12061143
Papadias E, Detsis V, Hadjikyriacou A, Papadopoulos AG, Vradis C, Chalkias C. Long-Term Dynamics of Viticultural Landscape in Cyprus—Four Centuries of Expansion, Contraction and Spatial Displacement. Land. 2023; 12(6):1143. https://doi.org/10.3390/land12061143
Chicago/Turabian StylePapadias, Evangelos, Vassilis Detsis, Antonis Hadjikyriacou, Apostolos G. Papadopoulos, Christoforos Vradis, and Christos Chalkias. 2023. "Long-Term Dynamics of Viticultural Landscape in Cyprus—Four Centuries of Expansion, Contraction and Spatial Displacement" Land 12, no. 6: 1143. https://doi.org/10.3390/land12061143
APA StylePapadias, E., Detsis, V., Hadjikyriacou, A., Papadopoulos, A. G., Vradis, C., & Chalkias, C. (2023). Long-Term Dynamics of Viticultural Landscape in Cyprus—Four Centuries of Expansion, Contraction and Spatial Displacement. Land, 12(6), 1143. https://doi.org/10.3390/land12061143