Abstract
The quantification of greenhouse gas (GHG) emissions is increasingly important in spatial planning for regions, cities, and areas. The combination of territorial and consumption-based accounting (CBA) approaches can currently be considered best practice for calculating GHG emissions at sub-national levels, in terms of informing local decision-making about the different climate impacts of spatial planning policies, both within the boundaries of a given region and for the inhabitants of that region. This study introduces four European case studies that were conducted using the two quantification approaches to assess the climate impacts of locally relevant planning policies. The case studies represent different scales of spatial planning, different European planning systems, and different situations in terms of data availability. Territorial results are not suitable for inter-regional comparison, but rather for internal monitoring, while CBA allows for comparison and provides a comprehensive picture of the global carbon footprint of residents, however, with indications that are more difficult to link to spatial planning decisions. Assessing impacts, and in particular interpreting results, requires both methodological understanding and knowledge of the local context. The results of the case studies show that setting climate targets and monitoring the success of climate action through a single net emissions figure can give false indications. The study shows that the two approaches to quantifying GHG emissions provide complementary perspectives on GHG emissions at the sub-national level and thus provide a more thorough understanding of the GHG emission patterns associated with spatial planning policies. The identification of the regional differences in GHG emission sources and mitigation potentials are the main functions of sub-national GHG inventories and the impact assessment for spatial planning. Harmonization of the data collection for sub-national GHG inventories and the transparency of underlying assumptions would greatly support the coherence of climate action and the implications to spatial planning.
1. Introduction
The unprecedented growth in material wellbeing coupled with rapid global population growth has led to an explosion in the utilization of both non-renewable and renewable resources, labeled as the ‘Great Acceleration’ by Steffen et al. [1]. One of the consequences is global warming, which is widely held to be the most pressing environmental problem of our era. We have already exceeded a 1 degree Celsius warming, and according to many projections, the widely recognized 1.5 degree threshold is not more than a decade away [2]. This means that rapid and deep emissions reductions are needed throughout society, from international to national and sub-national levels. One prominent level of mitigation action is the city level [3].
Many European cities and regions have published ambitious commitments regarding their greenhouse gas (GHG) emissions reduction. Cities are often considered to be at the forefront of climate action [4,5], which is also expected to drastically change spatial planning [6]. Spatial planning at sub-national and local levels is also seen as a way to strengthen the combined impact of EU policies [7]. The European Directive (2001/42/EC) on Strategic Environmental Assessment (SEA) [8] calls for more consistent practices in GHG impact assessment. Yet, the GHG quantification methods for European cities and regions are currently not harmonized [9] and the success of climate action implementation is monitored through inventories that vary in both scope and methodology [10,11].
In line with the national GHG reporting methodologies and practices, most cities and regions apply today territorial accounting, which aims to quantify direct GHG emissions within the geographic boundaries of the assessment area [11]. Subsequently, carbon neutrality claims and targets are usually also based on the annual net balance of territorial GHG emissions [12]. Sub-national and local inventories typically apply the guidelines provided by Greenhouse Gas Protocol [13] and IPCC; however, these instructions have only succeeded in harmonizing some limited aspects of GHG accounting practice. Furthermore, the IPCC national accounting practice is not readily applicable to cities [11]. The allocation problems embedded in the territorial GHG accounting approach are even more pronounced when territorial accounting is applied at sub-national and local levels [14].
An increasing number of GHG inventories use a consumption-based accounting (CBA) methodology, which aims to estimate global GHG emissions from consumption by residents [15]. In 2018, the C40 Cities Climate Leadership Group published consumption-based GHG emissions for 79 cities [16]. The Finnish Environment Institute has recently published consumption-based GHG emissions inventories for all Finnish provinces and municipalities [17]. Ottelin et al. [18] reviewed more than 100 scientific studies applying a consumption-based GHG accounting approach.
In this context, Afionis et al. [19] analyzed the opportunities and difficulties of adopting the CBA approach and concluded that it is unlikely to replace the established territorial accounting model. However, the authors argue that CBA could be an invaluable complementary tool to understand emission patterns in detail and inform the design of the necessary policies. Chen et al. [11] argue that protocol practitioners need support in conducting carbon accounting to explore mitigation and adaptation potentials from multiple perspectives.
CBA has opened new perspectives on GHG mitigation strategies in spatial planning. Several CBA studies have highlighted the importance of lifestyle and consumption patterns [20] and questioned the potential of densification strategies as the sole measure to reduce GHG emissions in spatial planning [21]. These findings were also noted in the IPCC 5th assessment report [22]. The overarching CBA data published by the Finnish Environment Institute seem to support the critical remarks, as Finnish cities do not stand out among the 300 Finnish municipalities as low-emission environments [17].
Few previous studies exist that have simultaneously utilized both territorial and consumption-based methods on actual cases and analyzed the utility from a spatial planning perspective. To fill this gap, this study presents territorial and consumption-based GHG emissions analyses for four European case studies. In accordance with Heinonen [15], Afionis [19], and Lenk [23], the hypothesis of this study is that CBA can provide complementary information to the results of the more common territorial GHG analyses, providing a more comprehensive understanding of the GHG emission patterns, and thus better informing local decision making and spatial planning policies. At the time of writing, conducting both assessments can be considered the best practice for assessing the climate impacts of spatial planning policies.
Furthermore, we assess the impacts of selected spatial planning policies using both approaches to specify indications that such a dual GHG quantification approach can provide for spatial planning in European cities and regions. Interpretation of the results is based on context and a critical review of the data and methods applied. The main objective of the policy assessments is to examine the capacity of these two GHG accounting methods to inform spatial planning about the climate impacts of various policies. The methods of this study are applicable across Europe, and therefore, this study also provides a benchmark towards European-level methodological harmonization.
Several studies have considered consumption-based emissions as a Scope 3 extension of a territorial GHG analysis as a so-called consumption-based areal carbon footprint (ACF) [15]. In this paper, regional and consumption-based inventories are defined as two completely different allocation principles, the results of which cannot be combined. Using the terminology of Heinonen et al. [24], the CBA of this study applies the residence principle instead of the territory principle.
Section 2 (“Materials”) introduces the four European case studies, the data applied for the baseline analyses, and the policies for which the GHG impacts were assessed. Section 3 describes the methods applied in the territorial and consumption-based baseline GHG analyses. Section 4 presents the territorial and consumption-based baseline results as well as the results of the policy impact assessment. This is followed by a discussion and conclusions (Section 5 and Section 6).
2. Materials
This study applies the methods developed in the project Quantitative Greenhouse Gas Impact Assessment Method for Spatial Planning Policy (QGasSP) [25], financed by ESPON EGTC, which aimed to produce a robust, simple, and proportionate methodology that will allow competent planning authorities at national, regional and local administrative levels to quantify and forecast the influence of spatial planning policies on GHG emissions in a consistent manner. A detailed method description can be viewed at https://www.espon.eu/QGasSP (accessed on 1 May 2023).
2.1. Case Studies
The four case studies (Figure 1) were selected to represent different kinds of European areas and various sub-national scales and situations in spatial planning.
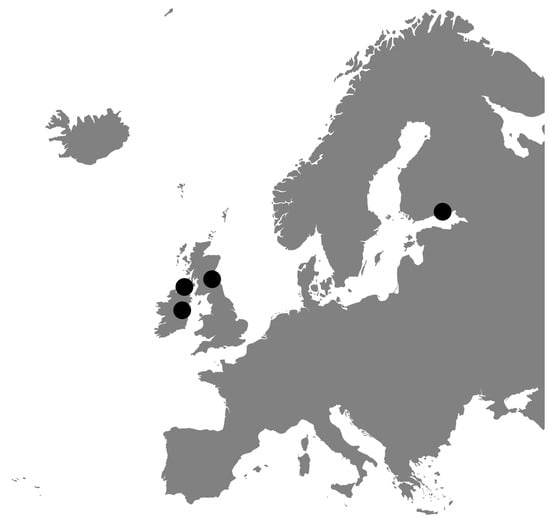
Figure 1.
The locations of the four case studies (original map by Vemaps.com).
- County of Meath
County Meath lies on the border of Dublin, the capital of Ireland. Meath’s proximity to Dublin makes it a commuter region and provides a good mix of spatial attributes, having both rural, urban, and suburban areas. Over recent years, Meath has experienced a rapid growth in population which has boosted the economy in the area. A proactive take in climate action is showcased in Meath’s Climate Action Strategy (2019–2024) [26].
- City of Edinburgh
The Scottish case study is the capital city, Edinburgh, which is home to over 901,000 inhabitants who live in the council area, of which a population of 524,930 (as of 2019) live in the city. Scotland has set a target to reach net zero emissions by 2045. Edinburgh is a major transport hub of East Central Scotland and is at the center of a multi-modal transport network with road, rail and air communications.
- Rathlin Island
Rathlin is Northern Ireland’s only offshore inhabited island. Its population has been steadily increasing and currently stands at approximately 160 inhabitants. Rathlin Island lies within the Antrim Coast and Glens Area of Outstanding Natural Beauty and it has a number of natural energy resources; these renewable energy sources, however, are not currently used to their full potential.
- Kymenlaakso region
The region of Kymenlaakso in South-East Finland comprises six municipalities with a total population of 174,000. The largest cities are the port city of Kotka (55,000 inhabitants), the regional centre Kouvola (88,000 inhabitants) and the historic fortress town Hamina (20,000 inhabitants). The Kymenlaakso region aims to be carbon neutral by 2035. To this end, the Kymenlaakso region has compiled a roadmap [27], according to which Kymenlaakso must decrease GHG emissions mainly in the transport, energy production and agriculture sectors. Carbon sinks in the LULUCF sector must be increased in forests and soils. The measures in the roadmap include, for example, eco-innovations, cleantech, a circular economy approach in all sectors, climate wise forestry, increasing the share of renewable energy, compact urban structure, and environmental education, as well as comprehensive cooperation between all sectors. The Finnish Environment Institute has provided annual monitoring of GHG emissions in Kymenlaakso since 2005.
2.2. Data for Territorial GHG Baseline Analysis
- European data for territorial baseline analysis
This study prioritizes European data from open datasets for more coherent results.
The key data source on the energy consumption of buildings is the EU Buildings Database [28]. The national emission factors for energy carriers are sourced from the Covenant of Mayors dataset [29].
The Copernicus Land Monitoring Service (CLMS) was applied for determining the spatial distribution of land-use classes and relevant areas for the case study pilots for the baseline analyses. CLMS provides CORINE Land Cover (CLC) vector datasets that are based on the classification of satellite images produced by the national teams of the European Environment Agency (EEA) members and cooperating countries. The CLC 2018 accounting layers (Corine Land Cover Accounting Layers (CLC2018), European Environment Agency) were applied for determining current land-use types in the case study areas. In the case of Edinburgh, a more refined CORINE Urban Atlas Street Tree Layer (STL) 2018 [30] was applied to determine the area of urban trees within the Settlement land-use category. The Urban Atlas provides pan-European comparable land use and land cover data for Functional Urban Areas (FUA). The Street Tree Layer is a separate layer that includes contiguous rows or a patch of trees covering 500 m2 or more and with a minimum width of 10 m over “Artificial surfaces” (CORINE nomenclature class 1) inside FUA (i.e., rows of trees along the road network outside urban areas or forest adjacent to urban areas should not be included).
In the current study, CORINE land classes were categorized into IPCC land-use categories and unmanaged land according to the land use definitions provided in the IPCC guidelines [31,32,33], CLC nomenclature and information provided in national inventory reports [34].
The spatial distribution and areas of different soil types were identified using the European Soil Database Maps [35], following FAO World reference base (WRB) [36] soil classification. For the baseline analysis, data on WRB level 1 spatial distribution was used. Histosols were considered organic soils according to the IPCC guidelines, and all other types of soils were classified as mineral. It was assumed that all managed organic soils are drained and result in CO2 emissions.
The datasets were processed, integrated, and analyzed utilizing QGIS. Once the soil types were associated with land uses, the accumulative area of each land-use type within all the different soil types was calculated. The relevant carbon–stock–change factors (land remaining category) were sourced from the national inventory reports and common reporting format (CRF) tables from the latest available 2021 submissions (inventory year 2019) [37,38,39].
The future projections of the study are based on EU Reference Scenario 2016 [40] that provides coherent model-derived trend projections for all countries included in the case studies, applying a series of interlinked peer-reviewed models, which combine technical and economic methodologies.
- Local datasets for territorial baseline analysis
The local data sources are described below and summarized in Table 1.

Table 1.
Local data applied in the territorial analysis.
- County of Meath
Territorial GHG accounting for the buildings sector applies two local data sources: Census 2016 [42] by the Central Statistics Office (CSO), and the Building Energy Rating (BER) Research Tool [43]. For road transport, forecasted 24 h weekday vehicle–kilometers by vehicle class and road type in the County Meath at 2019 derive from a draft version of the ERM (Eastern Region Model) Model Development Report (not published). Complementary information is from the Transport Trends 2020 publication [44], the database of Transport Infrastructure Ireland [45] and the statistics of Iarnród Éireann [46]. The railroad transport activity was calculated with the information on weekly services and track lengths within the borders of Meath. The CO2e emission factors for road and rail transport derive from the Finnish LIPASTO database [47] and from the British DEFRA database [48].
- City of Edinburgh
Territorial GHG accounting utilizes a detailed inventory of energy use and greenhouse gas emissions provided by the city of Edinburgh Council, data from the National Records of Scotland [49] and the Energy, Performance Certificate (EPC) database for the city of Edinburgh. The detailed inventory makes use of verified datasets published by the UK Government and is broken down by local authority area as well as by fuel and emission conversion factors for these fuels.
- Rathlin Island
Rathlin Island is a good example of a planning case where a GHG inventory is not supported by statistical data. The case study is based on information gathered by the community association on the island, Rathlin Development and Community Association (RDCA), and on an energy audit that was carried out as part of a Master’s thesis [50] that is based on local level information, gathered from monitored data provided by energy suppliers and questionnaires targeted towards residential/domestic energy use and for commercial energy use on the island. The energy questionnaires were developed in line with the Sustainable Energy Authority of Ireland’s (SEAI) Energy Audit Handbook for 2016 [51] and covered a range of energy efficiency questions. The transport activity data for Rathlin Island is based on the data collected for sustainable transport strategy [52], which included a transport survey for the residents. Off-road vehicles and boats were excluded from the transport emissions analysis, respectively, to other case studies. For the land use analysis, the combined CSC factors of the UK were implemented in the Northern Ireland baseline. Although the UK has data sources available at the individual country level (England, Scotland, Wales and Northern Ireland), combined results are published in the greenhouse gas reports to give UK totals [39], meaning carbon–stock–change factors are not provided separately for individual country level.
- Kymenlaakso region
The Kymenlaakso case study applies the transport activity data from LIISA model results published in the LIPASTO database [47] and the recent GHG analysis for the Kymenlaakso carbon neutrality roadmap [27], providing a municipal breakdown for road transport by local and transit transport as well as by road and street transport with respective emission factors.
2.3. Data for the Consumption-Based GHG Baseline Analysis
The data applied in the EEIO analysis is presented in Table 2 below.
Table 2.
Summary table of the data applied for the consumption-based GHG baseline analysis.
The method applied in this study is predominately based on two data sources:
- (1)
- The 2020 version of Exiobase [53,54], a widely used EEIO, is applied to determine emission intensities. In total, Exiobase represents 49 countries/regions, including virtually all of Europe at country-level, and the rest of the world with lower resolution. In all cases, emission intensities are determined (in units of kgCO2/€) for a total of 200 ‘products’ representing the whole economy. This includes, amongst others, separate ‘products’ representing different forms of electricity generation, different fuels for space heating and private and public transport modalities.
- (2)
- The average expenditure is derived from Eurostat household Budget surveys (HBS). These surveys are collated every 5 years and illustrate both total value and expenditure purpose, based on the Classification of Individual Consumption by Purpose (COICOP) system.
The categories of the HBS and Exiobase were first aligned using the initial concordance matrix published by Ivanova and Wood [55]. These were further modified for all European countries to improve accuracy for electricity, household fuel use and private transport, respectively, using publicly available data. Other sectors were left unadjusted from the initial assignments as these sectors were outside the scope of the original QGasSP project.
The national HBS describes the average picture for an average household in each country. The household expenditure is made more specific to different sub-national regions by first using Eurostat HBS that describe the distribution of expenditure in cities, towns, and rural areas.
The HBS purchaser prices were converted to basic prices using supply-and-use tables found in Eurostat (NAIO_10_CP15). Moreover, product-specific inflation multipliers were used to update the values to 2019 (PRC_HICP_AIND). The average annual inflation over the years 2015–2019 was then projected to 2020 as a further multiplier to put the HBS in 2020 values without the depreciation associated with the COVID-19 pandemic. It is assumed that the structure of this expenditure would be relatively similar between 2015 and 2020.
Specific HBS surveys used are:
- HBS_STR_T211—Household expenditure by consumption purpose (per mille);
- HBS_EXP_T136—Household expenditure by consumption purpose by urban area (per mille);
- HBS_EXP_T133—Mean household consumption expenditure by income quintile (per Euro).
When compared to the territorial calculations, it is also a feature of the CBA approach to more readily be based on top-down data sources. In this context, it is important to note that the specificity to any of the case studies is limited by the availability of the household expenditure data, which are aggregated within each country at different levels of urban density. For example, the lack of specific data on household consumption for Rathlin Island means that the calculated emissions reflect the average picture for a rural household in Northern Ireland and not the specific consumption patterns of the island community.
2.4. Spatial Planning Policies
- County of Meath
Meath’s Climate Action Strategy for 2019–2024 [26] is linked to Meath County Development Plan (CDP) 2021–2027 [56], from which the spatial planning policies of this study originate. CDP focuses on reducing the county’s reliance on imported fossil fuels and encourages the use of regionally generated renewable energy. It promotes the use of lower carbon fuels and photovoltaic solar panels in new developments, as well as improving energy efficiency in existing buildings. CDP also supports the use of heat pumps as an alternative to gas boilers for domestic and commercial development. Overall, CDP aims to promote energy efficiency and reduce carbon emissions in buildings. The land use strategies mentioned in CDP plans are rather generic and indicative, mostly suggesting regenerating and enhancing the natural and physical environment of the settlements.
The GHG impact were assessed for the following actions from CDP:
- Retrofitting;
- Improving the provision of public transport (MOV POL 11);
- Enhancing walking and cycling;
- Increasing remote working (INF POL 54)
- City of Edinburgh
The study assesses the quantifiable actions from Scotland’s Third National Planning Framework (NPF3) [57] that is a long-term strategy and a national vision of what is expected of the planning system and the actions that it must deliver for the people of Scotland. It is accompanied by an Action Programme [58], which describes the implementation of NPF3. Scottish Planning Policy [59] is a thematic national planning policy and sets out how nationally important land use planning matters should be addressed across the country. NPF3 aims to achieve at least an 80% reduction in greenhouse gas emissions by 2050. It has highlighted that most of the energy infrastructure, and the majority of Scotland’s energy consumers, are located in close proximity to cities. Thus, cities are a focus to improve the energy efficiency of the built environment, which is both a challenge but also an opportunity for reducing emissions.
The GHG impact were assessed for the following actions from NFP3:
- Retrofitting;
- The Borders railway line;
- Enhancing walking and cycling;
- High speed rail.
- Rathlin Island
The Rathlin Island Policy [60] recognizes that the challenges faced on Rathlin are different to those experienced on the mainland and may have to be addressed differently. This study quantifies some impacts of the Northern Area Plan (NAP) [61] that provides a framework for development throughout the area, conforming with the strategy and guidance set out in the Regional Development Strategy 2035 (RDS) [62] and facilitating sustainable growth, meeting the needs of communities and protecting environmental attributes. The selected policies of NAP are examined in the light of the sustainable transport strategy study provided by McLaughlin [52]. Rathlin Island has a large share of areas of international and national conservation importance (Ballycarry, Ballygill North, Rathlin Island Coast, Kebble, Kinramer South). The importance of conserving the landscape and natural resources of the rural areas and protecting it from excessive, inappropriate or obtrusive development is recognized. NAP does not propose any direct land use changes in Rathlin Island.
The GHG impact were assessed for the following actions from NAP:
- Retrofitting;
- Improving the provision of public transport;
- Enhancing cycling and walking;
- Increasing remote working.
- Kymenlaakso
According to the Carbon Neutral Kymenlaakso 2040 roadmap [27], the most important GHG emission reduction potentials lie in industry, energy use and transport. The fact that Kymenlaakso is characterized by the presence of important national transport arteries is also reflected in the choice of spatial planning policies. Here, the focus of the case studies is on regional policies, therefore this study mainly quantifies infrastructural investments that serve the needs of the entire Kymenlaakso region. For the buildings sector, this study estimates the impact of retrofitting strategies. In the transport sector, this study quantifies the impacts from two major infrastructural investments that are included in Transport 12, the national transport system plan 2021–2032 [63], and the Kymenlaakso transport system plan [64]. The latter one implements the national transport plan regionally, but also aims at implementing the measures outlined in the Carbon neutrality roadmap.
The actions included in this study are:
- Retrofitting;
- Improvements of Road 15 (Kouvola–Kotka);
- Developing a distribution network for biogas vehicles;
- Improvements of main rail connections.
3. Methods
3.1. Methods of Territorial GHG Baseline Analysis
The territorial analysis for the case studies covers the GHG emissions quantification for the key sectors:
- buildings;
- transport;
- land use.
GHG emissions are calculated using the equation:
TE = AD × EF
TE = territorial GHG emissions; AD = activity data; EF = emission factor.
The land use baseline analysis method applies the IPCC methodology and the CRF tables of the national inventory reports.
- Buildings
GHG emissions were calculated for the energy use in buildings, utilizing the EU Buildings Database [28] that provides information on average energy demand per m2 floor area for the different building types. This data was broken down by fuel type and is used to quantify the annual delivered energy for both commercial and residential buildings. National emission factors for heating fuels and electricity were used to convert the delivered energy into emissions.
- Transport
The territorial transport GHG emissions cover all motorized transport activity within the boundaries of the target area, including tank-to-wheel emissions for both passenger and freight transport (on roads, rails and waterborne). Among the selected case studies, only the city of Edinburgh has a passenger airport. Both Edinburgh and the city of Kotka in Kymenlaakso have ports and intensive waterborne freight transport. These were excluded from the study: firstly, because including the GHG emissions from maritime and aviation transport would complicate the comparison; and secondly, because the potential impact of spatial planning on GHG emissions from maritime and aviation transport can be considered limited.
- Land use
The territorial GHG emissions and removals from the land use, land-use change and forestry (LULUCF) sectors were quantified according to the IPCC methodology [31,32,33]. The LULUCF inventory sector, as defined by the IPCC, covers anthropogenic (not natural) emissions and removals of GHGs resulting from changes in terrestrial carbon stocks. It covers the carbon pools of living biomass (above and below ground); dead organic matter (dead wood and litter); and organic soil carbon for six broad land categories: forest land, cropland, grassland, wetlands, settlements (urban areas); and other land. In addition, wood products, such as timber used in construction or furniture, referred to as harvested wood products (HWP) can be reported as an additional pool; however, this was not included in this study.
The relevant GHG occurring in the LULUCF sector is mainly CO2, and therefore non-CO2 emissions (nitrous oxide, methane) were excluded from the study. Net changes in carbon stocks were converted to CO2 by multiplying with the ratio of CO2/C molecular weights 44/12 and changing the sign for net CO2 removals to be negative (−) and for net CO2 emissions to be positive (+).
IPCC LULUCF methodology divides land into two main subcategories: “lands remaining in the same land-use category” (by default for the last 20 years) and “lands converted to present land use” (by default during the past 20 years). In the current baseline analysis, a simplifying assumption was used that the land-use classes determined with the CORINE datasets represent the “land remaining” category, which is mostly the predominant subcategory.
3.2. Methods of Consumption-Based GHG Baseline Analysis
The consumption-based quantification applies a hybrid life cycle assessment (LCA) methodology [65], a combination of two types of life cycle assessment, with an environmentally extended economic input–output (EEIO) approach modified by more accurate data, such as process-based LCA (p-LCA) for selected sectors. The procedure amounts to modifying the basic EEIO to increase specificity towards the target area and the relevant emissions sectors. Additionally, the study also considers the final ‘use-phase’ emissions, for example, emissions associated with the private combustion of fuels. These are not considered standard in EEIO calculations.
Such a method models the whole economy included in the EEIO, and therefore minimizes the truncation errors present in some calculations by fully accounting for the supply chain, irrespective of geographic area. P-LCA, in turn, allows greater detail to be used in the calculations should such data be available. Problems involved in down-scaling the national picture are also reduced by considering the circumstances of the local area, particularly in the expenditure data, such as the urban density or relative income level of the residents.
These modifications help to overcome the typical EEIO weakness of limited resolution at the subnational level. As with all approaches based on input–output (IO) matrices, however, the approach will be most appropriate at larger scales and under the assumption that household consumption is closely aligned with expected values.
All three of the most important greenhouse gases (GHGs) are accounted for in the EEIO database (CO2, CH4, N2O) in terms of global warming potential over 100 years (GWP100). In total, 19 different types of emissions are included, representing both combustion and non-combustion sources.
GHG emissions are calculated using the standard equation, in accordance with other studies:
Emissions = B (I − A)−1k + Uk,
k = Final demand vector, describing the monetary value of different products spent by the household, from the Eurostat HBS; A = Exiobase IO matrix, describing the normalized flows between each ‘industry’ or ‘product’ considered; I = Identity matrix; B = Vector describing emissions from a unit of output from each industry. The three most important GHGs are considered to cover both combustion and non-combustion sources; U = Use-phase emission intensities.
3.3. Policy Impact Assessment
The GHG impact of policies were estimated as relative CO2e emissions. Four policies per case study were selected for this study. The population or activity affected by the policy was estimated. The spatial planning documents were reviewed to quantify the expected impact in the sectors that are relevant to the study. In general, the planning documentation provided no quantitative indications of expected policy impact. Therefore, the results should be considered as the maximum impact illustrating the range of likely policy impact.
4. Results
4.1. Results of Territorial GHG Baseline Analysis
The results of the territorial GHG analysis are presented in Table 3 and Figure 2. Territorial GHG emissions (tCO2e/(capita, a)).
Table 3.
Results of the territorial GHG baseline analysis (tCO2e/(capita, a)).
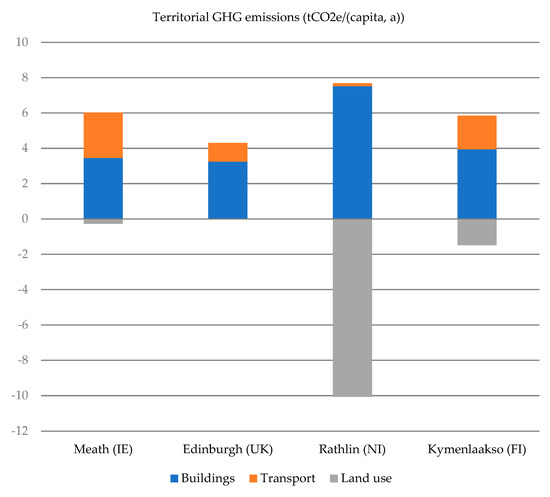
Figure 2.
Territorial GHG emissions (tCO2e/(capita, a)).
- County of Meath
The building sector emissions in Meath accounted for 671,690 tCO2e. Total emissions from the residential sector in Meath amounted to 6.3 tCO2e per dwelling in Meath, which is slightly higher than the national average in Ireland, which was reported to be 5.5 tCO2e for 2020 [51]. More than half of all residential units in Meath are detached houses; less than 10% of the residential units are located in multi-story house apartments. The highest emissions in the residential sector come from space heating, in which oil, electricity and natural gas contribute 46%, 26% and 25%, respectively.
The transport sector GHG emissions for the County Meath total 503,469 tCO2e. The results are dominated by road transport emissions, mainly from passenger cars and lorries. Although the railways of Meath serve the regular heavy transportation of a local ore mine, the share of freight rail transport remains relatively small in the total GHG emissions. Furthermore, the estimated train passenger–kilometers are only about 1.4% of the national passenger transport on rails. One explanation for this is that only a very small part of the main rail connections are located within the borders of Meath County: for example, the main Belfast–Dublin connection runs for only 11.3 km within the borders of Meath.
For the county of Meath, the total annual land-use emission estimate (net removal) of −53,151 tCO2 does not include emissions from potentially significant sources such as peat extraction sites and cropland organic soils. The presence of cropland organic soils is debatable due to the discrepancies in data provided in different databases (Indicative Soil Map of Ireland vs European Soil Database). The approximate emissions from drained cropland organic soil could be around 16,000 tCO2 if the organic soil area (551 ha) from European Soil database and the default IPCC emission factor (7.9 tCO2-C/(ha a)) for boreal and temperate croplands is used. Another potential underestimation of emissions occurs in the peat extraction category, specifically due to the drainage of organic soils.
- City of Edinburgh
The building sector GHG emissions in the city of Edinburgh accounted for 1,663,650 tCO2e in 2018. Total emissions from the residential sector in Edinburgh amounted to 769,860 tCO2e in 2018. The largest share of residential units are apartments (68%). The highest emissions in the residential sector come from natural gas and electricity, which contribute 67% and 31%, respectively.
The GHG emissions for transport in the city of Edinburgh total 559,200 tCO2e. The city of Edinburgh is a major transport hub in Scotland and the whole UK. On the other hand, the city of Edinburgh is also a forerunner in GHG mitigation, which is also visible in transport data, including the electrification of a main railway line and the investments on a tram system and electric buses of a bus operator owned by the city. The modal share is characterized by an excellent provision of public transport.
For the city of Edinburgh, the land use sector is a net carbon sink of 1176 tCO2e. The result of this study deviates quite significantly from the existing baseline analysis. Both assessments are based on the IPCC methodology and the carbon stock change factors from the CRF-tables annexed to UK’s national inventory report. The deviation mainly results from the land use analysis methodology, which apparently has led to different kinds of classification for land use [66]. For this study, the Edinburgh land-use data originates from more generic European datasets but applies a significantly higher resolution. On one hand, the analysis of this study may exclude some emissions, but on the other hand, it is more accurate in accounting for the impact of urban greeneries. It is worth noticing that the differences in data collection methods have led to high deviation in results although both studies make use of the CRF tables of national inventory reports and the IPCC land use classification. The difference seems to suggest that including the impact of urban greeneries of the city of Edinburgh in the GHG inventory would lead to a significantly better total net result.
- Rathlin Island
The building sector GHG emissions in Rathlin accounts for 1127 tCO2e. The residential sector contributed 64% and the commercial sector 36% to the total emissions. The main source of emissions come from heating oil (51%), followed by electricity (28%) and bottled gas (13%). The energy consumption of buildings stands out in comparison, as the floor area per capita does not significantly differ from the other case study areas.
The GHG emissions for transport on Rathlin total 28 tCO2e. As Rathlin Island has no transit transport at all, the transport emissions consist in practice of local transport only and are dominated by passenger car transport. As most of the residents’ driving takes place on the mainland, Rathlin’s territorial transport emissions are extremely low compared to the other case studies, although the island settlement is car-dependent. Rathlin Island’s road vehicle fleet consists of about 100 vehicles, of which, according to the transport survey, approximately 50% are in daily use [52]. The distance from mainland to Rathlin Island by ferry is 10.5 km. Half of the GHG emissions from the two diesel-fueled ferries were allocated to Rathlin Island.
The land use sector in Rathlin Island is a net carbon sink of −1612 tCO2. The annual CO2 removals of land use sector are related to carbon sequestration in managed grassland mineral soils, while grassland biomass is estimated to decrease slightly, causing minor emissions. Rathlin has a large share of designated conservation and protected areas, some of which probably fall under the CORINE class 322 Moors and heathland. The latter are considered as managed grasslands according to the UK’s NIR, however might be unmanaged in Rathlin. IPCC methodology does not take into account emissions/removals from natural and unmanaged areas; thus, the total carbon sink might be slightly overestimated in the Rathlin case study.
- Kymenlaakso region
The building sector GHG emissions in Kymenlaakso accounts for 683,540 tCO2e. The residential building stock in Kymenlaakso region is dominated by detached houses: they made up 91% of the total residential housing stock in Kymenlaakso. Total emissions from the residential sector in Kymenlaakso amounted to 507,640 tCO2e, of which detached houses accounted for 440,000 tCO2e. The electricity consumption of detached houses stands out as one of the most important emission sources.
The GHG emissions for transport in Kymenlaakso region total 332,751 tCO2e. The Kymenlaakso region is characterized by rather heavy transport infrastructure. In territorial GHG emissions, the share of road freight transport is almost as high as the GHG emissions from passenger cars.
The land use sector in Kymenlaakso is estimated to be currently a net sink of −259,593 tCO2, mainly due to the large share of carbon sequestering forest land. The emissions from forest organic soils might be slightly overestimated here because emissions from forest organic soils are assessed only in the drained organic soils, while the carbon stock changes of soils in undrained peatlands is assumed to be in a steady state (equal to zero) in Finland. In the current analysis, all managed organic soils were considered drained, which is a conservative approach according to the IPCC the guidelines and common assumption among countries reporting under the UNFCCC. Major emissions result from peat extraction sites and cultivation of cropland organic soils.
4.2. Results of Consumption-Based GHG Baseline Analysis
Table 4.
Results of the consumption-based GHG baseline analysis (tCO2e/(capita, a)).
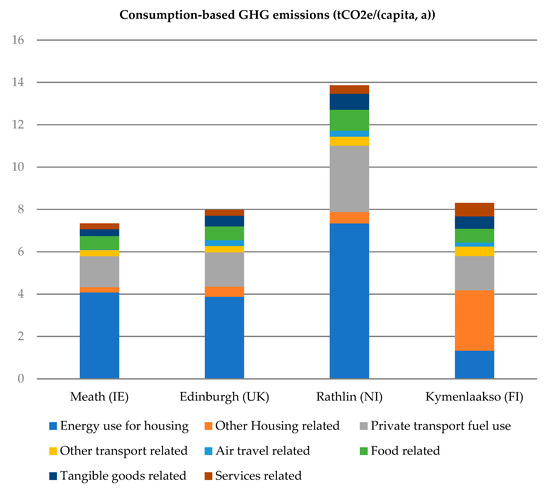
Figure 3.
Consumption-based baseline GHG emissions (tCO2e/(capita, a)).
- County of Meath
The consumption-based GHG emissions per capita were about 7.3 tCO2e/a. The largest contributions to the GHG emissions came from residential energy demand and transport fuels. In turn, residential energy is dominated by so-called ‘use phase’ emissions, which reflects the large proportion of space heating arising from direct combustion of fossil fuels in the household. The transport emissions are influenced by both the fuel mix and overall expenditure. The proportion of renewable sources in the transport fuels was only around 9%, whilst fuel use was higher than in either Finland or the UK, although emissions from production are lower than in the latter case. The higher household occupancy than the national average leads to a lower per capita footprint than would ordinarily be expected. The emissions from the production phases were rather small, with electricity accounting for a large proportion. One reason for this is due to reduced expenditure in the Household Budget Survey (HBS) being allocated to waste sources. Total household emissions independent of occupation level are higher than Kymenlaakso and Edinburgh.
- City of Edinburgh
The consumption-based GHG emissions per capita were approximately 8 tCO2e/a. The largest contributions to the emissions came from residential energy demand and transport fuels, for which the largest contributions came from the direct use of fuels by the household. This also reflects the large proportions of space heating arising from direct combustion of fossil fuels. In the case of Edinburgh, this particularly arises through gas-based heating. Transport emissions are also significant, which is somewhat surprising considering the location, and are higher than both Kymenlaakso and County Meath. This is despite the fact that households in both of these case areas spend more on transport fuels than Edinburgh. The reasons for this are two-fold. Firstly, in Finland there is a higher proportion of renewable fuels in the fuel mix (21%, whereas the corresponding figures for Ireland and the UK are both around 9%) and use-phase emissions for these have been set to zero in our methodology. Secondly, the direct and indirect production phase emission intensities are somewhat lower for Ireland than Finland or the UK, which also serves to mitigate the higher expenditure in County Meath.
A further feature of the emissions is the roughly equal split between the use-phase and production phases. This contrasts with both Kymenlaakso and County Meath, for which emissions are primarily from the production phases and use-phase, respectively, but is similar to Rathlin Island, which reflects the similar emission factors used in both these cases (the only difference being the electricity sector). Food emissions are lower than for a rural area in the UK (Rathlin Island), with changes in household occupancy level not entirely explaining this discrepancy. Household emissions are also still significantly higher in Rathlin Island than Edinburgh, although this partly arises from differences in the electricity sector. Indeed, total household emissions independent of occupation level are similar to Kymenlaakso, but lower than both County Meath and Rathlin Island. When household occupancy is considered, Edinburgh, Kymenlaakso and County Meath all have rather similar carbon footprints. Total household expenditure in 2015 was comparable across all regions in Euro terms (higher values in Ireland are somewhat mitigated by the higher household occupancy levels).
- Rathlin Island
The consumption-based GHG emissions per capita were 13.9 tCO2e/a. The largest contributions to the emissions came from residential energy demand and transport fuels. Use-phase emissions significantly contribute to the residential energy demand, which reflects the large proportion of space heating arising from direct combustion of fossil fuel combustion in the household. Electricity emissions are also significant due to the high carbon intensity of the Irish grid combined with UK demand being somewhat higher than in Ireland. Transport emissions are also significant and are dominated by the use-phase. This is influenced by both the fuel mix and overall expenditure. The proportion of renewable sources in the transport fuels was only around 9%.
A further feature of the emissions is the roughly equal split between the use-phase and production phases. This contrasts with both Kymenlaakso and County Meath, for which emissions are primarily from the production phases and use-phase, respectively. Food emissions are also rather significant at around 1 tCO2e/a. It should further be stated that the low household occupancy has a strong negative effect on emissions and is significantly below the national average for rural households. If the national average value was used the emissions per capita would reduce to 10.5 tCO2e/a. However, total household emissions independent of occupation level are still higher than the other case areas. When household occupancy is considered, Edinburgh, Kymenlaakso and County Meath all have rather similar carbon footprints. Total household expenditure in 2015 was comparable across all regions in Euro terms (higher values in Ireland are somewhat mitigated by the higher household occupancy levels).
It should be noted that the EEIO approach that is utilized for the consumption-based assessment works best at larger scales and under scenarios where the economic consumption patterns of the residents are close to average. This means that the results for Rathlin Island come with additional uncertainties compared to the other case areas.
- Kymenlaakso region
The consumption-based GHG emissions per capita were 8.3 tCO2e/a. A feature of the emissions from the region is the small contribution from the electricity sector, as well as the relatively higher contribution from electricity and renewables in household heating. This leads to a lower contribution from household energy sources in the emissions total, although the contribution from private transport is similar to County Meath and Edinburgh.
Allied to this initial finding, a relatively greater proportion of the Finnish carbon footprint arises from the production of products, rather than the household use phase, in comparison to the other case study areas.
For example, the services sector is notably higher than the other case study areas. Moreover, waste makes a large contribution to the Finnish footprint (recorded under ‘household other’) with significant contributions coming from landfill. Note that waste corresponded to a ‘place-holder sector’, so the values are distributed in the same way for each country and region using a concordance matrix. This was because waste was outside of the scope of the ESPON project upon which this paper is based. It is also not well differentiated in the initial HBS, meaning that it is mainly aggregated with other household costs. An analysis of the emissions shows that both the expenditure and the emissions intensity are high for several waste-to-landfill categories for Finland, in comparison to the UK or Ireland. An analysis of the local picture within the region [67] shows that a high proportion of waste is incinerated for energy, and it can therefore be assumed that the present emissions are an overestimate in this case.
Total household emissions independent of household occupation are similar between Kymenlaakso and Edinburgh. When household occupancy is considered, Edinburgh, Kymenlaakso and County Meath all have rather similar carbon footprints. Total household expenditure in 2015 was rather similar across all regions in Euro terms (higher values in Ireland are somewhat mitigated by the higher household occupancy levels).
4.3. GHG Impact Assessment for Spatial Planning Policies
4.3.1. Policy Quantification—County of Meath
The results of the policy impact GHG quantification are presented in Table 5.
Table 5.
Results of the policy impact GHG assessment for Meath County (tCO2e/(capita, a)).
Table 5.
Results of the policy impact GHG assessment for Meath County (tCO2e/(capita, a)).
| Planning Policy | Territorial | CBA |
|---|---|---|
| Retrofitting | −0.44 * | −0.35 |
| Improving the provision of public transport | −0.28 | −0.31 |
| Enhancing cycling and walking | −0.32 | −0.32 |
| Increasing remote working | −0.10 | −0.32 |
* Plus embodied CO2e 0.01–0.02 tCO2e/(capita, a) in the year of construction. 1
- Retrofitting
CDP gives no indicative figures on the number of retrofits to take place in County Meath during the implementation of the CDP. Even so, national policy objectives outlined in the 2019 Climate Action Plan 2021 aim to achieve the equivalent of 500,000 homes retrofitted to a Building Energy Rating of B2/cost optimal or carbon equivalent, and the installation of 400,000 heat pumps in existing premises to replace older, less efficient heating systems by the end-2030. For County Meath, over the CDP six-year timeframe, this would result in the retrofit of 9564 houses which would be made up of 665 apartments, 932 terraced, 2790 semi-detached and 5177 detached houses to be retrofitted to a B rating. This assumes that the number of buildings retrofitted by type of dwelling are in the same proportion as the current existing housing stock. Assuming that the buildings outlined above are retrofitted from an E to a B rating, territorial assessment results in an emission reduction of 0.44 tCO2e/(capita, a) in building energy use. Using the same assumptions as the territorial side, applying the policy in 2026 leads to the retrofitted buildings requiring only 31% of the energy needed before the improvements took place. The retrofits are applied to approximately 15% of the housing stock, leading to overall energy savings in housing of around 10%. This leads to per capita annual emissions of 6.8 tCO2e and decreases total annual emissions by 0.35 tCO2e/(capita, a).
- Improving the provision of public transport
The policy aims at increasing the use of public transport and reducing passenger car transport. As the final measures for the implementation of this policy are not known, the results should be considered as a range of results, where the calculation outcome presents the maximum expected impact. If a reduction of 20% (from all annual passenger car vehicle-kilometers) is achieved on both roads and streets, territorial transport CO2e emissions in Meath will be reduced by 0.28 tCO2e/(capita, a), which is 10.9% of the total transport emissions. Applying simplified assumptions on bus services directly replacing passenger car transport, with average occupancy rates (passenger car 1.6; bus 16), the bus transport activity would need to increase by 60.8% in urban environments and 81.6% in rural environments to cover the respective need for transportation. For CBA, the policy was assumed to lead to a 20% reduction in private fuel purchases, a 10% reduction in private vehicle and maintenance purchases, and a 20% increase in public transport purchases. This gave per capita emissions of 6.9 tCO2e in 2026 across the whole of County Meath. The total emissions reductions were 0.31 tCO2e/(capita, a).
- Enhancing cycling and walking
If the promotion of active transport modes (walking and cycling) can reduce the passenger transport activity on road and rails for all transport activity in Meath County by 20%, the total territorial transport CO2e emissions will be reduced by 0.32 tCO2e/(capita, a) (12.5%). Additionally, here the results should be read as a range of possible impact, where a 0–20% reduction in motorized passenger transport will allow for a 0–12.5% GHG emissions reduction. CBA, in turn, assumed a 20% reduction in private fuel purchases and a 10% reduction in private vehicle and maintenance purchases, but without any increase in public transport purchases. This gave per capita emissions of 6.9
tCO2e in 2026 across the whole of County Meath. The total emissions reductions were 0.32 tCO2e/(capita, a).
- Increasing remote working
Active promotion of remote working can be expected to reduce the passenger transport in all vehicle categories. Assuming, however, that the reduction of passengers will have no impact on the bus and train services, the direct savings are gained in passenger car transport of the residents (60% of transport activity). According to the territorial assessment, a reduction of 5% in the residents’ passenger car transport would reduce the total transport emissions by 0.08 tCO2e (3.0%). CBA assumed a 20% reduction in private fuel purchases and a 10% reduction in private vehicle and maintenance purchases, but without any increase in public transport purchases. This gave per capita emissions of 6.9
tCO2e across the whole of County Meath. The total emissions reductions were 0.32 tCO2e/(capita, a).
4.3.2. Policy Quantification—City of Edinburgh
The results of the policy impact GHG quantification are presented in Table 6.
Table 6.
Results of the policy impact GHG assessment for the city of Edinburgh (tCO2e/(capita, a)).
- Retrofitting
To determine the number of retrofits that will be carried out over the eight-year timeframe of the NPF, the study made use of the Draft Edinburgh 2030 Climate Strategy—delivering a net zero climate ready Edinburgh [69]. This draft strategy identifies that approximately 42% of homes have an EPC rating of D or lower: ‘Regulations proposed by the Scottish Government in the national draft Heat in Buildings Strategy would mean that by 2035, all domestic properties will need to have an EPC rating of C or higher. For Edinburgh, this could be as many as 100,000 homes in Edinburgh that will require retrofitting.’
From the analysis carried out on Edinburgh’s residential sector, it was found that most buildings had an average EPC rating of D (apartments, terraced, semi-detached and detached housing were analyzed separately to find the average energy rating for the different dwelling types). Assuming that approximately 100,000 homes have to be retrofit by 2035, then over the NPF timeframe this would result in 53,000 homes to be retrofit from a D to a C rating, of which 36,040 are apartments, 6360 terraced, 5300 semi-detached and 5300 detached houses. This assumes that the number of buildings retrofitted by type of dwelling are in the same proportion as the current existing housing stock. The total territorial emission reduction from these retrofits equate to 0.19 tCO2e/(capita, a).
CBA assumes 53,000 houses to be retrofitted by 2035. This represents approximately 21% of the housing stock, based on the population of Edinburgh and the average household occupancy used in the calculation. The improved energy efficiency was assumed to be from a D to C rating, representing a reduction in energy use of around 30%. Applied to the whole building stock this leads to energy use being reduced by an approximate scale factor of 0.94. Applying this leads to pan city per capita emissions of 5.9 tCO2e in 2035 (the equivalent value for the baseline was 6.1 tCO2e). Applied across the whole of Edinburgh, this leads to total emissions savings of 0.16 tCO2e/(capita, a).
- The Borders railway line
The Borders railway line runs only for 7 km inside the borders of the Edinburgh city; therefore, the impact on the direct territorial GHG emissions remains small. Assuming that 90% of the passenger volume replaces directly the car transport in the city of Edinburgh, the GHG emission reduction is 0.01 tCO2e/(capita, a). The reduction would be doubled if the trains were electrified. The embodied emissions of infrastructural investments were excluded from the study.
In CBA, this policy led to per capita emissions across the whole of Edinburgh of 5.4 tCO2e (the equivalent per capita emissions in the baseline were 5.7 tCO2e). This would lead to an equivalent emissions reduction of 0.21 tCO2e/(capita, a).
- Enhancing cycling and walking
Assuming that this policy reduces all motorized passenger transport in the city of Edinburgh by up to 10% (equally for car, bus, tram and train transport), the total territorial impact is 0.07 tCO2e/(capita, a).
For CBA, this policy was assumed to lead to a reduction in purchases of fuel for private transport of 20% and purchases of vehicles and vehicle maintenance of 10%. No changes were made to the expenditure on public transport. This policy was applied in 2030. The annual per capita emissions across the whole of Edinburgh were found to be 6.2 tCO2e (the equivalent emissions in the baseline scenario were 6.5 tCO2e in this year). This leads to a total emissions reduction of 0.27 tCO2e/(capita, a) in 2030.
- High speed rail
High speed rail is a national endeavor that will improve Edinburgh’s connections in every direction. Its direct net GHG impacts inside the city boundary depend on the last mile solutions. Assuming that a more fluent rail connection replaces 10% of the passenger car transport within the city boundary, and 10% more bus transportation is needed, the net reduction in GHG emissions totals 0.04 tCO2e/(capita, a). The embodied emissions of the investment are excluded. If all passenger train transportation in Edinburgh is electrified in this occasion, an additional GHG emissions reduction of 0.02 tCO2e/(capita, a) is gained.
The consumption approach looks at the carbon footprint of private residents. This means that the emissions from freight transport are not directly considered. However, given that the approach models the whole supply chain, a proportion of the freight travel that can be related to products purchased by the residents of the area could, in principle, be considered. This policy was illustratively modelled via a 20% reduction in private transport fuel consumption and a 20% increase in expenditure on public transport. The share of rail in public transport expenditure was also increased from 0.54 to 0.6 and private vehicle purchases and maintenance were reduced by 10%. The effects of these changes yielded per capita emissions of 5.8 tCO2e. The total emissions reduction was 0.23 tCO2e/(capita, a).
4.3.3. Policy Quantification—Rathlin Island
The results of the policy impact GHG quantification are presented in Table 7.
Table 7.
Results of the policy impact GHG assessment for Rathlin Island (tCO2e/(capita, a)).
- Retrofitting
There are no indicative numerical proposals in the NAP; however, when addressing actions such as retrofit in buildings the Consultation on Policy Options for the Energy Strategy for Northern Ireland developed by the Department for the Economy, suggests that a ‘peak of 50,000 homes might need to be retrofitted annually’ [70]. This would mean that in Rathlin Island, a total of six homes per year have to be retrofitted to a C or B EPC rating (as suggested in the Energy Strategy).
By proportioning the retrofits depending on the number of dwellings for each building type (apartments, terraced, etc.), of these six homes that need to be retrofitted each year: one terraced, three semi-detached and two detached houses need to be retrofitted (apartments have been included, however, as there are only 4 apartments in Rathlin and they are proportionally too small to account for, considering that only 6 retrofits are to be completed per year). Retrofitting these households from an assumed E to a C EPC rating would result in a reduction of 0.30 tCO2e/(capita, a) in the territorial building sector GHG emissions.
The same assumption was made regarding the number of houses to be retrofitted for CBA. The houses were originally assumed to be at energy class E and were upgraded to energy class C. It is assumed that this leads to household energy savings of around 54%. This results in per capita emissions of 12.2 tCO2e across the whole population (the emissions of the residents of the retrofit homes would be necessarily less). The baseline equivalent would be 12.3 tCO2e and the total emissions savings would be 0.18 tCO2e/(capita, a). If the retrofit was to energy class B (68% savings), then the savings would be 0.23 tCO2e/(capita, a) and per capita emissions would be 12.1 tCO2e.
- Improving the provision of public transport
The territorial impact assessment shows that if 20% of passenger car transport on Rathlin (excluding 4 × 4 s and vans) is replaced by local bus transportation, the GHG emissions are reduced by 0.01 tCO2e/(capita, a).
For CBA, this policy was implemented through a 20% reduction in private fuel purchases, a 10% reduction in purchases towards car ownership and maintenance, and a 20% increase in expenditure by households on public transport. The per capita emissions across the whole of Rathlin Island were 11.8 tCO2e following this policy. This led to a savings of 0.55 tCO2e/(capita, a) in total when considered against the baseline emissions.
- Enhancing cycling and walking
The policy promoting the active modes of transport was quantified with similar assumptions than the previous policy. A 20% reduction in car passenger transport (excluding 4 × 4 s and vans) results in a reduction of 0.01 tCO2e/(capita, a) for Rathlin.
Respectively, CBA applied the same reductions in private transport as the previous policy, but without any increase in the expenditure on public transport. This led to per capita emissions of 11.7 tCO2e and a total emissions savings of 0.58 tCO2e/(capita, a).
- Increasing remote working
According to the territorial assessment, this policy also reduces GHG emissions by 0.01 tCO2e/(capita, a) for Rathlin. The small impact of transport-related policies is due to the relatively short driving distances on the island.
For CBA, the impact of increasing remote working was assumed to provide a 20% reduction in private transport fuels, but no changes to public transport expenditure or expenditure on private vehicle ownership by households. This led to per capita emissions of 11.8 tCO2e in 2026 and a total savings of 0.56 tCO2e/(capita, a). However, increased telecommuting could also lead to an increase in energy use by households. This could also be modelled via a 5% increase in the expenditure on household heating. In this case, the per capita emissions would be 12.1 tCO2e and the savings would be reduced to 0.23 tCO2e/(capita, a). However, it is important to stress that energy use in commercial or municipal buildings, which may decrease with more telecommuting, cannot be tracked using a household carbon footprint approach. Therefore, part of the carbon footprint is being reassigned from people’s place of work to the household. Assuming these energy savings would be equivalent to the increase in private households leads to these factors cancelling out.
4.3.4. Policy Quantification—Kymenlaakso Region
The results of the policy impact GHG quantification are presented in Table 8.
Table 8.
Results of the policy impact GHG assessment for Kymenlaakso (tCO2e/(capita, a)).
- Retrofitting
If retrofit buildings were to eliminate the use of coal and peat, and also make use of renewable energy generation for 20% of electricity usage in Kymenlaakso, the territorial analysis shows a GHG emissions reduction of 0.29 tCO2e/(capita, a), of which 0.26 tCO2e/(capita, a) would be reduced from the residential sector and 0.03 tCO2 e/(capita, a) from the commercial sector. Consumption-based GHG emissions savings are on the order of 0.05 tCO2e/(capita, a) for the whole of Kymenlaakso. These changes are low, as most solid fuels are already distributed to wood, and both wood and electricity have low emission factors for Finland using the consumption approach.
- Improvement of Road 15 (Kouvola-Kotka)
This investment has an impact only on the road transport in Kotka and Kouvola, where the transport activity for Road 15 was first estimated with the help of GIS data from the Finnish Transport Infrastructure Agency [71]. By reducing congestion, this policy reduces the average passenger car emission factor for road driving in Kotka 3.7% and Kouvola 4.1%. The same impact was applied on the emission factors of bus and road freight transport. The result shows an annual reduction potential of −0.02 tCO2e in passenger car transport. However, the GHG emissions of Road 15 transport increase due to the higher average speed, resulting to a net GHG emissions increase of 0.01 tCO2e/(capita, a). It is also important to notice that a more fluent road connection may increases the volume of road transport, which further increases the road transport GHG emissions. The embodied GHG emissions of the new infrastructure were excluded from the study.
The respective CBA assumed a 20% increase in expenditure on private transport fuels, an increase in private car purchases of 10%, and a 20% reduction in public transport expenditure. The percentage of total public transport expenditure on bus travel was increased to 60% from a starting value of 50%. This would lead to per capita emissions in 2030 of 7.0 tCO2e and would increase the total emissions in the region by 0.30 tCO2e/(capita, a).
- Biogas station network
As a consequence of this policy, the share of bio methane-fueled passenger cars is assumed to increase up to 20% in the local transport. Transit transport continues to operate with a vehicle fleet equal to the Finnish average car fleet in the baseline situation. According to the territorial accounting, this would provide a reduction of 0.04 tCO2e/(capita, a), corresponding to 2.0% of the total transport sector GHG emissions.
For the consumption-based analysis, it was assumed that a doubling of biofuels use also led to a doubling of biofuel purchases by residents. In principle, these may not be exactly equivalent if residents of the area make a significant number of fuel purchases outside of the region. Introduction of this policy would lead to biofuel use in private transport of around 40%. In turn, this leads to per capita emissions of 6.5 tCO2e in 2030. The equivalent emission in the baseline scenario would be 6.7 tCO2e. In turn, the emissions savings were 0.22 tCO2e/(capita, a) in 2030.
- Improvement of main rail connection
As with the policy concerning a bio methane station network, no quantitative information detailing the expected modal shift changes were provided for this policy, and so the results should be seen as indicative. The territorial assessment estimated that the improved rail transport reduces the passenger car transport in Kouvola by 5% in vehicle–kilometers on streets and by 10% in vehicle–kilometres on roads. The latter is based on the assumption that more fluent rail connection mainly reduces transit transport. For the municipalities around Kouvola, the passenger car transport activity is assumed to remain on the same level, as the trip to the Kouvola railway station would most likely utilize a passenger car. This impact would equal to 22 million passenger–kilometres per year, resulting in a GHG reduction of 0.02 tCO2e/(capita, a). The total reduction in passenger transport emissions is 0.01 tCO2e/(capita, a). If the freight transport on roads decreases by 5% in Kouvola, by 3% in Pyhtää and by 2% in Hamina and Virolahti, the total reduction in GHG emissions is 0.02 tCO2e/(capita, a). Assuming, in addition, that one new freight train with a diesel engine drives twice per week through the Kymenlaakso area in the East–West direction (2 × 60 km/week), the annual GHG emissions increase by 84 tCO2e/a. The total net reduction in freight transport emissions is 0.02 tCO2e/(capita, a).
CBA was based on the assumption that this policy led to a 20% reduction in private transport fuel purchases, and an equivalent percentage increase in public transport expenditure by households. Moreover, expenditure on the purchase and maintenance of vehicles was also reduced by 10%. Finally, the percentage of public transport on rail travel was increased to 50% from a starting value of 35%, at the expense of bus travel. These changes would lead to total savings across the whole region of 0.20 tCO2e/(capita, a).
5. Discussion
The aim of the study was to present territorial and consumption-based GHG emissions analyses for four European case studies. In doing so, it attempts to bridge the gap in studies comparing and analyzing the scopes and the results of the two methods with real life cases. Furthermore, we assessed the impacts of selected spatial planning policies using both approaches to specify implications for spatial planning, as well as to analyze how they complement each other. The methods used in the study are applicable across Europe, and therefore, this study also provides a benchmark towards European level methodological harmonization. Next, we first discuss the key findings and the implications for spatial planning, the arising improvement needs in spatial planning, and finally we provide some future research recommendations based on the findings and the limitations of this study.
5.1. Utility of the Two Approaches
The net result for territorial GHG emissions seem to suggest that no further climate action is needed on Rathlin Island—carbon neutrality has already been achieved. However, the break-down of sectoral results shows that carbon sequestration in the land use sector masks rather large emissions from energy use in buildings. Moreover, the CBA result shows that the overall carbon footprint of residents is in fact relatively large, occurring largely outside of the territorial boundary, so there is still a lot of room for reducing greenhouse gas emissions. Both results point at the mitigation potential in the energy consumption of buildings, indicating a significant potential for reducing greenhouse gas emissions through retrofitting measures and the conversion of heating systems in detached houses. Rathlin’s low territorial transport GHG emissions are explained by the fact that the island has no transit traffic, and the transport of residents takes place mainly on the mainland outside of the Rathlin area.
Understanding this allocation principle helps interpret the results of other case studies where the origin of emissions is more complex. In general, it seems that the territorial GHG emissions results for land use can provide useful implications, whereas territorial results for transport are more prone to misinterpretations, especially when the results are announced per capita. The transport activity captured by an administrative border is more or less arbitrary, and this feature is enhanced at a smaller scale. CBA can provide information on residents’ GHG emissions that occur outside the territorial boundary, but unfortunately the method tends to lose its applicability towards the smallest scales.
National investments in transport infrastructure place a burden on territorial GHG emissions of the region, even though the investments serve much wider needs. This is an important consideration also in the context of regional climate goals and GHG mitigation aiming at carbon neutrality: a region, territory or city must also offset the greenhouse gas emissions of transit transport and related infrastructure in order to claim territorial carbon neutrality, and this offset is not dimensioned to compensate for the global carbon footprint of the inhabitants of that region.
The allocation principle also explains the results for some policy impacts, such as the investment in the Kymenlaakso bio methane fuel station network. The new network in Kymenlaakso cannot be expected to affect the non-residents’ vehicle fleet. The share of transit traffic (transportation of goods and passenger transport by non-residents) is relatively high in the Kymenlaakso region. Therefore, the results show higher impact in the CBA result (−0.28 tCO2e/(capita, a)) than in the territorial result (−0.04 tCO2e/(capita, a)).
Similarly, an improvement in long-distance train services would attract residents living in the vicinity of the Kouvola railway station to choose the train more often, but the reduction in territorial emissions in Kymenlaakso is rather small (−0.03 tCO2e/(capita, a)). The benefits are more clearly reflected in the CBA results, which reflect the change in the modal share of local residents (−0.26 tCO2e/(capita, a)).
CBA may reveal positive climate impacts that otherwise would not become visible. However, the results from territorial analysis and CBA also deviate because they represent different allocation principles, and therefore, also the climate impacts of two different activities. It is important to also notice that there may be inconsistency in the impact assessment assumptions by the two different methods of this study, in particular in the expected impact on household expenditure, regional activities and carbon intensities.
In case the success of a single policy is measured merely against the local climate target that is expressed as an annual net balance of the territorial GHG emissions, sequestration and offset measures, such as carbon neutrality, then it is obvious that territorial results have more relevance for local decision-making. However, it is important to notice that spatial planning is one of the key enablers of carbon-neutral lifestyles. As argued by Säynäjoki [72], a better understanding of the link between urban structure and sustainable lifestyles or consumption choices could in fact lead to greater success in reducing environmental load through spatial planning.
5.2. Implications for Spatial Planning
According to the territorial GHG analyses, the impacts of the selected spatial planning policies range as follows:
- County of Meath: 0.10–0.44 tCO2e/(capita, a);
- City of Edinburgh: 0.01–0.19 tCO2e/(capita, a);
- Rathlin Island: 0.01–0.30 tCO2e/(capita, a);
- Kymenlaakso region: −0.01–0.29 tCO2e/(capita, a).
As the impact of a single policy is very much context-dependent, an interregional comparison would not be justified. However, it is important to notice that the evaluation of results is difficult without benchmarks. In this study, the review of the sectoral territorial baseline results implicated the GHG reduction potential for the building sector in Rathlin Island.
It should also be noted that embodied emissions were not included in this study. Many spatial planning policies require investments of material and energy that would cause a significant peak in GHG emissions during the policy implementation, after which the GHG reductions assessed in this study are expected to cause permanent annual GHG emission reductions. At the planning stage, detailed plans for infrastructural investments or retrofits are usually not available, and therefore the assessment of embodied GHG emissions are based on previous studies and estimates.
CBA results show the following impacts for the spatial planning policies of this study:
- County of Meath: 0.31–0.35 tCO2e/(capita, a);
- City of Edinburgh: 0.16–0.27 tCO2e/(capita, a);
- Rathlin Island: 0.18–0.58 tCO2e/(capita, a);
- Kymenlaakso region: −0.30–0.22 tCO2e/(capita, a).
The baseline results from CBA are comparable and all-inclusive; yet, the context dependency of policies means also here that the impact of a single policy changes from area to area. Attention should be paid to the top–down nature of the EEIO method as well as the simplifications of impact assessment: local policies are expected to rather linearly influence the household expenditure, but in reality the mechanisms that affect consumption patterns may be more complicated.
The results seem to serve the needs of spatial planning in at least two ways:
- Supporting the prioritization of policies;
- Enabling comparison of alternative planning solutions.
For a policy that is primarily a measure for GHG mitigation, such as a bio-methane station network or promotion of active transportation modes, impact assessment enables straight forward cost–benefit analyses where the long-term environmental benefits are evaluated against the financial cost and the immediate GHG impact of the investment. However, the decisions of spatial planning are typically more complex, serving diverse needs of the stakeholders and society, such as improvements or extensions of highway or railroad networks in this study. In this case, GHG impact is one of the aspects to be considered among others.
Secondly, GHG impact assessment can serve comparison of alternative solutions. This is typically the case with a densification strategy; new construction will increase absolute emissions in any case, but a comparison may reveal a difference between the construction of a new settlement and the densification of an existing urban fabric. For these cases, the alternatives should be clearly specified in order to gain reliable indications from GHG assessment.
More generic observations of the impact assessment are:
- The final policy impact depends on the success of implementation, and therefore any result should be considered as the expected maximum impact for a single policy.
- Spatial planning has long-term impacts, and the future perspective should be taken into consideration in impact assessment by applying scenarios. The grid electricity is expected to have a declining carbon intensity in all three countries included in this study; without scenarios, inter alia, the impacts of the transport electrification policies are overestimated.
- Several policies drive the use of electricity or low carbon fuels in transport; the comparison of alternative sources of power may be misleading if well-to-tank emissions are excluded from the study.
Based on this study, the provision of a better understanding of the regional differences in GHG emission sources and mitigation potentials is actually the main function of the sub-national GHG inventories and the impact assessment in spatial planning.
In general, it seems that the GHG assessment results are expected to favor densification strategies. The four case studies show that the realm of spatial planning is more diverse. Densification—i.e., guiding the new settlement aside the public transportation corridors, for example—would seem beneficial in Meath County, whereas on Rathlin Island the set of viable GHG reduction policies looks totally different.
5.3. Needs to Improve Spatial Planning Practises
The ESPON EGTC overview of planning systems in Europe [7] defines spatial planning systems as “the ensemble of institutions that are used to mediate competition over the use of land and property, to allocate rights of development, to regulate change and to promote preferred spatial and urban form”, acknowledging the wide variation in the spatial planning systems across Europe as they are historically rooted in place and language. Previously, Newman and Thornley [73] characterised the differences through a typology of five “planning families”, of which two are represented in this study.
The review of the spatial planning documents of this study also seems to confirm the differences among the planning systems: where the Finnish planning documentation is characterized by the plan’s role in national planning hierarchy; and by map-based representation, the Irish and British documents are more strategic in their implications, applying only a text-based format. It is also important to notice that in the UK, Scotland and Northern Ireland, both have their own legal and administrative arrangements on spatial planning.
Some differences are explained by the fact that the Finnish case study is a region and therefore the policies, despite their local nature, are derived from the perspective of regional planning. Additionally, the actions quantified for the city of Edinburgh implement the national planning framework. The policies for the case studies of Meath County are mainly based on the general planning considerations, whereas the policies for Rathlin Island could be addressed either in a general plan or even in a local detailed plan. None of the policies included in this study are about the GHG impact of new development, although this is often considered as a typical spatial planning case.
The policy impact assessment starts by identifying the changes that the policy is expected to bring about in the sectors included in the baseline GHG emissions inventory. These changes are first quantified, for example in terms of expected changes in modal shares or energy consumption. The relative GHG emissions impact can be calculated on the basis of these numerical changes.
The spatial planning documents included in this study do not provide numeric indications on the expected impacts. Since GHG impact is an important factor in spatial planning decisions, the current practice could be greatly improved by systematically providing numerical information on the desired or expected impact of a policy—for example, expressed as a percentage describing the range of expected impact. This finding is in line with the observations of Hurliman et al. [74], although the policies assessed in this study were more explicitly aimed at GHG mitigation. Using the two approaches of territorial accounting and CBA, the expected impact should be expressed in a coherent manner for the two methods: as an impact on the consumption patterns of local residents and as a change in sectoral activity data or carbon intensity for territorial evaluation.
The cross-examination of the results from two different accounting approaches can clearly provide a better understanding of GHG emissions. In accordance with the notions of the 5th IPCC report [22], the four case studies show that the interpretation of the results requires some methodological knowledge. On the other hand, it is also evident that impact assessment requires a thorough knowledge of the local context, especially when policy documents do not provide any quantitative information on expected impacts. Only large cities and regions can be expected to have in-house experts with both methodological expertise and local knowledge. This is a major obstacle to systematic and effective impact assessment practice in spatial planning.
For climate action, spatial planning provides an opportunity for climate action that recognizes the specificities of the area of concern and can exploit opportunities that are beyond the reach of national climate policies, which must treat all regions equally and rarely apply data that is fine-grained enough for local needs. Therefore, outsourcing the assessment of greenhouse gas impacts to expert consultants outside the region cannot alone be a model for systematically assessing the climate impacts of spatial planning.
As explained above, spatial planning practice can take a step towards bridging the gap by providing quantitative information on the desired impact for each planning policy, which should be expressed in two ways to allow for two quantification approaches. A methodological understanding that supports a correct and useful interpretation of the results could be supported by transparency of inventories, tools and guides, as well as by a proper methodological description that clearly indicates whose emissions have been taken into account.
5.4. Future Research Needs
The primary purpose of this study was to show, through different types of European case studies, how fundamentally different the two assessment methods are and to discuss how the results from territorial assessment and CBA can be used together to support spatial planning. As a lot of effort is invested in climate action in regions and cities, it would be of utmost importance that the implications of the GHG accounting are correct and understandable.
Many compromises had to be made in the assessments for the case studies of this study for various reasons: the methodological approach of the study aims at robust, pan-European applicability; the data available is diverse; and the policy documentation lacks quantitative indications regarding the expected impact. In the future, it would be necessary to ensure the consistency and representativeness of the data as well as the scenarios which are essential in spatial planning that are about long-term developments. While the impact assessments of this study can provide a rough example that can serve as a benchmark, it is obvious that a more detailed analysis of the precise impacts of different policies and technological developments is needed to be able to assess the likely consequences in a reliable manner.
Due to the recent developments in data acquisition, it would be necessary to explore the potential of harmonization regarding data collection and the underlying assumptions at the sub-national scale, and to develop methodological approaches for local detail planning, as the applicability of the methods described in this paper are substantially reduced at the smaller scales of spatial planning.
6. Conclusions
This study conducted territorial and consumption-based baseline analyses for the GHG emissions of four European case studies, using coherent methods that are applicable at various scales of spatial planning across Europe. Furthermore, it assessed the GHG impacts for several spatial planning policies that are relevant to the case study areas and provided interpretations of the results. Based on this study, it seems that the variation in European spatial planning systems is no obstacle to developing practices towards more systematic, coherent, and transparent GHG impact assessment—for example, by providing quantitative information on the expected impact of local climate policies in the planning documents. On the other hand, understanding the allocation principle is crucial for the interpretation of the impact assessment results that are expected to steer local decision-making and inform spatial planning.
Although benchmarks can be most useful for the interpretation of the results, direct comparisons of territorial results are not justified due to the underlying emissions allocation principle. Moreover,
the case study results showed that monitoring GHG emissions through a single net emissions figure can give false indications.
There is a great variety in the assessment area sizes and the range of GHG emissions captured within the selected territorial boundary. The territorial policy impact assessment shows low reduction potential whenever the activity that is influenced by the policy mainly occurs outside the assessment area (see for example, the transport-related policies for Rathlin Island). However, the policy’s full impact on the residents’ global carbon footprint becomes visible in CBA. Therefore, it would be beneficial to apply both territorial and consumption-based approaches to measure the success of local climate action.
Sub-national GHG analyses are based on local data from a variety of sources. Given the recent advancements in data acquisition, it would be crucial to investigate the feasibility of standardizing data collection on a sub-national level, as well as the underlying assumptions.
Based on this study, the identification of specificities and regional differences in both GHG emission sources and mitigation potentials is the main function of sub-national GHG inventories and, subsequently, the impact assessment for spatial planning. It should be noted that the territorial GHG analyses of this study were limited to three key sectors of GHG emissions only: energy use in buildings, transport, and land use. However, the focus of this study was not on the advances of impact assessment but rather on the cross-territorial coherence in sub-national GHG accounting and the utility of the two quantification approaches in informing the decisions of spatial planning.
Author Contributions
Methodology and investigation (CBA), P.R.W.; data curation (land-use GIS), D.C.; methodology and investigation (LULUCF), K.K.; methodology and investigation (buildings), R.C.; methodology and investigation (transport), K.L.; writing—original draft preparation, K.L.; writing—review and editing, J.H.; funding acquisition, K.L.; validation, A.J.; resources, U.N.; supervision, J.H.; project administration, K.L. All authors have read and agreed to the published version of the manuscript.
Funding
The results are based on the analyses conducted in the QGasSP project (2020–2021), TA28, funded by ESPON EGTC, Service Contract ref—EE/SO2/114/2020.
Data Availability Statement
The baseline results of this study can be sourced from the ESPON database portal at https://database.espon.eu/ (accessed on 9 April 2023). Please notice that some results were recalculated for this article.
Acknowledgments
The authors wish to express their gratitude to the stakeholders in the QGasSP project (2020–2021): Eastern and Midland Region of Ireland; Scottish Government; Department of Infrastructure, Northern Ireland; Regional Council of Kymenlaakso; Marjan van Herwijnen (project expert) and Marta Roca (financial expert) (ESPON EGTC). The authors wish to express their gratitude for the indispensable contribution made by Kaja Peterson, the lead of the SEI research team and a colleague, who unfortunately passed away towards the end of the QGasSP project.
Conflicts of Interest
The authors declare no conflict of interest. The funders had no role in: the design of the study; in the collection, analyses, or interpretation of data; in the writing of the manuscript; or in the decision to publish the results.
Notes
| 1 | Estimation is based on a study by Kertsmik et al. [68] providing, inter alia, the LCA module A1-3 and A5 GHG emissions for a number of alternative retrofit solutions. |
References
- Steffen, W.; Broadgate, W.; Deutsch, L.; Gaffney, O.; Ludwig, C. The trajectory of the Anthropocene: The Great Acceleration. Anth. Rev. 2015, 2, 81–98. [Google Scholar] [CrossRef]
- IPCC. AR6 Synthesis Report. Climate Change 2023. Available online: https://www.ipcc.ch/report/ar6/syr/ (accessed on 3 May 2023).
- Mi, Z.; Guan, D.; Liu, Z.; Liu, J.; Viguié, V.; Fromer, N.; Wang, Y. Cities: The core of climate change mitigation. J. Clean Prod. 2019, 207, 582–589. [Google Scholar] [CrossRef]
- Halleux, V. Cities: Front Line of Climate Action. Briefing. February 2018. European Union, 2018. Available online: https://www.europarl.europa.eu/RegData/etudes/BRIE/2018/614701/EPRS_BRI(2018)614701_EN.pdf (accessed on 1 May 2023).
- Watts, M. Cities spearhead climate action. Nature Clim. Chang. 2017, 7, 537–538. [Google Scholar] [CrossRef]
- Ravetz, J.; Neuvonen, A.; Mäntysalo, R. The new normative: Synergistic scenario planning for carbon-neutral cities and regions. Reg. Stud. 2021, 55, 150–163. [Google Scholar] [CrossRef]
- Nadin, V.; Fernández Maldonado, A.M.; Zonneveld, W.; Stead, D.; Dąbrowski, M.; Piskorek, K.; Sarkar, A.; Schmitt, P.; Smas, L.; Cotella, G.; et al. COMPASS—Comparative Analysis of Territorial Governance and Spatial Planning Systems in Europe; ESPON EGTC: Luxembourg, 2018. [Google Scholar]
- European Commission. Directive 2001/42/EC of the European Parliament and of the Council of 27 June 2001 on the Assessment of the Effects of Certain Plans and Programmes on the Environment. Available online: https://eur-lex.europa.eu/legal-content/EN/TXT/?uri=CELEX:32001L0042 (accessed on 5 March 2023).
- Loiseau, E.; Junqua, G.; Roux, P.; Bellon-Maurel, V. Environmental assessment of a territory: An overview of existing tools and methods. J. Environ. Manag. 2012, 112, 213–225. [Google Scholar] [CrossRef]
- Dahal, K.; Niemelä, J. Cities’ Greenhouse Gas Accounting Methods: A Study of Helsinki, Stockholm, and Copenhagen. Climate 2017, 5, 31. [Google Scholar] [CrossRef]
- Chen, G.; Shan, Y.; Hu, Y.; Tong, K.; Wiedmann, T.; Ramaswami, A.; Guan, D.; Shi, L.; Wang, Y. Review on City-Level Carbon Accounting. Environ. Sci. Technol. 2019, 53, 5545–5558. [Google Scholar] [CrossRef]
- Balouktsi, M. Carbon metrics for cities: Production and consumption implications for policies. Build. Cities 2020, 1, 233–259. [Google Scholar] [CrossRef]
- Fong, W.K.; Sotos, M.; Doust, M.; Schultz, S.; Marques, A.; Deng-Beck, C.; Kovac, A.; Bhatia, P.; Russell, B.; Morris, E.; et al. Global Protocol for Community-Scale Greenhouse Gas Emissions. An Accounting and Reporting Standard for Cities; WRI, C40 Cities, ICLEI: Bonn, Germany, 2014. [Google Scholar]
- Athanassiadis, A.; Christis, M.; Bouillard, P.; Vercalsteren, A.; Crawford, R.H.; Khan, A.Z. Comparing a territorial-based and a consumption-based approach to assess the local and global environmental performance of cities. J. Clean. Prod. 2018, 173, 112–123. [Google Scholar] [CrossRef]
- Heinonen, J.; Ottelin, J.; Ala-Mantila, S.; Wiedmann, T.; Clarke, J.; Junnila, S. Spatial consumption-based carbon footprint assessments—A review of recent developments in the field. J. Clean. Prod. 2020, 256, 120335. [Google Scholar] [CrossRef]
- C40. Consumption-Based GHG Emissions of C40 Cities; C40 Cities Climate Leadership Group: 2018. Available online: https://apo.org.au/node/185046 (accessed on 1 May 2023).
- Kuntien ja Alueiden Kulutusperäiset Kasvihuonekaasupäästöt. Suomen ympäristökeskus, Helsinki. Available online: https://kulutus.hiilineutraalisuomi.fi/ (accessed on 11 March 2023).
- Ottelin, J.; Ala-Mantila, S.; Heinonen, J.; Wiedmann, T.; Clarke, J.; Junnila, S. What can we learn from consumption-based carbon footprints at different spatial scales? Review of policy implications. Environ. Res. Lett. 2019, 14, 093001. [Google Scholar] [CrossRef]
- Afionis, S.; Sakai, M.; Scott, K.; Barret, J.; Gouldson, A. Consumption-based carbon accounting: Does it have a future? Wiley Interdiscip. Rev. Clim. Chang. 2017, 8, e438. [Google Scholar] [CrossRef]
- Säynäjoki, E.-S. The Untapped Potential of Urban Planning: Achieving Greater Success in Environmental Sustainability. Ph.D. Thesis, Aalto University, Espoo, Finland, 2015. [Google Scholar]
- Heinonen, J.; Kyro, R.; Junnila, S. Dense downtown living more carbon intense due to higher consumption: A case study of Helsinki 2011. Environ. Res. Lett. 2011, 6, 034034. [Google Scholar] [CrossRef]
- Seto, K.C.; Dhakal, S.; Bigio, A.; Blanco, H.; Delgado, G.C.; Dewar, D.; Huang, L.; Inaba, A.; Kansal, A.; Lwasa, S.; et al. Human Settlements, Infrastructure and Spatial Planning. In Climate Change 2014: Mitigation of Climate Change. Contribution of Working Group III to the Fifth Assessment Report of the Intergovernmental Panel on Climate Change; Edenhofer, O., Pichs-Madruga, R., Sokona, Y., Farahani, E., Kadner, S., Seyboth, K., Adler, A., Baum, I., Brunner, S., Eickemeier, P., et al., Eds.; Cambridge University Press: Cambridge, UK; New York, NY, USA, 2014; pp. 923–1000. [Google Scholar]
- Lenk, C.; Arendt, R.; Bach, V.; Finkbeiner, M. Territorial-Based vs. Consumption-Based Carbon Footprint of an Urban District—A Case Study of Berlin-Wedding. Sustainability 2021, 13, 7262. [Google Scholar] [CrossRef]
- Heinonen, J.; Ottelin, J.; Guddisardottir, A.K.; Junnila, S. Spatial consumption-based carbon footprints: Two definitions, two different outcomes. Environ. Res. Commun. 2022, 4, 025006. [Google Scholar] [CrossRef]
- Espon.eu/QGasSP. Available online: https://www.espon.eu/QGasSP (accessed on 5 April 2023).
- County of Meath. Meath Climate Action Strategy 2019–2024. Meath County Council: Meath, Ireland 2019. Available online: https://www.meath.ie/system/files/media/file-uploads/2019-09/Meath%20CC%20Report_v4_0.pdf (accessed on 1 May 2023).
- Savikko, H.; Hokkanen, J.; Koutonen, H.; Haanpää, E. Hiilineutraali Kymenlaakso 2040. Kasvihuonekaasupäästöt, Hiilinielut ja Tiekartta Vuoteen 2040; Kymenlaakson Liitto: Kotka, Finland, 2019. [Google Scholar]
- EU Buildings Database. Available online: https://ec.europa.eu/energy/eu-buildings-database_en (accessed on 28 February 2023).
- Koffi, B.; Cerutti, A.K.; Duerr, M.; Iancu, A.; Kona, A.; Janssens-Maenhout, G. Covenant of Mayors for Climate and Energy: Default Emission Factors for Local Emission Inventories—Version 2017; European Commission: Luxembourg, 2017. [Google Scholar]
- Urban Atlas: Street Tree Layer (STL 2018). Available online: https://land.copernicus.eu/local/urban-atlas/street-tree-layer-stl-2018?msclkid=a885ee26be1211ecbdd810a395525cb5 (accessed on 17 April 2022).
- Eggelston, H.S.; Buendia, L.; Miwa, K.; Ngara, T.; Tanabe, K. (Eds.) 2006 IPCC Guidelines for National Greenhouse Gas Inventories; IGES: Hayama, Japan, 2006; Available online: https://www.ipcc.ch/report/2006-ipcc-guidelines-for-national-greenhouse-gas-inventories/ (accessed on 1 May 2023).
- Hiraishi, T.; Krug, T.; Tanabe, K.; Srivastava, N.; Baasansuren, J.; Fukuda, M.; Troxler, T.G. (Eds.) 2013 Supplement to the 2006 IPCC Guidelines for National Greenhouse Gas Inventories: Wetlands; IPCC: Geneva, Switzerland, 2014; Available online: https://www.ipcc.ch/site/assets/uploads/2018/03/Wetlands_Supplement_Entire_Report.pdf (accessed on 1 May 2023).
- Calvo Buendia, E.; Guendehou, S.; Limmeechokchai, B.; Pipatti, R.; Rojas, Y.; Sturgiss, R.; Tanabe, K.; Wirth, T.; Romano, D.; Witi, J.; et al. 2019 Refinement to the 2006 IPCC Guidelines for National Greenhouse Gas Inventories; IPCC: Geneva, Switzerland, 2019; Available online: https://www.ipcc.ch/site/assets/uploads/2019/05/01_2019rf_OverviewChapter.pdf (accessed on 1 May 2023).
- National Inventory Submissions 2021 | UNFCCC. Available online: https://unfccc.int/ghg-inventories-annex-i-parties/2021 (accessed on 1 May 2023).
- European Soil Database Maps. Available online: https://esdac.jrc.ec.europa.eu/resource-type/european-soil-database-maps (accessed on 2 April 2023).
- FAO. World Reference Base for Soil Resources 2014. International Soil Classification System for Naming Soils and Creating Legends for Soil Maps; Update 2015. World Soil Resources Reports 106; FAO: Rome, Italy, 2014. [Google Scholar]
- Ireland. 2021 Common Reporting Format (CRF) Table. UNCC 2021. Available online: https://unfccc.int/documents/271516 (accessed on 17 April 2022).
- Finland. 2021 Common Reporting Format (CRF) Table. UNCC 2021. Available online: https://unfccc.int/documents/271520 (accessed on 17 April 2022).
- UK Department for Business, Energy & Industrial Strategy. UK Greenhouse Gas Inventory 1990 to 2019: Annual Report for Submission under the Framework Convention on Climate Change; UK Department for Business, Energy & Industrial Strategy: Harwell, UK, 2021.
- Capros, P.; De Vita, A.; Tasios, N.; Siskos, P.; Kannavou, M.; Petropoulos, A.; Evangelopoulou, S.; Zampara, M.M.; Papadopoulos, D.; Nakos, C.; et al. EU Reference Scenario 2016. Energy, Transport and GHG emissions. Trends to 2050; European Commission: Brussels, Belgium, 2016. [Google Scholar]
- Energiateollisuus ry. Kaukolämpötilasto 2019; Energiateollisuus ry: Helsinki, Finland, 2020. [Google Scholar]
- Census 2016 Reports. Available online: https://www.cso.ie/en/census/census2016reports/ (accessed on 2 April 2023).
- BER Research Tool. Available online: https://data.gov.ie/en_GB/dataset/ber-research-tool (accessed on 2 April 2023).
- Department of Transport. Transport Trends 2020. An Overview of Ireland’s Transport Sector; Department of Transport: Dublin, Ireland, 2021.
- TII Transport Infrastructure Ireland. Available online: https://www.tii.ie/ (accessed on 2 April 2023).
- National Transport Authority. Available online: https://www.nationaltransport.ie/publications/ (accessed on 2 April 2023).
- LIPASTO Unit Emissions. Available online: http://www.lipasto.vtt.fi/yksikkopaastot/indexe.htm (accessed on 23 October 2021).
- DEFRA. 2019 Government Greenhouse Gas Conversion Factors for Company Reporting. Methodology Paper for Emission Factors. Final Report; Department for Business, Energy & Industrial Strategy: London, UK, 2019.
- National Records of Scotland. Available online: https://www.gov.uk/national-records-of-scotland (accessed on 2 April 2023).
- McElrone, M. Development of a sustainable energy strategy for Rathlin Island. Master’s Thesis, Queen’s University Belfast, Belfast, UK, 13 September 2019. [Google Scholar]
- SEAI. Energy in Ireland. 2020 Report; Sustainable Energy Authority of Ireland: Dublin, Ireland, 2020.
- McLaughlin, N. Developing a Sustainable Transport Strategy for Rathlin Island; Final Project Report MEE4040; Queen’s University Belfast: Belfast, UK, 2019. [Google Scholar]
- Stadler, K.; Wood, R.; Bulavskaya, T.; Södersten, C.-J.; Simas, M.; Schmidt, S.; Usubiaga, A.; Acosta-Fernández, J.; Kuenen, J.; Bruckner, M.; et al. EXIOBASE 3: Developing a Time Series of Detailed Environmentally Extended Multi-Regional Input-Output Tables. J. Ind. Ecol. 2018, 22, 502–515. [Google Scholar] [CrossRef]
- EXIOBASE. Available online: https://www.exiobase.eu (accessed on 23 October 2021).
- Ivanova, D.; Wood, R. The unequal distribution of household carbon footprints in Europe and its link to sustainability. Glob. Sustain. 2020, 3, e18. [Google Scholar] [CrossRef]
- Meath County Development Plan 2021–27. Available online: https://consult.meath.ie/en/consultation/meath-adopted-county-development-plan (accessed on 28 February 2023).
- Scottish Government. Scotland’s Third National Planning Framework: Ambition—Opportunity—Place. The Scottish Government, UK 2014. Available online: https://www.gov.scot/publications/national-planning-framework-3/pages/2/ (accessed on 1 May 2023).
- National Planning Framework 3 Action Programme. Available online: https://npfactionprogramme.com/ (accessed on 2 April 2023).
- Scottish Planning Policy. Available online: https://www.gov.scot/publications/scottish-planning-policy/ (accessed on 2 April 2023).
- NI Department of Regional Development. Rathlin Island Policy; Department for Regional Development: Belfast, UK, 2010; ISBN 978-1-904807-32-2.
- Northern Area Plan 2016. Available online: https://www.infrastructure-ni.gov.uk/topics/planning/northern-area-plan-2016 (accessed on 23 October 2021).
- NI Department for Regional Development. Regional Development Strategy RDS 2035. Building a Better Future; Department for Regional Development: Belfast, UK, 2010.
- Transport System Planning. Available online: https://vayla.fi/en/transport-network/transport-system/transport-system-planning (accessed on 23 October 2021).
- Kymenlaakson Liitto, Aluesuunnittelu ja Liikenne. Available online: https://www.kymenlaakso.fi/aluesuunnittelu-ja-liikenne/liikenne/liikennejarjestelmasuunnittelu (accessed on 23 October 2021).
- Suh, S.; Lenzen, M.; Treloar, G.J.; Hondo, H.; Horvath, A.; Huppes, G.; Jolliet, O.; Klann, U.; Krewitt, W.; Moriguchi, Y.; et al. System boundary selection in life-cycle inventories using hybrid approaches. Environ. Sci. Technol. 2004, 28, 657–664. [Google Scholar] [CrossRef] [PubMed]
- UK Centre for Ecology & Hydrology. Mapping Carbon Emissions & Removals for the Land Use, Land-Use Change & Forestry Sector. A Report of the National Atmospheric Emissions Inventory 2019; Department for Business, Energy & Industrial Strategy: London, UK, 2021.
- Kymenlaakson Jäte Oy. Investoimme Puhtaampaan Tulevaisuuteen. Vuosikertomus 2019; Kymenlaakson Jäte Oy: Keltakangas, Finland, 2020. [Google Scholar]
- Kertsmik, K.-A.; Kuusk, K.; Lylykangas, K.; Kalamees, T. Evaluation of renovation strategies: Cost-optimal, CO2e optimal, or total energy optimal? Energy Builds 2023, 287, 112995. [Google Scholar] [CrossRef]
- City of Edinburgh. 2030 Climate Strategy. Delivering a Net Zero, Climate Ready Edinburgh. Draft Version; The City of Edinburgh Council, City of Edinburgh: Edinburgh, UK, 2021.
- Department for the Economy. Energy Strategy for Northern Ireland. Consultation on Policy Options; Department for the Economy: London, UK, 2021.
- Tieliikenteen Liikennemäärät 2021. Finnish Transport Infrastructure Agency. Available online: https://paikkatieto.vaylapilvi.fi/arcgis/apps/webappviewer/index.html?id=9303658f44134d5bb82d7e7d55e11644 (accessed on 19 March 2023).
- Säynäjoki, E.-S.; Heinonen, J.; Junnila, S. Role of Urban Planning in Encouraging More Sustainable Lifestyles. J. Urban Plan. Dev. 2014, 141, 04014011. [Google Scholar] [CrossRef]
- Newman, P.; Thornley, A. Urban Planning In Europe. International Competition, National Systems and Planning Projects; Routledge: London, UK, 1996. [Google Scholar]
- Hurlimann, A.; Moosavi, S.; Browne, G.R. Urban planning policy must do more to integrate climate change adaptation and mitigation actions. Land Use Policy 2021, 101, 105188. [Google Scholar] [CrossRef]
Disclaimer/Publisher’s Note: The statements, opinions and data contained in all publications are solely those of the individual author(s) and contributor(s) and not of MDPI and/or the editor(s). MDPI and/or the editor(s) disclaim responsibility for any injury to people or property resulting from any ideas, methods, instructions or products referred to in the content. |
© 2023 by the authors. Licensee MDPI, Basel, Switzerland. This article is an open access article distributed under the terms and conditions of the Creative Commons Attribution (CC BY) license (https://creativecommons.org/licenses/by/4.0/).