Abstract
Information on land reserves is crucial and required to support agricultural development in relation to increased population pressure, food demand, and food security. This research aims to identify and evaluate idle abandoned land based on biophysical suitability, status of land concessions, and forest areas to determine potential land reserves for agricultural development to support food security in Indonesia. The results show that, at the national level, the area of suitable abandoned lands for agricultural extensification is 27.7 million ha, but most of these lands have concession permits and are located in forest areas, so 12.4 million ha are still available, with the largest area being in dry land. The identification of abandoned land by employing satellite imagery in 54 districts resulted in a smaller acreage compared to abandoned land being mapped formally at 1:250,000. After considering land ownership and forest status, both sources resulted in similar areas at a scale of 1:50,000 and 1:250,000, i.e., 6.1 million ha and 6.0 million ha, respectively. It seems that land ownership and forest status adjusted the total acreage of identified land reserves at different map scales. An area of around 7.4 million ha will be required to meet food demand in 2045 by assuming constant consumption per capita. We found about 1.7 million ha as potential land reserves, most of which are in conversion or production forests areas. Converting forests or utilizing drylands could be potential alternatives to deal with the lack of land for food production. Moreover, due to limited wetlands, the use of reserve land in that agroecological zone should be in accordance with its designation, comply with the priority principles, and be supported by government regulations and policies, so that food security can be maintained until 2045.
1. Introduction
The world’s population has grown substantially within the last few decades, raising competition among land utilizations [1,2]. Indonesia is the fourth most populous country after China, India, and America [3] and is inhabited by 272.7 million people with a growth rate of 1.22% per year [4]. In 2045, Indonesia’s population will reach 320 million [3] or 318.9 million [5]. This increase in population of around 3.4 million people per year in Indonesia, or similar in the world, requires land to meet food and infrastructure needs.
It is common that land for housing and infrastructure development is obtained from converted paddy fields [6,7,8,9,10], for instance, the establishment of international airports [11,12,13] or the development of toll roads [14,15]. Meanwhile, the growth of cities and peri-urban areas raise land-related issues, such as availability and suitability of land for development, either in Indonesia [16,17] or in other countries such as China [18,19,20,21] and the United States of America [22]. Rice field conversion in the nearby cities is relatively common. The preference for converting productive paddy fields for development is usually due to their flatness and accessibility, including strategic positioning near city centers and transportation routes [23]. An increase in land conversion has been observed on the outskirts of major cities in Indonesia since the 1990s, especially for settlements and industries [24]. The conversion significantly decreases the existing productive agricultural land for producing staple foods [25], which in turn disrupts food security. Similar phenomena have been observed in some countries, such as Japan, Britain, and the Netherlands as reported by Mori [26] and in Vietnam [27].
On the other hand, land degradation occurs in some agricultural lands due to natural or management-related aspects [28] indicated by a decline in productivity [29]. For instance, dry land in wet climates that could be an alternative for land reserves, including Ultisols and Oxisols generally have undergone further weathering and base leaching, making the soil acidic with high aluminum saturation and low natural fertility [30,31]. Moreover, some agricultural areas have been fragmented due to the inheritance system [32,33], which leads to an increase in abandoned land [34].
The protection of suitable yet productive land for designated uses has been an alternative to warrant sustainable food production through regulation in some countries [35,36]. The regulation may protect croplands while allocating reserve land to maintain suitability and availability for sustainable food production. However, the law cannot fully assure that the most productive land such as paddy fields will be unconverted to non-agricultural use, particularly when they are located on the outskirt of cities. On the other hand, land expansion is likely needed to fulfill future food demand due to population growth. However, a few studies have showed that the available land for agricultural expansion is likely to be less suitable for cropland [37].
Increasing population, land conversion, and other agricultural land issues are interrelated, especially for maintaining the food supply [38]. The higher the population, the higher the demand for food and land will be; simultaneously, the productive agricultural land will decrease due to conversion. Future food security should be warranted by increasing productivity, intensifying the management of uses, and/or expanding the production areas [39,40]. Therefore, a land reserve designated for agricultural production or other uses is needed to support both agricultural and non-agricultural sectors.
The identification of land reserves to meet food and housing needs has been reported on in some countries, such as China [10], Canada [41], and Ghana [42]. In Indonesia, reserved areas are needed for expanding agricultural land to meet long-term food needs. Naturally, the identification of reserved areas would optimize the allocation of uses considering the suitability and resource-carrying capacities to mitigate land degradation and support environmental services [43]. Nonetheless, the selection procedure should be clearly defined. A few studies have documented methods to identify abandoned land as a reserve for expanding food production areas, such as Lambin [43] for global scope and Mulyani, Mulyanto, Barus, Panuju, and Husnain [44] for the case of Indonesia.
Geospatial analysis is the mainstay for delineating and analyzing land reserves particularly for a vast coverage [4]. Satellite imagery has been utilized to support analyses in various countries such as Albania and Romania [45], Carpathian Police—Poland [46], and Romania [47]. Nonetheless, the identification of land for designated reserves should consider not only physical properties that can be observed remotely but also the legal status of the identified land to minimize conflicts of management. In Indonesia, a combination of geospatial analysis of thematic maps at the national level and identification of the reserves by employing high-resolution imagery at the regional level has been implemented since 2016–2021 in 54 districts [48,49,50]. Nonetheless, the previous identification did not consider legal aspects and ownership status. This study aims to identify potential land reserves and their suitability from abandoned land by integrating legal aspects and ownership status and to predict the sufficiency of land to meet future food demand.
2. Materials and Methods
2.1. The Scope and Operational Definition of Land Reserves
We limited the scope of this research by considering the definition of land reserves as regulated by state or government policies of Indonesia to allow implementation. In this sense, land reserves are viewed as a form of policy that relates to setting priorities of land uses to be regulated by the government. Reserved land was defined specifically in Indonesia through Law No. 41, Year 2009, of The Republic of Indonesia as potential land with designated utilization to maintain its suitability and availability for sustainable food agriculture. The criteria are outlined by government regulation (Peraturan Pemerintah) No. 1, Year 2011, including (a) being inside and/or outside the prime agricultural area; (b) located in the expanse of land supporting productivity and production efficiency; (c) considered either as highly suitable, moderately suitable, or marginally suitable for food crop agriculture; (d) supported by basic infrastructure. They may be from abandoned land meeting the suitability for expanding food production, be part of agricultural areas or conversion production forest and production forests [51], or may be unused or uninhabited land [52]. In this research, we define land reserves as abandoned land that is biophysically suitable for expanding agricultural land, excluding land with cultivation rights (HGU), covering other use areas (OUAs) or agricultural cultivation areas, conversion production areas (CFAs), and production forest areas (PFAs). This consideration is in line with government regulation No. 23, Year 21, article 58 and the regulation of the Minister of Environment and Forestry No. 7, Year 2021, article 273 that allow forest release for several purposes, including national strategic projects, national economic recovery, and land allocation for food and energy security.
2.2. Data and Location
We employed several thematic maps for sorting land reserves both at the national and regional levels, including the designated paddy field areas at a scale of 1:25,000 produced by the National Land Agency; oil palm plantations at 1:50,000 from the Coordinating Ministry of Economics in 2019; cacao plantations at 1:50,000 [53,54]; land suitability and land management recommendations at a scale of 1:50,000 [48,49,50]; peatland at 1:50,000 [55]; swamp land at 1:50,000 [56]; forest status map of the Ministry of Environment and Forestry in 2021; land use and tenure status from the National Land Agency in 2012; and administration boundary produced by the National Statistics Agency in 2020. In addition, to support visual image interpretation, Google Earth Pro was employed. The coverage of the spatial analysis of land reserves at the national and regional levels is presented in Figure 1.
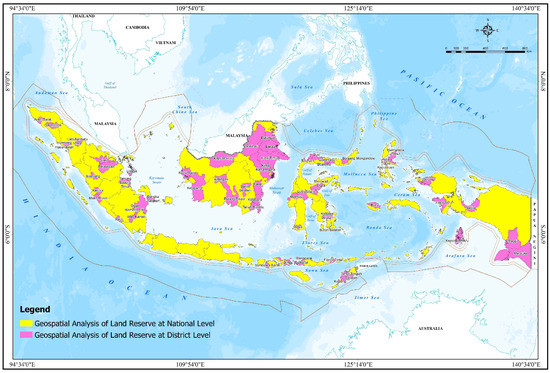
Figure 1.
Coverage of analysis for determining land reserves at the national level (yellow color) and regional level (pink color).
2.3. Methods
Several methods were used to address the research aims. The following subsections explain the methods involved.
2.3.1. Spatial Analysis of Land Reserves at the National Level
Geospatial analysis of land reserves at the national level involved several stages, i.e., (a) determining abandoned land by selecting land cover to be included, i.e., secondary forest, shrubs, grass, and open land, which was taken from the legacy data [57] of land cover databases produced by the Ministry of Forestry and Environment of Indonesia scaling at 1:250,000, followed by removing developed areas such as paddy field, oil palm plantations, and cacao and coconut plantation; (b) evaluating the suitability of the abandoned land by using an application called SPKL version 1.0 (Land Suitability Assessing System in Indonesia, BBSDLP, Bogor) [58]; (c) superimposing suitable abandoned land with land concessions and permits status; (d) superimposing point c and the forest status map. The employment of available legacy data has been chosen to fill the data gap by several researchers [57,59]. The procedure resulted the distribution of suitable abandoned land for agricultural development. The criteria to determine land for agricultural development are presented in Table 1, while the flow chart for delineating land reserves is presented in Figure 2.

Table 1.
Criteria to determine land reserves for the development of food crops, annual crops, plantations, or horticultures.
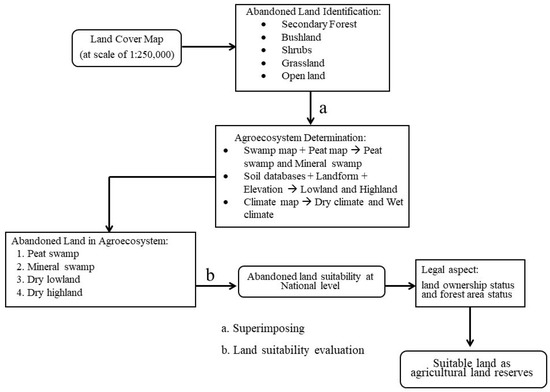
Figure 2.
Flowchart for determining land reserves by utilizing abandoned land.
2.3.2. Determining Land Reserves at the Regional Level
The procedure to determine land reserves at the regional level resembles that at the national level. The difference lies in the source of abandoned land, which at this level was from the visual interpretation of SPOT 6/7 imageries, while the national one was from legacy data. Initial filtering was performed to remove land being intensively utilized, including paddy fields, plantations, settlements, and other areas. On-screen interpretation was achieved using ArcGIS 10.8, which was optimally adjusted at a scale of 1:5000. Visual interpretation of the land cover was achieved by examining interpretation keys such as color, shape, size and height, shading, pattern, texture, and context [60] in 54 districts, representing selected provinces for 2016 to 2021 (Figure 1). Of the 54 representative districts, around 28 districts were ground checked to collect samples for ground truthing and measuring the accuracy. The result is a distribution of abandoned land at a scale of 1:50,000. The next step was land suitability assessment by weighing up biophysical properties, but social, economic, or other aspects were not considered. The last stage was filtering the result by land ownership and forest status. All the criteria used to determine land reserves are displayed in Table 1, while the flowchart for determining land reserves is presented in Figure 3.
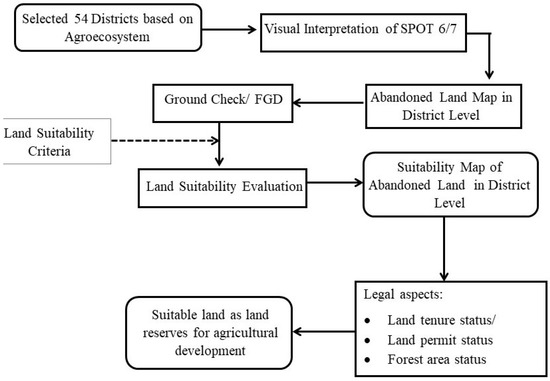
Figure 3.
Identification of land reserves at district level.
A complete identification of land reserves of Indonesia ideally should involve 511 districts. However, due to constraints of time, funding, and manpower, recently 54 districts or about 10% of the state were identified by Indonesian government. Meanwhile, previous analysis showed that discrepancies in acreage may be observed when different spatial resolutions of data sources were evaluated [44]. Thus, it is possible to have different estimated acreages from national and district approaches. The area of abandoned land is likely smaller when identified by using a district approach with a finer scale than that using the national one with a coarser spatial resolution. Considering the scale, a detailed approach was then used to predict land reserves at the national level.
2.3.3. Prediction of Land Needs by 2045
Land needs to meet the national food demand by 2045 were estimated by firstly estimating production capacity and food demand. The production capacity of paddy fields was estimated by considering the designated areas for paddy fields, the cropping intensity of the 4 ecosystems, and the average yield per ha. The equation is as follows:
where
PC = ∑(Ai,t,p,l × Ii,t,p,l × Yi,t,p,l)
PC = Production capacity (tons dried milled grain);
Ai,t,p,l = Designated area for paddy field (i: irrigated, t: rainfed, p: tidal swamp, l: freshwater swamp) (ha);
Ii,t,p,l = Cropping intensity per year (harvested area divided by standard area) in paddy field (i: irrigated, t: rainfed, p: tidal swamp, l: freshwater swamp);
Yi,t,p,l = Yield (ton/ha) (i: irrigated, t: rainfed, p: tidal swamp, l: freshwater swamp).
Total food demand was estimated by considering food needs, stock, and export as presented in the following expression:
where
FDT = Food needs + (stock + export) = (P × C) + 0.15 (P × C)
FDT = Food demand total (tons of rice);
P = Projected population equal to 325 million in 2045;
C = Consumption per capita equal to 110 kg/year or 95 kg/year.
Finally, land need was approximated by considering the production capacity, food demand, and estimated productivity of the planned production areas as follows:
where
LN = (FNT − PC)/(1/0.58 × 2P)
LN = Land needs (ha);
FNT = Food needs (tons rice):
PC = Production capacity (tons rice);
P = Productivity of new paddy fields (around 3 tons/ha/season or 6 tons/ha/year).
The production capacity was calculated employing the spatial and statistical data of paddy fields classified by type, viz., irrigated, rainfed, tidal swamp, and freshwater swamp fields (locally called lebak) [61]. Meanwhile, cropping intensity was calculated as the ratio between the harvested area and the paddy fields of a district. Each district has been labeled based on the dominant field type; therefore, single cropping intensity and productivity were used for each district. Food needs were calculated based on the projected population between 2020 and 2045 by assuming that stock and export were at 15% of total rice consumption for food [62].
Table 2 shows the list of data sources used to determine potential land reserves both at the national and regional level, as well as to predict production capacity, food demand, and land needs by 2045.
Table 2.
List of the data sources for land reserves analyses and prediction of land needs.
3. Results and Discussion
3.1. The Suitability of Abandoned Land at the National Level
The initial study identified abandoned areas at 42.60 million ha, with the largest category in dry lowland, i.e., 32.84 million ha, and 6.96 million ha in dry highland [72]. The distribution of abandoned land in swamps covered 2.81 million ha, consisting of 0.46 million ha of peat swamps and 2.35 million ha of mineral swamps (Figure 4).
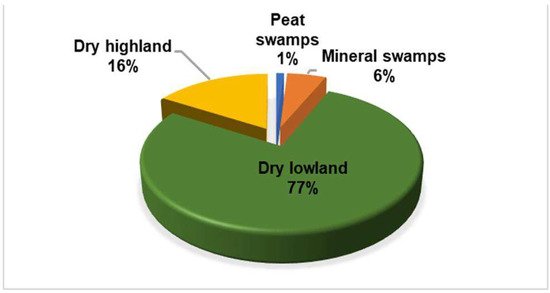
Figure 4.
Distribution of abandoned land in dry and swamp land in Indonesia.
The results show that 27.72 million ha of 42.60 million ha abandoned lands is suitable for agricultural commodities (Table 3). The largest area is in dry land with slopes less than 15%, covering 14.02 million ha, and on slopes between 15% and 40%, covering 11.20 million ha. About 2.4 million ha of suitable abandoned land was in swamps consisting of 0.30 million ha in peat swamps and 2.18 million ha in mineral swamps. Unsuitable land was around 14.88 million ha, mostly in dry land with limiting factors of a slope of more than 40%, very shallow and rocky soil, and quartz sandy soil, and the largest area was on the island of Kalimantan. Whereas for peat swamps, the unsuitability was due to a peat thickness of more than 3 m or the decomposition degree of fibric peat, while in mineral swamps, it was due to the depth of the pyrite or sulfidic layer [73].
Table 3.
Land suitability of abandoned land for agricultural development in Indonesia.
3.2. Land Suitability Based on the Legal Aspect at the National Level
The suitability of abandoned land for agricultural development was biophysically analyzed, resulting in an area of 27.72 million ha. Combining biophysical evaluation and land concession reduced the suitable area for agricultural development due to permits and cultivation rights for various businesses such as plantations, mining, and forestry. Of the 27.72 million ha of land suitable for agriculture (Table 3), approximately 12.45 million ha (44.9%) had permits and cultivation rights; thus, the remaining area was about 15.3 million ha (Table 4).
Table 4.
Distribution of suitable abandoned land for agricultural development considering permits and cultivation rights.
Most of the suitable land was in dry lowland (82.76%), distributed in the Papua, West Papua, Central Kalimantan, and East Kalimantan provinces. Moreover, the largest areas of suitable swamp land, both in mineral swamps and peat swamps, were distributed in the Papua and Central Kalimantan provinces. It seems that, at the national level, the prospective locations for future agricultural development were predominantly in dry land. Although mineral swamp has potential for the development of paddy fields, no more than 10% of suitable land was available for agricultural development, while in peat swamps it was about 1.08%. Table 5 and Figure 5 present suitable abandoned land for agricultural development considering land concession, tenure maps, and forest status maps. It shows that around 12.45 million ha of suitable abandoned land met the legal aspects, consisting of 10.72 million ha in dry lands and 1.72 in wetlands (swamps). The largest distribution was in dry land and in OUAs, of which, 4.80 million ha was in agricultural cultivation areas, 4.16 million ha was in production forest areas covering, and 1.76 million ha was in conversion production forest areas. Whereas in wetlands, a balanced coverage among OUAs, CFAs, and PFAs was observed. There were around 0.57 million ha in OUAs of prospective land reserves for the development of food agricultural land, especially paddy rice. The rest were in the conversion production forest area (0.53 million ha) and 0.62 in the production forest area. Figure 5 shows that the land reserves for agricultural development in the Kutai Timur District, East Kalimantan Province, were about 481,751 ha, mostly in dry land (99.1%) and in production forest areas.
Table 5.
The distribution of suitable abandoned land for agricultural development considering permits, cultivation rights, and forest status.
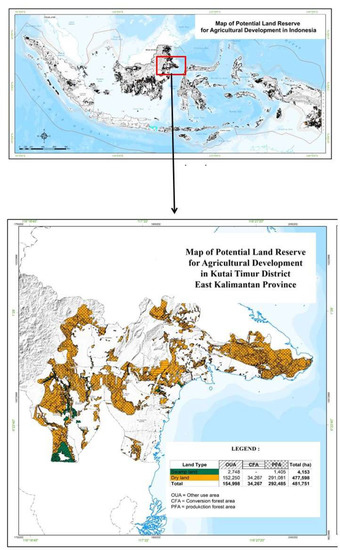
Figure 5.
Distribution of potential land reserves at the national level and at the district level (Kutai Timur District, East Kalimantan Province).
Land reserves in Indonesia can be grouped into two types: The first is designated land reserved to be protected as agricultural land, which is protected by Law No. 41/2009. This form resembles what was discussed by Nixon and Newman [74] and Androkovic [41] in British Colombia; Guerra et al. [75] in the Amazon forest in Brazil; and Aksu and Iban [76] in Istanbul. The second is agricultural land to fulfill future needs (in 2045) by extending agricultural areas by considering the legal aspects such as tenurial and forest status.
3.3. Assessing the Land Suitability and Land Reserves of Abandoned Land at the District Level
Abandoned land at the national level was analyzed for 54 districts/cities to represent provinces. The detailed biophysical characteristics of abandoned lands and their characteristics have been discussed by Mulyani et al. [53].
Table 6 shows biophysically suitable areas for food production filtered by legal aspects, i.e., land tenure, permits, and forest status. The screening was to delineate the most probable locations for expanding agricultural areas, which can then be defined as land reserves. Table 5 shows that, of the 16.89 million ha of abandoned land in 54 districts, around 8.49 million ha or 50.26% is suitable for agricultural land development. Meanwhile, adding the criteria of area selection with land tenure, permits, and forest status resulted in 6.11 million ha or 36.17% of the total abandoned land in the 54 regencies available for land reserves. The result is comparatively equivalent to the outcome of the national approach employing data at the scale of 1:250,000. It seems that land tenure, permits, and forest status dictate the selection of land reserves for agricultural development.
Table 6.
Distribution of abandoned land by the visual interpretation of SPOT 6/7 imagery—land suitability and land reserves for agricultural development.
Figure 6 and Table 7 present the abandoned land in Katingan District, Central Kalimantan Province, at a scale of 1:250,000 from the thematic map and 1:50,000 from visual interpretation. Different acreages of each land use were observed when comparing both data sources. For instance, it was found that grasslands covered 6227 ha from satellite interpretation that was unidentified at a scale of 1:250,000. Likewise, open land and shrubs were larger at a scale of 1:250,000, whereas secondary forests were larger at a scale of 1:50,000.
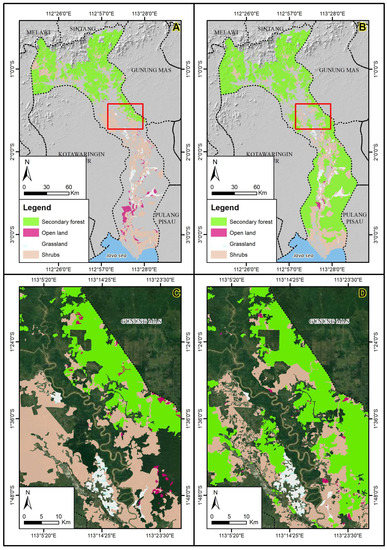
Figure 6.
Distribution of abandoned land at a scale of 1:250,000 (KLHK 2019) (A) and distribution of abandoned land resulted from the interpretation of SPOT6/7 imagery (B) in Katingan District, Central Kalimantan Province. Differences in the appearance of the distribution of abandoned land at a scale of 1:250,000 (C) and satellite interpretation of the Malan Island District, Katingan Regency, Central Kalimantan Province (D).
Table 7.
Distribution of abandoned land at a scale of 1:250,000 and the results of the visual interpretation of SPOT 6/7 imagery.
Figure 7 illustrates the process of selecting an area for land reserves considering permit and forest status. It is shown that considering legal permits to land and forest status significantly reduced the acreage of potential area for land reserves. Table 8 describes an example of the distribution of abandoned land suitable for the development of food, annual, or perennial crops in Katingan District, Central Kalimantan Province, after eliminating land that already has permits or cultivation rights. The widest distribution is in dry land covering an area of 547,260 ha (86.38%), while in mineral swamps it is 86,295 ha and is recommended only for food crops.
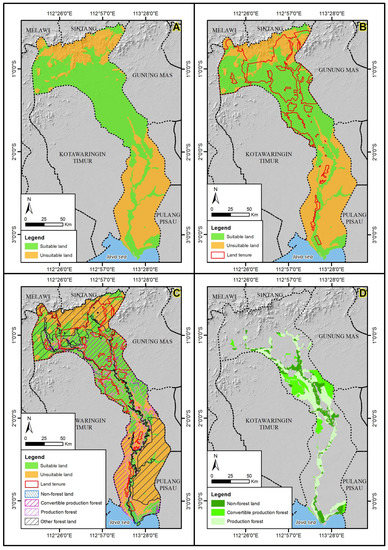
Figure 7.
Figures represent the sequential process of determining land reserves, i.e., (A) identification of suitable abandoned land, (B) screening the area based on permits, (C) screening the area based on forest status, and (D) land reserves in three forest statuses, viz., OUAs, CFAs and PFAs.
Table 8.
The suitability of abandoned land for annual and perennial crops, considering land tenure in Katingan District, Central Kalimantan Province.
Table 9 and Figure 7D present the distribution of land reserves that meet all criteria of suitability and legal aspects in Katingan District including biophysics, land tenure (permits), and forest status. The results show that only 463,588 ha (73.19%) can be used as land reserves. This means that around 169,867 ha are in other forest areas, such as protected forest areas, conservation forests, or other forests. The land reserves consist of 243,469 ha for food crops and 220,220 ha for annual crops, most of which (65.00%) are in forest areas, both CFAs and PFAs. The largest reserve land is in dry land, especially in CFAs, 186,340 ha for food crops and 199,006 ha in agricultural cultivation areas or outside forest areas recommended for annual crops. Utilizing forest areas for agricultural purposes, including land reserves for food security may be an alternative. Nonetheless, the allocation of land reserves for agricultural development should not compromise natural forest services as highlighted by Lambin et al. [43] and Knoke et al. [77].
Table 9.
Land reserves for annual and perennial crop development considering forest status in Katingan District, Central Kalimantan Province.
3.4. The Need and Availability of Land to Meet Food Demand (Rice) by 2045
Land needs are predicted based on the production capacity of paddy fields and food needs, including food stocks (approximated at 15% of food demand). Paddy fields for producing rice could be classified based on their water sources, including irrigated, rainfed, tidal, and lowland swamp. If rice field conversion is at around 96,500 ha/year, the production capacity would decrease annually at 1.0 million tons of milled grain (MG) if the average yield is 5.2 ton/ha and cropping indexes are at 2 [6].
By using Equations (1)–(3), estimated food need, projection of food capacity, and land needs are presented in Table 9. It shows that, if per capita consumption remains at around 110 kg of rice/year, then food needs by 2045 will be around 64.3 million tons of MG with production capacity decreasing from 55.0 million tons in 2020 to 38.4 million tons in 2045 due to land conversion of around 90,000 ha/year, resulting in a food shortage of 25.9 million tons of MG. If per capita consumption can be reduced from 110 kg to 95 kg rice/capita by 2045, then the need for additional production will be 17.7 million tons of MG. Moreover, if land conversion can be reduced to 60,000 ha/year, then rice production will reach 15.0 million tons of MG in 2045. Various conditions of the conversion rate have been considered to estimate the possibility of increasing production by enhancing cropping intensity and its productivity [28]. It showed that rice sufficiency would not likely be reached if conversion is constant at 90,000 ha/year and consumption per capita is 110,000 kg/year.
Figure 8 shows that if consumption per capita is 110 kg of rice/year with the productivity of the new area being around 3 ton per ha that was cultivated twice a year, while the acreage of paddy fields is at 7.4 million ha in 2020 with land conversion at about 90,000 ha/year, then, in 2045, there would be 5.2 million ha left, and around 7.4 million ha land will be required to replace it (Table 10). If land conversion can be reduced to 60,000 ha/year in 2045, the land need will be about 5.9 million ha. If decreasing conversion rates are combined with reducing consumption per capita, then the land need will be about 3.5 million ha. The figure shows that, for every converted land unit, twofold the land acreage should replace it as the land is less productive.

Figure 8.
The trend of estimated paddy field from 2020 to 2045 by assuming (a) a per capita consumption of 110 kg/year and paddy field conversion (LC) at 90,000 ha/year (LC_90), LC around 60,000 ha/year (LC_60), additional land needs (LN) if LC equal to 90,000 ha/year (LN_90a) and LN for LC equal to 60,000 ha/year (LN_60a), (b) per capita consumption of 95 kg/year, LC equal to 90,000 ha/year (LC_90) and 60,000 ha/year (LC_60), land needs for conversion at 90,000 ha/year (LN_90b) and at 60,000 ha/year (LN_60b).
Table 10.
The projection of food needs (milled grain—MG), production capacity (MG), and land needs (hectares).
3.5. Conclusions and Policy Implications
The increasing population has a major effect not only on raising food demand but also on enlarging the need for land. Settlements, infrastructures, and industrial and services areas are needed to support growing populations either in big cities, peri urbans areas, or newly developed locations. Relatively flat yet accessible areas are generally preferred. These characteristics are typical for paddy fields; thus, paddy fields are highly preferred for developing infrastructure. Consequently, the conversion of agricultural land, particularly paddy fields, to non-agricultural land is unavoidable. The enactment of law and its derivative regulations to protect food-agricultural land and control land conversion in Indonesia seems ineffective in reducing the rate of land conversion for supporting the economic and industrial sectors. Decreasing paddy fields are continuously observed, which directly impacts on decreasing production capacity of food, whereas food demand is increasing due to population growth. Hence, expanding food production areas by utilizing suitable abandoned land as land reserves is a strategic way to meet the demand.
The requirement for establishing new rice fields to expand the food production area appears unproportional to the loss of paddy fields due to conversion since less productive areas would likely be available. The loss of 1 ha of rice fields due to conversion should be replaced by two times the acreage, which may possibly be located in swamp areas. However, insufficient swamp lands are available, so forest areas could be alternatives for agricultural land expansion. Creating new paddy fields on dry land is comparatively more expensive than on swamp land, due to the need to establish irrigation networks. Meanwhile, dry land is commonly used for producing non-rice food commodities, such as corn, soybeans, cassava, sugar cane, or horticulture including onions, chilies, potatoes, carrots, green vegetables, and estate crops, such as oil palm, rubber, cacao, coffee, coconut, and pepper. This creates competition for various land uses, including among agricultural uses and non-agricultural ones, such as mining, industry, urban areas, and others. Moreover, considering not only biophysical properties but also government policy in the form of forest status, permits, and land ownership would avoid management conflicts.
This research noted that the identification of land reserves for food production expansion should consider the use of legacy data to fill data gaps that are likely to be encountered in developing countries. Meanwhile, the limited land reserves being identified necessitate the prioritization of land for various uses. This may apply to many countries including Indonesia. A thorough assessment of cost, benefit, risk, and consequences is needed to prioritize land uses. It is imperative to develop a strategic plan for meeting future food demand. A few strategies such as optimizing the use of agricultural land, mitigating the rate of agricultural land conversion, controlling yet reducing the rate of population growth, diversifying food, utilizing reserve land according to its designation, and regulating policies to support such targets should be undertaken to strengthen the capacity for realizing sustainable food security.
Author Contributions
A.M., B.M., B.B., D.R.P. and H. designed the research. A.M. collected and analyzed the data; the initial draft was written by A.M. and D.R.P.; B.M., B.B. and H. provided critical feedback and gave editorial oversight; then A.M. and D.R.P. finalized the manuscript. All authors have read and agreed to the published version of the manuscript.
Funding
This research was financially supported by the Indonesian Agency for Agricultural Research Development (ICALRRD), Ministry of Agriculture, through the research program “Analysis of land resource management policies to support agriculture in 2016–2020” and “Analysis of the distribution of agricultural land in 2020–2021”.
Data Availability Statement
Not applicable.
Acknowledgments
The authors would like to thank the head of ICALRRD for the funding that supports this research’s implementation. This endeavor would not have been possible without the assistance of researchers and technicians within the ICALRRD during the data collection and processing.
Conflicts of Interest
The authors declare no conflict of interest.
References
- Smith, P.; Gregory, P.J.; van Vuuren, D.; Obersteiner, M.; Havlík, P.; Rounsevell, M.; Woods, J.; Stehfest, E.; Bellarby, J. Competition for land. Philos. Trans. R. Soc. B Biol. Sci. 2010, 365, 2941–2957. [Google Scholar] [CrossRef]
- Wu, W.; Yu, Q.; You, L.; Chen, K.; Tang, H.; Liu, J. Global cropping intensity gaps: Increasing food production without cropland expansion. Land Use Policy 2018, 76, 515–525. [Google Scholar] [CrossRef]
- Roser, M.; Ritchie, H.; Ortiz-Ospina, E. World Population Growth. Available online: https://ourworldindata.org/world-population-growth (accessed on 9 September 2022).
- Badan Pusat Statistik. Statistik Indonesia 2022; Badan Pusat Statistik: Jakarta, Indonesia, 2022; Volume 1101001, p. 780. [Google Scholar]
- Badan Pusat Statistik. Proyeksi Penduduk Indonesia 2015–2045, Hasil Supas 2015; Badan Pusat Statistik: Jakarta, Indonesia, 2018. [Google Scholar]
- Irawan, B. Konversi lahan sawah: Potensi dampak, pola pemanfaatannya dan faktor determinan. Forum Penelit. Agro Ekon. 2005, 23, 1–18. [Google Scholar] [CrossRef]
- Lawton, A.; Morrison, N. The loss of peri-urban agricultural land and the state-local tensions in managing its demise: The case of Greater Western Sydney, Australia. Land Use Policy 2022, 120, 106265. [Google Scholar] [CrossRef]
- Mulyani, A.; Nursyamsi, D.; Harnowo, D. Potensi dan tantangan pemanfaatan lahan suboptimal untuk tanaman aneka kacang dan umbi. Pros. Semin. Has. Penelit. Tanam. Aneka Kacang Dan Umbi 2016, 25, 16–30. [Google Scholar]
- Sutomo, S. Analisa data konversi dan prediksi kebutuhan lahan; Direktorat Perluasan Areal, Ditjen Bina Produksi Tanaman Pangan, Departemen Pertanian: Jakarta, Indonesia, 2004. [Google Scholar]
- Wang, Y.; van Vliet, J.; Debonne, N.; Pu, L.; Verburg, P.H. Settlement changes after peak population: Land system projections for China until 2050. Landsc. Urban Plan. 2021, 209, 104045. [Google Scholar] [CrossRef]
- Hidayat, Y.; Ismail, A.; Ekayani, M. Dampak konversi lahan pertanian terhadap ekonomi rumah tangga petani padi (Studi kasus Kecamatan Kertajati Kabupaten Majalengka Jawa Barat). J. Pengkaj. Pengemb. Teknol. Pertan. 2017, 20, 171–182. [Google Scholar] [CrossRef]
- Rijanta, R. Sustainability of the Sawah Surjan Agricultural Systems in Depok Village, Panjatan Subdistrict, Kulonprogo Regency, Yogyakarta Special Province. Forum Geogr. 2018, 32, 109–118. [Google Scholar] [CrossRef]
- Greene, R.P. The farmland conversion process in a polynucleated metropolis. Landsc. Urban Plan. 1997, 36, 291–300. [Google Scholar] [CrossRef]
- Fiqriyati, A.R.; Panuju, D.R.; Mulya, S.P. The dynamics of rice-field conversion in the surroundings Cipali toll-roads of Subang Regency. In Proceedings of the 2nd International Seminar on Natural Resources and Environmental Management (2nd ISeNREM 2021), Bogor, Indonesia, 4–5 August 2021. [Google Scholar]
- Song, J.; Ye, J.; Zhu, E.; Deng, J.; Wang, K. Analyzing the Impact of Highways Associated with Farmland Loss under Rapid Urbanization. ISPRS Int. J. Geo-Inf. 2016, 5, 94. [Google Scholar] [CrossRef]
- Prayitno, G.; Dinanti, D.; Hidayana, I.I.; Nugraha, A.T. Place attachment and agricultural land conversion for sustainable agriculture in Indonesia. Heliyon 2021, 7, e07546. [Google Scholar] [CrossRef]
- Pribadi, D.O.; Pauleit, S. The dynamics of peri-urban agriculture during rapid urbanization of Jabodetabek Metropolitan Area. Land Use Policy 2015, 48, 13–24. [Google Scholar] [CrossRef]
- Fu, S.; Xu, X.; Zhang, J. Land conversion across cities in China. Reg. Sci. Urban Econ. 2021, 87, 103643. [Google Scholar] [CrossRef]
- Kuang, W.; Liu, J.; Dong, J.; Chi, W.; Zhang, C. The rapid and massive urban and industrial land expansions in China between 1990 and 2010: A CLUD-based analysis of their trajectories, patterns, and drivers. Landsc. Urban Plan. 2016, 145, 21–33. [Google Scholar] [CrossRef]
- Li, X.; Zhang, L.; Liang, C. A GIS-based buffer gradient analysis on spatiotemporal dynamics of urban expansion in Shanghai and its major satellite cities. Procedia Environ. Sci. 2010, 2, 1139–1156. [Google Scholar] [CrossRef]
- Yu, M.; Chen, Z.; Long, Y.; Mansury, Y. Urbanization, land conversion, and arable land in Chinese cities: The ripple effects of high-speed rail. Appl. Geogr. 2022, 146, 102756. [Google Scholar] [CrossRef]
- Li, S.; Nadolnyak, D.; Hartarska, V. Agricultural land conversion: Impacts of economic and natural risk factors in a coastal area. Land Use Policy 2019, 80, 380–390. [Google Scholar] [CrossRef]
- Santoso, P.B.K.; Widiatmaka, W.; Sabiham, S.; Machfud, M.; Rusastra, I.W. Analisis Pola Konversi Lahan Sawah Dan Struktur Hubungan Penyebab Dan Pencegahannya (Studi Kasus Kabupaten Subang, Provinsi Jawa Barat). J. Pengelolaan Sumberd. Alam Dan Lingkung. 2017, 7, 184–194. [Google Scholar] [CrossRef]
- Firman, T. Rural to urban land conversion in Indonesia during boom-and-bust periods. Land Use Policy 2000, 17, 13–20. [Google Scholar] [CrossRef]
- Panuju, D.R.; Mizuno, K.; Trisasongko, B.H. The dynamics of rice production in Indonesia 1961–2009. J. Saudi Soc. Agric. Sci. 2013, 12, 27–37. [Google Scholar] [CrossRef]
- Mori, H. Land Conversion at the Urban Fringe: A Comparative Study of Japan, Britain and the Netherlands. Urban Stud. 1998, 35, 1541–1558. [Google Scholar] [CrossRef]
- Pham, V.C.; Pham, T.T.H.; Tong, T.H.A.; Nguyen, T.T.H.; Pham, N.H. The conversion of agricultural land in the peri-urban areas of Hanoi (Vietnam): Patterns in space and time. J. Land Use Sci. 2015, 10, 224–242. [Google Scholar] [CrossRef]
- Sklenicka, P. Classification of farmland ownership fragmentation as a cause of land degradation: A review on typology, consequences, and remedies. Land Use Policy 2016, 57, 694–701. [Google Scholar] [CrossRef]
- Nursyamsi, D. Inovasi Pemupukan Berbasis Keseimbangan Hara Terintegrasi Untuk Mendukung Swasembada Pangan Nasional; IAARD Press. Badan Penelitian dan Pengembangan Pertanian: Jakarta, Indonesia, 2017. [Google Scholar]
- Husni, M.; Sufardi, S.; Khalil, M. Evaluasi Status Kesuburan Pada Beberapa Jenis Tanah Di Lahan Kering Kabupaten Pidie Provinsi Aceh. J. Ilm. Mhs. Pertanian. 2016, 1, 147–154. [Google Scholar] [CrossRef]
- Subagyo, H.; Suharta, N.; Siswanto, A.B. Tanah tanah Pertanian di Indonesia. In Sumberdaya Lahan Indonesia dan Pengelolaannya; Adimihardja, A., Amien, I., Agus, F., Djaenudin, D., Eds.; Pusat Penelitian dan Pengembangan Tanah dan Agroklimat: Bogor, Indonesia, 2000. [Google Scholar]
- Gomes, E.; Banos, A.; Abrantes, P.; Rocha, J.; Kristensen, S.B.P.; Busck, A. Agricultural land fragmentation analysis in a peri-urban context: From the past into the future. Ecol. Indic. 2019, 97, 380–388. [Google Scholar] [CrossRef]
- Susilowati, S.H.; Maulana, M. Luas lahan usahatani dan kesejahteraan petani: Eksistensi petani gurem dan urgensi kebijakan reforma agraria. J. Anal. Kebijak. Pertan. 2012, 10, 17–30. [Google Scholar] [CrossRef]
- Wang, J.; Cao, Y.; Fang, X.; Li, G.; Cao, Y. Does land tenure fragmentation aggravate farmland abandonment? Evidence from big survey data in rural China. J. Rural Stud. 2022, 91, 126–135. [Google Scholar] [CrossRef]
- Li, M. The effect of land use regulations on farmland protection and non-agricultural land conversions in China. Aust. J. Agric. Resour. Econ. 2019, 63, 643–667. [Google Scholar] [CrossRef]
- Oliveira, E.; Leuthard, J.; Tobias, S. Spatial planning instruments for cropland protection in Western European countries. Land Use Policy 2019, 87, 104031. [Google Scholar] [CrossRef]
- Kraemer, R.; Prishchepov, A.V.; Müller, D.; Kuemmerle, T.; Radeloff, V.C.; Dara, A.; Terekhov, A.; Frühauf, M. Long-term agricultural land-cover change and potential for cropland expansion in the former Virgin Lands area of Kazakhstan. Environ. Res. Lett. 2015, 10, 54012. [Google Scholar] [CrossRef]
- Potapov, P.; Turubanova, S.; Hansen, M.C.; Tyukavina, A.; Zalles, V.; Khan, A.; Song, X.P.; Pickens, A.; Shen, Q.; Cortez, J. Global maps of cropland extent and change show accelerated cropland expansion in the twenty-first century. Nat. Food 2022, 3, 19–28. [Google Scholar] [CrossRef]
- Delzeit, R.; Zabel, F.; Meyer, C.; Václavík, T. Addressing future trade-offs between biodiversity and cropland expansion to improve food security. Reg. Environ. Change 2017, 17, 1429–1441. [Google Scholar] [CrossRef]
- Smith, P. Delivering food security without increasing pressure on land. Glob. Food Secur. 2013, 2, 18–23. [Google Scholar] [CrossRef]
- Androkovich, R.A. British Columbia’s agricultural land reserve: Economic, legal and political issues. Land Use Policy 2013, 30, 365–372. [Google Scholar] [CrossRef]
- Oduro-Appiah, J.; Agyemang-Duah, W. Identifying spatially-explicit land use factors associated with forest patch sizes in a forest reserve in Ghana. Land Use Policy 2021, 101, 105135. [Google Scholar] [CrossRef]
- Lambin, E.F.; Gibbs, H.K.; Ferreira, L.; Grau, R.; Mayaux, P.; Meyfroidt, P.; Morton, D.C.; Rudel, T.K.; Gasparri, I.; Munger, J. Estimating the world’s potentially available cropland using a bottom-up approach. Glob. Environ. Change 2013, 23, 892–901. [Google Scholar] [CrossRef]
- Mulyani, A.; Mulyanto, B.; Barus, B.; Panuju, D.R.; Husnain. Geospatial Analysis of Abandoned Lands Based on Agroecosystems: The Distribution and Land Suitability for Agricultural Land Development in Indonesia. Land 2022, 11, 2071. [Google Scholar] [CrossRef]
- Müller, D.; Leitão, P.J.; Sikor, T. Comparing the determinants of cropland abandonment in Albania and Romania using boosted regression trees. Agric. Syst. 2013, 117, 66–77. [Google Scholar] [CrossRef]
- Kolecka, N.; Kozak, J.; Kaim, D.; Dobosz, M.; Ostafin, K.; Ostapowicz, K.; Wężyk, P.; Price, B. Understanding farmland abandonment in the Polish Carpathians. Appl. Geogr. 2017, 88, 62–72. [Google Scholar] [CrossRef]
- Grădinaru, S.R.; Kienast, F.; Psomas, A. Using multi-seasonal Landsat imagery for rapid identification of abandoned land in areas affected by urban sprawl. Ecol. Indic. 2019, 96, 79–86. [Google Scholar] [CrossRef]
- Balai Besar Sumberdaya Lahan Pertanian. Atlas Peta Tanah Skala 1:50.000 per Kabupaten/Kota. [Peta]; Balai Besar Litbang Sumberdaya Lahan Pertanian: Bogor, Indonesia, 2016. [Google Scholar]
- Balai Besar Sumberdaya Lahan Pertanian. Atlas Peta Tanah Semidetail Skala 1:50.000 per Kabupaten/Kota. [Peta]; Balai Besar Litbang Sumberdaya Lahan Pertanian: Bogor, Indonesia, 2017. [Google Scholar]
- Balai Besar Sumberdaya Lahan Pertanian. Atlas Peta Tanah Semidetail Skala 1:50.000 per Kabupaten/Kota. [Peta]; Balai Besar Litbang Sumberdaya Lahan Pertanian: Bogor, Indonesia, 2018. [Google Scholar]
- Ritung, S.; Suryani, E.; Subardja, D.; Sukarman; Nugroho, K.; Suparto; Hikmatullah; Mulyani, A.; Tefakresnanto, C.; Sulaeman, Y.; et al. Sumberdaya Lahan Pertanian Indonesia: Luas, Penyebaran dan Potensi Ketersediaan; Badan Penelitian dan Pengembangan: Jakarta, Indonesia, 2015; p. 96. [Google Scholar]
- Visser, O.; Mamonova, N.; Spoor, M. Oligarchs, megafarms and land reserves: Understanding land grabbing in Russia. In The New Enclosures: Critical Perspectives on Corporate Land Deals; White, B., Borras, S., Jr., Hall, R., Scoones, I., Wolford, W., Eds.; Routledge: London, UK, 2013; p. 512. [Google Scholar]
- Mulyani, A.; Sukarman; Hikmat, M.; Puspitahati, D.; Nurwinda. Atlas Peta Sebaran Kakao di Sulawesi. [Peta]; Laporan Kerjasama antara Ditjen Perkebunan dan Balai Besar Sumberdaya Lahan Pertanian: Jakarta, Indonesia, 2020. [Google Scholar]
- Mulyani, A.; Sukarman; Hikmat, M.; Puspitahati, D.; Nurwinda. Atlas Peta Sebaran Potensi Kelapa di Sulawesi. [Peta]; Laporan Kerjasama antara Ditjen Perkebunan dan Balai Besar Sumberdaya Lahan Pertanian: Jakarta, Indonesia, 2020. [Google Scholar]
- Ritung, S.; Suryani, E.; Yatno, E.; Hikmatullah; Nugroho, K.; Sukarman; Subandiono, R.E.; Tafakresnanto, C.; Suratman; Hidayat, H.; et al. Peta Lahan Gambut Indonesia Skala 1:50.000. [Peta]; Balai Besar Litbang Sumberdaya Lahan Pertanian: Bogor, Indonesia, 2019. [Google Scholar]
- Ritung, S.; Suryani, E.; Yatno, E.; Subandiono, R.E. Laporan Akhir Pemutakhiran Peta Sumberdaya Lahan Rawa; Balai Besar Penelitian dan Pengembangan Lahan Pertanian: Bogor, Indonesia, 2020. [Google Scholar]
- Ramamurthy, V.; Chattaraj, S.; Singh, S.K.; Yadav, R.P. Identification of potential areas for crops. Curr. Sci. 2018, 115, 955–961. [Google Scholar] [CrossRef]
- Bachri, S.; Sulaeman, Y.; Sugrawijaya, R.; Hidayat, H.; Mulyani, A. Petunjuk Pengoperasian Sistem Penilaian Kesesuaian Lahan (Spkl) Versi 2.0; Balai Besar Litbang Sumberdaya Lahan Pertanian: Bogor, Indonesia, 2016; p. 42. [Google Scholar]
- Reddy, N.N.; Das, B.S. Digital soil mapping of key secondary soil properties using pedotransfer functions and Indian legacy soil data. Geoderma 2023, 429, 116265. [Google Scholar] [CrossRef]
- Aber, J.S.; Marzolff, I.; Ries, J.B.; Aber, S.E.W. (Eds.) Chapter 1—Introduction to Small-Format Aerial Photography. In Small-Format Aerial Photography and UAS Imagery, 2nd ed.; Academic Press: Cambridge, MA, USA, 2019; pp. 1–10. [Google Scholar]
- Mulyani, A.; Puspitahati, D.; Nurjannah, S.S.; Mohlas; Taufik, M. Sebaran Luas Baku Sawah Berdasarkan Jenis Sawah; Balai Besar Litbang Sumberdaya Lahan Pertanian: Bogor, Indonesia, 2021. [Google Scholar]
- Badan Pusat Statistik. Statistik Indonesia 2020; Badan Pusat Statistik: Jakarta, Indonesia, 2020; Volume 1101001, p. 758. [Google Scholar]
- Badan Pertanahan Nasional. Peta Penggunaan Lahan Tahun 1999 Skala 1:250000. [Peta]; Badan Pertanahan Nasional: Jakarta, Indonesia, 1999. [Google Scholar]
- Badan Pertanahan Nasional. Peta Penggunaan Lahan Tahun 2012 Skala 1:250000. [Peta]; Badan Pertanahan Nasional: Jakarta, Indonesia, 2012. [Google Scholar]
- KLHK. Peta Spasial Tutupan Lahan Skala 1:250000. [Peta]; Kementerian Lingkungan Hidup dan Kehutanan: Jakarta, Indonesia, 2019. [Google Scholar]
- Pusat Penelitian dan Pengembangan Tanah dan Agroklimat. Atlas Arahan Tata Ruang Pertanian Indonesia Skala 1:1.000.000. [Peta]; Pusat Penelitian dan Pengembangan Tanah dan Agroklimat: Bogor, Indonesia, 2001. [Google Scholar]
- Balai Besar Sumberdaya Lahan Pertanian. Atlas Peta Tanah Skala 1:250000 per Provinsi. [Peta]; Balai Besar Lirbang Sumberdaya Lahan Pertanian: Bogor, Indonesia, 2014. [Google Scholar]
- KLHK. Peta Status Kawasan Hutan Tahun 2019. [Peta]; Kementerian Lingkungan Hidup dan Kehutanan: Jakarta, Indonesia, 2019. [Google Scholar]
- Badan Pertanahan Nasional. Peta Spasial Luas Baku Sawah Tahun 2019. [Peta]; Badan Pertanahan Nasional: Jakarta, Indonesia, 2019. [Google Scholar]
- Kemenko Perekonomian. Laporan Kegiatan Rekonsiliasi Tutupan Kelapa Sawit Nasional Tahun 2019; Kementerian Koordinasi Bidang Perekonomian: Jakarta, Indonesia, 2019. [Google Scholar]
- Badan Pusat Statistik. Kajian Konsumsi Bahan Pokok Tahun 2017; Badan Pusat Statistik: Jakarta, Indonesia, 2017. [Google Scholar]
- Mulyani, A.; Mulyanto, B.; Barus, B.; Panuju, D.R.; Husnain. Analisis Kapasitas Produksi Lahan Sawah untuk Ketahanan Pangan Nasional Menjelang Tahun 2045. J. Sumberd. Lahan 2022, 16, 33–50. [Google Scholar]
- Ritung, S.; Nugroho, K.; Mulyani, A.; Suryani, E. Petunjuk Teknis Evaluasi Lahan Untuk Komoditas Pertanian; Balai Besar Penelitian dan Pengembangan Sumberdaya Lahan Pertanian, Badan Penelitian dan Pengembangan Pertanian: Bogor, Indonesia, 2011. [Google Scholar]
- Nixon, D.V.; Newman, L. The efficacy and politics of farmland preservation through land use regulation: Changes in southwest British Columbia’s Agricultural Land Reserve. Land Use Policy 2016, 59, 227–240. [Google Scholar] [CrossRef]
- Guerra, A.; Oliveira, P.T.S.; Roque, F.O.; Rosa, I.M.D.; Ochoa-Quintero, J.M.; Guariento, R.D.; Colman, C.B.; Dib, V.; Maioli, V.; Strassburg, B.; et al. The importance of Legal Reserves for protecting the Pantanal biome and preventing agricultural losses. J. Environ. Manag. 2020, 260, 110128. [Google Scholar] [CrossRef]
- Aksu, O.; Iban, M.C. Considerations on the land management system approach in Turkey by the experiences of a case study. Surv. Rev. 2019, 51, 87–96. [Google Scholar] [CrossRef]
- Knoke, T.; Calvas, B.; Moreno, S.O.; Onyekwelu, J.C.; Griess, V.C. Food production and climate protection—What abandoned lands can do to preserve natural forests. Glob. Environ. Change 2013, 23, 1064–1072. [Google Scholar] [CrossRef]


Disclaimer/Publisher’s Note: The statements, opinions and data contained in all publications are solely those of the individual author(s) and contributor(s) and not of MDPI and/or the editor(s). MDPI and/or the editor(s) disclaim responsibility for any injury to people or property resulting from any ideas, methods, instructions or products referred to in the content. |
© 2023 by the authors. Licensee MDPI, Basel, Switzerland. This article is an open access article distributed under the terms and conditions of the Creative Commons Attribution (CC BY) license (https://creativecommons.org/licenses/by/4.0/).