Abstract
Many irrigation ponds in Fukushima Prefecture were decontaminated due to the contamination of radiocesium released from Fukushima Daiichi Nuclear Power Plant. To evaluate the impact of decontamination on 137Cs dynamics in an urban pond in Koriyama City, Fukushima Prefecture, Japan, temporal changes in 137Cs concentrations in bottom sediments and pond water were investigated before and after bottom-sediment removal. Post-decontamination, 137Cs inventories in bottom sediments decreased by 46–89%. 137Cs inventories in bottom sediments were relatively high in fine sediments before decontamination, and were also high at points near the water inlet after decontamination. Following decontamination, the mean 137Cs concentration in suspended solids (SS) and the mean dissolved 137Cs concentration in pond water decreased by 52% and 5%, respectively. Even after decontamination, the normalized 137Cs concentrations in SS and in water, which were calculated by dividing the 137Cs concentrations by the mean 137Cs inventories in each area, were higher than those in rivers, dam reservoirs, and ponds elsewhere in Fukushima. The positive correlations between δ15N values, an indicator of the source contribution to bottom sediments, and 137Cs concentrations in the upper 5 cm of bottom sediments after decontamination implied that SS from urban areas gradually increased the 137Cs inventories in the pond. The results underline the importance of secondary inputs of 137Cs from highly urbanized catchments.
1. Introduction
Many dam reservoirs and ponds in Fukushima Prefecture were contaminated by radiocesium (134Cs and 137Cs) after the Fukushima Daiichi Nuclear Power Plant (FDNPP) accident in 2011. 137Cs inventories are higher in the bottom sediments of dam reservoirs and ponds than in the surrounding soil, indicating a tendency for 137Cs to flow in from the catchment area and accumulate in dam reservoirs and ponds [1,2,3]. Long-term monitoring of 137Cs fluxes has quantitatively revealed that more than 85% of the annual inflow of particulate 137Cs to water bodies accumulates in bottom sediments [4]. The 137Cs that accumulates in bottom sediments gradually leaches out, increasing dissolved 137Cs concentrations in pond and outflow waters [4,5]. Drawdown of the water level in ponds with high levels of radiocesium contamination may increase air-dose rates and could present radiological risks for residents living around contaminated ponds. Leaching of 137Cs from bottom sediments may also affect the freshwater ecosystem of the pond and areas downstream.
Guidelines for pond decontamination were added to existing decontamination guidelines by the Japanese Ministry of the Environment in 2014 [6]. Based on the Act on Special Measures concerning the Handling of Pollution by Radioactive Materials, the Ministry of the Environment or local municipalities decontaminate ponds when water-level drawdown could increase the radiological risks to surrounding residents or visitors [7]. In the case of ponds that require countermeasures to be adopted to ensure the resumption of farming and agricultural activities, Fukushima Prefecture and the local municipalities take protective measures against radioactive materials with technical support from the Ministry of Agriculture, Forestry and Fisheries (MAFF) through the Fukushima Restoration Acceleration Grant. Through the legislative framework, MAFF published a manual for implementation of the countermeasures in 2014, with a revised version in 2016, and a supplemental version in 2017 [8,9,10]. In the manual, ponds with bottom-sediment radiocesium values exceeding 8 kBq/kg are targeted for implementation of countermeasures against radioactive material. The manual describes 10 categories of options for the mitigation of radiological risks, such as separation of contaminated water, bottom-sediment solidification, and bottom-sediment removal. The options are selected by considering the individual situation of each pond.
Bottom-sediment removal is an effective measure to reduce various pollutants and has been implemented as a countermeasure against radionuclide contamination in Fukushima (e.g., [8,9,10,11]). However, bottom-sediment removal leads to substantial changes in the aquatic environment (e.g., [12]). After bottom-sediment removal, Okamoto and Kobayashi [12] found low concentrations of suspended solids (SS) and nutrients, as well as suppressed ammonium nitrogen (NH4-N) leaching in ponds. Dissolved 137Cs concentrations and apparent distribution coefficient (Kd) values in water vary with variation in several water-quality parameters [1,13]. It is, therefore, possible that changes in water quality due to decontamination may alter the dynamics of dissolved 137Cs concentrations and Kd values. However, few studies have evaluated temporal changes in 137Cs concentrations in aquatic environments before and after decontamination.
The stable isotope ratios of nitrogen and carbon (δ15N and δ13C) have been used to determine the origins of bottom sediments in dam reservoirs and SS in river water [14,15,16]. For example, based on a N and C data set, including stable isotope measurements, Huon et al. [15] suggested that agricultural land was a more important source of 137Cs in the bottom sediments of a dam reservoir than were forests. Niida et al. [16] used stable isotope ratios and attributed increased 137Cs concentrations in SS in river water during high-flow events to sediments from forested areas. Comprehensive analyses covering a range of parameters, including N and C stable isotope ratios, can, therefore, be applied to investigate the processes that affect 137Cs behavior in contaminated ponds. According to He and Walling [17], 137Cs concentrations depend on the specific surface areas of soils and sediments. Moreover, 137Cs inventories tend to be higher in fine grain sizes in pond sediments [18]. Disturbance associated with the decontamination may change the particle size distribution in bottom sediment. It is worthwhile to test the particle size effect on 137Cs concentration even after decontamination.
The objective of this study was to evaluate the effects of decontamination on reduction in 137Cs radioactivity in water and sediments, and its influence on water quality, and subsequently to identify possible 137Cs accumulation processes in a decontaminated pond located in an urban area. To track the effects of decontamination and 137Cs accumulation after decontamination, 137Cs concentrations and particle size distributions were measured in bottom sediments collected before and after decontamination. Additionally, N and C stable isotope ratios in bottom sediments and SS in pond water were determined to examine the impact of inflows from an urban area on 137Cs accumulation processes.
2. Materials and Methods
2.1. Study Site
We selected a pond located in an urban area of Koriyama City, Fukushima Prefecture, Japan (Figure 1). The surface area of the study pond was 32,800 m2 based on Geospatial Information Authority of Japan maps. The 137Cs inventory around the pond was 0.170 MBq/m2 based on the third airborne survey conducted by the Ministry of Education, Culture, Sports, Science, and Technology (MEXT) [19] (Figure 1a). Mean annual precipitation and mean annual air temperature in this region were 1145 mm and 12 °C, respectively, per records of the Koriyama weather station from 1976 to 2018. Annual precipitation and mean annual air temperature were 1019 mm and 13 °C in 2015 and 837 mm and 13 °C in 2018. There was no significant changes of precipitation and air temperature between 2015 and 2018 (precipitation: p = 0.443, air temperature: p = 0.967). The variabilities in precipitation and air temperature were quite high by season. The maximum precipitation occurred in September, whereas in winter, the amount of precipitation was low. The maximum temperature occurred in July; even in winter, the monthly temperature was above zero. High amount of precipitation and large temperature variations conducive to active physicochemical processes in the soils of the region.
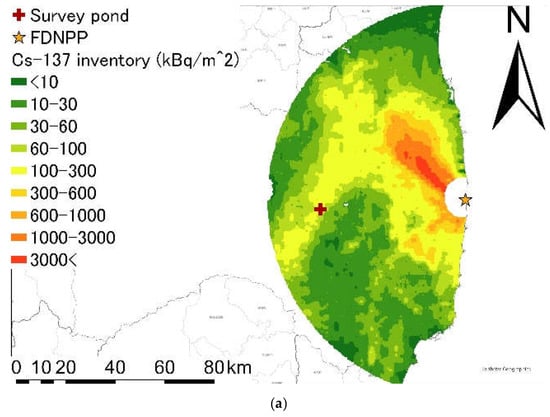
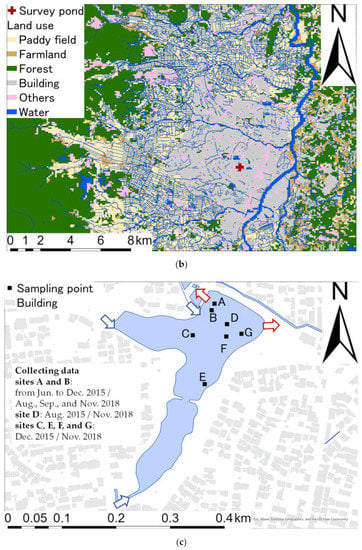
Figure 1.
(a) Spatial distribution of the 137Cs inventory of eastern Fukushima Prefecture; (b) land use around the survey pond; (c) the bottom-sediment sampling points. The red cross and star indicate the survey pond and FDNPP, respectively. The spatial distribution of the 137Cs inventories is based on the third airborne survey by the Ministry of Education, Culture, Sports, Science and Technology (2011) [19]. The land-use map is based on Geographic Information System data obtained from the Digital National Land Information website of the Ministry of Land Infrastructure and Transport of Japan. The blue and red arrows in (c) indicate the inflow and outflow paths, respectively.
The target pond was located in an urban area (Figure 1b) and had three major inflows and two major outflows (Figure 1c). Water from the Asaka Canal and the Minami River flowed into the study pond through an open drain and an underdrain. The outflow water from the study pond passed through an urban area of Koriyama City and joined the Abukuma River. It was difficult to estimate the boundaries of the catchment area and the ratio of the urban area to the catchment area because the inflow water included water from the Asaka Canal and also passed through an urban drainage system.
In 2017, the pond was subjected to bottom-sediment removal, as part of a decontamination of pond radioactive material control project [20]. The top 15 cm of bottom sediments were removed by dredging.
2.2. Sample Collection and Treatment
2.2.1. Bottom Sediment
Bottom sediments were collected at seven points in the pond once a month from June to December 2015 and in August, September, and November 2018. To determine the spatial and vertical distributions of 137Cs concentrations in the pond sediments, bottom sediments were collected at two sites (A and B) on all sampling dates. In addition, bottom sediments were collected at three sites (A, B, and D) in August 2015, six sites (A, B, C, E, F, and G) in December 2015, and seven sites (A, B, C, D, E, F, and G) in November 2018 (Figure 1c). Bottom sediment at site D was not collected in December 2015 because the pond had been drained. Bottom-sediment cores were collected using 4 or 5 cm diameter polyvinyl tubes. Cores were sliced at 1 cm intervals in the depth range of 0–20 cm, 2 cm intervals in the depth range of 20–30 cm, and 5 cm intervals for depths below 30 cm. Each sample was placed in a dryer (MOV-212P, Sanyo Electric, Osaka, Japan) at 50 °C for at least 1 week, and then disaggregated with a mortar and pestle.
2.2.2. Pond Water
Pond water samples were collected near site A once a month from June to December 2015 and approximately once a month from July to November 2018. To collect large amounts of particulate 137Cs from SS, the pond water was collected using an electric pump and subjected to a continuous high-speed centrifugation process [21,22]. A solid-retaining centrifuge (MAB 103B-24, Alfa Laval, Tokyo, Japan) was used at a flow rate of 12.5 L/min by filtering 1,000–3,000 L at 5,000 rpm to obtain SS. In the laboratory, SS in the centrifuge were washed and transferred into tubes and then subjected to further centrifugation (HIMAC CT6E, Hitachi, Tokyo, Japan). The SS samples were then transferred to a Teflon beaker and dried gently at 50 °C on an electric griddle for at least 1 week. After drying, the SS samples were disaggregated and homogenized using a mortar and pestle.
Supernatant from the centrifugation system on site was connected to a nonwoven fabric cartridge filter impregnated with potassium zinc ferrocyanide (PB-C; CS-13ZN, Japan Vilene Co. Ltd., Tokyo, Japan) to immobilize dissolved 137Cs following Yasutaka et al. [23]. The volume of supernatant passing through the PB-C was recorded using a flowmeter. In the laboratory, the PB-C was dried at room temperature for at least 1 week.
At the study site, the water temperature, electrical conductivity (EC), pH, and reserved pH (RpH) of the pond water were measured using a portable pH/EC meter (D-54, Horiba, Kyoto, Japan) and the oxidation reduction potential (ORP) was measured using a portable ORP meter (RM20, DKK/TOA, Tokyo, Japan). The RpH was measured after equilibration with the atmosphere by ventilation with an air pump.
2.3. Radionuclide Analysis
The 137Cs concentrations in bottom sediments, SS, and PB-C were measured at Fukushima University using standard electrode coaxial Ge detectors (Canberra GC3018, Canberra, Meriden, CT, USA), with a relative efficiency of 31.6%. The counting efficiency of the detector was calibrated using a standard gamma volume source (MX033U8PP, The Japan Radioisotope Association, Tokyo, Japan). Samples of bottom sediments and SS in pond water were packed into U-8 or U-9 containers (48 mm diameter, 100 mL and 50 mL, respectively) and measured to an error of less than 5%. The PB-C were measured to an error of less than 10%. The 137Cs inventory in bottom sediments was calculated by multiplying the 137Cs concentration by the sediment weight of each layer and then integrated for the whole core.
Particulate 137Cs concentration (CCs-par: Bq/L), dissolved 137Cs concentration (CCs-dis: Bq/L), total 137Cs concentration (CCs-total: Bq/L), particulate 137Cs concentration to total 137Cs concentration (RCs-par: %), and Kd (L/kg) of pond water were calculated as follows:
where CCs-SS is the 137Cs concentration in SS (Bq/kgDW), CCs-PB-C is the 137Cs concentration in PB-C (Bq/L), WSS is the weight of SS (kg), WPB-C is the weight of the PB-C (kg), Vpar is the centrifuged volume of SS (L), and Vdis is the flow volume through the PB-C (L).
2.4. Measurements of the Particle Size Distribution and Stable Isotopes in Bottom Sediment and SS in Pond Water
The particle size distributions of bottom-sediment samples were determined. The analyzed samples were obtained from site B in July 2015 and November 2018, and from sites F and G in December 2015 and November 2018. The samples from sites B, F, and G in 2015 were collected from depths of 0–35, 0–35, and 1–35 cm, respectively. The part of the sample from 0–1 cm at site G was not measured because the sample weight was too small. The samples from sites B, F, and G in 2018 were collected from depths of 0–15, 0–28, and 0–35 cm, respectively. The particle size distributions of bottom-sediment samples were measured using a laser diffraction particle size analyzer (Mastersizer 3000, Malvern Panalytical, Malvern, UK) after sieving with a 2 mm mesh sieve. Assuming a uniform spherical particle shape and a particle density of 2,650 kg/m3, the specific surface area was calculated as follows:
where S (m2/kg) is the specific surface area, d (m) is the particle size, ρ(kg/m3) is the particle density, R is the volume ratio, and subscript denotes the particle size class.
The stable N and C isotopes, i.e., δ15N and δ13C (‰), in the bottom sediments at depths of 0–5 cm and in SS were measured using a stable isotope mass spectrometer (Flash2000-ConFlo IV-Delta V advantage, Thermo Fisher Scientific, Waltham, MA, USA). Bottom sediment samples collected from sites A and B in December 2015 and November 2018 were measured. Pretreatment was performed according to Ogawa et al. [24]. Samples of 1.200 ± 0.020 mg were weighed into silver foil and inorganic C was removed using HCl. The samples were then dried using a hot plate and dryer and further wrapped in tin foil. Reference standards of L-alanine, L-proline, and L-tyrosine were provided by the Japan Chemical Analysis Center and used to calibrate the measurements of δ15N and δ13C in bottom-sediment and SS samples.
2.5. Laboratory Water Quality Analyses
Pond water samples collected in 500 mL bottles were subjected to measurements of turbidity, in vivo chlorophyll, chlorophyll a (Chl.a) concentration, SS concentrations, and volatile suspended solids (VSS) concentrations within 12 h of collection. Turbidity and in-vivo chlorophyll were measured using a fluorometer (Trilogy, Turner Designs, San Jose, CA, USA) on the day of sampling. The chlorophyll a concentrations in the pond water were measured using a fluorometer after filtering the pond water through a glass-fiber filter paper (Whatman GF/F, Cytiva, Marlborough, MA, USA) with a particle retention capacity of 0.7 μm, and extraction with N,N-dimethylformamide at −20 °C for at least 24 h [25]. SS concentrations were determined based on the difference in the weight of the glass-fiber filter paper before and after baking at 100 °C for 5 h and the filtration volume. VSS concentrations were determined based on the ignition loss of the glass-fiber filter paper at 500 °C for 5 h.
Pond water samples in another 500 mL bottle were subjected to measurements of water chemistry. NH4-N, nitrate nitrogen (NO3-N), nitrite nitrogen (NO2-N), phosphate phosphorus (PO4-P), and dissolved silicate (DSi) were measured using a colorimetric analysis after being filtered through 0.2 µm cellulose acetate membrane filters (membrane filters, Advantec, Japan). NH4-N was measured using the salicylic acid–hypochlorite method [26]. NO3-N was measured using the salicylic acid nitration method [27]. NO2-N was measured using the sulfanilamide–naphthylethylenediamine method [27]. PO4-P was measured using the ascorbic acid–molybdate method [28]. DSi was measured using the molybdate yellow method [28]. The spectrophotometer model used in the analysis was a U-1800 (Hitachi) or UV-1800 (Shimadzu, Kyoto, Japan). After filtration through a 0.2 µm cellulose acetate membrane filter, the major cation components (Na+, K+, Mg2+, and Ca2+) and major anion components (Cl−, NO3−, and SO42−) were analyzed using ion chromatography (DIONEX 1100, Thermo Fisher Scientific). Dissolved inorganic carbon (DIC) and dissolved organic carbon (DOC) were analyzed using a total organic carbon analyzer (TOC-V/ASI-V, Shimadzu) after filtration through a glass-fiber filter paper with a particle retention capacity of 0.7 μm.
3. Results and Discussion
3.1. 137Cs Inventories in Bottom Sediments
Figure 2 shows the spatial distribution of the 137Cs inventories in bottom sediments in 2015 and 2018. Data for sites A and B were used to determine the mean values for the periods June to December 2015 and August, September, and November 2018. Before decontamination, the mean (and standard deviation) 137Cs inventory in bottom sediments at sites A–G was 1.50 ± 0.50 MBq/m2 (n = 7; range: 0.632–2.09 MBq/m2). 137Cs inventories in bottom sediment tended to be low near the inlet and high from the center of the pond to the outlet. The ratio of the mean values of the 137Cs inventory in bottom sediments to the 137Cs inventory around the pond was 8.82 (3.72–12.30), indicating that the 137Cs inventory was higher in the pond than in the catchment area around the pond. The 137Cs inventories in bottom sediment increased at an average rate of 0.296 MBq/m2/year in the 4 years after the FDNPP accident. This represents a relative rate of increase of 174%/year, assuming 0.170 MBq/m2 as the initial 137Cs deposition in the catchment. This relative rate of increase is within the range reported for Ogaki Dam by Funaki et al. [2] (35–359%/year).
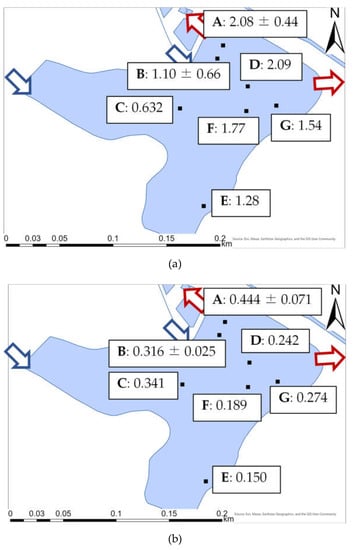
Figure 2.
Spatial distributions of the 137Cs inventories (MBq/m2) in bottom sediments: (a) 2015; (b) 2018. The data for sites A and B are the means and standard deviations during the collection periods in 2015 (June to December) and 2018 (August, September, and November).
After decontamination, the mean (and standard deviation) 137Cs inventory in bottom sediments at sites A–G was 0.279 ± 0.091 MBq/m2 (n = 7; range: 0.150–0.444 MBq/m2). By comparing the 137Cs inventories at each site with those measured before decontamination, the mean percentage reduction in the 137Cs inventory in bottom sediment from 2015 to 2018 was 78 ± 14% (46–89%). The mean percentage reduction in the 137Cs inventory due to decontamination agrees with the findings of Katengeza et al. [11], who reported percentage reductions of 51–93% for a pond after decontamination.
The 137Cs inventories in bottom sediments after decontamination tended to be high near the western water inlet, which was not the case before decontamination. This implies that the spatial distribution of the 137Cs inventory changed after decontamination. The 137Cs inventories in bottom sediments at points near the western water inlet (site C) were relatively low before decontamination, whereas they increased after decontamination. It could be attributed to the difference of reduction between the 137Cs inventory in the bottom sediment and 137Cs concentration in SS in the inflow water. The reduction in 137Cs inventory in the study pond was higher than the that of 137Cs concentration in SS in the inflow water. For instance, the reduction in mean 137Cs concentration in SS in the Abukuma River water from 2015 to 2018 was 32% [22], whereas, the reduction in 137Cs inventory in the study pond was 78%. This situation resulted in relatively high 137Cs inventory at site C. By contrast, site E was far from the southern inlet as shown in Figure 1c, suggesting that there was little impact from the inflow water after decontamination. These results imply that the magnitudes of 137Cs inputs from water inlets determined the spatial distribution of 137Cs inventories in the pond. When the 137Cs concentrations in the catchment area were relatively high compared to the concentrations in bottom sediments, the 137Cs inventories were high around the water inlet, and vice versa.
3.2. Depth Distribution of 137Cs in Bottom Sediments
Figure 3 shows the depth distribution of 137Cs in bottom sediments in 2015 and 2018. Data for sites A and B were obtained from the sediment samples collected in December 2015 and November 2018. Before decontamination, the 137Cs concentrations at sites A and D displayed double peaks, implying variable 137Cs input and accumulation. Sites B and F both displayed a peak at the deeper layer, while site C had a relatively low 137Cs concentration, with only shallow penetration of 137Cs into the sediment. At sites E and G, 137Cs concentrations were almost constant from surface to a depth of 8 and 9 cm, respectively. The 137Cs concentration at site C exceeded 8 kBq/kgDW at a depth of 0–2 cm. The 137Cs concentration at sites excluding site C exceeded 8 kBq/kgDW at the top to depth 8–13 cm, implying substantial differences in the accumulation of 137Cs due to secondary inputs. At sites A–G, the mean (and standard deviation) maximum 137Cs concentration in bottom sediments was 41.9 ± 16.7 kBq/kgDW (n = 7), and the 137Cs concentration in bottom sediments at depths of 0–10 cm was 31.5 ± 11.6 kBq/kgDW (n = 7).
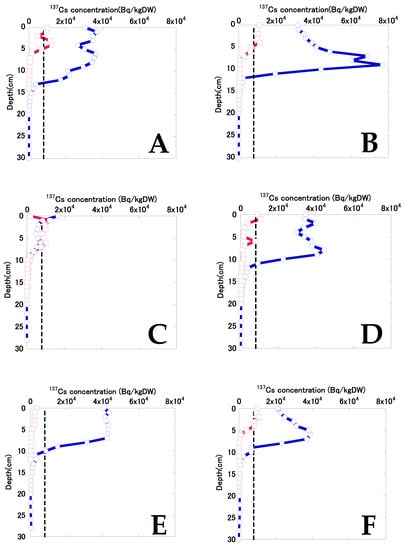
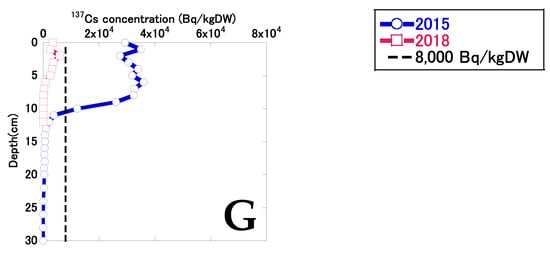
Figure 3.
The depth distributions of 137Cs in bottom sediments in 2015 and 2018. The black broken vertical lines indicate the decontamination criteria concentration (8 kBq/kg) for radiocesium (134Cs and 137Cs) established by the Act on Special Measures concerning the Handling of Pollution by Radioactive Materials. Considering 134Cs decay, the 137Cs concentrations that indicated radiocesium concentrations above 8,000 Bq/kg were 7,240 Bq/kg in December 2015 and 7,720 Bq/kg in November 2018. Data for sites A and B were represented by the sediment samples collected in December 2015 and November 2018.
The sedimentation rates at site B and F which had a single peak were calculated according to the previous study [29]. The sedimentation rates at site B and F were 21 mm/year and 15 mm/year, respectively. The sedimentation rates in Finnish lakes ranged from 0.6 mm/year to 6.1 mm/year excluding the maximum value (approximately 16 mm/year) [29]. The sedimentation rates in the study pond were higher than Finnish lakes, suggesting that the SS from the catchment area accumulated easily in the pond. The SS accumulation can be attributed to the higher precipitation in Japan compared to Finland. Therefore, it was suggested that 137Cs tends to accumulate after decontamination and future work is needed to investigate the volume of inflow water.
137Cs concentrations decreased considerably after decontamination, and 137Cs penetration into bottom sediment was shallower than before decontamination. Sites A and D both displayed double peaks in 137Cs. 137Cs concentrations were almost constant from the top to depths of 5–7 cm at sites B, C, and F, with an exponential decrease deeper in the sediment. 137Cs concentrations were lower at sites E and G than at the other sites. At sites A–G, the mean (and standard deviation) maximum 137Cs concentration in bottom sediments was 9.49 ± 3.14 kBq/kgDW (n = 7), and the 137Cs concentration in bottom sediment at a depth of 0–10 cm was 4.78 ± 2.07 kBq/kgDW (n = 7). The mean percentage reduction in maximum 137Cs concentrations in bottom sediments was 72 ± 20% (27–92%). The mean percentage reduction in 137Cs concentrations in bottom sediments at depths of 0–10 cm was 73 ± 35% (−11 to 96%). According to the results of pre–post monitoring surveys conducted by Koriyama City, the mean percentage reduction in radioactive concentrations in bottom sediments was 81% [20], which was similar to the results of this study. Even after decontamination, several sediment layers had 137Cs concentrations exceeding 8 kBq/kgDW, which is the decontamination criterion in the specified standard given in the Act on Special Measures concerning the Handling of Pollution by Radioactive Materials. Katengeza et al. [11] also reported that 137Cs concentrations in some bottom-sediment samples exceeded 8 kBq/kgDW in a pond after decontamination.
In 2015, the 137Cs concentrations in bottom sediments at depths of 0–10 cm in the study pond had a significant positive correlation (r = 0.641, p < 0.01) with the specific surface area of sediment (Figure 4). The depth distributions of the specific surface areas of sediment are shown in the Supplementary Material Figure S1. In 2015, the difference in 137Cs concentrations at different sites was suggested to be influenced by the specific surface area. These results agreed with those of previous studies (e.g., [17,18]), implying that high 137Cs concentrations occur at sites subject to fine-sediment accumulation, resulting in high 137Cs inventories before decontamination. In contrast, there was no significant correlation (r = 0.295, p = 0.114) between 137Cs concentrations and the specific surface areas of sediments at sites B, F, and G in 2018, implying that factors other than specific surface area may affect differences in 137Cs concentrations at some sites after decontamination.
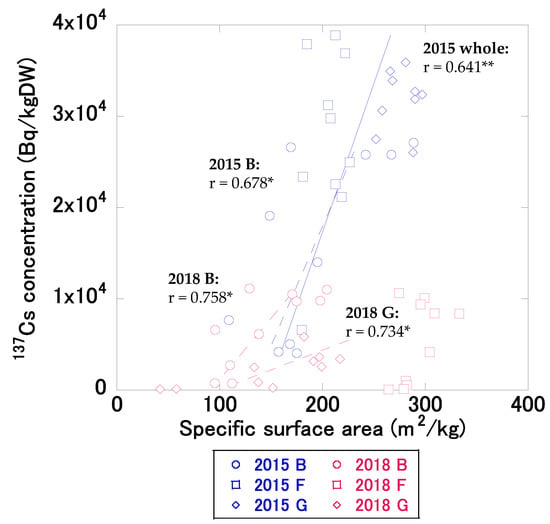
Figure 4.
Relationship between the specific surface areas of sediments and 137Cs concentrations in bottom sediments at depths of 0–10 cm in 2015 (July at site B and December at sites F and G) and 2018 (November at sites B, F, and G). The straight and broken lines indicate significant correlations for the whole site and for sites B, F, and G, respectively. Double asterisks (**) or a single asterisk (*) following a correlation coefficient indicate p < 0.01 and p < 0.05, respectively.
In 2015, the 137Cs concentration in bottom sediments at site B had a significant positive correlation (r = 0.678, p < 0.05) with the specific surface area; however, there was no significant correlation at site F (r = 0.324, p = 0.361) and G (r = 0.121, p = 0.757). In 2018, the 137Cs concentrations in bottom sediments at sites B and G had significant positive correlations (site B: r = 0.758, p < 0.05; site G: r = 0.734, p < 0.05) with the specific surface areas; however, there was no significant correlation at site F (r = 0.522, p = 0.122). Site F did not show significant correlation either before and after decontamination and it disagrees with previous studies. As discussed for spatial distribution of 137Cs inventory, Site F was little affected by inflow waters. This assumption is likely supported by a clear 137Cs concentration peak at subsurface sediment (around 6–7 cm) before decontamination with less variable specific surface area compared to other two sites (Figure S1). It is possible to assume that 137Cs depth distribution at site F even after decontamination reflected the temporal change of 137Cs concentration in SS in pond water. Thus, albeit with uncertainty, at site F, we speculate that temporal variations in 137Cs concentration in SS in pond water appeared more clearly than the variations in particle size.
3.3. 137Cs Concentrations and Kd Values in the Pond Water
Figure 5 shows the temporal changes in 137Cs concentrations in the pond water in 2015 and 2018. In 2015, the CCs-SS, CCs-par, CCs-dis, and CCs-total values were generally high in summer and low in winter, whereas Kd values were relatively constant. In 2018, CCs-SS values tended to decrease during winter. CCs-par, CCs-dis, and CCs-total values were generally higher in summer and lower in winter, as in 2015. Kd values tended to be lower in summer and higher in winter in 2018, and were more variable than in 2015, reflecting lowered CCs-dis values in the winter season.
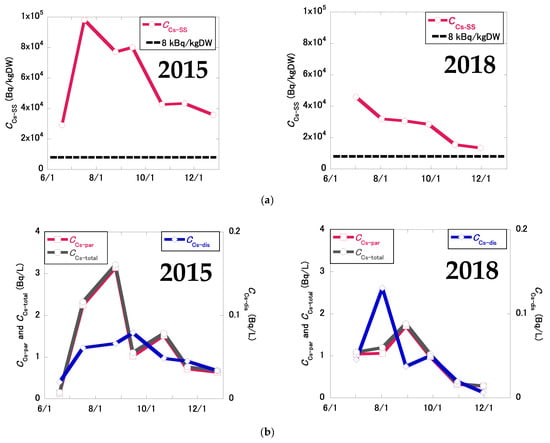
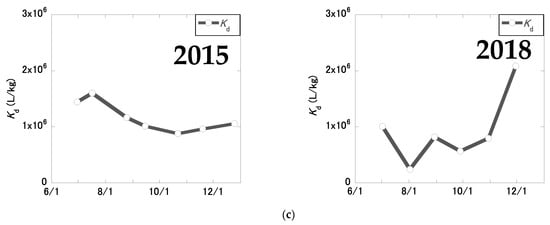
Figure 5.
Temporal changes in 137Cs concentrations in the pond water in 2015 and 2018: (a) 137Cs concentration in SS (CCs-ss); (b) particulate (CCs-par), dissolved (CCs-dis), and total (CCs-total) 137Cs concentrations; (c) Kd values. The black broken lateral lines indicate the 137Cs levels at the decontamination criteria concentration (8 kBq/kg) based on the Act on Special Measures concerning the Handling of Pollution by Radioactive Materials for the radiocesium (134Cs and 137Cs) concentration considering 134Cs decay.
Table 1 shows the mean 137Cs concentrations and Kd values in the pond water in 2015 and 2018. In 2015, the mean CCs-SS, CCs-dis, and Kd values were 58.0 ± 24.6 kBq/kgDW, 0.0506 ± 0.0186 Bq/L, and (1.16 ± 0.25) × 106 L/kg, respectively. In 2018, the mean CCs-SS, CCs-dis, and Kd values were 27.6 ± 10.9 kBq/kgDW, 0.0482 ± 0.0397 Bq/L, and (0.920 ± 0.572) × 106 L/kg, respectively. The percentage reductions in CCs-SS, CCs-par, CCs-dis, and CCs-total were 52%, 33%, 5%, and 32%, respectively. Due to the decontamination procedure, CCs-SS values decreased significantly (p < 0.05); however, no significant changes were observed in CCs-par (p = 0.349), CCs-dis (p = 0.900), CCs-total (p = 0.354), or Kd values (p = 0.374).

Table 1.
The SS (CCs-SS), particulate (CCs-par), dissolved (CCs-dis), and total (CCs-total) 137Cs concentrations and Kd values in the pond water.
Even after decontamination, mean 137Cs concentrations after normalization (see below) were still higher than those reported in the literature for the relevant periods. Table 2 shows the normalized 137Cs concentrations and Kd values for other study areas in Fukushima [1,5,13,22,30]. The normalized CCs-SS and CCs-dis values were calculated by dividing CCs-SS and CCs-dis, respectively, by the mean 137Cs inventory of the catchment area, following previously adopted methods (e.g., [13]). Because of the difficulty in determining the boundary of the catchment area for the pond, a value of 0.170 MBq/m2 was used as the initial 137Cs deposition in the catchment. This was the maximum value recorded in the target catchment, and the calculated normalized concentrations were slightly underestimated. The normalized CCs-SS values in the study pond were 8.0 ± 7.8 times higher in 2015 and 3.8 ± 3.7 times higher in 2018 than in rivers, dam reservoirs, and ponds elsewhere in Fukushima. The normalized CCs-dis values in the study pond were 3.8 ± 3.6 times higher in 2015 and 3.6 ± 3.4 times higher in 2018 compared to those in rivers, dam reservoirs, and ponds in less urbanized areas. Kd values were 3.4 ± 2.7 times higher in 2015, and 2.7 ± 2.1 times higher in 2018, compared to rivers, dam reservoirs, and ponds elsewhere in Fukushima.

Table 2.
Comparison of normalized 137Cs concentrations in SS (normalized CCs-SS), normalized dissolved 137Cs concentrations (normalized CCs-SS), and Kd values with values in rivers and dam reservoirs elsewhere in Fukushima Prefecture.
A possible explanation for the high 137Cs concentrations is the influence of the urban area. In the literature, the normalized 137Cs concentrations in SS in several rivers flowing into Lake Kasumigaura were reported to be positively correlated with the percentage of built-up area in the catchment [31]. The normalized 137Cs concentrations in SS have been reported to be higher in urban rivers than in the Abukuma River [32]. Yamashita et al. [32] found that road dust was the main source of SS in urban rivers. Ozaki et al. [33] found that 137Cs concentrations were significantly higher in road dust than in field-surface soils and bottom sediment in ponds within 50 km of the FDNPP. The reason for the high 137Cs concentrations in SS in the pond water before and after decontamination may have been inflow of particles with high 137Cs concentrations originating from the urban area. Tsuji et al. [13] reported a positive correlation between normalized dissolved 137Cs concentrations and a built-up area, and attributed this to relatively high water temperatures in urban areas and high concentrations of competitive ions in river water in urban areas. This would explain the high CCs-dis values even after decontamination, but the reason for the lower rate of decrease in CCs-dis values compared to CCs-SS values due to decontamination remains unclear.
Kd values decreased slightly due to decreased CCs-SS values and unchanged CCs-dis values. In 2015, there was a significant positive correlation between CCs-SS values and CCs-dis values (r = 0.851, p < 0.05), implying that an equilibrium between solids and liquids in the pond water had been established. In 2018, there was no significant correlation between CCs-SS and CCs-dis values (r = 0.469, p = 0.349). The coefficient of variation of Kd was greater in 2018 than in 2015, indicating that the equilibrium between solids and liquids in the pond water was unstable in 2018. Kd values in river water have been reported to depend on water temperature [22] and on the K+ and DOC contents [1]. Although some water-quality parameters were significantly correlated with Kd values in 2018 (Table S2), the factors influencing the behavior of Kd values were not clear. Compared to other water bodies, including those located in urban areas, the Kd values were higher, but the reason for this was not clear. Because Kd values were in the order of magnitude of 104 L/kg, as reported for an urban river and Lake Kasumigaura [31,32], the higher Kd value (106 L/kg, Table 2) was may have been a specific characteristic of the study pond rather than the influence of the urban area. This will be considered as a future research topic.
Table S1 shows the mean values of the water-chemistry parameters in 2015 and 2018. Only the SS and DOC concentrations differed significantly in 2015 and 2018 (p < 0.05), indicating that the change in water quality due to decontamination was not substantial. This was partly because the seasonal fluctuations in each parameter resulted in huge variability and limited the differences between the two sampling periods. The correlations of 137Cs concentrations and Kd values with water-chemistry parameters were examined based on the results of in situ and laboratory analyses of water chemistry (Table S2). The CCs-SS, CCs-dis, and Kd values were significantly correlated with several water-quality parameters before and after decontamination. CCs-SS values had a significant positive correlation with CCs-dis (r = 0.851, p < 0.05) before decontamination, a significant negative correlation with Cl− values (r = −0.774, p < 0.05) before decontamination, a significant positive correlation with water temperature (r = 0.928, p < 0.01) after decontamination, and a negative correlation with in vivo chlorophyll (r = −0.819, p < 0.05) after decontamination. CCs-dis value had significant positive correlation with NH4-N value (r = 0.924, p < 0.01) after decontamination. Kd values had significant positive correlations with NO3-N (r = 0.846, p < 0.05) and PO4-P (r = 0.786, p < 0.05) values before decontamination, significant negative correlations with Mg2+ (r = −0.814, p < 0.05), Ca2+ (r = −0.877, p < 0.01), SO42− (r = −0.800, p < 0.05), and DIC (r = −0.934, p < 0.01) values before decontamination, and significant positive correlations with EC (r = 0.884, p < 0.05) and in vivo chlorophyll (r = 0.829, p <0.05) and, Mg2+ (r = 0.877, p < 0.05) values after decontamination. As in previous studies [5,34], significant positive correlations (r = 0.924, p < 0.01) between CCs-dis and NH4-N values were found in 2018. There was no significant correlation between CCs-dis and NH4-N (r = −0.449, p = 0.312) before decontamination; however, there was a significant correlation after decontamination. NH4-N increased after decontamination, although not significantly (p = 0.675), suggesting that 137Cs was more easily leached than before decontamination. It could be attributed to an increase in organic matter in the pond. DOC and Chl.a concentration increased after decontamination, as shown in Table S1, suggesting that the amount of organic matter increased and NH4 was more easily generated than before decontamination. By contrast, however, it is often reported that the nutrients concentration decreased due to dredging (e.g. [12,35]). For example, TOC and Chl.a concentrations decreased after dredging in a Chinese lake [35]. Although the mechanism is not clear, there could be a specific nutrient cycle in the decontaminated pond, and this needs future discussion. However, the measurement of a wide variety of parameters may have resulted in some correlations that have not been reported previously.
3.4. Relationships of δ15N and δ13C Values with 137Cs Concentrations
Figure 6 shows the relationships between δ15N and δ13C values, and 137Cs concentrations in bottom sediments and SS in pond water in 2015 and 2018. In 2015, the mean δ15N and δ13C values in bottom sediments at depths of 0–5 cm at sites A–G were 3.9 ± 0.7% and −26.0 ± 0.3‰, respectively (Figure 6a). The differences in δ13C values among sites were small, but the δ15N values differed among sites. The δ15N values at sites A, B, D, E, F, and G ranged from 3.2‰ to 4.1‰, whereas the δ15N value at site C (5.3‰) was higher than that at the other six sites (Figure 6c). These values are within the range of the stable isotope ratios in bottom sediments in the Mano Dam reservoir reported by Huon et al. [15], with mean values of 3.7‰ for δ15N and −27.0‰ for δ13C.
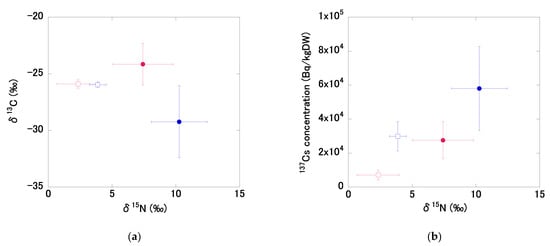
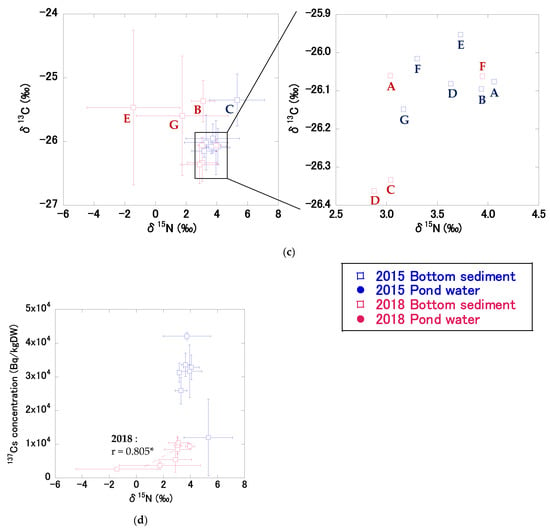
Figure 6.
The relationships between δ15N and δ13C values, and 137Cs concentrations in bottom sediments (open square) and SS in pond water (solid circle) in 2015 (blue) and 2018 (red): (a) the relationship between the mean δ15N and δ13C values for all pond bottom sediments and SS in pond water in 2015 and 2018, (b) the relationship between the mean δ15N values and 137Cs concentrations for all pond bottom sediments and SS in pond water in 2015 and 2018, (c) the relationship between mean δ15N and δ13C values for bottom sediments at sites A–G in 2015 and 2018, (d) the relationship between mean δ15N values and 137Cs concentrations in bottom sediments at sites A–G in 2015 and 2018. Data for pond bottom sediments were from December 2015 and November 2018. All pond water data were from 2015 and 2018. Broken lines indicate a significant correlation. Single asterisks (*) following a correlation coefficient indicate p < 0.05. Error bars indicate the standard deviation.
In 2018, the mean δ15N and δ13C values in bottom sediments at depths of 0–5 cm at sites A–G were 2.3 ± 1.6‰ and −25.9 ± 0.4‰, respectively (Figure 6a). δ15N values decreased by 1.5‰, but δ13C values did not change after decontamination. Similar to 2015, the differences in δ13C values between sites were small, but δ15N values differed between sites (Figure 6c). The δ15N values in bottom sediments at depths of 0–5 cm were similar at sites close to the inflow but differed from those on the east side of the pond. The δ15N values at sites A, B, C, D, and F ranged from 2.9‰ to 3.9‰, whereas the values at sites E (−1.4‰) and G (1.7‰) were lower than those at the other five sites; sites E and G also had lower 137Cs concentrations compared to the other five sites. δ15N values in bottom sediments were significantly positively correlated with 137Cs concentrations (r = 0.805, p < 0.05) (Figure 6d). δ15N and δ13C values have previously been used to evaluate the sources of bottom sediments in lakes and SS in rivers (e.g., [14,15,16]). High δ15N and δ13C values in river-bottom sediments have been reported in urban areas [36,37,38,39], and δ15N levels increase with increased human activity [40]. It has also been reported that δ15N values in suspended particles in lakes are positively correlated with the population density of the catchment area [41]. Based on these reports, we speculate that the origin of the bottom sediments was the same at the sites close to the inflow and differed from that of sediments on the east side of the pond. Specifically, the δ15N results imply that SS in the inflow water were deposited at sites close to the inflow in 2018. The significantly positive correlations between δ15N values and 137Cs concentrations support the hypothesis that particles originating from urban areas resulted in persistently high 137Cs concentrations in bottom sediments.
The mean δ15N and δ13C values in the SS of the pond water in 2015 were 10.3 ± 2.2 ‰ and −29.2 ± 3.2‰, respectively (Figure 6a). The mean δ15N and δ13C values in SS in the pond in 2018 were 7.4 ± 2.4‰ and −24.1 ± 1.8‰, respectively. Over the study period, δ15N values decreased by approximately 3‰ and δ13C values increased significantly (p < 0.01) in the pond SS. The δ15N and δ13C values in the SS of the pond water in 2015 and 2018 differed from those in the bottom sediments. The δ15N values in the SS in water were higher than those in sediments in both years. Mean Chl.a concentration in pond water in 2015 and 2018 was 141 μg/L and 160 μg/L, respectively (Table S1), indicating the eutrophic condition. δ15N values in plankton in lakes and rivers have been reported to be higher under eutrophic conditions, whereas lower values (close to 0‰) have been observed in terrestrial higher plants [38]. This implies that plankton in water and deposited organic matter originating from terrestrial higher plants may have partly contributed to the high and low δ15N values in SS and sediments, respectively. Niida et al. [16] presented mean values of 3.4 ± 1.7‰ for δ15N and −27 ± 1.1‰ for δ13C in SS collected from the Niida, Ukedo, and Takase rivers. The δ15N and δ13C values in SS from dam reservoir water located upstream of the Kinu River were 1.0‰ and −25.8‰, respectively [42]. The δ15N values were relatively high compared to those in other rivers in the area around Fukushima before and after decontamination, implying that the pond was affected by the urban area in the catchment. These results imply the influence of specific 137Cs dynamics in ponds located in urban areas. Continuous observations are required to determine fully the processes and environmental factors that affect 137Cs dynamics.
4. Conclusions
This study measured 137Cs concentrations in bottom sediment and water in an urban pond before and after decontamination to evaluate the impact of bottom-sediment removal on 137Cs contamination. We quantify the decrease in contamination level of 137Cs by decontamination and, at same time, found the specific 137Cs dynamics in the urban pond. Before decontamination, the 137Cs inventory in bottom sediments increased at a rate of 174%/year. Decontamination decreased the mean 137Cs inventory in bottom sediments by 78%, and the maximum 137Cs concentration decreased by 72%. 137Cs inventories were low near the inlet before decontamination but were high near the inlet after decontamination. Before decontamination, 137Cs inventories in bottom sediments tended to be higher at sites with finer grain sizes. After decontamination, the 137Cs inventories in bottom sediments increased due to inflow water. The mean 137Cs concentration in SS and total 137Cs concentration in the pond water decreased by 52% and 32% after decontamination, respectively. The 137Cs concentrations in SS and dissolved 137Cs concentrations in pond water normalized by the 137Cs inventory in the target catchment were higher than those in rivers, ponds, and reservoirs. The results imply that relatively high 137Cs concentrations in SS and dissolved 137Cs concentrations in inflow water that had passed through an urban area led to higher values in the pond. The high δ15N values and their positive correlations with 137Cs values also indicate a substantial contribution from secondary 137Cs inputs from the urban area to the pond. In future studies, it will be necessary to consider the mass balance, including inflow water.
Supplementary Materials
The following supporting information can be downloaded at: https://www.mdpi.com/article/10.3390/land12020519/s1, Figure S1: Depth distribution of 137Cs concentration and specific surface area at site B, F, and G in 2015 and 2018. Specific surface area values represent all data measured.; Table S1: Water quality of pond water in 2015 and 2018. Single asterisk (*) following the p-value mean p < 0.05. p-values were calculated using t-test.; Table S2: Correlations between 137Cs concentration in SS (CCs-ss), dissolved 137Cs concentration (CCs-dis), Kd and water quality in pond water in 2015 and 2018. Double asterisks (**) and single asterisk (*) following the correlation coefficient mean p < 0.01 and p < 0.05, respectively. p-value were calculated using t-test.
Author Contributions
Conceptualization, K.N.; methodology, H.K. and K.N.; validation, H.K.; formal analysis, H.K.; investigation, H.K., Y.W., T.W. and K.N.; resources, Y.W., T.W. and K.N.; data curation, H.K.; writing—original draft preparation, H.K.; writing—review and editing, Y.W., T.W. and K.N.; visualization, H.K.; supervision, K.N.; project administration, T.W. and K.N.; funding acquisition, Y.W., T.W. and K.N. All authors have read and agreed to the published version of the manuscript.
Funding
This research was funded by Fukushima University competitive research fund, grant number 20RG022, 21RG012 and 22RG004.
Data Availability Statement
The data presented in this study are available on request from the corresponding author.
Acknowledgments
We express our gratitude for Kumada Suisan for supporting observations.
Conflicts of Interest
The authors declare no conflict of interest. The funders had no role in the design of the study; in the collection, analyses, or interpretation of data; in the writing of the manuscript; or in the decision to publish the results.
References
- Wakiyama, Y.; Konoplev, A.; Wada, T.; Takase, T.; Byrnes, I.; Carradine, M.; Nanba, K. Behavior of 137Cs in ponds in the vicinity of the Fukushima Dai-ichi nuclear power plant. J. Environ. Radioact. 2017, 178–179, 367–376. [Google Scholar] [CrossRef] [PubMed]
- Funaki, H.; Yoshimura, K.; Sakuma, K.; Iri, S.; Oda, Y. Evaluation of particulate 137Cs discharge from a mountainous forested catchment using reservoir sediments and sinking particles. J. Environ. Radioact. 2018, 189, 48–56. [Google Scholar] [CrossRef] [PubMed]
- Takechi, S.; Tsuji, H.; Koshikawa, M.; Ito, S.; Funaki, H.; Hayashi, S. Evaluation of bioavailable radiocesium in the sediment in forest river and dam reservoir. Jpn. J. Limnol. 2021, 82, 1–16. [Google Scholar] [CrossRef]
- Hayashi, S.; Tsuji, H. Role and effect of a dam on migration of radioactive cesium in a river catchment after the Fukushima Daiichi Nuclear Power Plant accident. Glob. Environ. Res. 2020, 24, 105–113. [Google Scholar]
- Funaki, H.; Sakuma, K.; Nakanishi, T.; Yoshimura, K.; Katengeza, E.W. Reservoir sediments as a long-term source of dissolved radiocaesium in water system; a mass balance case study of an artificial reservoir in Fukushima, Japan. Sci. Total Environ. 2020, 743, 140668. [Google Scholar] [CrossRef]
- Yoshinaga, I.; Hamada, K.; Kubota, T. Countermeasures against radioactive cesium contamination in irrigation ponds in Fukushima Prefecture. J. NARO Res. Dev. 2021, 2021, 55–65. [Google Scholar] [CrossRef]
- Ministry of Agriculture, Forestry and Fisheries. Overview of Technical Manual for Countermeasures against Radioactive Materials in Reservoirs. Available online: https://www.maff.go.jp/j/nousin/saigai/pdf/tamemanu_gaiyou_2.pdf (accessed on 25 January 2023). (In Japanese)
- Ministry of Agriculture, Forestry and Fisheries. Technical Manual for Countermeasures against Radioactive Materials in Reservoirs, Basic Edition. Available online: https://www.maff.go.jp/j/press/nousin/saigai/pdf/141119-01.pdf (accessed on 25 January 2023). (In Japanese)
- Ministry of Agriculture, Forestry and Fisheries. Technical Manual for Countermeasures against Radioactive Materials in Reservoirs. Available online: https://www.maff.go.jp/j/nousin/saigai/pdf/tamemanu_zentai_2.pdf (accessed on 25 January 2023). (In Japanese)
- Ministry of Agriculture, Forestry and Fisheries. Technical Manual for Countermeasures against Radioactive Materials in Reservoirs. Available online: https://www.maff.go.jp/j/nousin/saigai/attach/pdf/tamemanu_zentai-3.pdf (accessed on 25 January 2023). (In Japanese)
- Katengeza, E.W.; Ochi, K.; Sanada, Y.; Iimoto, T.; Yoshinaga, S. The effect and effectiveness of decontaminating a pond in a residential area of Fukushima. Health Phys. 2021, 121, 48–57. [Google Scholar] [CrossRef]
- Okamoto, Y.; Kobayashi, H. Effectiveness of dredging in purification of irrigation ponds. Trans. Jpn. Soc. Irrig. Drain. Reclam. Eng. 1997, 1997, 161–169. [Google Scholar] [CrossRef]
- Tsuji, H.; Ishii, Y.; Shin, M.; Taniguchi, K.; Arai, H.; Kurihara, M.; Yasutaka, T.; Kuramoto, T.; Nakanishi, T.; Lee, S.; et al. Factors controlling dissolved 137Cs concentrations in east Japanese Rivers. Sci. Total Environ. 2019, 697, 134093. [Google Scholar] [CrossRef]
- Laceby, J.P.; Huon, S.; Onda, Y.; Vaury, V.; Evrard, O. Do forests represent a long-term source of contaminated particulate matter in the Fukushima Prefecture? J. Environ. Manag. 2016, 183, 742–753. [Google Scholar] [CrossRef]
- Huon, S.; Hayashi, S.; Laceby, J.P.; Tsuji, H.; Onda, Y.; Evrard, O. Source dynamics of radiocesium-contaminated particulate matter deposited in an agricultural water reservoir after the Fukushima nuclear accident. Sci. Total Environ. 2018, 612, 1079–1090. [Google Scholar] [CrossRef]
- Niida, T.; Wakiyama, Y.; Takata, H.; Taniguchi, K.; Kurosawa, H.; Fujita, K.; Konoplev, A. A comparative study of riverine 137Cs dynamics during high-flow events at three contaminated river catchments in Fukushima. Sci. Total Environ. 2022, 821, 153408. [Google Scholar] [CrossRef]
- He, Q.; Walling, D.E. Interpreting Particle size effects in the adsorption of 137Cs and unsupported 210Pb by mineral soils and sediments. J. Environ. Radioact. 1996, 30, 117–137. [Google Scholar] [CrossRef]
- Yoshimura, K.; Onda, Y.; Fukushima, T. Sediment particle size and initial radiocesium accumulation in ponds following the Fukushima DNPP accident. Sci. Rep. 2014, 4, 1–6. [Google Scholar] [CrossRef]
- Ministry of Education, Culture, Sports, Science and Technology (MEXT). Results of the Third Airborne Monitoring Survey by MEXT. Available online: https://radioactivity.nsr.go.jp/ja/contents/5000/4858/24/1305819_0708.pdf (accessed on 25 January 2023). (In Japanese)
- Koriyama City. Decontamination of Reservoirs and Countermeasures for Radioactive Materials. Available online: https://www.city.koriyama.lg.jp/uploaded/attachment/26473.pdf (accessed on 25 January 2023). (In Japanese).
- Tsukada, H.; Ohse, K. Concentration of radiocaesium in rice and irrigation water, and soil management practices in Oguni, Date, Fukushima. Integr. Environ. Assess. Manag. 2016, 12, 659–661. [Google Scholar] [CrossRef]
- Igarashi, Y.; Nanba, K.; Wada, T.; Wakiyama, Y.; Onda, Y.; Moritaka, S.; Konoplev, A. Factors controlling the dissolved 137Cs seasonal fluctuations in the Abukuma River under the influence of the Fukushima Nuclear Power Plant accident. J. Geophys. Res. Biogeosciences 2022, 127, e2021JG006591. [Google Scholar] [CrossRef]
- Yasutaka, T.; Tsuji, H.; Kondo, Y.; Suzuki, Y.; Takahashi, A.; Kawamoto, T. Rapid quantification of radiocesium dissolved in water by using nonwoven fabric cartridge filters impregnated with potassium zinc ferrocyanide. J. Nucl. Sci. Technol. 2015, 52, 792–800. [Google Scholar] [CrossRef]
- Ogawa, O.N.; Wang, X.-S.; Shinohara, H.; Ohkouchi, N. Accurate Measurements of Carbon and Nitrogen Stable Isotope Ratio by EA/IRMS: Technical Guide for Isotope Ratio Mass Spectrometry; Japan Chemical Analysis Center: Chiba, Japan, 2013; pp. 38–39. [Google Scholar]
- Suzuki, R.; Ishimaru, T. An improved method for the determination of phytoplankton chlorophyll using N, N-dimethylformamide. J. Oceanogr. Soc. Jpn. 1990, 46, 190–194. [Google Scholar] [CrossRef]
- Bower, C.E.; Holm-Hansen, T. A salicylate–hypochlorite method for determining ammonia in seawater. Can. J. Fish. Aquat. Sci. 1980, 37, 794–798. [Google Scholar] [CrossRef]
- Forster, J.C. Soil sampling, handling, storage and analysis. In Methods in Applied Soil Microbiology and Biochemistry; Alef, K., Nannipieri, P., Eds.; Academic Press: London, UK, 1995; pp. 49–121. ISBN 978-0-12-513840-6. [Google Scholar]
- Saijo, Y.; Mitamura, O. Reseach Methods for Lakes; Koudansha: Tokyo, Japan, 1995; ISBN 4061539345. (In Japanese) [Google Scholar]
- Ilus, E.; Saxén, R. Accumulation of Chernobyl-Derived 137Cs in Bottom Sediments of Some Finnish Lakes. J. Environ. Radioact. 2005, 82, 199–221. [Google Scholar] [CrossRef]
- Tsuji, H.; Yasutaka, T.; Kawabe, Y.; Onishi, T.; Komai, T. Distribution of dissolved and particulate radiocesium concentrations along rivers and the relations between radiocesium concentration and deposition after the nuclear power plant accident in Fukushima. Water Res. 2014, 60, 15–27. [Google Scholar] [CrossRef] [PubMed]
- Tsuji, H.; Tanaka, A.; Komatsu, K.; Kohzu, A.; Matsuzaki, S.S.; Hayashi, S. Vertical/spatial movement and accumulation of 137Cs in a shallow lake in the initial phase after the Fukushima Daiichi nuclear power plant accident. Appl. Radiat. Isot. 2019, 147, 59–69. [Google Scholar] [CrossRef] [PubMed]
- Yamashita, R.; Murakami, M.; Iwasaki, Y.; Shibayama, N.; Sueki, K.; Saha, M.; Mouri, G.; Lamxay, S.; O, H.; Koibuchi, Y.; et al. Temporal variation and source analysis of radiocesium in an urban river after the 2011 nuclear accident in Fukushima, Japan. J. Water Environ. Technol. 2015, 13, 179–194. [Google Scholar] [CrossRef]
- Ozaki, H.; Takahashi, H.; Watai, C.; Inamochi, R.; Nagashima, T.; Gomi, T.; Watanabe, I. High level of cesium-137 concentration in road dust samples collected in the eastern area of Japan. J. Environ. Chem. 2016, 26, 131–140. [Google Scholar] [CrossRef]
- Funaki, H.; Tsuji, H.; Nakanishi, T.; Yoshimura, K.; Sakuma, K.; Hayashi, S. Remobilisation of radiocaesium from bottom sediments to water column in reservoirs in Fukushima, Japan. Sci. Total Environ. 2022, 812, 152534. [Google Scholar] [CrossRef]
- Zhang, S.; Zhou, Q.; Xu, D.; Lin, J.; Cheng, S.; Wu, Z. Effects of Sediment Dredging on Water Quality and Zooplankton Community Structure in a Shallow of Eutrophic Lake. J. Environ. Sci. 2010, 22, 218–224. [Google Scholar] [CrossRef]
- Yamada, Y.; Ueda, T.; Wada, E. Distribution of carbon and nitrogen isotope ratios in the Yodo River watershed. Jpn. J. Limnol. 1996, 57, 467–477. [Google Scholar] [CrossRef]
- Yamada, Y.; Yoshioka, T. Stable isotope analysis in aquatic ecosystems. Jpn. J. Ecol. 1999, 49, 39–45. (In Japanese) [Google Scholar] [CrossRef]
- Yamada, Y.; Nakashima, S. Availability of the stable isotope ratios as the standard indicator in basin research. Jpn. J. Limnol. 2003, 64, 197–202. [Google Scholar] [CrossRef]
- Wada, E. Stable δ15N and δ13C isotope ratios in aquatic ecosystems. Proc. Jpn. Acad. Ser. B Phys. Biol. Sci. 2009, 85, 98–107. [Google Scholar] [CrossRef]
- Wada, E. Stable isotope fingerprint. Jpn. J. Ecol. 2009, 59, 259–268. [Google Scholar] [CrossRef]
- Hyodo, F.; Tsugeki, N.; Azuma, J.; Urabe, J.; Nakanishi, M.; Wada, E. Changes in stable isotopes, lignin-derived phenols, and fossil pigments in sediments of Lake Biwa, Japan: Implications for anthropogenic effects over the last 100 Years. Sci. Total Environ. 2008, 403, 139–147. [Google Scholar] [CrossRef]
- Tsushima, K.; Amano, K.; Denda, M.; Tokioka, T. Study on the particulate organic matter supply to river ecosystem in the downstream of a dam. Proc. Hydraul. Eng. 2007, 51, 1117–1122. [Google Scholar] [CrossRef]
Disclaimer/Publisher’s Note: The statements, opinions and data contained in all publications are solely those of the individual author(s) and contributor(s) and not of MDPI and/or the editor(s). MDPI and/or the editor(s) disclaim responsibility for any injury to people or property resulting from any ideas, methods, instructions or products referred to in the content. |
© 2023 by the authors. Licensee MDPI, Basel, Switzerland. This article is an open access article distributed under the terms and conditions of the Creative Commons Attribution (CC BY) license (https://creativecommons.org/licenses/by/4.0/).