Abstract
In this paper, we verified the applicability of immersive VR technology to street-level residential landscape evaluation. We used GSV images taken from pedestrian paths in residential areas of Seoul and selected evaluation images through random sampling. Then, we conducted web-based and VR-based residential streetscape evaluation experiments with those landscape images. The VR-based streetscape evaluation results differed significantly from the web-based streetscape evaluation results. Our multi-level ordered logistic analysis confirmed that the VR-based streetscape evaluation method had better explanatory power than the web-based streetscape evaluation method. In the immersive VR-based streetscape evaluation index, the naturalness, beauty, and safety indicators had particularly high explanatory power. This study concluded that the VR-based streetscape evaluation method over the web-based method is more suitable for evaluating street scenes experienced in daily life. In addition, the innovative methodological approaches, including big data, virtual reality, and visual experiences, will also provide new insights for the planning and management of sustainable landscapes.
1. Introduction
Visual stimuli are impulses or incentives intended to increase the viewer’s participation, activity, interest, etc., in or with a given object or event and improve an area’s perceptual and cognitive properties from an aesthetic point of view [1,2]. Humans generally receive information from the external environment through the five senses (sight, hearing, touch, smell, and taste), with an emphasis on visual perception [3,4]. Urban landscapes are full of visual stimuli, and visual perceptions of urban landscapes are closely associated with individuals’ subjective satisfaction and preferences.
Urban street spaces are also meaningful because they are places where people meet and economic activities occur. Moreover, they are public spaces accessible to anyone, irrespective of income, class, or race [5,6,7,8]. In cities, much of daily life occurs in street spaces, where people perceive and experience information provided by the urban environment. Therefore, street spaces directly or indirectly affect the lives of all city dwellers. Measuring and evaluating at the streetscape level is thus important because the visual experience of a street space can affect residents’ quality of life and a city’s overall image. Landscape evaluation is a powerful tool used in various academic fields to research urban environments [9]. Technological development during the past few decades has enabled ever more objective and sophisticated evaluation methodologies.
Traditionally, urban landscape evaluators have surveyed individual preferences or satisfaction levels by printing photos on paper and distributing them to their chosen study population [10,11,12]. However, such paper-based evaluations are inefficient in both time and cost. Furthermore, they limit people’s perceptions because the printed area and evaluation images are small. In actual streetscapes, people recognize space three-dimensionally and immediately interact with the external environment, whereas the images in paper evaluations are flat, lack many empirical elements, and cannot support immediate interactions. Therefore, such studies with paper-based evaluations lack the ability to acquire the deep and rich perception data that are needed to understand people’s perceptions of urban street space.
In recent years, virtual-reality (VR) technology has been an exciting topic in the field of visual perception because it might be able to solve at least some of the problems with paper-based assessments. Now, public interest and accessibility have expanded with the development and distribution of low-cost VR devices such as the HTC Vive and the Oculus Rift [13]. Of course, such VR technology is not limited to realistic simulations of the real world, but its use in various fields is expanding its capacity for user immersion. Therefore, interest in applying VR to urban landscape evaluations is expanding, but discussions about the effectiveness of VR have been insufficient. Therefore, in this study, we applied VR as a landscape evaluation method to examine its potential as a tool for urban landscape research. To that end, we compared the web-based evaluation method preferred by researchers with a new VR-based evaluation method and confirmed its validity.
2. Literature Review
2.1. Meaning of Landscape Evaluation and Evaluation Factors
Evaluating the human psychology of landscapes is an important topic for researchers, particularly the psychological responses that trigger people’s perceptions of landscapes. Those psychological responses appear through a complex process that generally involves an individual’s past experiences and memories evoked by multiple stimuli [14].
Thus, a relationship of mutual influence exists between the attributes of a landscape and the person who perceives it, and it is that relationship that creates the quality of the landscape for that person [15]. The evaluation of landscape quality uses two disparate approaches depending on the goal: an expert and design approach and a public perception approach [16,17,18]. Understanding the relationship between a city’s image and public perception is important both academically and politically because the public’s perception of landscape issues is affected by subjective individual judgments and feelings at the subconscious level [19].
Landscape evaluation uses classified landscape elements. In general, landscape elements include the values of the observer, past experiences, sociocultural factors, and physical components such as topography, vegetation, nature, and artifacts [20]. The inclusion of tangible and intangible landscape elements in the evaluation criteria reflects the understanding that landscapes, as perceived by humans, are a complex system involving not simply physical elements but also psychological responses. Therefore, urban landscape evaluations are an essential way to comprehensively understand the relationship between an urban environment and people, including the complex mechanisms that drive it.
In general, because landscape evaluations rely on an individual’s subjective assessment, their results are direct and reliable, though the reverse can also be true. Therefore, ensuring the reliability of evaluation results requires the researcher to pay attention to the objectification of the landscape elements to be evaluated, establish reliable evaluation items, and use the average value for each item in a questionnaire for analysis [15,21].
In most cases, landscape evaluations ask individuals to subjectively evaluate specific landscape elements or an overall landscape image using a 5- or 7-point Likert scale [22,23]. Thus, establishing suitable evaluation items is essential because the entire landscape itself is too large and complex to quantify with a Likert scale.
Previous landscape evaluation studies divided their evaluation items into those focused on physical landscape elements and those focused on the subjective feelings of the people looking at the landscape. In terms of the characteristics of a landscape image, the perceived landscape is directly related to openness and complexity [24,25,26], and in general, people prefer a comprehensive and open view [27]. The rich and subtle information provided by residential buildings, convenience facilities, vegetation, street trees, water, and the sky (openness), which are the main elements that shape the landscape of a residential area, can negatively affect landscape satisfaction [28]. Nonetheless, a diversity of elements and richness and complexity, defined by abundance, are positive factors in visual landscape preference [29,30]. The quantity and quality of outdoor space significantly influence human lives. Specifically, people who report high satisfaction with their use of outdoor space also report high satisfaction with living in their neighborhood [31].
In addition to the landscape evaluation items that focus on objective images, other items focus on the subjective thoughts or feelings of the people viewing the landscape. For example, landscape adjectives allow researchers to reflect the characteristics and meanings of various landscape elements in an evaluation by breaking away from a simple assessment of good/bad or satisfaction/dissatisfaction [32]. Adjectives are frequently used to measure an individual’s opinion, mainly through the use of semantic differential scales that ask people to express their opinions on a scale with adjectives at the two extremes [33].
People generally perceive characteristics as dichotomous, such as darkness and light, life and death [34,35]. Evaluation factors to assess public perceptions therefore tend toward dichotomies: beautiful/ugly, natural/artificial, attractive/hateful, quiet/noisy, monotonous/complex, and clean/dirty [36,37,38,39,40]. Such pairs of adjectives help researchers measure how the public perceives the urban landscape in daily life and provide essential clues to understanding the interactions between people and urban landscapes.
2.2. Possibilities and Limitations of Web-Based Landscape Evaluations
Most social-science research depends on surveys in which researchers standardize the content they want to investigate using questionnaire factors that allow them to obtain objectively comparable quantitative data. Traditional surveys were conducted in a face-to-face format using paper, so response results were limited by cost and time constraints [41,42].
Web-based surveys can bypass many of the limitations of traditional paper-based surveys, overcoming data collection limitations [43], reducing costs [44,45], and shortening the time required for data collection [43,45,46,47]. The web survey method can guarantee the participation of any specified number of people through a website, so it is advantageous for securing various answers [48]. In addition, because it is a non-face-to-face method, it might induce honest responses from survey participants [46,47]. Furthermore, web surveys are faster and cheaper than paper surveys because data collection and analysis can be automated [49,50].
However, compared with the face-to-face survey method, such as a telephone survey or interview survey, people responding to web-based surveys are more likely to respond out of the context of the question because the respondent might have little understanding of the question and cannot ask the researcher for clarification. In addition, when the questions are complex, web-based survey respondents are more likely than face-to-face respondents to give insincere responses or no response, limiting the value of the collected data and making interpretation of the results difficult.
Overcoming those limitations requires researchers to: (1) distribute the questionnaires in a way that guarantees a high response at the survey stage; (2) compare the characteristics of responders and non-responders; (3) compare late responders and early responders; (4) conduct random sampling among some of the non-responsive people; and (5) use follow-up measures such as telephone or personal interviews [51]. Additionally, personalized email invitations, follow-up notifications, and proactive notifications of survey intent are all tools for overcoming the limitations of traditional web-based surveys [52,53].
Incentives, institutional support, and public participation can also be used to improve the problem of declining response rates [54]. Nonetheless, web-based surveys as an alternative to face-to-face surveys still have limitations. In particular, because current web-based surveys attempt to give a sense of space and time on a screen, they cannot adequately replicate the three-dimensional landscape.
2.3. Applicability of Virtual Reality Technology
Many researchers prefer web-based survey methods because of their time, cost, and ease of use. However, the issue of unreliability in the survey results is constantly being raised. Therefore, researchers are now considering the landscape planning and management possibilities of VR technology. VR technology combines online and image processing technology development to produce advanced immersive experiences. The spread of inexpensive head-mounted displays (HMDs) has made it possible for the public to use multiple VR applications such as games, education, tourism, and training [55]. In the urban landscape field, immersive VR could improve the academic understanding of human visual perception and landscape perception.
Current methods used for evaluation and satisfaction studies cannot easily reflect the experience factor of landscapes, which limits their ability to reflect its influence in their results [56,57,58,59]. However, immersive VR provides a visual experience by building a realistic environment, making it beneficial for studying people’s visual perception and cognition mechanisms about urban environments [60,61]. Landscape assessments, both traditional face-to-face and web-based surveys, ask people to evaluate images. However, immersive VR technology creates a realistic, three-dimensional spatial environment, making it possible to investigate and analyze how people visually perceive a real urban environment. Therefore, we applied and tested the effectiveness of VR technology for urban landscape evaluation in this study.
2.4. Research Gaps and Research Directions
Because landscape evaluation relies on individual subjective judgments, it is essential to secure the reliability of the survey participants. Therefore, it is necessary to establish detailed standards for the experimental methods used in a landscape evaluation. For this purpose, we created the following research questions.
First, as a tool for evaluating urban landscapes, do VR-based landscape assessments have higher model explanatory power than web-based landscape assessments? Second, does the VR-based streetscape evaluation model better explain the landscape perception of the residential area, which is the stage of daily life? Third, based on the results of the evaluation model, can the VR-based streetscape evaluation method be a better alternative to paper- and web-based landscape evaluation methods?
To overcome the limitations of existing landscape evaluation studies, we applied the following landscape evaluation methodologies. First, by setting most of the experimental conditions the same except for the evaluation methodology, this study tried to limit external effects and perform rigorous statistical verification. To this end, we used the Google Street View (GSV) API service to download Seoul’s landscape images. These big-data GSV images can minimize the problem of subjective selection that was pointed out as a limitation of existing landscape evaluation methods.
Second, we randomly sampled the street images obtained from the Google API through the Python programming language and provided images to participants. The random sampling method solved the researcher intervention problem in existing landscape evaluation studies.
Third, the landscape evaluation applicants performed a landscape evaluation in an immersive VR environments to overcome the limitations of flat image evaluations. Immersive VR environment can provide a realistic, three-dimensional experience, which we expect to produce a more objective and practical landscape evaluation.
3. Data and Methods
3.1. Data Source and Research Procedure
In this study, we examine whether a VR-based landscape perception survey of urban residential landscape images produces better results than a web-based perception survey of the same images. Most of the urban landscapes that people experience in their daily lives occur in residential, commercial, or workplace areas from a pedestrian’s viewpoint. In addition, the urban landscape closely relates to various human activities, including social and physical activities [62]. Therefore, GSV is a valuable data source for evaluating perceptions of the urban landscape at eye level.
GSV images use a vehicle-mounted camera to capture surrounding areas while driving. In other words, because the vehicle is moving while shooting, the landscape differs depending on the shooting interval. To capture various aspects of the urban residential landscape in this study, we collected 360° panoramic GSV images at 20-meter intervals along the Seoul Road Network map. Table 1 shows the distribution of GSV image data downloaded using the Google API. We downloaded 468,309 GSV images from the city of Seoul that were taken between October 2009 and March 2021. Most of the captured images (81.7%) were taken between March and May. It is necessary to consider the weather conditions because the images are affected by the light, which varies depending on the weather. Most of the GSV images we used had sufficient illumination, so the difference in the GSV images according to the weather conditions is not significant.

Table 1.
Distribution of Google Steet View images by month.
In this study, the analysis target is a street in a residential area where daily landscape experiences occur. Therefore, we did not consider automobile-only roads such as highways and tunnels and excluded GSV samples in commercial and business districts. After we performed data cleaning using those conditions, we considered only 318,493 GSV images.
Figure 1 shows the experimental procedure for our urban landscape evaluation. Participants were recruited through the Social Network Messenger Service for graduate students in the Department of Urban Planning at Hanyang University in Seoul, Korea. We notified participants about the content and procedures of the experiment and precautions about their health status and the survey questionnaires. We then selected 30 people (13 males, 17 females) with corrected visual acuity of 1.0 or higher and sent them each an experimental web address to access the urban landscape evaluation. The assessments of five people who complained of dizziness after the VR-based landscape evaluation were excluded from the analysis. Therefore, we analyzed the results from 25 people, each of whom evaluated 15 GSV images.
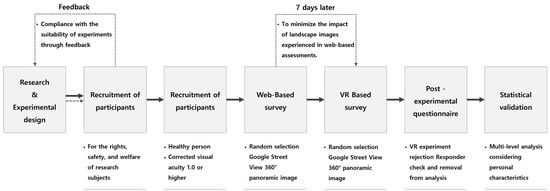
Figure 1.
Research process.
First, the web-based urban residential landscape evaluation was conducted from August 23 to 25, 2021. Using mouse manipulation to rotate left, right, up, and down, each participant was asked to evaluate 15 GSV 360° panoramic images. The ID and evaluation results of the randomly selected GSV 360° panoramic images were recorded automatically. Figure 2 shows the 375 randomly selected GSV image locations for this experimental study. Thirty people participated in the web-based landscape evaluation.
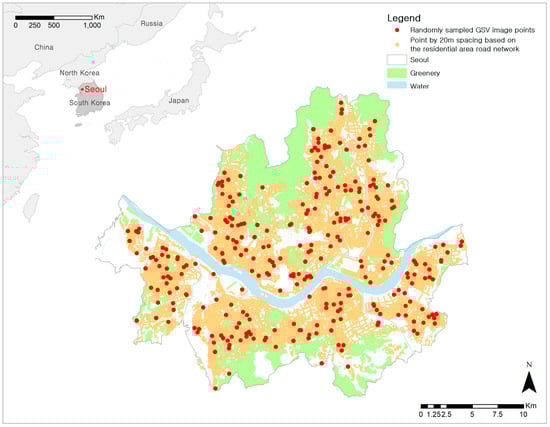
Figure 2.
The 375 randomly selected GSV image locations in residential areas in Seoul.
Next, each participant evaluated the same GSV images in a VR environment. Using the unique ID information for the GSV images from the web-based landscape assessment, we requested GSV images with the maximum resolution provided by the Google API (13,312 × 6,656 pixels) for the VR evaluation, which was held from August 31 to September 3, 2021. Selected GSV 360° panoramic images are projected on the VR HMD. Images used in existing web-based assessments are displayed on flat monitors, which are somewhat removed from the space perceived by real people. Specifically, the area we perceive includes perspective, three-dimensionality, and depth of space, and limited flat-panel monitors are not enough to recognize these spatial properties. However, participants wearing HMDs projected with 360° panoramic images will have a visual experience similar to what we experience. This complements the limitations of web-based landscape assessment methods and enables landscape assessment through a more realistic experience.
We asked participants not to drink alcohol or engage in excessive physical activity the day before the experiment. Before the full-scale VR landscape evaluation, we explained the experimental procedure and evaluation content to each participant. Then we provided a VR HMD. In the VR environment, each participant experienced the same landscape images they saw in the web-based evaluation, and we asked them the same questions as before and coded their responses.
3.2. Web-Based Urban Landscape Evaluation
For the web-based urban landscape evaluation of a residential area, the unique ID of each GSV image was collected based on the coordinates and algorithmically displayed on the web screen at random in the HTML address. In this study, we measured each participant’s subjective opinions about the urban landscape, which varied with their inclinations and might have negatively affected the objectivity of the results. Therefore, we had to collect address, age, and gender information to identify participants directly or indirectly. For that reason, we followed the Institutional Review Board (IRB) approval procedure.
Figure 3 shows an example of the web-based streetscape evaluation sequence. First, we acquired IRB approval and complied with the IRB requirements when participants accessed the provided web address. Only those participants who agreed to participate in the study were allowed to proceed to the next step. On the next page, the participants could confirm that the collected data would not be used for any purpose other than research. After participants agreed to the experimental terms, they were asked to input their personal information and then moved to the following web page, where the full-scale landscape evaluation began. Participants were able to freely observe the scenery by using the computer mouse to look left, right, up, and down. After sufficiently examining the streetscape of the residential area, the participants evaluated the image.
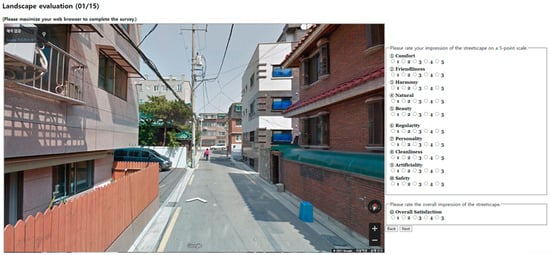
Figure 3.
Example of the web-based urban streetscape evaluation.
To ensure the validity of our study results, each participant evaluated 15 different, randomly sampled GSV images and made ten detailed evaluations and one comprehensive evaluation (11 total assessments) of each of those 15 images.
3.3. Immersive Virtual Reality–based Residential Streetscape Evaluation
Because we wanted to identify how the evaluation method created different judgments about the same landscape, participants evaluated the same GSV images in the VR environment that they considered in the web-based evaluation.
The participants evaluated high-resolution GSV panoramic images using the VR HMD. To minimize the effect of the order of the images on the evaluation results, the 15 evaluation images were presented in random order. The VR HMD worn by the participants was a VIVE-PRO released by HTC. The device provides high-resolution equivalent to 4K, with a resolution of 1,440 × 1,600 pixels (integrated 2,880 × 1,600), a refresh rate of 90Hz, and a viewing angle of 120°. Because noise or sound can affect a landscape evaluation even if differences in image quality from the shooting time and weather are insignificant [63], we conducted the VR experiment in a designated space to minimize the effect of sound. As participants experienced and evaluated the GSV images projected on the VR HMD, we monitored them in real time. The questions in the VR assessment were the same as those in the web-based survey (Figure 4).
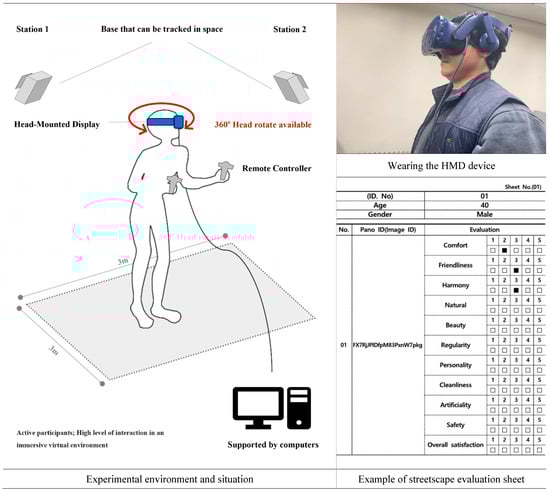
Figure 4.
Example of the VR-based urban streetscape assessment.
3.4. Experiment Participants
This study was conducted with the approval of the Ethics Committee at Hanyang University, and each participant proceeded with the landscape evaluation only after agreeing to the relevant terms. Because visual ability could influence the participants’ assessments, only participants with corrected visual acuity of 1.0 or higher and no partial or complete color blindness were recruited.
The body condition of the participants on the day of the VR-based landscape evaluation was also important because dizziness can occur when using VR devices, which might have affected the evaluation results. Therefore, we asked the participants about their body condition just before the VR-based landscape evaluation, and all participants affirmed that they felt fine. After the VR-based landscape evaluation, we asked participants if they felt dizzy, and five of them said that they did. Therefore, we discarded their results and evaluated only the responses of the remaining 25 participants. Table 2 shows the gender and age of those 25 participants.
Table 2.
The characteristics of participants.
3.5. Evaluation Method
We collected participants’ landscape evaluation results using a questionnaire that contained an emotional assessment of the individuals and asked for their subjective perceptions of the overall landscape. They used an emotion rating scale to express their overall sentiment toward each residential landscape [64].
We used 11 landscape evaluation items, 10 detailed evaluation items (comfort, friendliness, harmony, naturalness, beauty, regularity, personality, cleanliness, artificiality, and safety), and an overall sentiment. All evaluation items used the following scale: (1) Strongly Disagree, (2) Somewhat Disagree, (3) Neutral, (4) Somewhat Agree, and (5) Strongly Agree. In the evaluation result record, higher evaluation scores indicate more positive emotion, and lower evaluation scores indicate more negative emotion. When creating a landscape preference prediction model, individual preferences are sometimes applied individually, but in general, the average values of several people are used [15,18]. Therefore, those who participated in our landscape evaluation answered the questions on a 5-point Likert scale, which is assumed to aggregate the assessment of an individual’s emotions and perceptions [65].
In this study, we statistically examined differences in how each participant evaluated the same landscape image using conventional statistical analysis and t-testing to verify the web-based and VR-based landscape evaluation methods and substantiate the mean homogeneity of each GSV image. After verifying the mean homogeneity, we performed a regression analysis of the relationship between the detailed evaluation items and overall landscape evaluation results because each evaluation item affects the overall satisfaction. Because the assessments were made on a 5-point Likert scale, an ordered logistic regression analysis is applicable. However, evaluating the 15 randomly selected images for each individual could bias the results depending on each individual’s characteristics. Therefore, we used multi-level, ordered logistic regression models. All independents are free from the multicollinearity issue with less than 10 variances in the inflation factor (VIF).
4. Analysis
4.1. Descriptive Analysis
In this study, we asked, “Do participants evaluate landscape satisfaction in residential areas differently in a web-based evaluation and a VR-based evaluation?” To obtain the answer, we derived Table 3 through a descriptive statistical analysis and independent sample t-testing. We found that the VR-based streetscape satisfaction evaluation result (average 2.55) was higher than the web-based result (average 2.48) except for comfort and cleanliness. Specifically, the residential area’s overall comfort evaluation value was 2.33 in the web-based survey, which was higher than the VR value of 2.31, and the cleanliness of the residential streetscape was 2.72 in the web-based survey and 2.57 in the VR-based survey. Alternatively, the VR-based streetscape evaluation values for friendliness, harmony, naturalness, beauty, regularity, personality, artificiality, safety, and overall satisfaction were 2.84, 2.57, 2.09, 2.17, 2.73, 2.22, 3.32, 2.57, and 2.64, respectively, which were all higher than the respective web-based results. In addition, the independent sample t-test results for the means comparison found statistically significant differences for harmony (−2.3023), naturalness (−2.1239), cleanliness (2.4816), artificiality (−3.4194), safety (−1.7887), and overall satisfaction (−2.0053).
Table 3.
t-tests of streetscape satisfaction differences between the web-based and VR-based surveys.
A noteworthy part of the study results is the evaluation items naturalness, cleanliness, artificiality, safety, and overall satisfaction, which are generally deemed the most important in a living environment. For all those evaluation items, the VR-based landscape evaluation result was higher than the web-based result. We interpret those results to indicate that the VR-based landscape evaluation positively affected the overall results for residential areas. Because the VR environment gives participants a realistic, three-dimensional sense of immersion, it can produce more realistic assessments of a landscape by the public (Table 3).
4.2. Multi-Level Ordered Logistic Regression Analysis
We tested for homogeneity to find the differences between the mean values of the groups. However, the detailed evaluation items might have affected the overall satisfaction with the streetscapes in the residential areas. Therefore, we examined the relationships between the individual landscape evaluation items and the overall landscape satisfaction evaluation results. In addition, because the participants wore the HMD device directly on their bodies, cognitive differences dependent on the visual characteristics of each user might also have affected the results. Therefore, we needed to use a statistical methodology to control for differences in visual perception according to individual landscape image recognition. To that end, we conducted a multi-level analysis, and because the survey participants used a 1 to 5 rating scale, we performed an ordered logistic regression analysis.
First, the intra-class correlation (ICC) value, which gives the explanatory power for each level, was 0.164 in the web-based questionnaire and 0.000 in the VR-based evaluation questionnaire. Thus, in the web-based evaluation model, the explanatory power of personal characteristics was 16.4%, and the VR-based evaluation model did not reflect personal optical perception characteristics.
Next, we checked the Akaike Information Criterion (AIC) and Bayes Information Criterion (BIC) values to compare the overall suitability of the landscape evaluation models. The AIC and BIC values of the web-based evaluation survey were 622.2 and 689.0, respectively, higher than the AIC and BIC values of the VR-based evaluation survey (522.3 and 585.1), indicating that the VR-based landscape evaluation model was superior to the web-based model.
Then, we analyzed the effects of the detailed evaluation factors on overall landscape satisfaction. In the web-based evaluation survey, the evaluation factors of gender, comfort, friendliness, naturalness, beauty, personality, cleanliness, and safety significantly and positively affected overall satisfaction (Table 4). Specifically, women said that they were generally satisfied with the residential landscapes they evaluated.
Table 4.
Results of multi-level ordered logistic regression for streetscape satisfaction.
In the VR-based evaluation, gender, comfort, harmony, naturalness, beauty, personality, cleanliness, and safety significantly and positively affected overall satisfaction with the residential landscape. Again, women were generally satisfied with the residential landscape.
The only differences between the web-based and VR-based landscape evaluation methods in the detailed evaluation items affecting overall satisfaction were that friendliness was a significant factor in the web-based evaluation but not the VR-based survey and harmony was significant in the VR-based evaluation but not the web-based survey.
Urban residents depend directly on built environmental components around the street through walking and are affected by their overall satisfaction with their landscape [66], because urban landscape elements provide visual pleasure, which is considered essential for neighborhood satisfaction [67,68,69]. Harmony between the natural environment and artificial facilities is a significant factor in enhancing the attractiveness of a landscape [70]. Therefore, the perceived harmony of a residential landscape has a positive effect on overall landscape satisfaction.
We found differences between the two methodologies in the coefficient values, which indicate the effect of each item on overall landscape satisfaction. In the detailed evaluation items for harmony, naturalness, beauty, and safety, the coefficient value in the VR-based evaluation was higher than that in the web-based method. Specifically, the coefficient for harmony in the VR-based evaluation was 0.458, but it was not statistically significant in the web-based evaluation. In the naturalness evaluation factor, the coefficient value in the VR-based evaluation was 0.591, whereas in the web-based assessment, it was 0.499. Likewise, the coefficient value for beauty in the VR result was 0.992, and it was 0.499 in the web-based evaluation. Alternatively, the coefficient for safety was 1.329 in the web-based landscape assessment and 0.955 in the VR results.
For comfort, friendliness, personality, and cleanliness, the coefficient value in the web-based method was higher than that in the VR-based method. In the web-based landscape evaluation, the coefficient values for comfort, friendliness, personality, and cleanliness were 0.679, 0.383, 0.522, and 0.855, respectively. In the VR-based evaluation, friendliness was not significant, and the coefficient values for comfort, personality, and cleanliness were 0.385, 0.268, and 0.763, respectively (Table 4).
To summarize, we found no significant differences in the evaluation factors that affected overall landscape satisfaction in the multi-level, ordered logistic analysis. However, we did find a substantial difference between the methods in the coefficient values attached to the evaluation factors found to affect overall landscape of satisfaction. Therefore, the methods differ in the explanatory power that individual evaluation items have on the overall landscape evaluation satisfaction. When evaluating the harmony, naturalness, beauty, and safety of residential streetscapes, a VR-based evaluation is judged to be more appropriate. However, when evaluating comfort, friendliness, personality, and cleanliness, the web-based landscape evaluation method is more suitable.
5. Discussion
Landscape satisfaction, as an index to evaluate residents’ perception of the living environment, can be helpful for landscape planning, which shows overall residents’ perception of the residential environment [71]. Surveys are beneficial for measuring landscape satisfaction, and landscape planning and management strategies are obtained from the survey results [72]. The most common landscape evaluation methods are on-site field surveys, paper-based evaluation surveys, and web-based evaluation surveys.
On-site surveys have the advantage of capturing powerful interactions and multisensory experiences. In addition, it can reflect the sincere and comprehensive emotions of on-site participants by combining surveys and interviews [73,74]. However, bringing people on-site to evaluate real landscapes is costly and time-consuming and limits the number of different landscape types that can be studied [75]. On-site evaluation as a way to know people’s perceptions of the landscape can obtain objective and reliable results, but the actual effort involved in the work is considerable [76]. In addition, unexpected situations occurring on-site can seriously affect the research results [77,78].
As an alternative to on-site landscape evaluation, photography is a great visualization survey tool. Accordingly, many researchers collect the necessary information by printing photos on paper or projecting them on monitors. However, some scholars question the validity of photography in landscape evaluation [75,79]. For example, the landscape elements included in the photo may vary depending on the angle of view taken for the same scene [80,81], and it does not have the saliency and contextual validity that are reinforced on-site [75,82,83]. In addition, compared with the on-site evaluation, photos and slides not only contain heterogeneous appearances but also do not contain various dynamic elements [84].
Many researchers prefer web-based survey methods as a compromise solution to on-site research. These web-based surveys have the advantages of time and cost savings, easy access for respondents, and public control over the immediacy and ethical standards of the research process [44,85,86]. Additionally, web-based survey methods can save time by allowing researchers to collect data while performing other tasks [87]. However, paper-based or web-based landscape evaluation methods, which are preferred as existing landscape evaluation methods, lack three-dimensionality and realism and are far from the actual human landscape recognition process.
Alternatively, a VR-based landscape evaluation method can be suitable for urban landscape evaluation in terms of efficiency and effectiveness. VR technology provides a three-dimensional immersive environment and advanced technology to solve the problems of time and space constraints. In addition, because it can immediately capture people’s reactions to the landscape, it can replace field evaluation.
This study verified the applicability of immersive VR technology to evaluate urban streetscapes in residential areas. As a result of comparing the explanatory power of the models according to different methodologies, the VR-based landscape evaluation method (AIC = 522.3) showed a better goodness of fit than the web-based landscape evaluation method (AIC = 622.2). The analysis results of multi-level regression models also indicated that the VR-based landscape evaluation method effectively controls for individual differences in evaluating urban streetscape images. In addition, the VR-based landscape evaluation method enhances the model’s reliability by controlling for individual characteristics, which is the basis for supporting our hypothesis.
This study confirmed that VR-based evaluation methods have proven to be valuable and flexible streetscape evaluation tools. At the same time, this study found that integrating Google 360° panoramic images and VR methods can solve the bias problem in taking and selecting photos for landscape evaluation. Still, compared with field surveys, they have limitations in conveying detailed information about subtle differences and properties of objects, such as materials, surface texture, and age [88,89]. Moreover, the advantages of time and cost savings from the web-based streetscape evaluation method cannot be ignored.
6. Conclusions
As awareness of streetscapes has increased their importance, many landscape evaluation studies have been conducted for landscape management. Everyday life in a city takes place in street spaces, particularly residential areas, so it is crucial to understand landscapes from the street view. However, despite their importance, Korean urban landscapes are continuing to lose their original appearance. Urban expansion and increasing urban development are rapidly changing the appearance of the urban landscape and causing various problems.
Many landscape evaluation techniques to diagnose and solve those urban landscape problems quickly have been studied, mostly in questionnaire evaluations using paper documents or online surveys. However, the time and cost required by existing landscape evaluation methodologies, the subjectivity of the researchers involved in choosing the evaluation images, and difficulties in generalization are problems that remain to be solved.
In this study, we focused on the limitations of the landscape evaluation methodologies used in previous studies. To address those problems, we proposed a virtual landscape evaluation method. The development of VR technology has made it possible to model and simulate an immersive virtual environment that can provide people with a realistic, three-dimensional experience. Therefore, we compared the results of a standard web-based landscape evaluation with those from a VR-based landscape evaluation. We performed t-testing to statistically verify the difference between the results of the two landscape evaluation methodologies and found differences in the average values for the factors of harmony, naturalness, cleanliness, artificiality, safety, and overall satisfaction.
Next, we conducted a multi-level, ordered logistic analysis of the subjective evaluation index and how it affected overall landscape satisfaction in the two methods. We confirmed the ICC value for each model and found a few individual differences between them. The VR methodology can solve the reliability problem of web-based evaluations. The AIC and BIC values confirmed the results of the multi-level ordered logistic analysis: the VR-based street landscape evaluation method had better explanatory power than the web-based street landscape evaluation method.
The detailed evaluation items affecting overall landscape satisfaction were similar in the two methods, but the coefficient values differed. Specifically, the VR-based streetscape evaluation model showed more significant and higher coefficients for harmony, naturalness, beauty, and safety, which are factors that people consider important when choosing a place to live. Therefore, the VR-based landscape evaluation method is suitable for evaluating street scenes experienced in daily life.
Author Contributions
J.H., Conceptualization, writing-original draft, methodology, data curation, visualization, review & editing; S.L., Conceptualization, writing—original draft, writing—review & editing, methodology, validation, funding acquisition, supervision. All authors have read and agreed to the published version of the manuscript.
Funding
This work was supported by the research fund of Hanyang University (HY-202200000001580). The preliminary version of this study was presented at the Fall conference of the Urban Design Institute of Korea held at the convention center of Halla University in Cheju, Korea (14 October 2021).
Institutional Review Board Statement
Not applicable.
Informed Consent Statement
Not applicable.
Data Availability Statement
Not applicable.
Conflicts of Interest
The authors declare no conflict of interest.
References
- Tufte, E.R. Visual Explanations: Images and quantities, evidence and narrative. Appl. Spectrosc. 1997, 51, 304A. [Google Scholar] [CrossRef]
- Tufte, E.R. Beautiful Evidence; Graphics Press: Cheshire, CT, USA, 2006. [Google Scholar]
- Bernasconi, C.; Strager, M.P.; Maskey, V.; Hasenmyer, M. Assessing public preferences for design and environmental attributes of an urban automated transportation system. Landsc. Urban Plan. 2009, 90, 155–167. [Google Scholar] [CrossRef]
- Pflüger, Y.; Rackham, A.; Larned, S. The aesthetic value of river flows: An assessment of flow preferences for large and small rivers. Landsc. Urban Plan. 2010, 95, 68–78. [Google Scholar] [CrossRef]
- Park, K.; Ewing, R.; Sabouri, S.; Larsen, J. Street life and the built environment in an auto-oriented US region. Cities 2019, 88, 243–251. [Google Scholar] [CrossRef]
- Lydon, M.; Garcia, A. A tactical urbanism how-to. In Tactical Urbanism; Island Press: Washington, DC, USA, 2015; pp. 171–208. [Google Scholar]
- LaPlante, J.; McCann, B. Complete streets: We can get there from here. ITE J. 2008, 78, 24. [Google Scholar]
- Cervero, R. Transit-Oriented Development in the United States: Experiences, Challenges, and Prospects; Transportation Research Board: Washington, DC, USA, 2004. [Google Scholar]
- Pastor, I.O.; Martinez, M.A.C.; Canalejoa, A.E.; Marino, P.E. Landscape evaluation: Comparison of evaluation methods in a region of Spain. J. Environ. Manag. 2007, 85, 204–214. [Google Scholar] [CrossRef]
- Matsuoka, R.H.; Kaplan, R. People needs in the urban landscape: Analysis of landscape and urban planning contributions. Landsc. Urban Plan. 2008, 84, 7–19. [Google Scholar] [CrossRef]
- Tveit, M.; Ode, Å.; Fry, G. Key concepts in a framework for analysing visual landscape character. Landsc. Res. 2006, 31, 229–255. [Google Scholar] [CrossRef]
- Hanyu, K. Visual properties and affective appraisals in residential areas in daylight. J. Environ. Psychol. 2000, 20, 273–284. [Google Scholar] [CrossRef]
- Wang, Y.; Ijaz, K.; Calvo, R.A. A software application framework for developing immersive virtual reality experiences in health domain. In Proceedings of the 2017 IEEE Life Sciences Conference (LSC), Sydney, Australia, 13–15 December 2017; p. 37-30. [Google Scholar]
- Aoki, Y. Trends in the study of the psychological evaluation of landscape. Landsc. Res. 1999, 24, 85–94. [Google Scholar] [CrossRef]
- Daniel, T.C. Measuring Landscape Esthetics: The Scenic Beauty Estimation Method; Department of Agriculture, Forest Service, Rocky Mountain Forest and Range Experiment Station: Fort Collins, CO, USA, 1976; Volume 167. [Google Scholar]
- Arthur, L.M. Predicting scenic beauty of forest environments: Some empirical tests. For. Sci. 1977, 23, 151–160. [Google Scholar]
- Zube, E.H.; Sell, J.L.; Taylor, J.G. Landscape perception: Research, application and theory. Landsc. Plan. 1982, 9, 1–33. [Google Scholar] [CrossRef]
- Daniel, T.C. Whither scenic beauty? Visual landscape quality assessment in the 21st century. Landsc. Urban Plan. 2001, 54, 267–281. [Google Scholar] [CrossRef]
- Scott, A. Assessing public perception of landscape: The LANDMAP experience. Landsc. Res. 2002, 27, 271–295. [Google Scholar] [CrossRef]
- Brabyn, L. Landscape classification using GIS and national digital databases. Landsc. Res. 1996, 21, 277–300. [Google Scholar] [CrossRef]
- Shafer, E.L., Jr.; Hamilton, J.F., Jr.; Schmidt, E.A. Natural landscape preferences: A predictive model. J. Leisure Res. 1969, 1, 1–19. [Google Scholar] [CrossRef]
- Stedman, R.C. Is it really just a social construction?: The contribution of the physical environment to sense of place. Soc. Nat. Resour. 2003, 16, 671–685. [Google Scholar] [CrossRef]
- Landon, A.C.; Woosnam, K.M.; Kyle, G.T.; Keith, S.J. Psychological needs satisfaction and attachment to natural landscapes. Environ. Behav. 2021, 53, 661–683. [Google Scholar] [CrossRef]
- Hunziker, M.; Kienast, F. Potential impacts of changing agricultural activities on scenic beautyÅ—A prototypical technique for automated rapid assessment. Landsc. Ecol. 1999, 14, 161–176. [Google Scholar] [CrossRef]
- Fry, G.; Tveit, M.S.; Ode, Å.; Velarde, M.D. The ecology of visual landscapes: Exploring the conceptual common ground of visual and ecological landscape indicators. Ecol. Indic. 2009, 9, 933–947. [Google Scholar] [CrossRef]
- Ode, Å.; Hagerhall, C.M.; Sang, N. Analysing visual landscape complexity: Theory and application. Landsc. Res. 2010, 35, 111–131. [Google Scholar] [CrossRef]
- Appleton, J. Landscape evaluation: The theoretical vacuum. Trans. Inst. Br. Geogr. 1975, 66, 120–123. [Google Scholar] [CrossRef]
- Sahraoui, Y.; Youssoufi, S.; Foltête, J.C. A comparison of in situ and GIS landscape metrics for residential satisfaction modeling. Appl. Geogr. 2016, 74, 199–210. [Google Scholar] [CrossRef]
- Kaplan, R.; Kaplan, S. The Experience of Nature: A Psychological Perspective; Cambridge University Press: Cambridge, UK, 1989. [Google Scholar]
- Wartmann, F.M.; Stride, C.B.; Kienast, F.; Hunziker, M. Relating landscape ecological metrics with public survey data on perceived landscape quality and place attachment. Landsc. Ecol. 2021, 36, 2367–2393. [Google Scholar] [CrossRef]
- Hadavi, S.; Kaplan, R. Neighborhood satisfaction and use patterns in urban public outdoor spaces: Multidimensionality and two-way relationships. Urban For. Urban Green. 2016, 19, 110–122. [Google Scholar] [CrossRef]
- Woo, S.K. A study on the urban streetscape evaluation focused on pedestrian. Korean Soc. Basic Des. Art 2009, 10, 275–284. [Google Scholar]
- Osgood, C.E. Semantic differential technique in the comparative study of cultures. Am. Anthropol. 1964, 66, 171–200. [Google Scholar] [CrossRef]
- Tuan, Y.F. Topophilia: A Study of Environmental Perception, Attitudes, and Values; Columbia University Press: New York, NY, USA, 1990. [Google Scholar]
- Osgood, C.E.; Suci, G.J.; Tannenbaum, P.H. The Measurement of Meaning; University of Illinois Press: Champaign, IL, USA, 1957; No. 47. [Google Scholar]
- Buendia, A.V.P.; Pérez-Albert, Y.; Serrano Gine, D. Mapping landscape perception: An assessment with public participation geographic information systems and spatial analysis techniques. Land 2021, 10, 632. [Google Scholar] [CrossRef]
- Ólafsdóttir, R.; Sæþórsdóttir, A.D. Public perception of wilderness in Iceland. Land 2020, 9, 99. [Google Scholar] [CrossRef]
- Baczyńska, E.; Lorenc, M.W.; Kaźmierczak, U. The landscape attractiveness of abandoned quarries. Geoheritage 2018, 10, 271–285. [Google Scholar] [CrossRef]
- Lim, E.M.; Honjo, T.; Umeki, K. The validity of VRML images as a stimulus for landscape assessment. Landsc. Urban Plan. 2006, 77, 80–93. [Google Scholar] [CrossRef]
- Zube, E.H. Cross-disciplinary and intermode agreement on the description and evaluation of landscape resources. Environ. Behav. 1974, 6, 69. [Google Scholar]
- Uhlig, C.E.; Seitz, B.; Eter, N.; Promesberger, J.; Busse, H. Efficiencies of Internet-based digital and paper-based scientific surveys and the estimated costs and time for different-sized cohorts. PLoS ONE 2014, 9, e108441. [Google Scholar] [CrossRef] [PubMed]
- Wherrett, J.R. Issues in using the Internet as a medium for landscape preference research. Landsc. Urban Plan. 1999, 45, 209–217. [Google Scholar] [CrossRef]
- Truell, A.D.; Bartlett, J.E.; Alexander, M.W. Response rate, speed, and completeness: A comparison of Internet-based and mail surveys. Behav. Res. Methods Instrum. Comput. 2002, 34, 46–49. [Google Scholar] [CrossRef]
- Wright, K.B. Researching Internet-based populations: Advantages and disadvantages of online survey research, online questionnaire authoring software packages, and web survey services. J. Comput. Mediat. Commun. 2005, 10, JCMC1034. [Google Scholar] [CrossRef]
- Akl, E.A.; Maroun, N.; Klocke, R.A.; Montori, V.; Schünemann, H.J. Electronic mail was not better than postal mail for surveying residents and faculty. J. Clin. Epidemiol. 2005, 58, 425–429. [Google Scholar] [CrossRef] [PubMed]
- Bishop, I.D. Testing perceived landscape colour difference using the Internet. Landsc. Urban Plan. 1997, 37, 187–196. [Google Scholar] [CrossRef]
- Wherrett, J.R. Natural Landscape Scenic Preference: Predictive Modelling and the World Wide Web. In Proceedings of the Conference on Urban, Regional, Environmental Planning and Informatics in Planning in an Era of Transition, National Technical University of Athens, Athens, Greece, 22–24 October 1997; pp. 775–794. [Google Scholar]
- Wherrett, J.R. Creating landscape preference models using internet survey techniques. Landsc. Res. 2000, 25, 79–96. [Google Scholar] [CrossRef]
- Zhao, W.; Zhang, L.; Li, X.; Peng, L.; Wang, P.; Wang, Z.; Jiao, L.; Wang, H. Residents’ Preference for Urban Green Space Types and Their Ecological-Social Services in China. Land 2022, 11, 2239. [Google Scholar] [CrossRef]
- Mitra, A.; Jain-Shukla, P.; Robbins, A.; Champion, H.; Durant, R. Differences in rate of response to web-based surveys among college students. Int. J. E-Learn. 2008, 7, 265–281. [Google Scholar]
- Archer, T.M. Response rates to expect from web-based surveys and what to do about it. J. Ext. 2008, 46, 1–5. [Google Scholar]
- Cook, C.; Heath, F.; Thompson, R.L. A meta-analysis of response rates in web-or internet-based surveys. Educ. Psychol. Meas. 2000, 60, 821–836. [Google Scholar] [CrossRef]
- Solomon, D.J. Conducting web-based surveys. Pract. Assess. Res. Eval. 2000, 7, 19. [Google Scholar]
- Johnson, T.; Owens, L. Survey response rate reporting in the professional literature. In Proceedings of the 58th Annual Meeting of the American Association for Public Opinion Research, Nashville, TN, USA, 15–18 May 2003; Volume 2003. [Google Scholar]
- Settgast, V.; Pirker, J.; Lontschar, S.; Maggale, S.; Gütl, C. Evaluating experiences in different virtual reality setups. In International Conference on Entertainment Computing; Springer: Cham, Switzerland, 2016; pp. 115–125. [Google Scholar]
- Lin, Z.; Wang, Y.; Song, Y.; Huang, T.; Gan, F.; Ye, X. Research on Ecological Landscape Design and Healing Effect Based on 3D Roaming Technology. Int. J. Environ. Res. Public Health 2022, 19, 11406. [Google Scholar] [CrossRef]
- Jo, H.I.; Jeon, J.Y. Perception of urban soundscape and landscape using different visual environment reproduction methods in virtual reality. Appl. Acoust. 2022, 186, 108498. [Google Scholar] [CrossRef]
- Chandler, T.; Richards, A.E.; Jenny, B.; Dickson, F.; Huang, J.; Klippel, A.; Neylan, M.; Wang, F.; Prober, S.M. Immersive landscapes: Modelling ecosystem reference conditions in virtual reality. Landsc. Ecol. 2022, 37, 1293–1309. [Google Scholar] [CrossRef]
- Lin, Z.; Zhang, L.; Tang, S.; Song, Y.; Ye, X. Evaluating cultural landscape remediation design based on VR Technology. ISPRS Int. J. Geo-Inform. 2021, 10, 423. [Google Scholar] [CrossRef]
- Kim, J.; Kim, S. Finding the optimal D/H ratio for an enclosed urban square: Testing an urban design principle using immersive virtual reality simulation techniques. Int. J. Environ. Res. Public Health 2019, 16, 865. [Google Scholar] [CrossRef] [PubMed]
- Kim, S.; Kim, J.; Kim, B. Immersive virtual reality-aided conjoint analysis of urban square preference by living environment. Sustainability 2020, 12, 6440. [Google Scholar] [CrossRef]
- Ki, D.; Lee, S. Analyzing the effects of Green View Index of neighborhood streets on walking time using Google Street View and deep learning. Landsc. Urban Plan. 2021, 205, 103920. [Google Scholar] [CrossRef]
- Sanchez, G.M.E.; Van Renterghem, T.; Sun, K.; De Coensel, B.; Botteldooren, D. Using Virtual Reality for assessing the role of noise in the audio-visual design of an urban public space. Landsc. Urban Plan. 2017, 167, 98–107. [Google Scholar] [CrossRef]
- Felnhofer, A.; Kothgassner, O.D.; Schmidt, M.; Heinzle, A.K.; Beutl, L.; Hlavacs, H.; Kryspin-Exner, I. Is virtual reality emotionally arousing? Investigating five emotion inducing virtual park scenarios. Int. J. Hum. Comput. Stud. 2015, 82, 48–56. [Google Scholar] [CrossRef]
- Harpe, S.E. How to analyze Likert and other rating scale data. Curr. Pharm. Teach. Learn. 2015, 7, 836–850. [Google Scholar] [CrossRef]
- Wang, W.; Li, P.; Wang, W.; Namgung, M. Exploring determinants of pedestrians’ satisfaction with sidewalk environments: Case study in Korea. J. Urban Plan. Dev. 2012, 138, 166–172. [Google Scholar] [CrossRef]
- Kaplan, R. Nature at the doorstep: Residential satisfaction and the nearby environment. J. Archit. Plan. Res. 1985, 115–127. [Google Scholar]
- O’Connell, K.A. The harmony of spaces: Feng shui, the ancient Chinese art of placement, is increasingly used today to create meaningful spaces-but how relevant is it to landscape architecture? Landsc. Archit. 1999, 89, 102. [Google Scholar]
- Mak, W.W.; Cheung, R.Y.; Law, L.S. Sense of community in Hong Kong: Relations with community-level characteristics and residents’ well-being. Am. J. Commun. Psychol. 2009, 44, 80–92. [Google Scholar] [CrossRef]
- Wang, Y.C.; Lin, J.C.; Liu, W.Y.; Lin, C.C.; Ko, S.H. Investigation of visitors’ motivation, satisfaction and cognition on urban forest parks in Taiwan. J. For. Res. 2016, 21, 261–270. [Google Scholar] [CrossRef]
- Youssoufi, S.; Foltête, J.C. Determining appropriate neighborhood shapes and sizes for modeling landscape satisfaction. Landsc. Urban Plan. 2013, 110, 12–24. [Google Scholar] [CrossRef]
- Lee, S.W.; Ellis, C.D.; Kweon, B.S.; Hong, S.K. Relationship between landscape structure and neighborhood satisfaction in urbanized areas. Landsc. Urban Plan. 2008, 85, 60–70. [Google Scholar] [CrossRef]
- Jeon, J.Y.; Jo, H.I. Effects of audio-visual interactions on soundscape and landscape perception and their influence on satisfaction with the urban environment. Build. Environ. 2020, 169, 106544. [Google Scholar] [CrossRef]
- Leite, S.K.; Vendruscolo, G.S.; Renk, A.A.; Kissmann, C. Perception of farmers on landscape change in southern Brazil: Divergences and convergences related to gender and age. J. Rural Stud. 2019, 69, 11–18. [Google Scholar] [CrossRef]
- Sevenant, M.; Antrop, M. Landscape representation validity: A comparison between on-site observations and photographs with different angles of view. Landsc. Res. 2011, 36, 363–385. [Google Scholar] [CrossRef]
- Roth, M. Validating the use of Internet survey techniques in visual landscape assessment—An empirical study from Germany. Landsc. Urban Plan. 2006, 78, 179–192. [Google Scholar] [CrossRef]
- Axelsson, Ö.; Nilsson, M.E.; Hellström, B.; Lundén, P. A field experiment on the impact of sounds from a jet-and-basin fountain on soundscape quality in an urban park. Landsc. Urban Plan. 2014, 123, 49–60. [Google Scholar] [CrossRef]
- Shr, Y.H.J.; Ready, R.; Orland, B.; Echols, S. How do visual representations influence survey responses? Evidence from a choice experiment on landscape attributes of green infrastructure. Ecol. Econ. 2019, 156, 375–386. [Google Scholar] [CrossRef]
- Kroh, D.P.; Gimblett, R.H. Comparing live experience with pictures in articulating landscape preference. Landsc. Res. 1992, 17, 58–69. [Google Scholar] [CrossRef]
- Palmer, J.F.; Hoffman, R.E. Rating reliability and representation validity in scenic landscape assessments. Landsc. Urban Plan. 2001, 54, 149–161. [Google Scholar] [CrossRef]
- Stewart, T.R.; Middleton, P.; Downton, M.; Ely, D. Judgments of photographs vs field observations in studies of perception and judgment of the visual environment. J. Environ. Psychol. 1984, 4, 283–302. [Google Scholar] [CrossRef]
- Scott, M.J.; Canter, D.V. Picture or place? A multiple sorting study of landscape. J. Environ. Psychol. 1997, 17, 263–281. [Google Scholar] [CrossRef]
- Stewart, W.P.; Hull, R.B., IV. Capturing the moments: Concerns of in situ leisure research. J. Travel Tour. Mark. 1996, 5, 3–20. [Google Scholar] [CrossRef]
- Huang, S.C.L. The validity of visual surrogates for representing waterscapes. Landsc. Res. 2009, 34, 323–335. [Google Scholar] [CrossRef]
- Reips, U.D. Standards for Internet-based experimenting. Exp. Psychol. 2002, 49, 243. [Google Scholar]
- Weible, R.; Wallace, J. Cyber research: The impact of the Internet on data collection. Mark. Res. 1998, 10, 19. [Google Scholar]
- Llieva, J.; Baron, S.; Healey, N.M. Online surveys in marketing research. Int. J. Mark. Res. 2002, 44, 1–14. [Google Scholar]
- Sacchelli, S.; Grilli, G.; Capecchi, I.; Bambi, L.; Barbierato, E.; Borghini, T. Neuroscience application for the analysis of cultural ecosystem services related to stress relief in forest. Forests 2020, 11, 190. [Google Scholar] [CrossRef]
- Annerstedt, M.; Jönsson, P.; Wallergård, M.; Johansson, G.; Karlson, B.; Grahn, P.; Hansen, A.M.; Währborg, P. Inducing physiological stress recovery with sounds of nature in a virtual reality forest—Results from a pilot study. Physiol. Behav. 2013, 118, 240–250. [Google Scholar] [CrossRef]
Disclaimer/Publisher’s Note: The statements, opinions and data contained in all publications are solely those of the individual author(s) and contributor(s) and not of MDPI and/or the editor(s). MDPI and/or the editor(s) disclaim responsibility for any injury to people or property resulting from any ideas, methods, instructions or products referred to in the content. |
© 2023 by the authors. Licensee MDPI, Basel, Switzerland. This article is an open access article distributed under the terms and conditions of the Creative Commons Attribution (CC BY) license (https://creativecommons.org/licenses/by/4.0/).