Article

The Impact of Anthropogenic Activities and Natural Factors on the Grassland over the Agro-Pastoral Ecotone of Inner Mongolia

1
College of Resources and Environmental Sciences, China Agricultural University, Beijing 100193, China
2
Institute of Geographic Sciences and Natural Resources Research, Chinese Academy of Sciences, Beijing 100101, China
3
Aerospace Information Research Institute, Chinese Academy of Sciences, Beijing 100101, China
4
College of Horticulture, China Agricultural University, Beijing 100193, China
*
Author to whom correspondence should be addressed.
Land 2023, 12(11), 2009; https://doi.org/10.3390/land12112009
Submission received: 11 October 2023 / Revised: 26 October 2023 / Accepted: 28 October 2023 / Published: 2 November 2023

Abstract

:
The agro-pastoral ecotone serves as an important ecological transition zone between grassland and cropland. It plays a crucial role in providing forage and maintaining the ecological security of Northern China. China has initiated many ecological restoration projects in the agro-pastoral ecotone. Separating the affecting factors of anthropogenic activities and natural factors change on grassland may help guide future ecological restoration projects. This study investigated the grassland change over the agro-pastoral ecotone in Inner Mongolia (APEI) using land use data, vegetation index, and monthly climate data, social and economic data from 2010 to 2020. Two indicators were introduced to evaluate the grassland change in quality and quantity. The average annual maximum NDVI of grassland within each sample was used as a proxy for grassland quality, and the proportion of grassland within each sample was used as a proxy for grassland quantity. The driving mechanisms of grassland quality were examined on different types of grassland. The results showed that (1) from 2010 to 2020, the quantity of grassland in APEI slightly decreased while the quality of the grassland significantly improved; (2) the change in grassland quality was jointly caused by natural factors and human activities, with 66.77% being attributed to natural factors and 33.23% to human activities. In some areas, the alteration in grassland quality was solely determined by either the impacts of natural factors or human-induced disturbances; and (3) temperature and precipitation played different roles in affecting grassland quality among different types of grassland. In some areas, anthropogenic activities, such as farmland and population, would affect grassland quality. The findings of this study would contribute to the understanding of the mechanism of ecological environmental changes in the agro-pastoral ecotone and guide the planning and implementation of future ecological restoration projects in agro-pastoral areas.

1. Introduction

Given the current global climate change scenario, the repeated and unsustainable changes in land use lead to a multitude of issues, such as land degradation, desertification, water scarcity, loss of biodiversity, and other related problems [1,2]. Natural factors and human activities both influence land use, with variations in time and location [3]. China was undergoing many land use changes, such as the expansion of construction land and the conversion of arable land to non-agricultural use, especially in the agro-pastoral ecotone.
The agro-pastoral ecotone refers to the transitional zone between agricultural land and pastoral land. Since the concept of agro-pastoral ecotone was proposed in China [4], scholars have conducted research in terms of boundary [5,6], land use [7,8,9,10,11], vegetation trend [12], climate change [6,13,14,15] and ecosystem services [11,16,17]. From a geographical perspective, the agro-pastoral ecotone in China is the ecological transition zone between the Inner Mongolia Plateau, plain, and mountain areas [18]. Historically, pastoralism was the dominant mode of production in this region. Starting in the 1740s, agricultural populations in the Central China region began to gradually migrate into the area. With the increase in population, the grasslands in the river valleys and gentle slope areas were gradually converted into croplands, leading to ecological fragmentation of the grasslands [19]. This resulted in the current mosaic landscape belt, composed of interspersed grasslands, croplands, and forestlands, which is referred to as the agro-pastoral ecotone [14,19]. The agro-pastoral ecotone is extremely susceptible to both natural factors and human disturbance [6,20], and its response to natural factor change and human interference is more obvious [5,21]. Therefore, conducting appropriate research projects in this region is essential.
In the latter half of the last century, the North China agro-pastoral ecotone experienced large-scale reclamation and overgrazing, leading to land desertification, soil and water loss, wind erosion causing sandstorms, and severe land degradation, putting enormous pressure on the ecosystem and seriously affecting the ecological security of the agro-pastoral ecotone [11,16]. Since the 21st century, the Chinese government has implemented the ecological restoration of the agro-pastoral ecotone, which is a crucial region for ecological restoration in Northern China [22,23]. The region involves a large number of national-level ecological restoration projects, such as the Natural Forest Conservation Program, the Three Norths Shelter Forest System Project, the Grain for Green Project, the Sand Control Programs for areas in the vicinity of Beijing and Tianjin, and so on [24,25]. Meanwhile, global climate change and China’s urbanization have resulted in a continuous outflow of rural populations [26,27]. Under these multiple backgrounds, the degradation of ecology in the agro-pastoral ecotone has been effectively controlled to a certain extent [9]. Therefore, conducting research on the alterations in land use or land cover and their underlying drivers in the agro-pastoral ecotone could establish an important practical guideline for the formulation of land use and ecological restoration policies in ecologically vulnerable regions.
Vegetation restoration has been a focal point of ecological restoration in the region, attracting considerable attention. Researchers have conducted studies in various areas of China, demonstrating that precipitation and temperature are the primary natural factors driving vegetation changes [28]. Additionally, studies have analyzed the influence of solar radiation and humidity as additional natural factors affecting vegetation [29]. Different land and vegetation types respond differently to these natural factors [30], with temperature and precipitation being of utmost importance and playing an irreplaceable role in vegetation dynamics. Despite ongoing climate change, the overall vegetation quality in the North China agro-pastoral ecotone has improved over the past two decades, largely due to human-driven afforestation efforts, such as the implementation of programs like the “Grain for Green” initiative [15,22,29]. These afforestation activities have resulted in increased tree cover and the restoration of vegetation quality.
However, relying excessively on afforestation for ecological restoration in arid regions carries risks [28]. Ecological restoration projects that focus solely on increasing tree cover have inadvertently caused harm to grassland ecosystems [31]. It is important to shift the focus towards the restoration of grasslands in order to achieve long-term ecological recovery. Currently, the focus of vegetation restoration projects is more on well-funded afforestation initiatives, while investment and efforts in grassland management and restoration are relatively limited, resulting in further degradation of some grasslands [32]. The grassland ecosystem has multiple ecological and socioeconomic values, playing multiple roles in regulating climate and preventing wind erosion [33,34,35,36]. However, grasslands are easily overlooked in overall vegetation quality assessments due to changes in tree cover and croplands.
Changes in grassland quantity and quality in the agro-pastoral ecotone can better reflect the interaction between natural factors and human activities [37,38,39]. Moreover, previous research has indicated that, in order to assess the impact on vegetation dynamics, it is crucial to further refine the influencing factors based on quantifying the contributions of both human and natural factors [40].
Against the backdrop of climate change, the efficacy of human protection and restoration strategies on the grasslands of the agro-pastoral ecotone remains elusive. Understanding the background and driving mechanisms behind the detailed changes is critical to the implementation of an effective ecological protection and restoration approach [41,42,43]. Despite the significance of this issue, previous studies rarely conducted a separate evaluation of the grasslands of the agro-pastoral ecotone. To address these gaps, the objectives of our study are: (1) to investigate the changes in the quantity and quality of grasslands in the agro-pastoral ecotone of Inner Mongolia; (2) to analyze the interactive effects and dominance of human disturbance and natural factors on grassland quality; (3) to identify the driving factors of grassland quality between different types; and (4) to provide a scientific basis for optimizing land use patterns and ecological protection and restoration in the future.

2. Materials and Methods
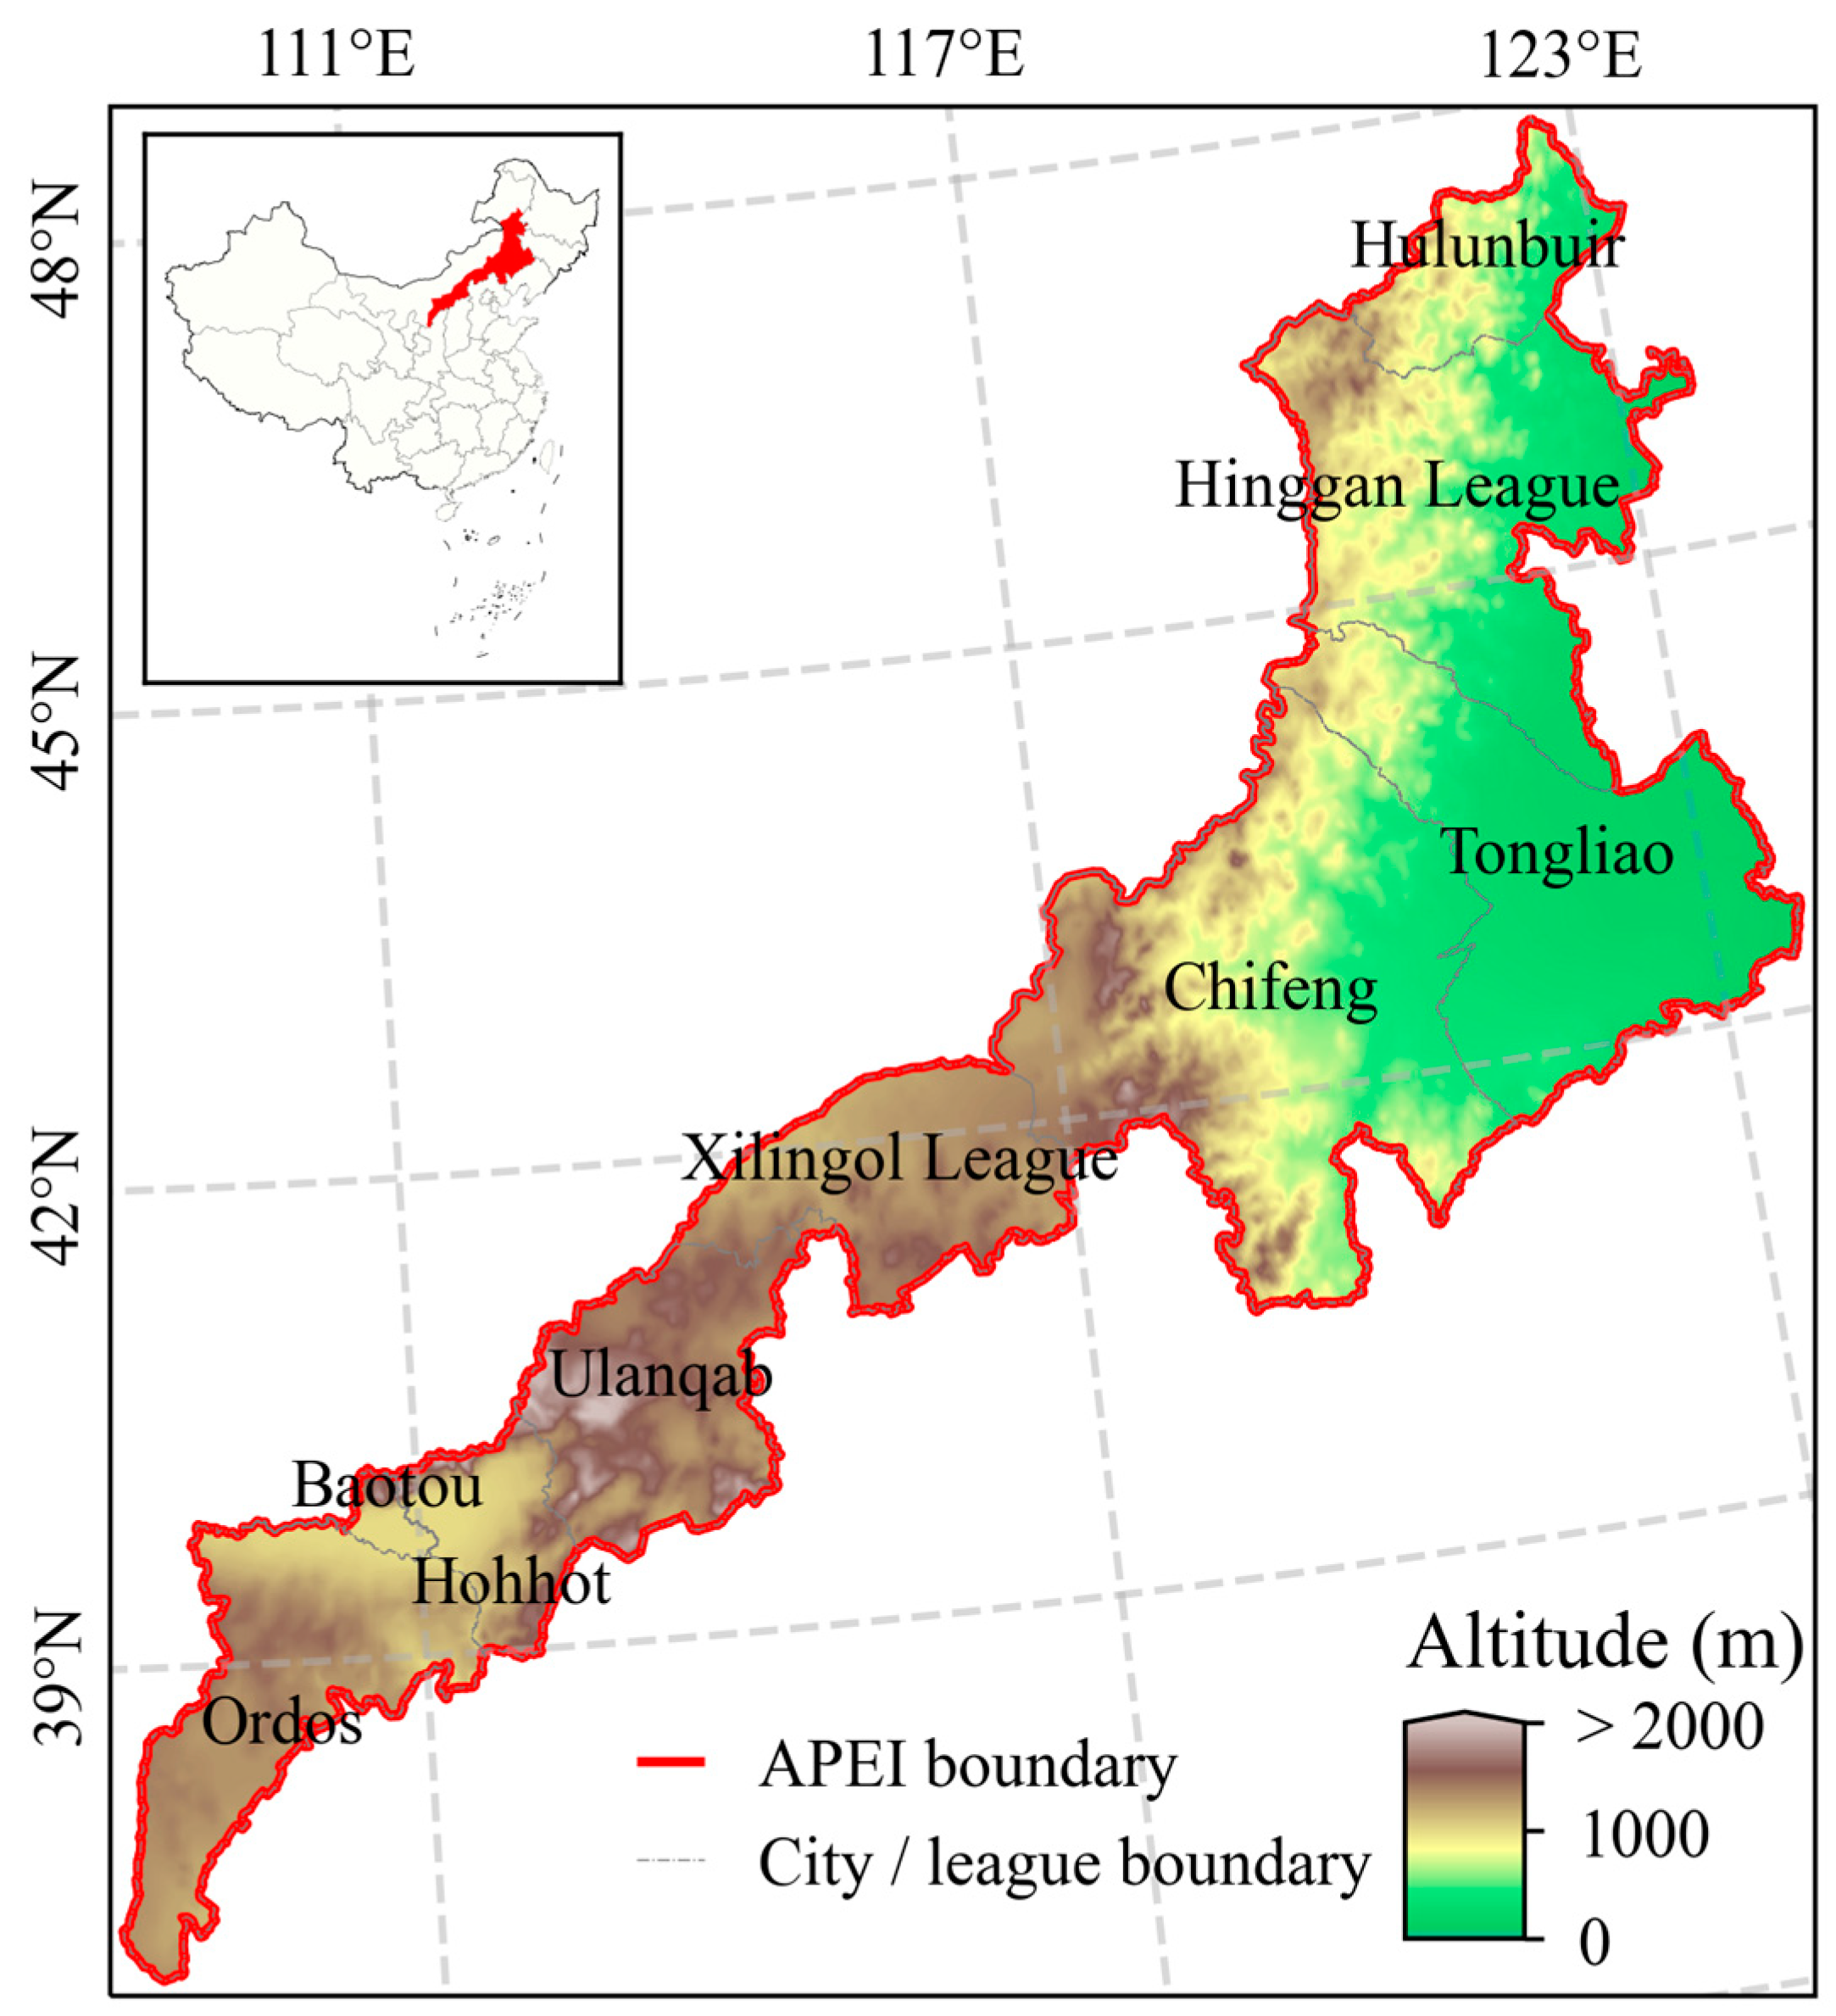
2.1. Study Area

Our study area, the agro-pastoral ecotone in Inner Mongolia (abbreviated as APEI), spans 9 districts and 77 counties, covering a total area of 320,000 km2 (Figure 1). The districts included in this study are Ordos, Hohhot, Baotou, Ulanqab, Chifeng, Xilingol League, Tongliao, Hinggan League, and Hulunbuir. The topography of APEI displays a gradient, with elevations declining from southwest to northeast and ranging from 90 m to 2100 m. The region falls within the transition zone between a semi-humid temperate continental climate and a dry typical continental climate, with an annual precipitation range of 300 mm to 500 mm that decreases from east to west. Furthermore, there is also a significant variation in the annual average temperature. The combined area of grassland and cropland exceeds 90% of APEI (Figure 2). The natural grassland vegetation of APEI is comprised of meadow grassland, typical grassland, and desert grassland.

2.2. Data Sources and Pre-Processing

This study employed data on land cover, socioeconomic factors (population), temperature, precipitation, and normalized difference vegetation index (NDVI) data, all gathered from APEI between the years 2010 and 2020 (Table 1). The population data with a one-kilometer grid were acquired from the Resource and Environment Science and Data Center (REDC, https://www.resdc.cn/ (accessed on 1 October 2023)). The land cover data, with a spatial resolution of 500 m, were collected from the MODIS MCD12Q1 product. To quantify the grassland, the grassland map was created by extracting the pixels representing grassland from the land cover data. NDVI was constructed from infrared and near-infrared channel remote sensing images, the annual maximum value of which has been widely used as an indicator of vegetation quality evaluation [44,45]. The NDVI of the grassland was extracted using the MODIS MOD13Q1 NDVI product (16-day composite) with a spatial resolution of 250 m and the aforementioned grassland map. The monthly temperature data were represented by the MODIS MOD11A2 product (8-day composite) with a spatial resolution of one kilometer. The monthly precipitation data, with the same spatial resolution, were downloaded from the SCIENCE DATA BANK (https://www.scidb.cn (accessed on 1 October 2023)) [46]. To analyze the natural factors in the area, the mean temperature and precipitation values of the growing season (defined as April to October) were extracted. All the MODIS data products were processed and downloaded using the Google Earth Engine Platform.

2.3. Methods

2.3.1. Quantity and Quality Change

To acquire a sufficient representation of samples for analyzing the change in quantity and quality of grassland and its drivers, the study area was divided into 9077 grid squares, each with a side length of 6 km. Regions with high levels of urbanization were excluded through the use of zonal statistics of land cover. The average annual maximum NDVI value of grassland within each grid is used as a proxy variable for quality, while the proportion of grassland within each grid is used as a proxy variable for the quantity of the sample. The mean zonal values of grassland quantity and quality in the grids were calculated for the period of 2010 to 2020 for APEI. Additionally, the potential driving factors were determined through the same process. Regions exhibiting anomalies based on 95% confidence intervals were excluded, resulting in 7452 grids remaining for subsequent analysis. Inter-annual changes in grassland quantity and quality were compared at the grid level. Additionally, the trends in quantity and quality changes were validated using the Theil–Sen Median trend analysis, and the significance of these changes was assessed using the Mann–Kendall trend analysis, with specific details provided in reference [47].

2.3.2. Driving Mechanism of Grassland Quality Change

The residual trend analysis (RESTREND) method was employed to separate and quantify the impacts of both anthropogenic and natural factors on the variations of NDVI (grassland quality) at the grid level [40,43,48]. The method refers to the residuals between the simulated vegetation change trend in the absence of human activities and the actual trends impacted by human activities. Linear regression models of climatic factors (temperature and precipitation) and observed NDVI values were separately established for the years 2010 and 2020, respectively. The predicted values of NDVI for these two years were then calculated using the aforementioned models. The calculation equations are as follows:
N D V I A I = N D V I O B N D V I C I
N D V I C I = α P + β T
where α and β denote the regression coefficients; N D V I C I is the predicted value under climatic impacts based on precipitation ( P ) and temperature ( T ); N D V I A I denotes the residual value, which is determined in combination by N D V I O B (the observed NDVI value from remote sensing images) and N D V I C I .
The slope is the change of NDVI between 2010 and 2020. N D V I C I , N D V I A I , and N D V I O B corresponds to SCI, SAI, and SOB, respectively. The dynamics of grassland quality are determined by the combined relative values of natural factors and anthropogenic impacts. By setting the sum of the contributions of two impacts to 1, the relative contribution of climatic and anthropogenic impacts on the dynamics of grassland quality was computed using the method shown in Table 2 [15,49].

2.3.3. Classification of Grassland Types Based on Driving Forces

According to the results of the RESTREND analysis, the contribution of anthropogenic impacts to grassland quality changes has varied over the past decade. To further compare these changes in detail, we separated the grids into 5 classes based on the CAI, as shown below:
c l a s s = N , c A I = 0 N r , 0 < c A I < b k 1 B , b k 1 < c A I < b k 2 A r , b k 2 < c A I < 1 A , c A I = 1
N = Nature dominated, N r = Relatively nature dominated, B = Balanced, A r = Relatively anthropogenic dominated, A = Anthropogenic dominated, bk = Interrupt values of Jenks natural break.
When CAI equals 0 and 1, the grids correspond to being nature-dominated (N) and anthropogenic-dominated (A), respectively. After excluding the grids influenced by only one impact, the other grids were further subdivided into 3 classes according to the Jenks Natural Breaks Classification [50], namely: relatively nature-dominated (Nr), balanced (B), and relatively anthropogenic-dominated (Ar).
To comprehensively comprehend and verify the variations in grassland quality across different classifications of grassland, this study employed the following analytical methods. The Shapiro–Wilk’s test and Bartlett’s test were utilized to assess the normality and homogeneity of variance, respectively. If the samples passed the preliminary test, the statistical significance test for comparing the differences between two mean values of grassland quality was conducted using the Student’s t-test. Otherwise, the non-parametric Kruskal–Wallis test was utilized [51]. The directional distributions of various grassland classes were assessed using standard deviation ellipse (SDE) analysis [52].

2.3.4. Influencing Factor Analysis for Grassland Quality

The GeoDetector is a tool designed to uncover the variations and underlying mechanisms of spatial distribution within a particular geographical area. It is comprised of four interrelated modules: factor detector, risk detector, interaction detector, and ecological detector [53]. In this study, we utilized a factor detector to quantitatively examine the relationship between potential influencing factors and grassland quality among different grassland classes. The correlations were analyzed by constructing a q statistical status, which ranges from 0 to 1. The q value reflects the extent to which the independent variables account for the dependent variables. As an illustration, when built-up area (independent variable) and grassland quality (dependent variable) were taken into consideration, the q statistic was defined as follows:
q = 1 h = 1 L N h σ h 2 N σ 2
where h = 1 , , L denotes the levels of built-up area; N h and N represent the number of grid cells in the level h and the entire area, respectively; σ h 2 and σ 2 represent the variance of grassland quality change in the level h and the entire area, respectively. The q statistic quantifies the driving forces of built-up area on grassland quality. The larger the q value, the stronger the influencing forces of the built-up area on grassland quality, with q = 0 implying that built-up area has no effect on grassland quality and q = 1 indicating that built-up area entirely controls grassland quality. In this study, the q value of 6 driving factors of grassland quality was calculated, including: precipitation, temperature, grassland area, cropland area, built-up area, and population.
All processing steps were done in Python using the geemap [54], PySal [55], GeoPandas [56], Scikit-learn [57], Xarray [58], and other open source libraries.

3. Results

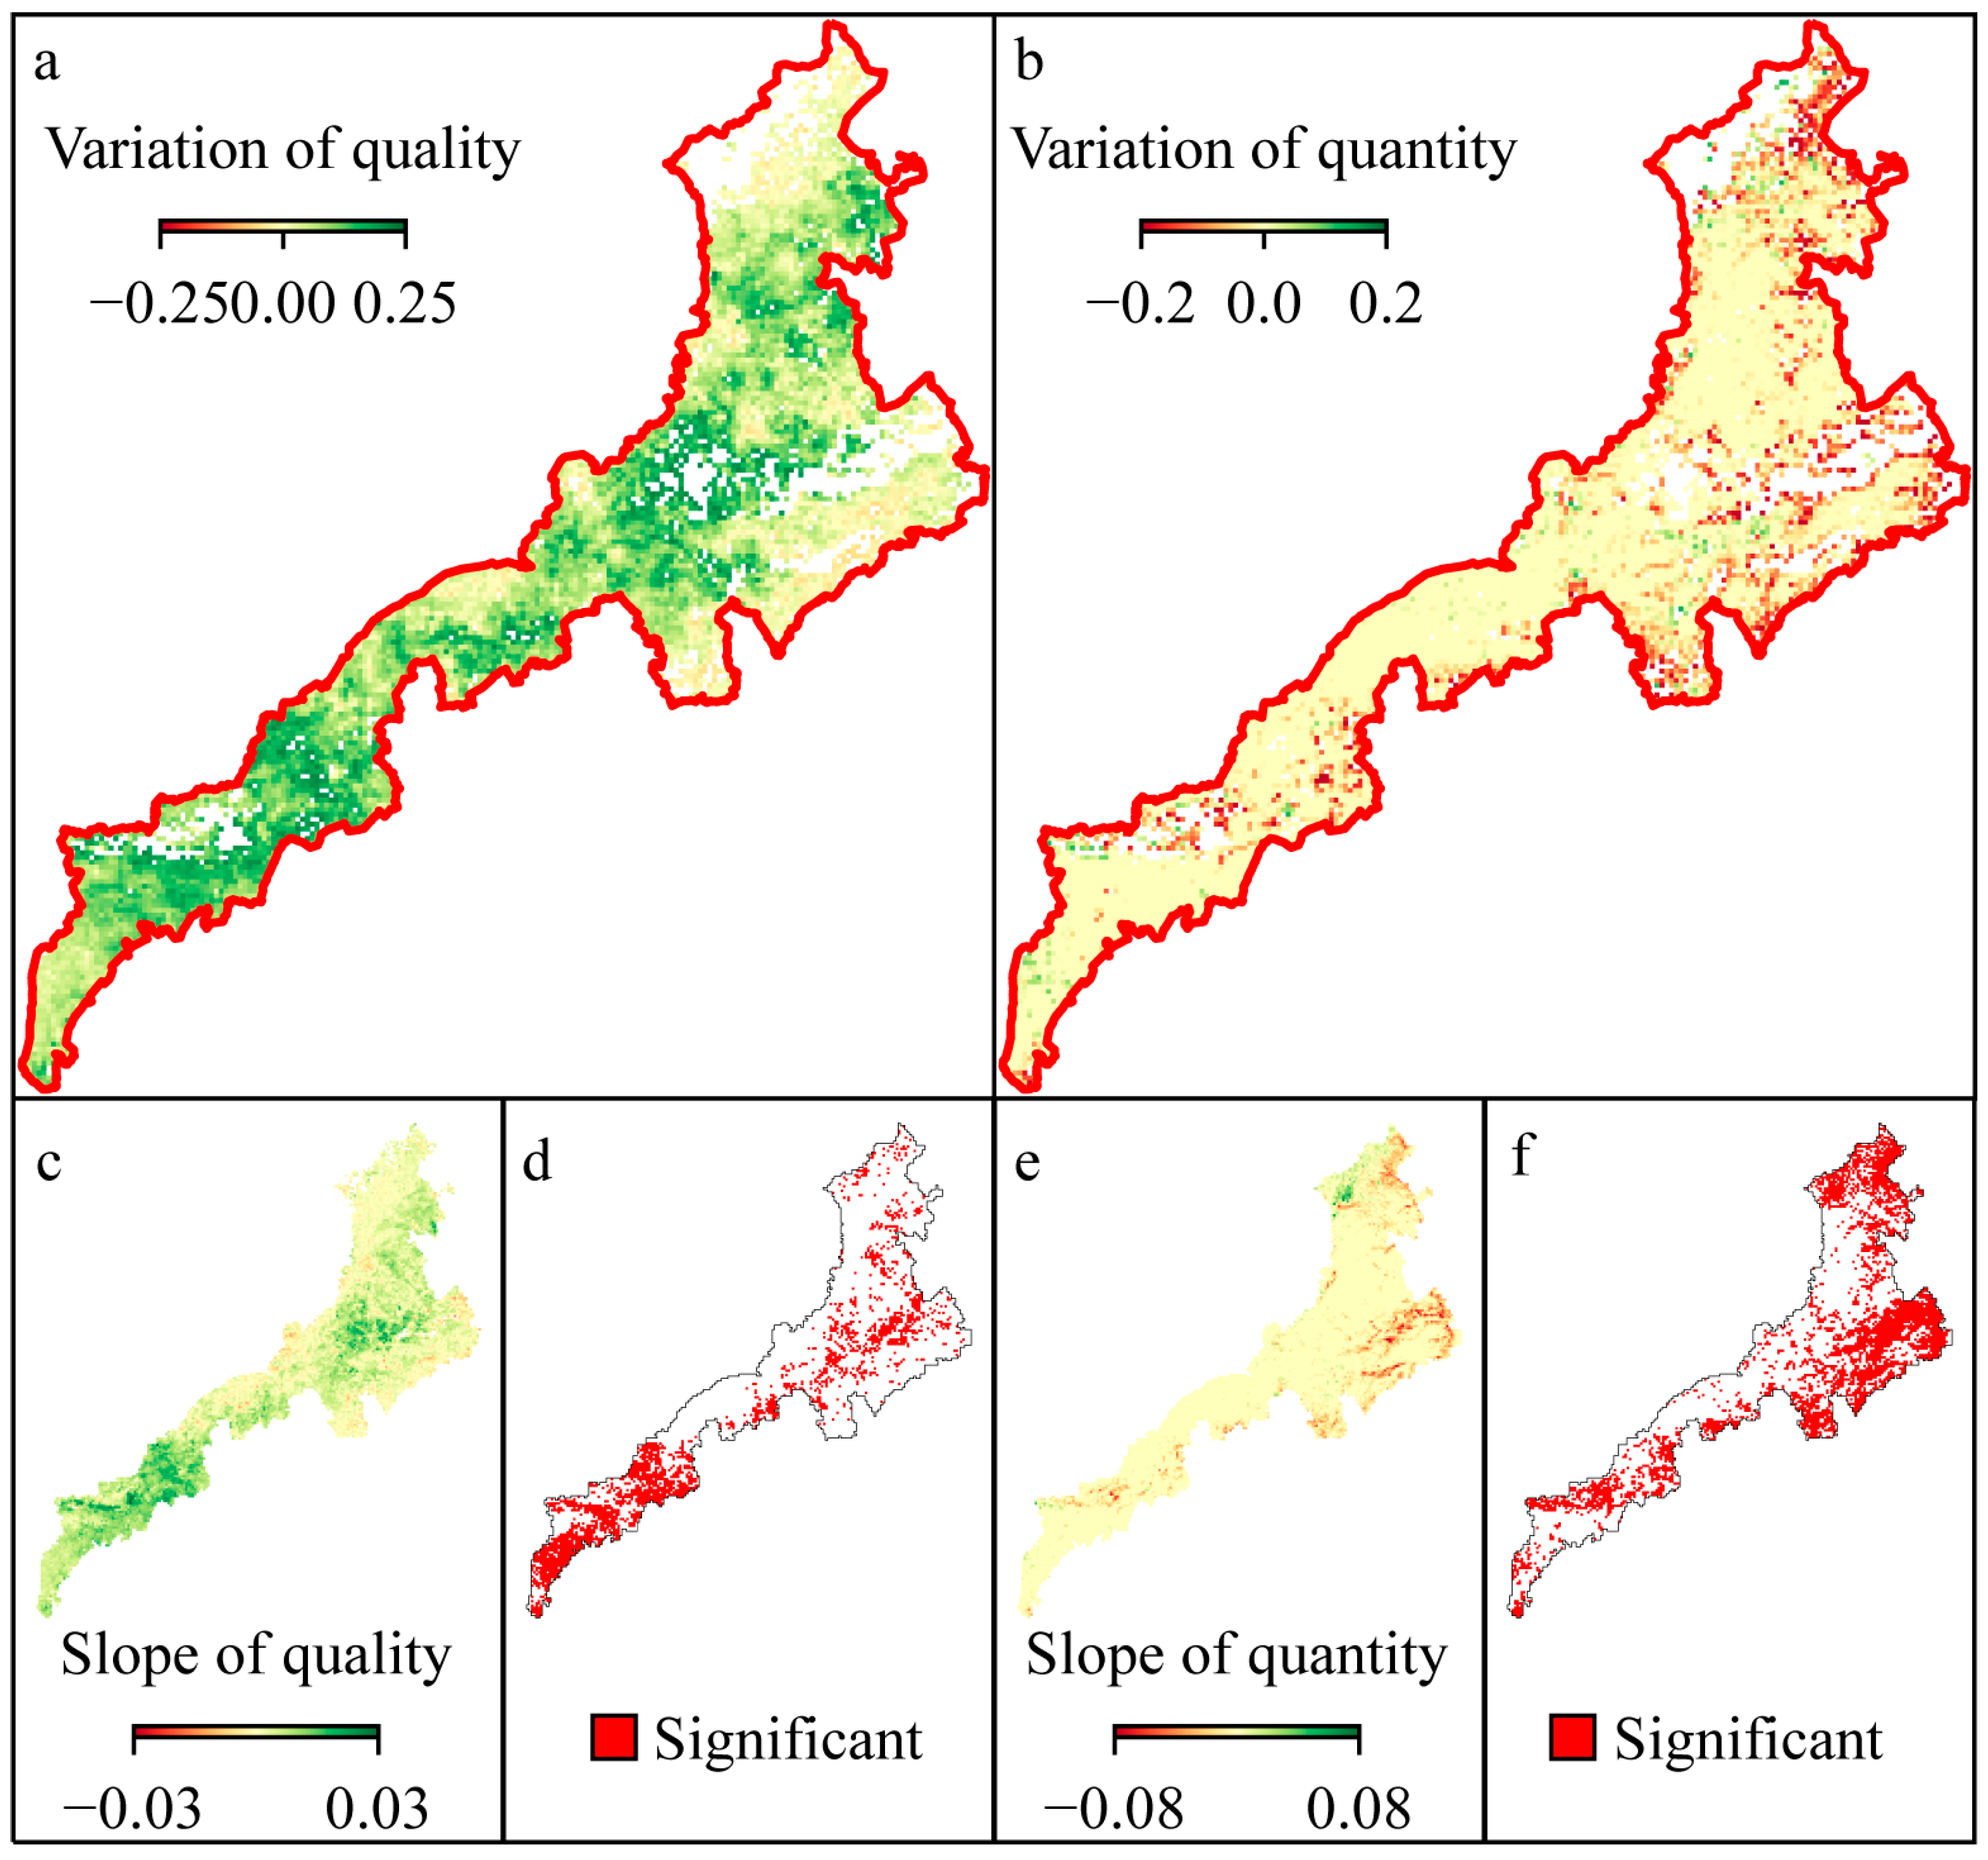
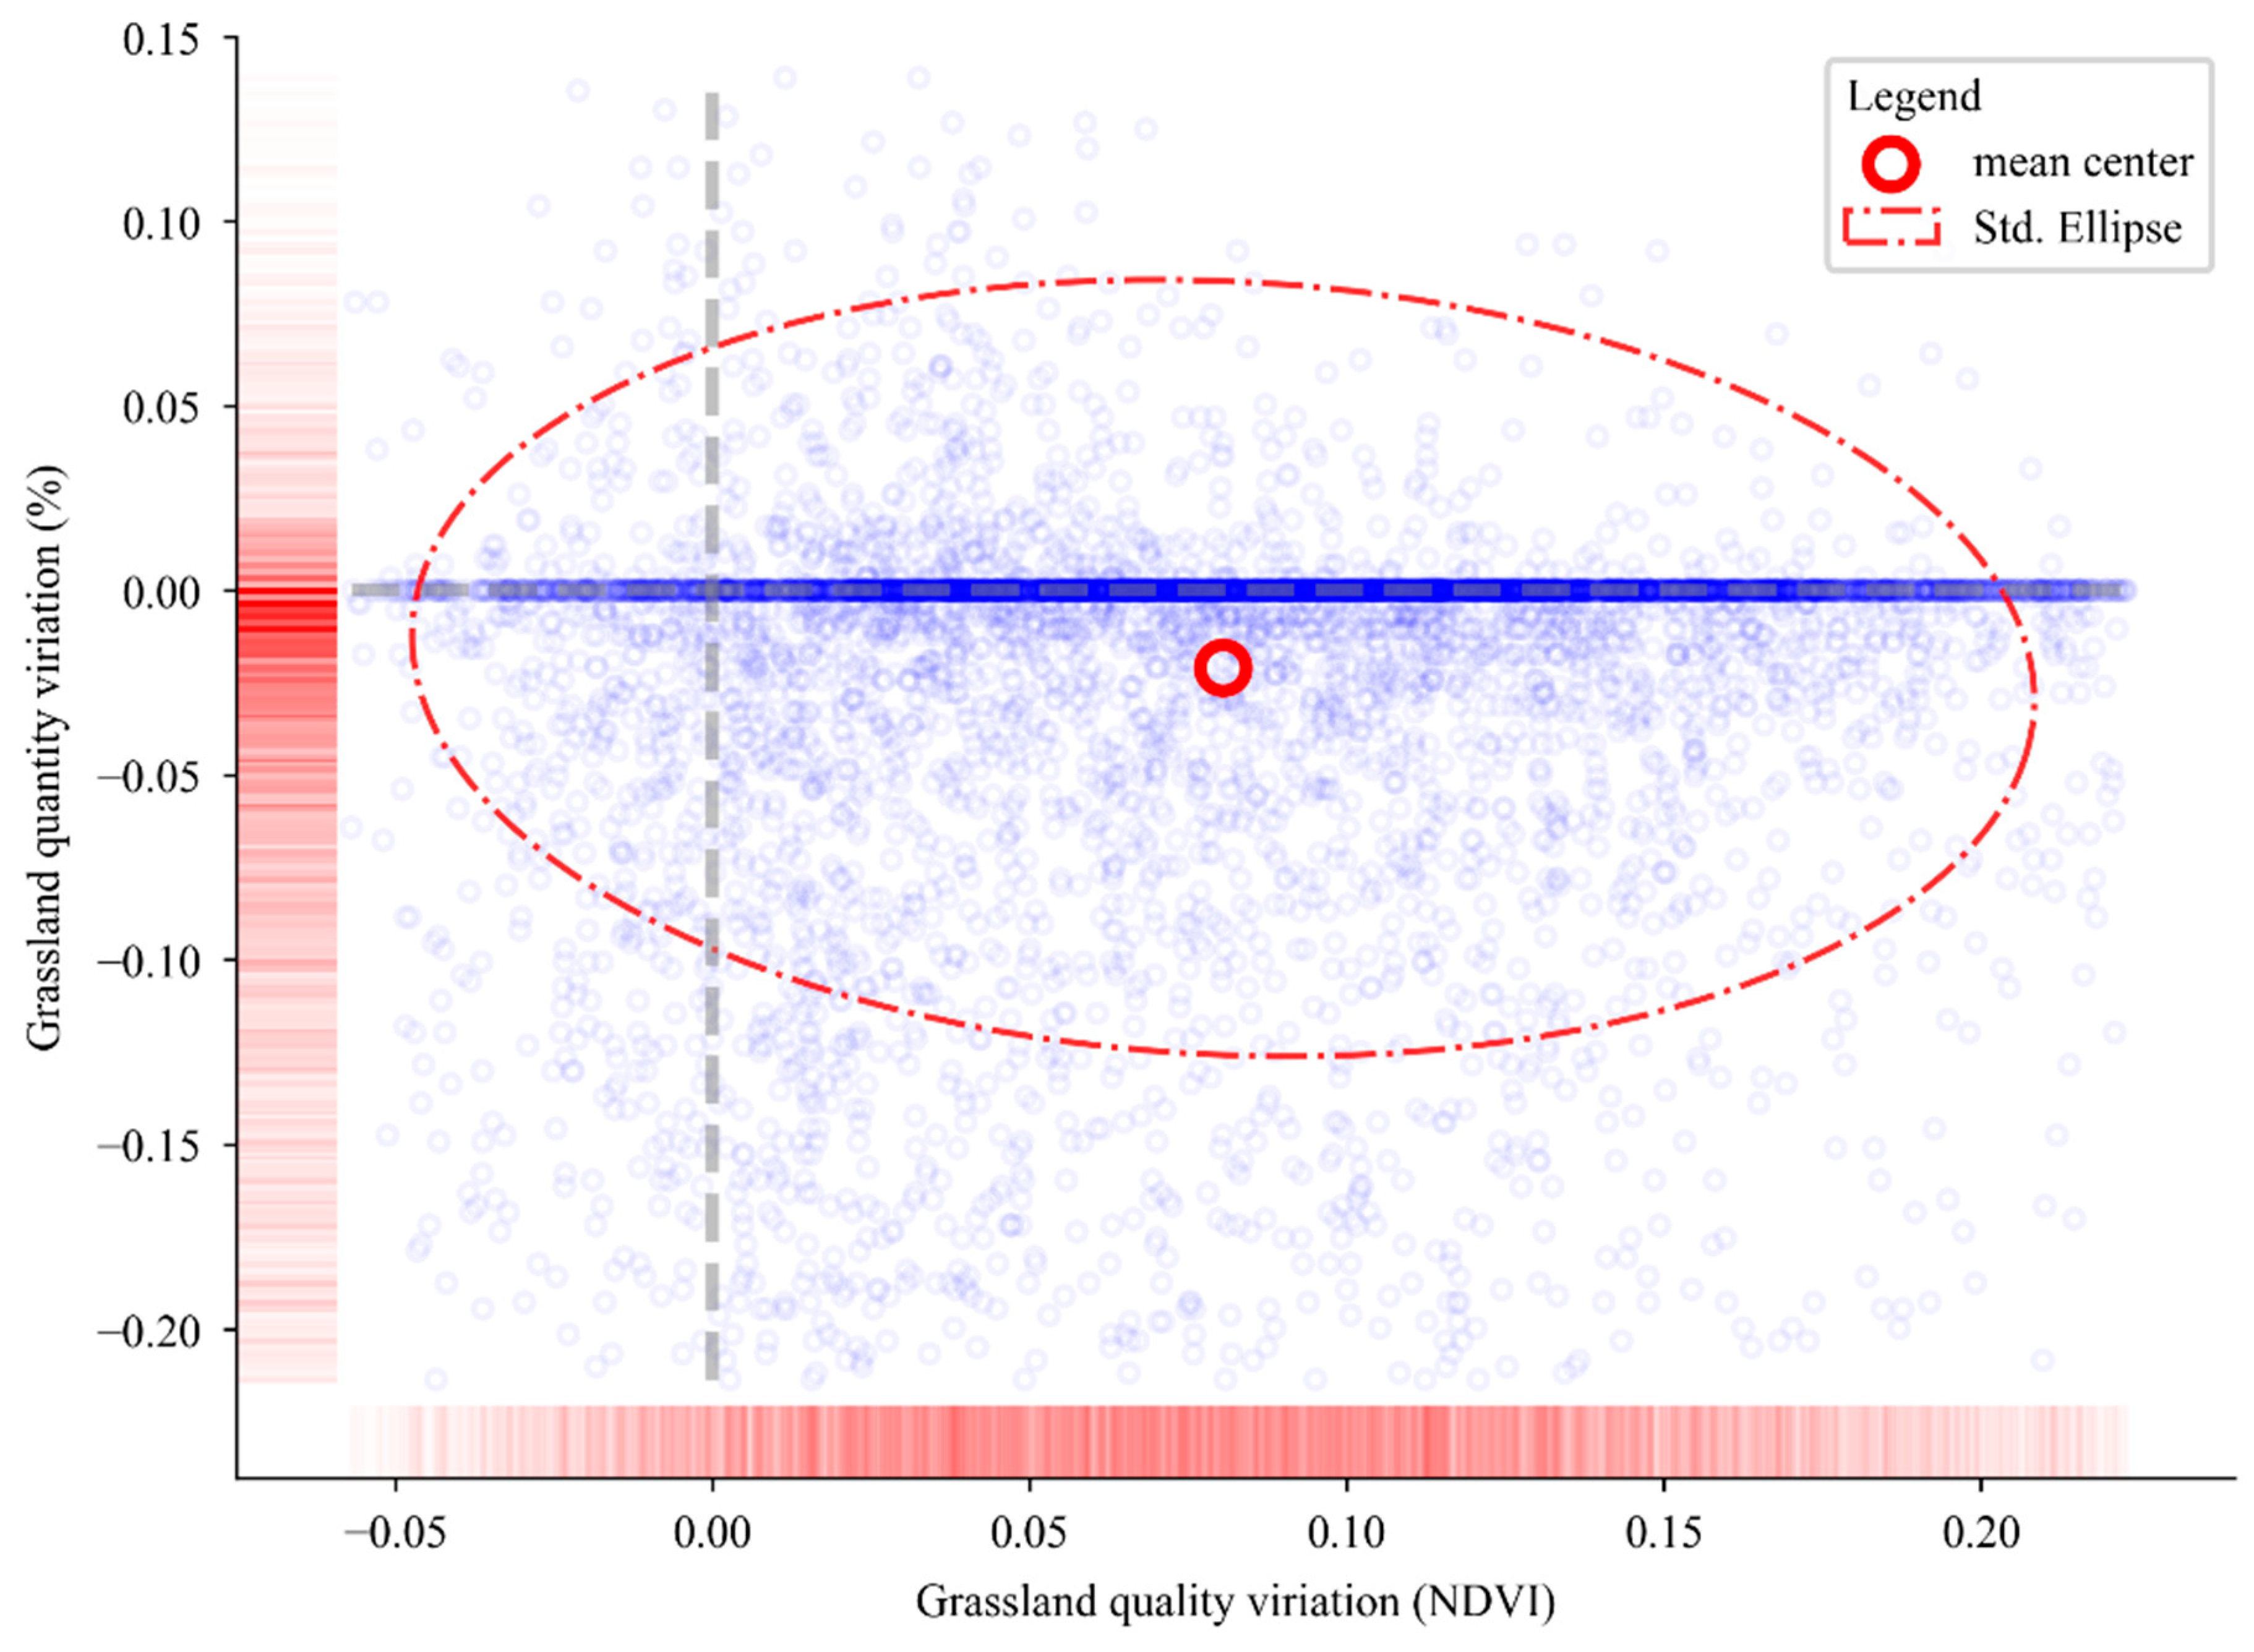
3.1. Variations of Grassland in APEI from 2010 to 2020

To assess the change processes of grassland, the distribution of quality and quantity variations was evaluated in APEI for 2010 and 2020. The distribution of the changes is illustrated in the maps (Figure 3) and statistical Table 3. From 2010 to 2020, the average NDVI of grids increased from 0.54 to 0.62 (Figure 3), and the proportion of grid cells with a decrease in quality and quantity accounted for 10.20% and 91.06%, respectively. The grid with the most significant improvement in NDVI increased by about 0.22, whereas the one with the most significant decline decreased by 0.06. The results from Theil–Sen slope detection and Mann–Kendall trend analysis are consistent with the current findings, indicating year-by-year changes. The grassland quality in the Southern region exhibits a significant improvement (Figure 3c,d), while the quantity in the Eastern region shows a slight decrease but no significant overall trend (Figure 3e,f). These results indicate that grassland quality has generally improved over the past decade. Figure 3 illustrates that the quality of grassland has improved in most regions, especially in the central and Southwestern parts of APEI. The areas in the Northern region were mostly stable, with insignificant changes in grassland quality. By contrast, the grid cells in which grassland quality decreased were mostly clustered in the southeast of Chifeng and Tongliao.
From 2010 to 2020, the proportion of grid cells with a decrease in quantity accounted for 8.94% and 91.06%, respectively. Although grassland with a declining quantity dominates the APEI, the total grassland area has decreased slightly. The average grassland shrinkage is 2.10% at grid level. In most areas, grassland quantity has not changed significantly. The grids where the grassland expansion was sporadically distributed were in the Northern part of APEI and the central part of Chifeng, with the highest growth rate reaching 13.89%. The distribution of the quantity decline area was similar to the quality decline areas, which clustered in the north of APEI and the southeast of Chifeng and Tongliao. The lowest grassland shrinkage rate was −21.35%.
Considering both the quantity and quality of grassland, Figure 4 shows that the grids with a slight decrease in quantity and a significant increase in quality dominated this study area. The variability of quality changes was large, while the quantity changes were mainly concentrated around 0. The four quadrants represent four different types of dynamic changes in grassland. Quadrant 1 had the highest proportion of samples (44.5%), indicating a positive change in both grassland quality and quantity. Quadrant 2 had the largest proportion of samples (53.6%), with an increase in grassland quantity but a decline in quality. Quadrant 3, with the smallest proportion of samples (1.2%), showed a decrease in both grassland quality and quantity, indicating severe degradation. Quadrant 4 accounted for 16.0% of samples, with a decrease in grassland quantity but an increase in quality.

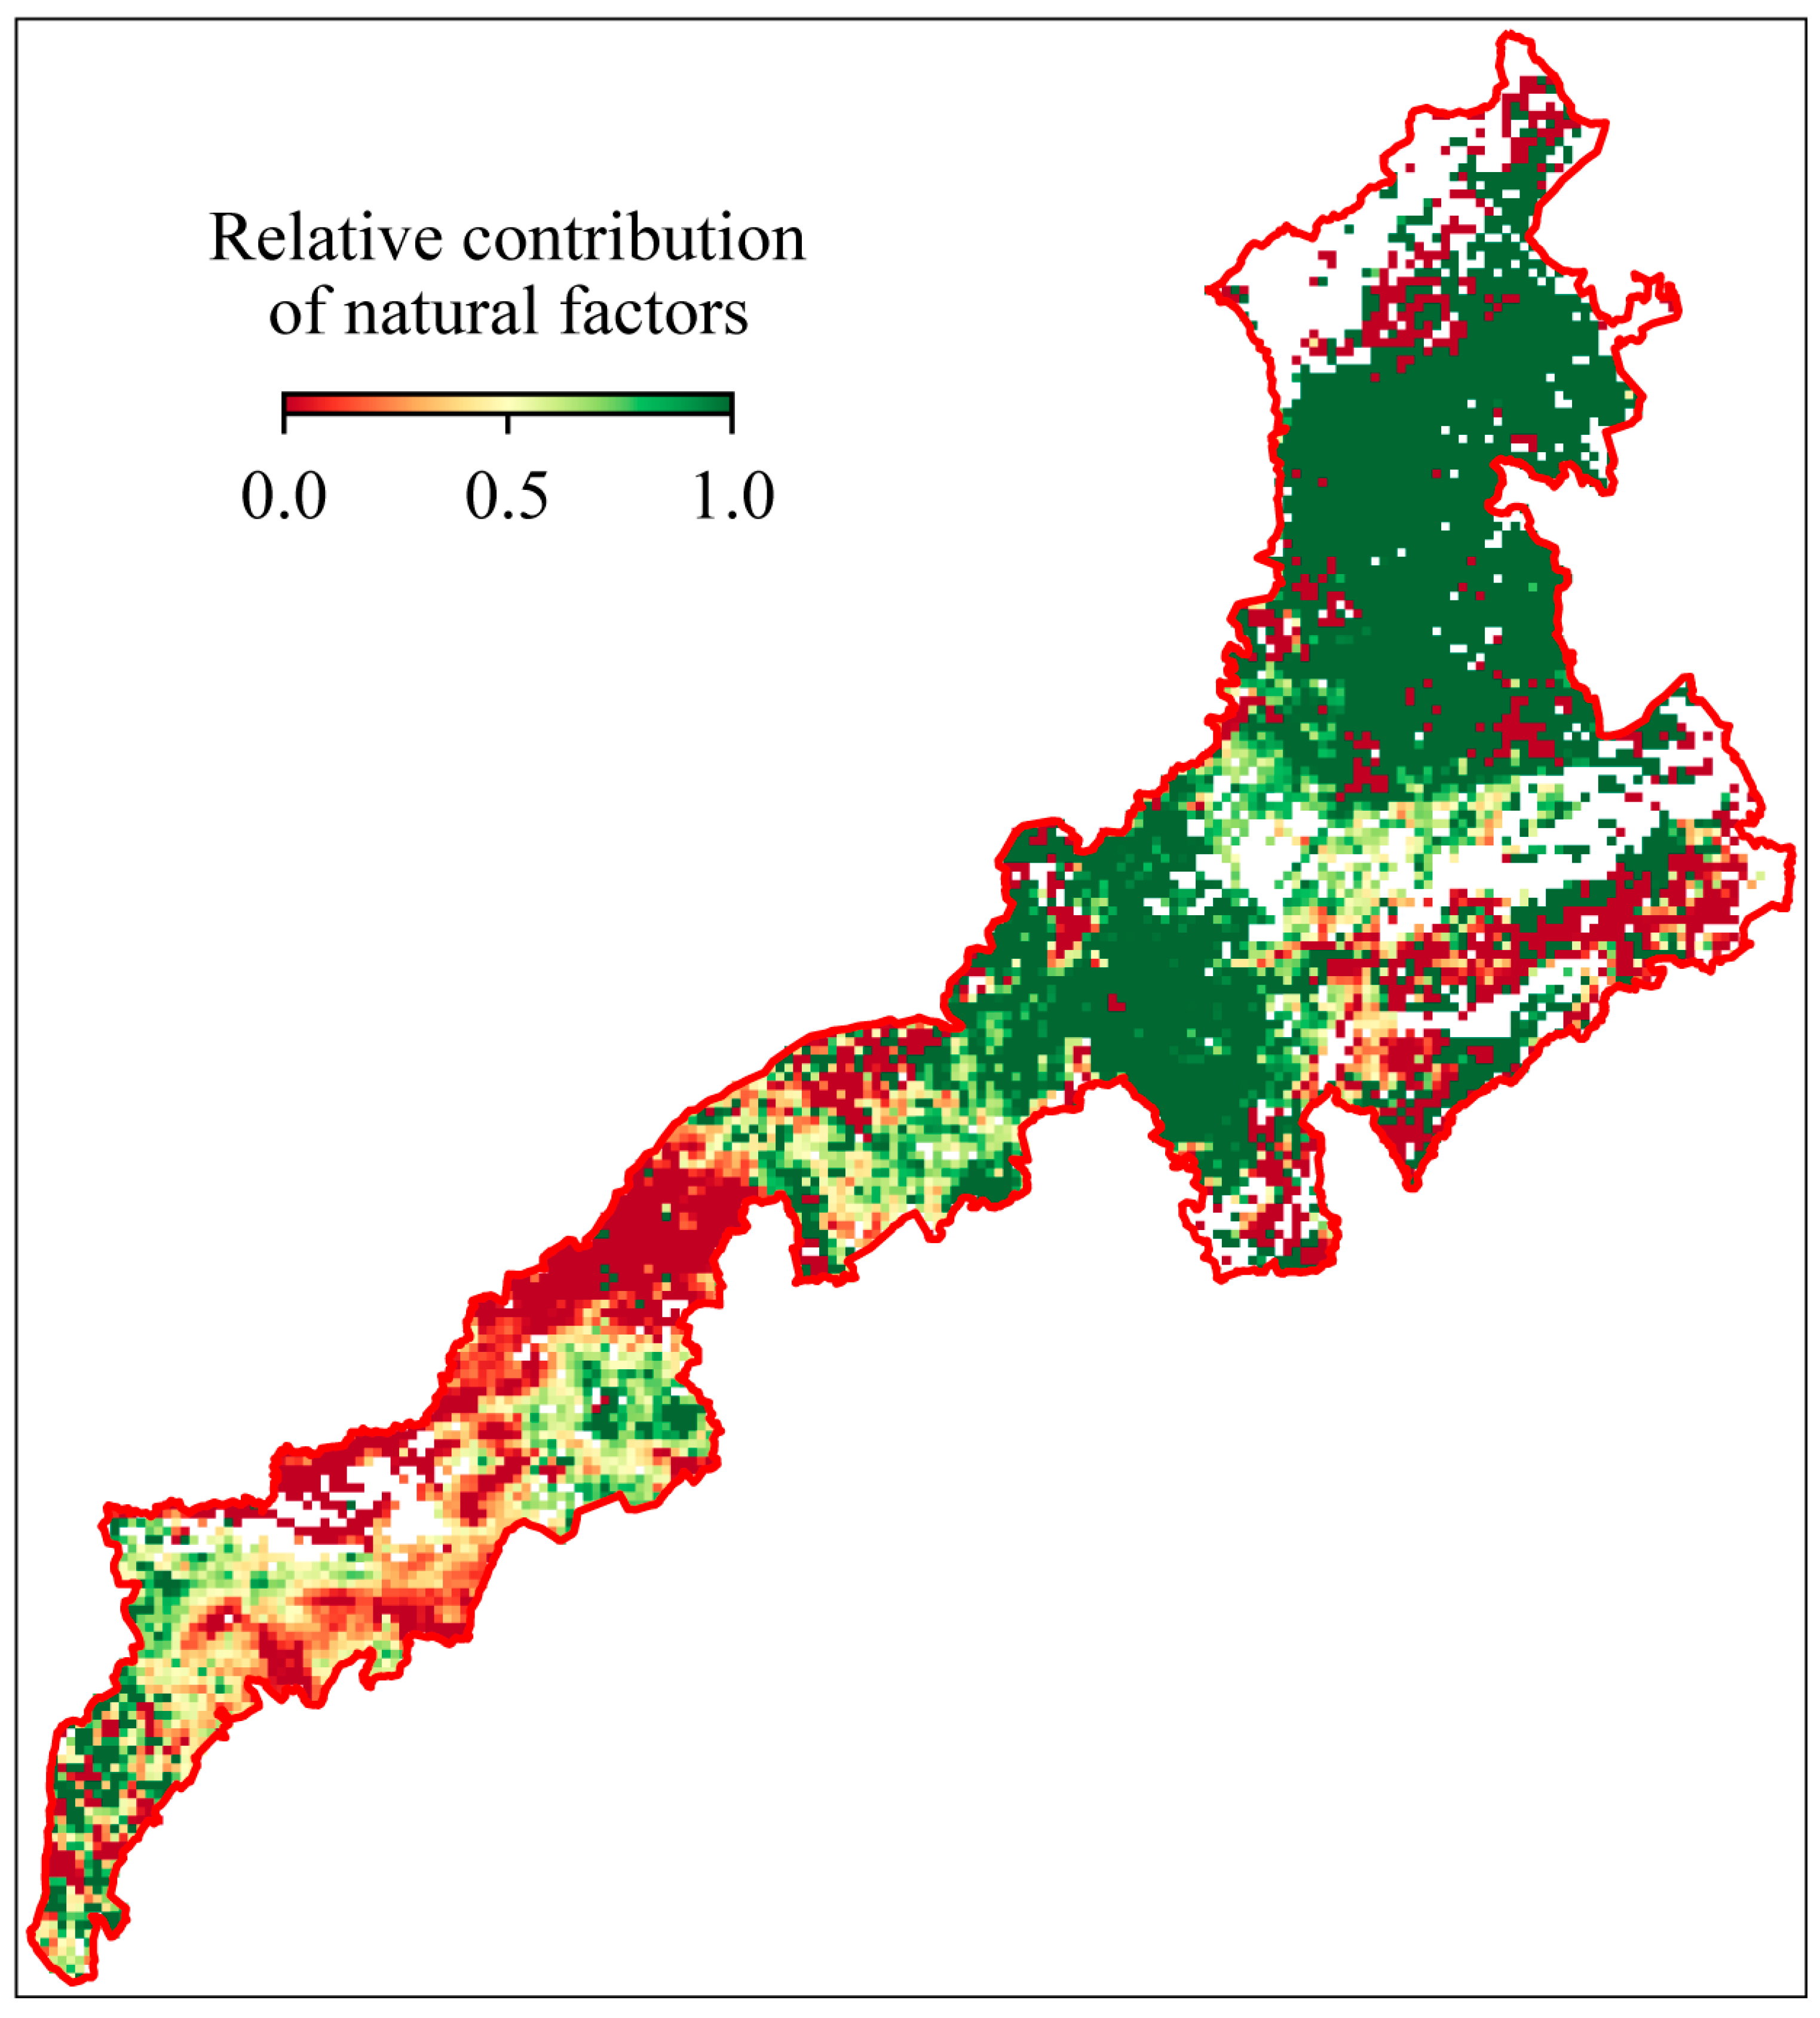
3.2. Classification and Characterization of Grassland Based on Driving Mechanisms

By examining the relationship between human and natural factors impact on grassland quality change during the past 10 years in APEI, the average relative role of natural factors variations was 37.48%, while human activities accounted for 62.52%. The impacts were calculated separately for different scenarios. Human activities accounted for 33.23%, and natural factor variations accounted for 66.77% in the areas with improved grassland quality. The contribution of anthropogenic factors demonstrated that the grassland quality improved, quality declined, quantity improved, and quantity declined were 33.23%, 74.96%, 42.28%, and 36.53%, respectively (Table 4).
Regarding the spatial distribution, the relative effects of natural factors change, and human activities exhibit regional variation. The Northeastern region is predominantly impacted by natural disturbances, while the Western region is comparatively more complex (Figure 5).
The grasslands of APEI were classified into five categories based on the relative contributions of anthropogenic and climatic factors. In terms of changes in grassland quality, Class B experienced the most substantial change, with an average change of 0.12. The quality trends for Class Nr and Class Ar were similar to those of Class B, while the changes in Class N and Class A were relatively moderate (Figure 6a). The differential analysis showed a statistically significant difference between any two grassland classes, except for Class Nr and Class B and Class Ar and Class B (Figure 6b). This outcome verifies the validity of the classification scheme.
The quality of the various grassland types displayed a significant variation. As depicted in Figure 7, Class N exhibited the highest grassland quality with an average NDVI of 0.64, followed by Class A with an average NDVI of 0.58. The grassland quality in Class Ar, Class B, and Class Nr was comparable. Between them, Class B did show the lowest average grassland quality with an average NDVI of 0.50, while the average NDVI in Class Ar and Nr was 0.51 and 0.53, respectively.
The five classifications also showed a significant difference in their spatial distribution. The SDE analysis further evaluated the distribution of five grassland classes. As illustrated in Figure 8, the gravity centers of Class N, Nr, B, Ar, and A were located at 119°37′ E, 44°24′ N; 116°24′ E, 42°28′ N; 114°25′ E, 41°32′ N; 113°54′ E, 41°16′ N; and 116°56′ E, 42°52′ N, respectively. In other words, Class N was primarily concentrated in the central and Eastern regions of APEI, while the other four classes were evenly distributed throughout the APEI region. The SDE of Class A was significantly larger than that of the other four classes, indicating that Class A was the most dispersed in the APEI region.

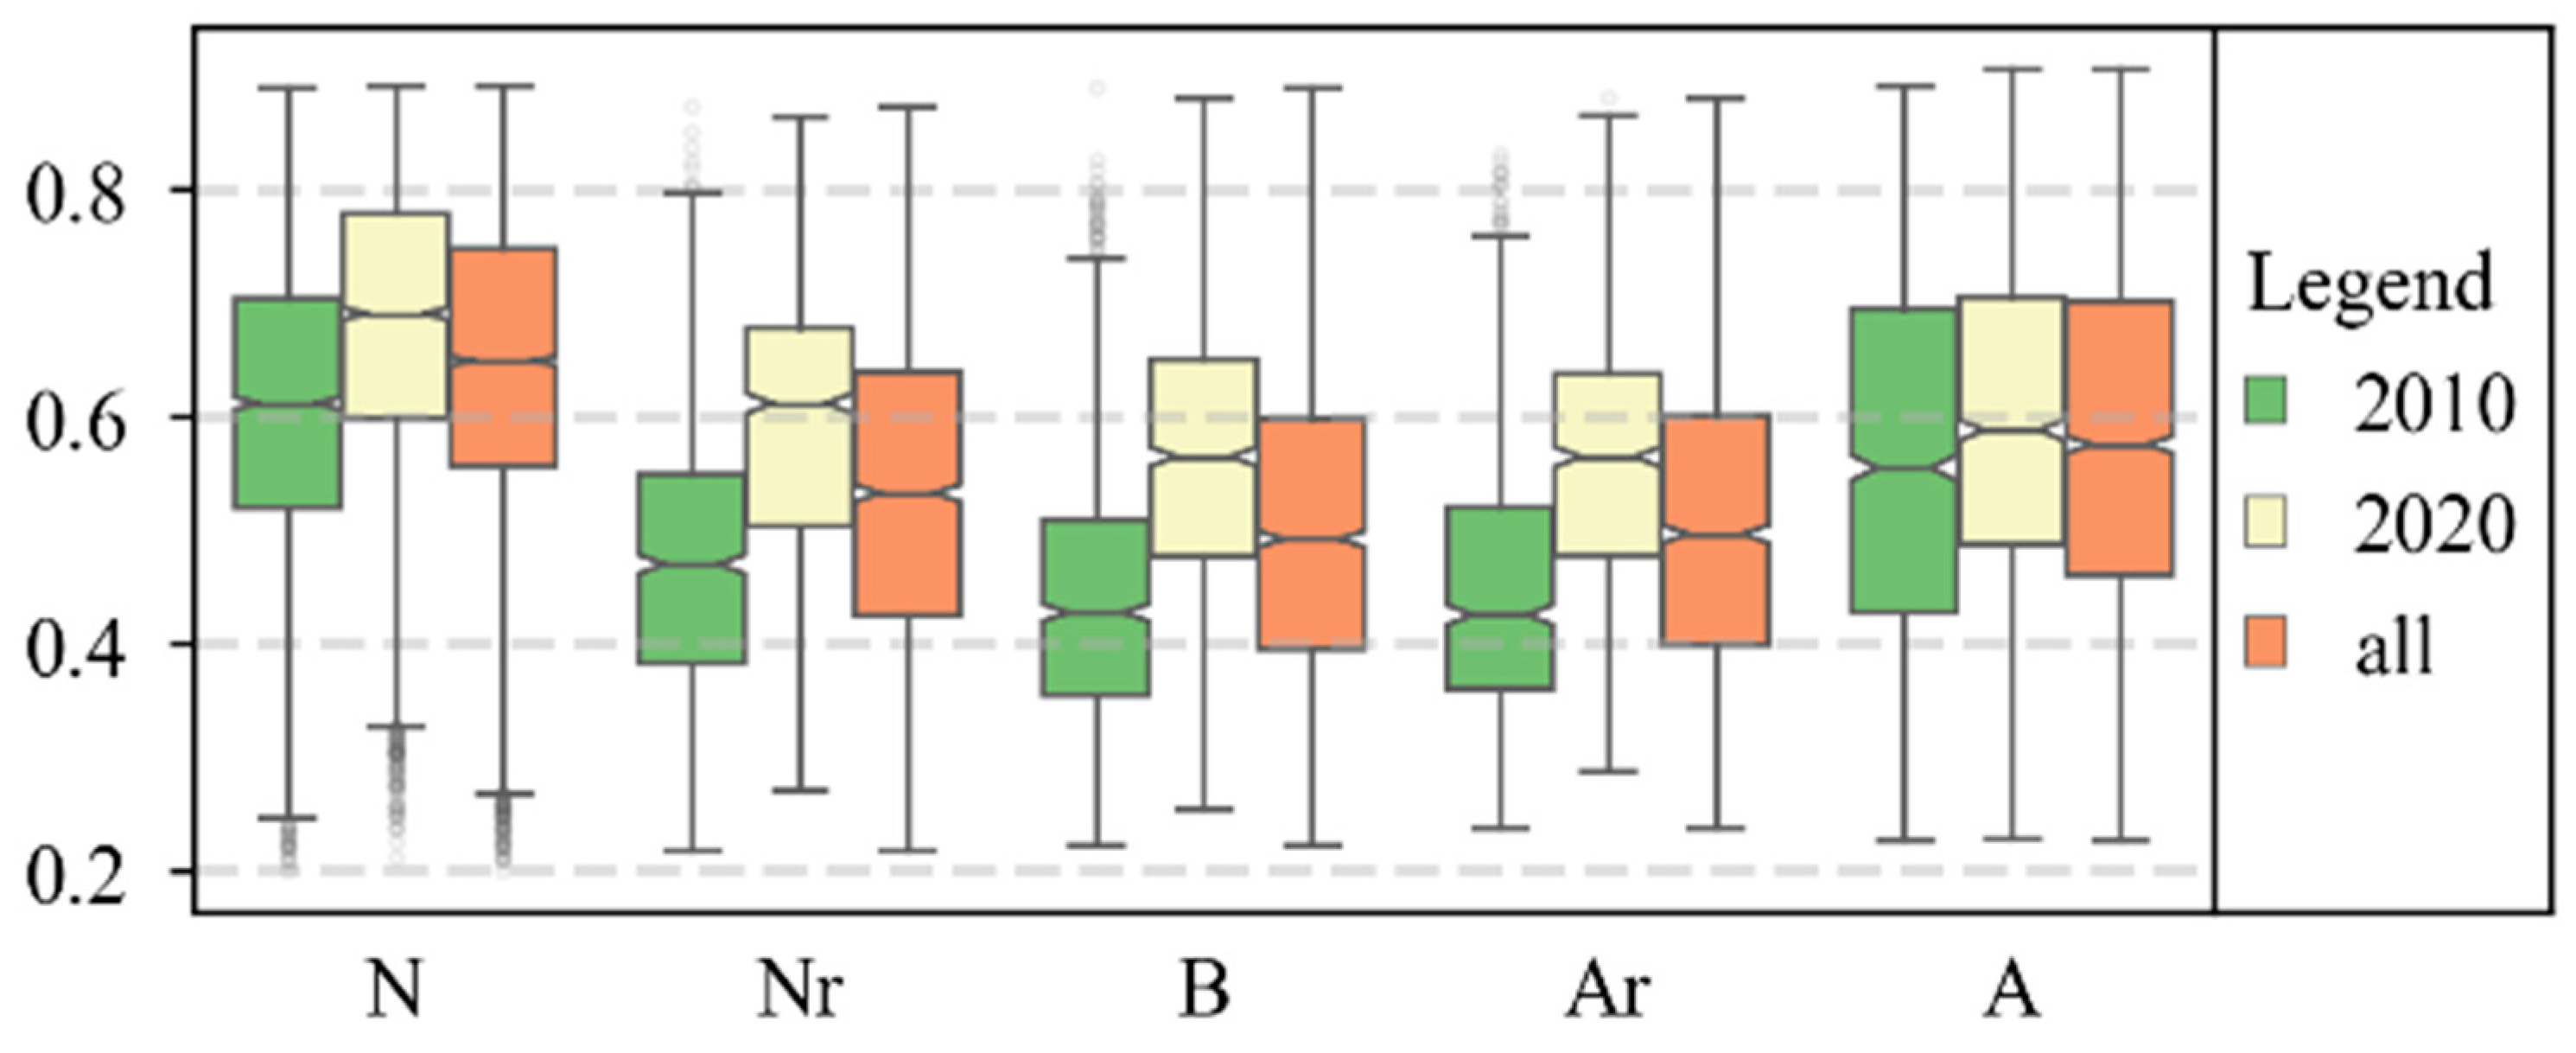
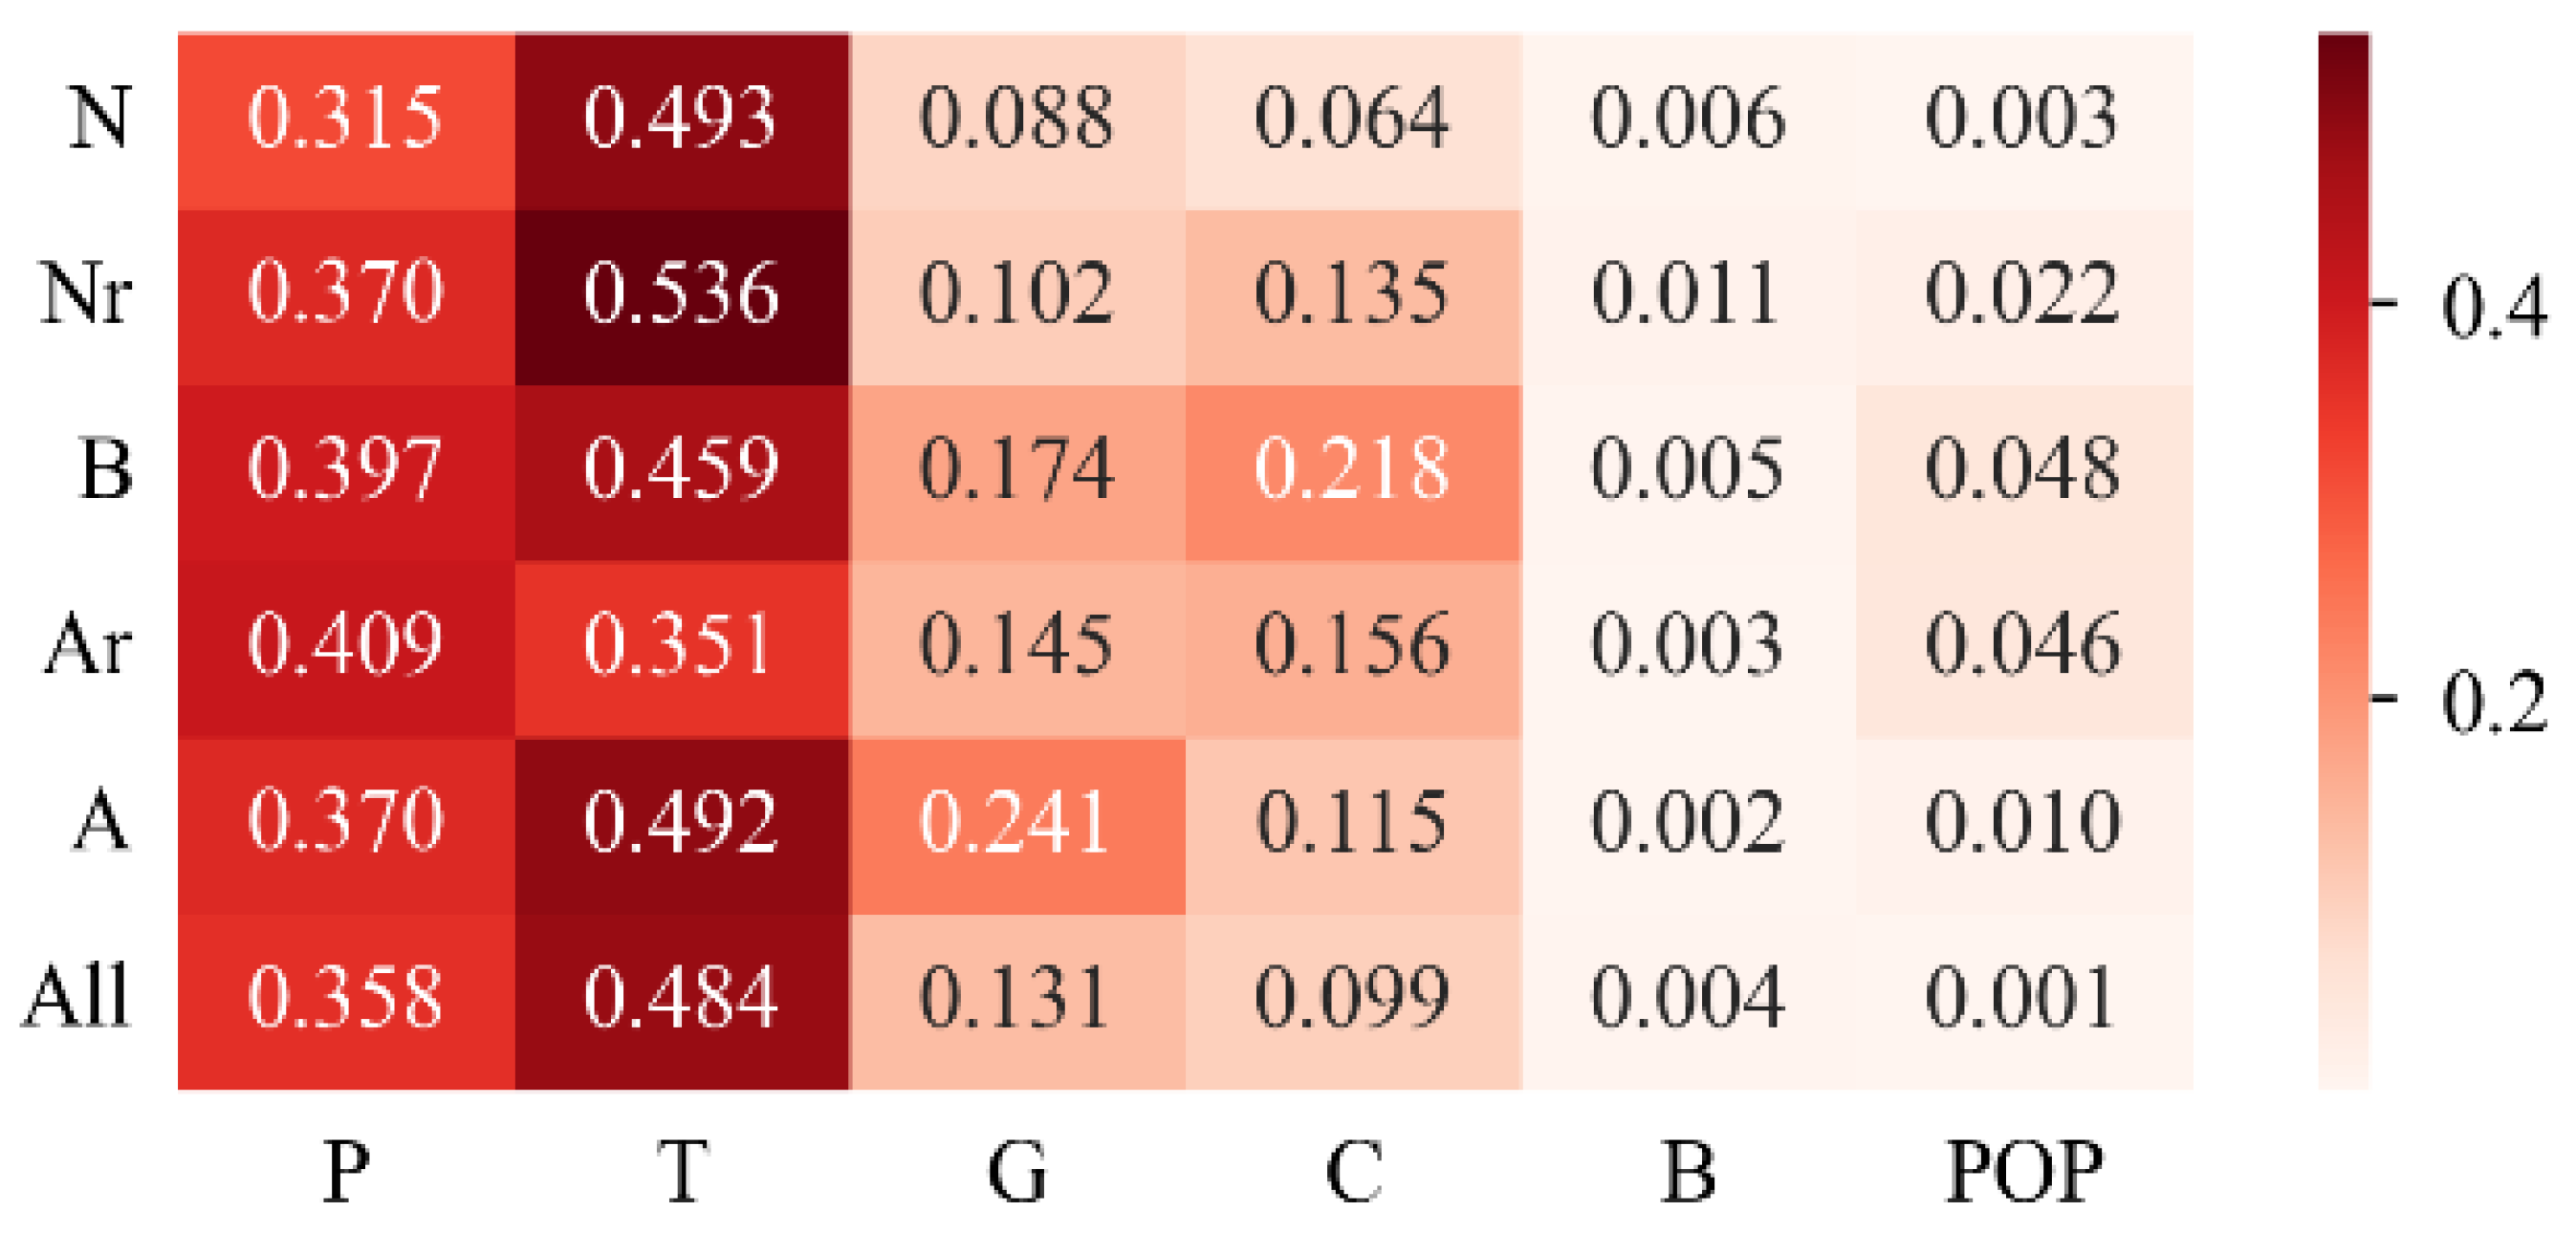
3.3. Analysis of the Influencing Factors of Grassland Quality

The findings of the GeoDetector demonstrate that temperature exhibited the most significant impact on grassland quality, with a q value of 0.484. Precipitation was the second most impactful factor, with a q value of 0.358 (Figure 9). The area of grassland and cropland also played a role in affecting grassland quality, with q values of 0.1 and 0.2, respectively, while the impact of built-up area and population was relatively weaker.
Different types of grasslands did include the varying driving factors associated with their quality. Temperature is the primary driving factor for the quality of all grassland types except for Class Ar, with precipitation being the second factor. For Class Ar grassland, the q value of temperature is slightly higher than that of precipitation. The area of grasslands is particularly important for Class A. In Classes B, Ar, and Nr, the impact of cropland area significantly increases, especially in Class B, where the q value reaches 0.218. The quality of all grassland types does not show a significant response to the built-up area.

4. Discussion

4.1. Spatial-Temporal Evolution Determination

Over the past decade, the grassland quality in APEI has improved while the quantity has decreased. This is consistent with the overall trend of vegetation quality improvement in the ecotone reported by previous studies [15,40]. However, this study specifically focuses on the detailed changes in grassland. Spatially, the restoration of grassland quality is more significant in the center of the APEI. The areas closer to pure agriculture or pure animal husbandry show a lower level of grassland restoration than the center area. The restoration of the grasslands in the Southern region is better than that in the Northern region. The improvement of grassland quality in the Northern region is not as strong as that in the Southern region. This may be due to the fact that the Northern region is located near the remaining mountains of the Greater Khingan Range, where the proportion of farmland is lower than that in the Southern region. And policy initiation, such as the Grain for Green program, which commenced in 1999 [59], resulted in a lower proportion of cropland-to-grassland conversion in the Northern region compared to the Southern region. The Northern region is also close to the forest area, where the investment in forest restoration is much higher than that in grassland restoration [22]. However, in the arid region, the restoration of vegetation in forests may have a negative impact on the restoration of grassland, as it competes with grassland for water resources [59,60]. Large-scale afforestation in arid areas may cause the death of planted trees due to severe water storage and extreme climate conditions, leading to even greater economic and ecological losses [61]. Additionally, the Southern region of the ecotone is a severely eroded area in the Yellow River Basin [62]. The vegetation was sparse and the grassland degradation was severe before targeted governance measures were implemented in recent years [63], resulting in a significant improvement in grassland quality. The Eastern region on the periphery of the ecotone is the Horqin Sandy Land of the Hulunbuir Plateau. Due to overgrazing and uncontrolled farming in the early stages, the land desertification problem is serious [64], leading to a sustained decrease in grassland quantity and quality. Furthermore, due to the continuous loss of grassland, some low-quality grassland has been converted to other land use types, which may lead to an overall improvement in grassland quality.

4.2. Anthropogenic and Climatic Attributes

In terms of human disturbances and natural factors changing impacts, APEI is more affected by natural factors, which is consistent with the findings of Xue et al. [12]. However, this result is opposite to that of Pei et al. [15], whose study focused on the entire vegetation of the Northern pastoral-farming transition zone. The possible reasons for the differences in the results are: (1) the difference in the time span of this study; (2) this study focused on the grassland in the agro-pastoral ecotone of Inner Mongolia; and (3) the previous restoration work in Inner Mongolia may have already been well-controlled, and the artificial restoration has played a significant role in the early stages. As a result, natural factors have played a dominant role in this stage.
The conditions in different regions within APEI are also variable. The grassland quality in the Northern region of APEI is less affected by human disturbance, while the Southern region is more significantly impacted by human activity. The Northern region is dominated by meadow steppe, and the Eastern region is a typical steppe, with grassland dominated by herbaceous plants [65]. The vegetation in typical steppes is relatively tough, with strong adaptability to drought and temperature, and the grasslands in the Northern region respond more strongly to natural factors and are less affected by human activity. Additionally, as mentioned earlier, the proportion of farmland in the Northern region is relatively small. The effectiveness of ecological restoration measures, such as high-standard farmland construction, has been lower in the Northern region than in the Southern region. Moreover, the southern region is located near the Loess Plateau, where agriculture is relatively developed, and the impact of precipitation changes in this region may be partially offset by environmental and agricultural factors. Therefore, in recent years, the changes in the Northern region have mainly been influenced by natural factors, with little impact from human activity, while the opposite is true for the Southern region.
Based on the contributions of human and natural factors and disturbances, grassland types with different qualities and changing conditions have been identified. The areas in class B disturbances illustrate the lowest grassland quality. Grasslands in class N indicate the highest quality, followed by those in class A. The magnitude of change in these two types of grasslands is significantly smaller than that of other grasslands, and the improvement is the least pronounced. Additionally, we examined the relationship between grassland quality and temperature/precipitation for different grassland types in a single year. We found that in class N, the correlation between grassland quality and temperature/precipitation was significantly stronger compared to class A. Furthermore, this correlation was notably stronger in 2020 compared to 2010 (Figure A1). Conversely, for class A, there was no significant difference in the correlation between grassland quality and temperature/precipitation between 2010 and 2020, validating the previous research findings (Figure 7) that there was no significant improvement in grassland quality in the region over the 10-year period. Although we observed a significant improvement in grassland quality for class B over the long-term trend, we did not observe any significant relationship between grassland quality and temperature/precipitation in both 2010 and 2020. This indicates that the performance of grassland quality in this study area may differ between long-term observations and single-year assessments. Therefore, relying solely on observations and studies conducted in a single year has limited effectiveness in evaluating the efficacy of grassland ecological restoration practices and determining influencing factors. There are two reasons for this: (1) The reality of global warming is indisputable, and a warming climate is a significant factor that rapidly transforms terrestrial vegetation on a global scale [66]; and (2) In the past decade, as China’s ecological restoration strategy was implemented, the positive effects of human disturbance on vegetation restoration have been widely confirmed [22,44]. In the past ten years, with a warming climate and without human disturbance, grassland quality may have improved to some extent. At the same time, the ecological restoration policy was implemented in the grassland regions, which did have a positive effect on improving grassland quality. The regions where both factors are at work demonstrated the most significant improvement.

4.3. Grassland Quality Change Drivers

The grassland quality in APEI is affected by various factors, including temperature, precipitation, population, agriculture, and policies. The mechanisms of quality change in different types of grasslands vary. The grasslands in this region are overall affected by natural factors, with temperature being the most important driving factor, which is consistent with the conclusions of Liu et al. [40]. In areas where the effects of human and natural factors and disturbances are balanced, the impact of farmland and population on grassland quality is strengthened. This suggests that in future ecological protection and restoration work, human cultivation should be given greater attention. In areas where natural factors dominate, it is necessary to strengthen ecological protection and restoration policies to improve grassland quality. In the areas where human disturbance dominates, while retaining policies implemented in recent years, more attention could be given to improving the quality of poorly performing areas to achieve an overall improvement. The impact of human activities on ecosystems cannot be ignored, especially during the implementation of long-term, large-scale agricultural policies or ecological restoration projects. Our research findings indicate that there has been minimal change in class A, but significant improvements in grassland quality have been observed in classes B and Nr over the years. This could be attributed to the long-term implementation of ecological restoration strategies by local governments in the agro-pastoral transition areas. Since 1999, the government has implemented various policies aimed at returning grazing land to grassland, establishing grazing prohibitions and grass balance zones, and encouraging seasonal grazing and rotational grazing to improve grassland quality and promote grassland ecological restoration [44]. Since 2014, the Chinese government has continued its large-scale ecological restoration strategy by implementing a range of interventions, including vegetation restoration, industrial pollution control, and the construction of high-standard farmland. These interventions have been supported by increased financial resources. At the municipal and county levels, governments have actively carried out relevant restoration projects. For example, the landscape greening enhancement project in the Nanshan district, Chifeng, implemented since 2016 with a total investment of CNY 705 million, has significantly increased the per capita vegetation area in the local area. However, grassland restoration has not yet received sufficient attention [22]. In future restoration work, periodic evaluations should be conducted to quantify the efficiency of human disturbance. The ecological restoration strategies should be adjusted continuously to adapt to climate change.
Quantitative identification of the main driving factors of grassland change is essential for promoting grassland ecological restoration projects in China’s ecotones. The findings of this study may provide local governments with valuable information on the changes in grassland quality and the underlying drivers within their jurisdictions, which is crucial for effective land-use decisions. With this information, local authorities may prioritize and allocate resources more effectively for ecological protection and restoration projects. Moreover, the identification of the main driving factors of grassland change may facilitate a more comprehensive understanding of the complex interactions between natural and anthropogenic factors, which is important for developing more targeted and effective ecological protection and restoration measures. By understanding the mechanisms of ecological and environmental change, governments and other stakeholders can make informed decisions that balance the needs of economic development with the conservation of natural resources. Ultimately, the knowledge gained from this study should help promote sustainable development and long-term ecological health in the ecotone regions.

4.4. Limitations and Uncertainties

This study is based on remote sensing data, which may have biases compared to actual survey data. The evaluated driving mechanisms will also be affected by this. Therefore, future work can combine on-site measurements to further refine and improve the data from this study. Additionally, the current study focuses on quantifying the relative contributions of human and climatic impacts on grassland changes. The initial idea is based on the assumption that two natural factors affect grassland quality in a linear relationship. However, in reality, grassland quality is also influenced by other natural factors, and change may impact grassland quality in a nonlinear manner. Therefore, in future research, a more complex evaluation framework can be considered to systematically evaluate the impact factors of grassland quality from a macro perspective.

5. Conclusions

Understanding the evolution trends and mechanisms of grassland in ecologically vulnerable areas is fundamental for implementing grassland management in the agro-pastoral ecotone. By conducting differentiated management in different regions, the effectiveness of rehabilitation work can be improved and costs can be reduced. This paper focuses on the determination of the anthropogenic and climatic factors influencing the grassland change under the background of ecological restoration and natural factors changing in the agro-pastoral ecotone of Inner Mongolia. Our results showed that, between 2010 and 2020, the grassland quantity in APEI did not significantly decline while the quality improved significantly. The main cause of grassland quality changes is natural, but the driving mechanisms differ in different regions. The grassland types classified according to quality driving mechanisms showed significant differences. The analysis of the influencing factors revealed that the forces at work varied across different regions. In some areas, attention should be paid to the impacts of farmland and the human population. To cope with the complex natural factors of change and urban development, we recommend that future grassland restoration efforts evaluate the long-term grassland changes and their driving mechanisms in order to maximize the investment benefits of restoration. Our methodology can also be applied to long-term monitoring and mechanism research of specific ecological elements in other regions, which has guided the formulation of appropriate protection and restoration policies.

Author Contributions

Conceptualization, F.L. and Y.P.; methodology, F.L. and L.Y.; software, F.L.; data curation, X.W.; writing—original draft preparation, F.L.; writing—review and editing, Y.P.; visualization, F.L.; supervision, Y.P. and Z.Y. All authors have read and agreed to the published version of the manuscript.

Funding

This research was funded by the Inner Mongolia Land Consolidation and Ecological Restoration Project.

Data Availability Statement

The data generated and analyzed during the current study are available from the corresponding author on reasonable request.

Conflicts of Interest

The authors declare no conflict of interest.

Appendix A

Figure A1. The relationship between grassland quality and natural factors for different grassland types: the blue dots represent the results from 2010, while the red dots represent the results from 2020. The Pearson correlation coefficient (r) is indicated in the figure, and all p-values from the correlation tests are less than 0.001. Each column corresponds to different grassland types, namely N, Nr, B, Ar, and A, which are consistent with the labeling used in Figure 6.
Land 12 02009 g0a1

References

  1. Foley, J.A.; DeFries, R.; Asner, G.P.; Barford, C.; Bonan, G.; Carpenter, S.R.; Chapin, F.S.; Coe, M.T.; Daily, G.C.; Gibbs, H.K.; et al. Global Consequences of Land Use. Science 2005, 309, 570–574. [Google Scholar] [CrossRef] [PubMed]
  2. Pielke, R.A. Land Use and Climate Change. Science 2005, 310, 1625–1626. [Google Scholar] [CrossRef] [PubMed]
  3. Lambin, E.F.; Meyfroidt, P. Global Land Use Change, Economic Globalization, and the Looming Land Scarcity. Proc. Natl. Acad. Sci. USA 2011, 108, 3465–3472. [Google Scholar] [CrossRef]
  4. Zhao, S. Economic geographical survey in one of farming-grazing transitional zones-North Cha, Cha League and Xi League. Acta Geogr. Sin. 1953, 19, 43–60. [Google Scholar]
  5. Li, Z.; Li, L.; Wang, Y.; Man, W.; Liu, W.; Nie, Q. Spatial Change of the Farming–Pastoral Ecotone in Northern China from 1985 to 2021. Land 2022, 11, 2179. [Google Scholar] [CrossRef]
  6. Shi, W.; Liu, Y.; Shi, X. Development of Quantitative Methods for Detecting Climate Contributions to Boundary Shifts in Farming-Pastoral Ecotone of Northern China. J. Geogr. Sci. 2017, 27, 1059–1071. [Google Scholar] [CrossRef]
  7. Cao, Q.; Yu, D.; Georgescu, M.; Han, Z.; Wu, J. Impacts of Land Use and Land Cover Change on Regional Climate: A Case Study in the Agro-Pastoral Transitional Zone of China. Environ. Res. Lett. 2015, 10, 124025. [Google Scholar] [CrossRef]
  8. Liu, D.; Chen, J.; Ouyang, Z. Responses of Landscape Structure to the Ecological Restoration Programs in the Farming-Pastoral Ecotone of Northern China. Sci. Total Environ. 2020, 710, 136311. [Google Scholar] [CrossRef] [PubMed]
  9. Wuyun, D.; Sun, L.; Chen, Z.; Hou, A.; Crusiol, L.G.T.; Yu, L.; Chen, R.; Sun, Z. The Spatiotemporal Change of Cropland and Its Impact on Vegetation Dynamics in the Farming-Pastoral Ecotone of Northern China. Sci. Total Environ. 2021, 805, 150286. [Google Scholar] [CrossRef] [PubMed]
  10. Xiao, Y.; Huang, M.; Xie, G.; Zhen, L. Evaluating the Impacts of Land Use Change on Ecosystem Service Values under Multiple Scenarios in the Hunshandake Region of China. Sci. Total Environ. 2022, 850, 158067. [Google Scholar] [CrossRef]
  11. Yang, Y.; Wang, K.; Liu, D.; Zhao, X.; Fan, J. Effects of Land-Use Conversions on the Ecosystem Services in the Agro-Pastoral Ecotone of Northern China. J. Clean. Prod. 2020, 249, 119360. [Google Scholar] [CrossRef]
  12. Xue, Y.; Zhang, B.; He, C.; Shao, R. Detecting Vegetation Variations and Main Drivers over the Agropastoral Ecotone of Northern China through the Ensemble Empirical Mode Decomposition Method. Remote Sens. 2019, 11, 1860. [Google Scholar] [CrossRef]
  13. Jiang, H.; Xu, X. Impact of Extreme Climates on Vegetation from Multiple Scales and Perspectives in the Agro-Pastural Transitional Zone of Northern China in the Past Three Decades. J. Clean. Prod. 2022, 372, 133459. [Google Scholar] [CrossRef]
  14. Liu, J.; Gao, J.; Lv, S.-H.; Han, Y.; Nie, Y. Shifting Farming–Pastoral Ecotone in China under Climate and Land Use Changes. J. Arid Environ. 2011, 75, 298–308. [Google Scholar] [CrossRef]
  15. Pei, H.; Liu, M.; Jia, Y.; Zhang, H.; Li, Y.; Xiao, Y. The Trend of Vegetation Greening and Its Drivers in the Agro-Pastoral Ecotone of Northern China, 2000–2020. Ecol. Indic. 2021, 129, 108004. [Google Scholar] [CrossRef]
  16. Hao, R.; Yu, D.; Wu, J. Relationship between Paired Ecosystem Services in the Grassland and Agro-Pastoral Transitional Zone of China Using the Constraint Line Method. Agric. Ecosyst. Environ. 2017, 240, 171–181. [Google Scholar] [CrossRef]
  17. Wu, R.; Tang, H.; Lu, Y. Exploring Subjective Well-Being and Ecosystem Services Perception in the Agro-Pastoral Ecotone of Northern China. J. Environ. Manag. 2022, 318, 115591. [Google Scholar] [CrossRef]
  18. Wu, J.; Zhang, Q.; Li, A.; Liang, C. Historical Landscape Dynamics of Inner Mongolia: Patterns, Drivers, and Impacts. Landsc. Ecol. 2015, 30, 1579–1598. [Google Scholar] [CrossRef]
  19. Zhang, M.A.; Borjigin, E.; Zhang, H. Mongolian Nomadic Culture and Ecological Culture: On the Ecological Reconstruction in the Agro-Pastoral Mosaic Zone in Northern China. Ecol. Econ. 2007, 62, 19–26. [Google Scholar] [CrossRef]
  20. Li, S.; Sun, Z.; Tan, M.; Guo, L.; Zhang, X. Changing Patterns in Farming–Pastoral Ecotones in China between 1990 and 2010. Ecol. Indic. 2018, 89, 110–117. [Google Scholar] [CrossRef]
  21. Yang, Y.; Wang, K.; Liu, D.; Zhao, X.; Fan, J.; Li, J.; Zhai, X.; Zhang, C.; Zhan, R. Spatiotemporal Variation Characteristics of Ecosystem Service Losses in the Agro-Pastoral Ecotone of Northern China. Int. J. Environ. Res. Public Health 2019, 16, 1199. [Google Scholar] [CrossRef] [PubMed]
  22. Liu, M.; Jia, Y.; Zhao, J.; Shen, Y.; Pei, H.; Zhang, H.; Li, Y. Revegetation Projects Significantly Improved Ecosystem Service Values in the Agro-Pastoral Ecotone of Northern China in Recent 20 Years. Sci. Total Environ. 2021, 788, 147756. [Google Scholar] [CrossRef] [PubMed]
  23. Pei, H.; Liu, M.; Shen, Y.; Xu, K.; Zhang, H.; Li, Y.; Luo, J. Quantifying Impacts of Climate Dynamics and Land-Use Changes on Water Yield Service in the Agro-Pastoral Ecotone of Northern China. Sci. Total Environ. 2021, 809, 151153. [Google Scholar] [CrossRef] [PubMed]
  24. Cao, S.; Chen, L.; Shankman, D.; Wang, C.; Wang, X.; Zhang, H. Excessive Reliance on Afforestation in China’s Arid and Semi-Arid Regions: Lessons in Ecological Restoration. Earth-Sci. Rev. 2010, 104, 240–245. [Google Scholar] [CrossRef]
  25. Li, J.; Li, Z.; Lü, Z. Analysis of Spatiotemporal Variations in Land Use on the Loess Plateau of China during 1986–2010. Environ. Earth Sci. 2016, 75, 997. [Google Scholar] [CrossRef]
  26. Mohabir, N.; Jiang, Y.; Ma, R. Chinese Floating Migrants: Rural-Urban Migrant Labourers’ Intentions to Stay or Return. Habitat Int. 2016, 60, 101–110. [Google Scholar] [CrossRef]
  27. Xing, C.; Zhang, J. The Preference for Larger Cities in China: Evidence from Rural-Urban Migrants. China Econ. Rev. 2017, 43, 72–90. [Google Scholar] [CrossRef]
  28. Sun, W.; Song, X.; Mu, X.; Gao, P.; Wang, F.; Zhao, G. Spatiotemporal Vegetation Cover Variations Associated with Climate Change and Ecological Restoration in the Loess Plateau. Agric. For. Meteorol. 2015, 209–210, 87–99. [Google Scholar] [CrossRef]
  29. He, L.; Guo, J.; Jiang, Q.; Zhang, Z.; Yu, S. How Did the Chinese Loess Plateau Turn Green from 2001 to 2020? An Explanation Using Satellite Data. CATENA 2022, 214, 106246. [Google Scholar] [CrossRef]
  30. Shi, S.; Yu, J.; Wang, F.; Wang, P.; Zhang, Y.; Jin, K. Quantitative Contributions of Climate Change and Human Activities to Vegetation Changes over Multiple Time Scales on the Loess Plateau. Sci. Total Environ. 2021, 755, 142419. [Google Scholar] [CrossRef]
  31. Li, J.; Huang, L.; Cao, W.; Wang, J.; Fan, J.; Xu, X.; Tian, H. Benefits, Potential and Risks of China’s Grassland Ecosystem Conservation and Restoration. Sci. Total Environ. 2023, 905, 167413. [Google Scholar] [CrossRef] [PubMed]
  32. Zheng, X.; Zhang, J.; Cao, S. Net Value of Grassland Ecosystem Services in Mainland China. Land Use Policy 2018, 79, 94–101. [Google Scholar] [CrossRef]
  33. Kemp, D.R.; Guodong, H.; Xiangyang, H.; Michalk, D.L.; Fujiang, H.; Jianping, W.; Yingjun, Z. Innovative Grassland Management Systems for Environmental and Livelihood Benefits. Proc. Natl. Acad. Sci. USA 2013, 110, 8369–8374. [Google Scholar] [CrossRef] [PubMed]
  34. O’Mara, F.P. The Role of Grasslands in Food Security and Climate Change. Ann. Bot. 2012, 110, 1263–1270. [Google Scholar] [CrossRef] [PubMed]
  35. Rafalska, A.; Walkiewicz, A.; Osborne, B.; Klumpp, K.; Bieganowski, A. Variation in Methane Uptake by Grassland Soils in the Context of Climate Change—A Review of Effects and Mechanisms. Sci. Total Environ. 2023, 871, 162127. [Google Scholar] [CrossRef] [PubMed]
  36. Zhou, H.; Zhao, X.; Tang, Y.; Gu, S.; Zhou, L. Alpine Grassland Degradation and Its Control in the Source Region of the Yangtze and Yellow Rivers, China. Grassl. Sci. 2005, 51, 191–203. [Google Scholar] [CrossRef]
  37. Chen, T.; Tang, G.; Yuan, Y.; Guo, H.; Xu, Z.; Jiang, G.; Chen, X. Unraveling the Relative Impacts of Climate Change and Human Activities on Grassland Productivity in Central Asia over Last Three Decades. Sci. Total Environ. 2020, 743, 140649. [Google Scholar] [CrossRef]
  38. Ge, J.; Hou, M.; Liang, T.; Feng, Q.; Meng, X.; Liu, J.; Bao, X.; Gao, H. Spatiotemporal Dynamics of Grassland Aboveground Biomass and Its Driving Factors in North China over the Past 20 Years. Sci. Total Environ. 2022, 826, 154226. [Google Scholar] [CrossRef]
  39. Souther, S.; Loeser, M.; Crews, T.E.; Sisk, T. Drought Exacerbates Negative Consequences of High-intensity Cattle Grazing in a Semiarid Grassland. Ecol. Appl. 2019, 30, e02048. [Google Scholar] [CrossRef]
  40. Liu, Z.; Liu, Y.; Li, Y. Anthropogenic Contributions Dominate Trends of Vegetation Cover Change over the Farming-Pastoral Ecotone of Northern China. Ecol. Indic. 2018, 95, 370–378. [Google Scholar] [CrossRef]
  41. Liu, J.; Dietz, T.; Carpenter, S.R.; Alberti, M.; Folke, C.; Moran, E.; Pell, A.N.; Deadman, P.; Kratz, T.; Lubchenco, J.; et al. Complexity of Coupled Human and Natural Systems. Science 2007, 317, 1513–1516. [Google Scholar] [CrossRef] [PubMed]
  42. Li, A.; Wu, J.; Huang, J. Distinguishing between Human-Induced and Climate-Driven Vegetation Changes: A Critical Application of RESTREND in Inner Mongolia. Landsc. Ecol. 2012, 27, 969–982. [Google Scholar] [CrossRef]
  43. Wu, J.; Li, M.; Zhang, X.; Fiedler, S.; Gao, Q.; Zhou, Y.; Cao, W.; Hassan, W.; Mărgărint, M.C.; Tarolli, P.; et al. Disentangling Climatic and Anthropogenic Contributions to Nonlinear Dynamics of Alpine Grassland Productivity on the Qinghai-Tibetan Plateau. J. Environ. Manag. 2020, 281, 111875. [Google Scholar] [CrossRef] [PubMed]
  44. Hou, L.; Xia, F.; Chen, Q.; Huang, J.; He, Y.; Rose, N.; Rozelle, S. Grassland Ecological Compensation Policy in China Improves Grassland Quality and Increases Herders’ Income. Nat. Commun. 2021, 12, 4683. [Google Scholar] [CrossRef]
  45. Wei, P.; Xu, L.; Pan, X.; Hu, Q.; Li, Q.; Zhang, X.; Shao, C.; Wang, C.; Wang, X. Spatio-Temporal Variations in Vegetation Types Based on a Climatic Grassland Classification System during the Past 30 years in Inner Mongolia, China. CATENA 2019, 185, 104298. [Google Scholar] [CrossRef]
  46. Qu, L.; Zhu, Q.; Zhu, C.; Zhang, J. Monthly Precipitation Data Set with 1 Km Resolution in China from 1960 to 2020. Sci. Data Bank 2022. [Google Scholar] [CrossRef]
  47. Ren, Z.; Tian, Z.; Wei, H.; Liu, Y.; Yu, Y. Spatiotemporal Evolution and Driving Mechanisms of Vegetation in the Yellow River Basin, China during 2000–2020. Ecol. Indic. 2022, 138, 108832. [Google Scholar] [CrossRef]
  48. Evans, J.; Geerken, R. Discrimination between Climate and Human-Induced Dryland Degradation. J. Arid Environ. 2003, 57, 535–554. [Google Scholar] [CrossRef]
  49. Sun, Y.; Yang, Y.; Zhang, L.; Wang, Z. The Relative Roles of Climate Variations and Human Activities in Vegetation Change in North China. Phys. Chem. Earth Parts A/B/C 2015, 87–88, 67–78. [Google Scholar] [CrossRef]
  50. Jenks, G.F. The Data Model Concept in Statistical Mapping. Int. Yearb. Cartogr. 1967, 7, 186–190. [Google Scholar]
  51. Ning, Y.; Liu, S.; Zhao, S.; Liu, M.; Gao, H.; Gong, P. Urban Growth Rates, Trajectories, and Multi-Dimensional Disparities in China. Cities 2022, 126, 103717. [Google Scholar] [CrossRef]
  52. Gong, C.; Lyu, F.; Wang, Y. Spatiotemporal Change and Drivers of Ecosystem Quality in the Loess Plateau Based on RSEI: A Case Study of Shanxi, China. Ecol. Indic. 2023, 155, 111060. [Google Scholar] [CrossRef]
  53. Cao, F.; Ge, Y.; Wang, J.-F. Optimal Discretization for Geographical Detectors-Based Risk Assessment. GIScience Remote Sens. 2018, 50, 78–92. [Google Scholar] [CrossRef]
  54. Wu, Q. Geemap: A Python Package for Interactive Mapping with Google Earth Engine. J. Open Source Softw. 2020, 5, 2305. [Google Scholar] [CrossRef]
  55. Oshan, T.M.; Li, Z.; Kang, W.; Wolf, L.J.; Fotheringham, A.S. Mgwr: A Python Implementation of Multiscale Geographically Weighted Regression for Investigating Process Spatial Heterogeneity and Scale. ISPRS Int. J. Geo-Inf. 2019, 8, 269. [Google Scholar] [CrossRef]
  56. Jordahl, K.; Bossche, J.V.D.; Fleischmann, M.; Wasserman, J.; McBride, J.; Gerard, J.; Tratner, J.; Perry, M.; Badaracco, A.G.; Farmer, C.; et al. Geopandas/Geopandas: V0.8.1. 2020. Available online: https://zenodo.org/records/3946761 (accessed on 1 October 2023).
  57. Pedregosa, F.; Varoquaux, G.; Gramfort, A.; Michel, V.; Thirion, B.; Grisel, O.; Blondel, M.; Prettenhofer, P.; Weiss, R.; Dubourg, V.; et al. Scikit-Learn: Machine Learning in Python. J. Mach. Learn. Res. 2011, 12, 2825–2830. [Google Scholar]
  58. Hoyer, S.; Hamman, J. Xarray: N-D Labeled Arrays and Datasets in Python. J. Open Res. Softw. 2017, 5, 10. [Google Scholar] [CrossRef]
  59. Xu, C.; Jiang, Y.; Su, Z.; Liu, Y.; Lyu, J. Assessing the Impacts of Grain-for-Green Programme on Ecosystem Services in Jinghe River Basin, China. Ecol. Indic. 2022, 137, 108757. [Google Scholar] [CrossRef]
  60. Feng, X.; Fu, B.; Piao, S.; Wang, S.; Ciais, P.; Zeng, Z.; Lü, Y.; Zeng, Y.; Li, Y.; Jiang, X.; et al. Revegetation in China’s Loess Plateau Is Approaching Sustainable Water Resource Limits. Nat. Clim. Change 2016, 6, 1019–1022. [Google Scholar] [CrossRef]
  61. Chen, J.; John, R.; Sun, G.; Fan, P.; Henebry, G.M.; Fernández-Giménez, M.E.; Zhang, Y.; Park, H.; Tian, L.; Groisman, P.; et al. Prospects for the Sustainability of Social-Ecological Systems (SES) on the Mongolian Plateau: Five Critical Issues. Environ. Res. Lett. 2018, 13, 123004. [Google Scholar] [CrossRef]
  62. Du, H.; Xue, X.; Deng, X.; Zhang, X.; Wang, T. Wind Erosion Occurrence Probabilities Maps in the Watershed of the Ningxia–Inner Mongolia Reach of the Yellow River, China. Environ. Earth Sci. 2015, 75, 86. [Google Scholar] [CrossRef]
  63. Yang, R.; Chen, H.; Chen, S.; Ye, Y. Spatiotemporal Evolution and Prediction of Land Use/Land Cover Changes and Ecosystem Service Variation in the Yellow River Basin, China. Ecol. Indic. 2022, 145, 109579. [Google Scholar] [CrossRef]
  64. Miao, R.; Jiang, D.; Musa, A.; Zhou, Q.; Guo, M.; Wang, Y. Effectiveness of Shrub Planting and Grazing Exclusion on Degraded Sandy Grassland Restoration in Horqin Sandy Land in Inner Mongolia. Ecol. Eng. 2014, 74, 164–173. [Google Scholar] [CrossRef]
  65. Kang, L.; Han, X.; Zhang, Z.; Sun, O.J. Grassland Ecosystems in China: Review of Current Knowledge and Research Advancement. Philos. Trans. R. Soc. B Biol. Sci. 2007, 362, 997–1008. [Google Scholar] [CrossRef] [PubMed]
  66. Zhu, Z.; Piao, S.; Myneni, R.B.; Huang, M.; Zeng, Z.; Canadell, J.G.; Ciais, P.; Sitch, S.; Friedlingstein, P.; Arneth, A.; et al. Greening of the Earth and Its Drivers. Nat. Clim. Change 2016, 6, 791–795. [Google Scholar] [CrossRef]
Figure 1. Location and elevation of APEI.
Land 12 02009 g001
Figure 2. The land cover of APEI in 2010 (a) and 2020 (b).
Land 12 02009 g002
Figure 3. The variations of grassland in APEI from 2010 to 2020 at the grid level: (a,b) depict the changes in grassland quality and quantity, respectively. (c,e) present the results of Theil–Sen Median trend analysis for grassland quality and quantity, respectively, showcasing the slope of their respective changes. In (d,f), the red-colored regions represent the significant change areas verified by the Mann–Kendall trend analysis for grassland quality and quantity, respectively.
Land 12 02009 g003
Figure 4. The variations in grassland quality and quantity in APEI at the grid level from 2010 to 2020: the x-axis displays the change in grassland quality (measured by NDVI) at each grid, and the y-axis shows the change in grassland quantity as a percentage of area change. Each blue marker represents a grid, while the red dot denotes the average centroid of all grids. The red dashed ellipse symbolizes the standard deviation ellipse, which captures the overall trend of grassland quality and quantity changes.
Land 12 02009 g004
Figure 5. The relative contribution of natural factors to grassland quality variations in APEI from 2010 to 2020: the nature and anthropogenic factors disturbance contributions sum to 1, such that when nature contribution is 1, anthropogenic factors contribution is 0, and vice versa.
Land 12 02009 g005
Figure 6. Differences Among Different Types of Grasslands: (a) the change in quality of different types of grasslands in APEI from 2010 to 2020; (b) analysis of grassland class differences in APEI based on their quality. (a,b) share a common y-axis representing grassland classification with the following categories: N = nature-dominated, Nr = relatively nature-dominated, B = balanced, Ar = relatively anthropogenic-dominated, A = anthropogenic-dominated. In (a), the x-axis shows the degree of grassland quality change, as measured by NDVI, in the APEI region between 2010 and 2020. In (b), the red squares indicate significant differences (p < 0.01) in grassland quality between two categories.
Land 12 02009 g006
Figure 7. The average quality of different grassland types in APEI: the quality of each grassland type is presented for 2010, 2020, and the entire study period. The x-axis displays the grassland types, with abbreviations consistent with those in Figure 6.
Land 12 02009 g007
Figure 8. The spatial distribution of different grassland types: each point represents its gravity center, and each dashed ellipse indicates its spatial distribution as a confidence ellipse. The different colored points and ellipses represent the distribution of different types of grasslands, which are consistent with those in Figure 6.
Land 12 02009 g008
Figure 9. The importance of driving factors for grassland quality in APEI, as measured by the q value from the GeoDetector: the x-axis shows various influencing factors, with P representing precipitation, T representing temperature, G representing grassland area, C representing cropland area, and B representing built-up area and POP representing population density. The y-axis represents different grassland types, with N, Nr, B, Ar, and A being consistent with those in Figure 6, and ALL representing all types of grassland. The q value ranges from 0 to 1 and reflects the importance of driving factors for grassland quality, with values closer to 1 indicating greater importance.
Land 12 02009 g009
Table 1. Details of the image data used in this study.
DatasetsSpatial ResolutionYearSources
Land Use/cover250 m2010, 2020MODIS
Temperature1000 m2010, 2020MODIS
Precipitation1000 m2010, 2020SCIENCE DATA BANK
Population1000 m2010, 2019REDC
NDVI250 m2010, 2020MODIS
Table 2. Approaches for evaluating the respective contributions of natural factors and human activities in the process of grassland quality change.
SOBDriverDriver DivisionContribution Rate (%)
SCISAICCICAI
>0CI & AI>0>0SCI/SOBSAI/SOB
CI>0<010
AI<0>001
<0CI & AI<0<0SAI/SOBSCI/SOB
CI<0>010
AI>0<001
Notes: S = slope, OB = observation; C = contribution, CCI = contribution of natural factors impact; CAI = contribution of anthropogenic impact.
Table 3. Quality and Quantity Variation in APEI from 2010 to 2020.
Name of IndicesQualityQuantity
Proportion of grid cells where the index variations increased89.80%8.94%
Proportion of grid cells where the index variations decreased10.20%91.06%
Mean values of the variations0.08−2.10%
Table 4. Relative Contributions of Anthropogenic and Natural Factor Disturbances in Different Regions for Grassland Quality Change in APEI from 2010 to 2020.
RegionsContribution of AnthropogenicContribution of Natural Factors
Areas where the grassland quality improved33.23%66.77%
Areas where the grassland quality declined74.96%25.04%
Areas where the grassland quantity improved42.28%57.72%
Areas where the grassland quantity declined36.53%63.47%
APEI37.48%62.52%
Disclaimer/Publisher’s Note: The statements, opinions and data contained in all publications are solely those of the individual author(s) and contributor(s) and not of MDPI and/or the editor(s). MDPI and/or the editor(s) disclaim responsibility for any injury to people or property resulting from any ideas, methods, instructions or products referred to in the content.

