Abstract
Territorial ecological restoration (TER) is a critical step for promoting the development of an ecological civilization, as well as a significant strategic task relating to national ecological security and the well-being of a population. However, calculating the ecological restoration potential (ERP) is a key challenge in TER. Using Zhaoping County as an example, this study calculated the ecological restoration natural potential (ERNP), including the vegetation coverage potential, water conservation potential, windbreak and sand fixation potential, and biodiversity potential, and proposed an ERP calculation method based on the correction of ERNP with an ecological security pattern (ESP) and social support (SS). The findings revealed several key points. First, using the similarity habitat method to calculate ERNP highlighted significant disparities in the vegetation coverage, water conservation, windbreak and sand fixation, and biodiversity across Zhaoping County. These variations were contrary to regional ecological service functions. Second, overall, the ESP levels in Zhaoping County were high, accounting for about 60.42% of its total area being classified as high or relatively high level, with the towns exhibiting strong SS abilities primarily located in the northern region. Third, the ERP results which are between 0 and 1 indicated that areas with higher potential were mainly found in the west and northeast of Zhaoping, while lower potential areas were concentrated in the northwest and south; of them, the ERP index value in most regions is between 0.2 and 0.3, accounting for about 43.97% of the area. Finally, suggestions for the TER project layout and measures to enhance the ERP were proposed based on these ERP calculations. This study offers new insights into ERP strategies while providing guidance for identifying critical areas requiring restoration.
1. Introduction
With the continuous growth of the global economy and the acceleration of urbanization, irrational land use and high-intensity urban construction activities have led to a series of ecological and environmental problems such as ecosystem degradation and landscape destruction. At the beginning of the 20th century, TER emerged in Germany and other countries, and the United Nations regarded the restoration of the ecosystem as the core condition required to solve the ecosystem problem, and related research is also gradually being carried out [,,,,]. China has entered a new stage of ecological civilization construction since the 18th National Congress of the Communist Party of China, and the CPC Central Committee views ecological civilization construction as a key blueprint for the sustainable development of China. Ecological civilization principles such as that “Clean waters and verdant mountains are as valued as mountains of gold and silver” have progressively become accepted by all individuals. Territorial space is crucial in this construction process, serving as an important carrier and spatial element. With the rapid advent of urbanization, the dichotomy between the space development and protection of land has become increasingly prominent. Issues such as inconsistent land space layout, ecological system destruction, disorganized construction land layout, and low cultivated land yield, require immediate attention. Implementing TER in this new era is critical to delivering the concept of an ecological civilization in its entirety, which is an important starting point for building a beautiful countryside and promoting rural revitalization, and a crucial task for China to realize its sustainable development strategy. The study of TER originated from Cairns’ research and has evolved into a systematic branch of ecology [,]. It has become an important area of investigation, encompassing various aspects such as TER zoning [,], TER benefit evaluation [,,], and TER technology and methods []. In recent years, there has been increasing scholarly attention on the issue of TER. Research in this field spans various scales (province, region, county) and focuses primarily on the following areas. Scholars use the theory of ESPs to identify ecological sources and corridors by integrating morphological spatial pattern analysis, the InVEST model, circuit theory, the minimum cumulative resistance model, cost–distance analysis, spatial syntax, and other methods. They establish a comprehensive resistance surface to construct ESPs for evaluating, managing, and optimizing land spatial ecological security in the study area [,,,,,,,,,,]. Various models and methods are used in the study of TER engineering to evaluate the ecological service value and benefits that TER projects provide [,,,,,]. These tools include the ordered probit model, ecological benefit evaluation model, social-ecological system framework, market value method, alternative engineering method, carbon tax law, and industrial oxygen production method. In the study of TER zoning, scholars have developed a framework for evaluating land space based on different aspects such as quality, pressure, state, potential, or function by constructing an ESP, the supply and demand relationship of ecosystem services, and a comprehensive index system [,,,,,,,,,]. The ERP is the basis for delineating ESPs and arranging TER projects. The ERP refers to the potential ability of diverse remediation actions being used to rectify and repair the disturbed and degraded ecological environment to improve the regional ecological environment following remediation. The ERP refers to the ability of an ecosystem to improve its service function after the construction of a TER project. The ERP is based on the ERNP, which analyzes the enhancement of regional ecological service functions considering natural factors such as the regional climate, soil, hydrology, terrain, and geomorphology. In this study, the ERNP mainly measures the potential for vegetation coverage, water conservation, windbreak and sand fixation, and biodiversity. ERP implementation is contingent on numerous variables. First, it depends on the ecological security situation in the region. The ESP is essential for the successful regulation and management of ecological processes. By constructing an ESP, it is possible to ensure the full performance of ecological functions, realize the effective and rational allocation of regional natural resources and green infrastructure, and ensure the ecological and material flow of essential natural resources, thereby achieving regional ecological security. The ESP is also the foundation of regional TER project construction. The ERP and ESP are intertwined in the process of TER planning and TER project layout in different regions, with ecologically significant sources and corridors being the primary locations requiring protection. Therefore, the greater the likelihood of a TER project layout, the closer the area is to the key area in the ESP. Second, SS contributes significantly to regional TER planning and implementation initiatives. Since TER planning entails an extensive scope and long-term issues necessitating major financial input from both state and local authorities, regional economic conditions and public support significantly impact implementation achievements. In conclusion, the ERP focuses on enhancing ecosystem services through TER initiatives and is supported by ERNP analyses based on natural variables such as climate and topography. In addition, constructing an ESP is crucial for effective regulation, ensuring the correct allocation of resources, and ensuring the necessary flow of materials. Finally, socioeconomic elements, such as local economic strength and public backing, are essential for the effective execution of TER initiatives. In the past, potential calculations mostly focused on the remediation potential of cultivated land [,], the consolidation potential of rural residential land [,], the construction of high-standard farmland, etc. [,]. Relevant theories and methods of ERP have been investigated in recent years, but most of them were limited to a single ecological function potential evaluation method of TER. For example, some studies used a similar habitat method to calculate the vegetation restoration potential of the Loess Plateau [,]; some scholars analyzed the vegetation restoration potential in the Loess Plateau via a statistical analysis method according to similar habitats []; there are also scholars who have assessed mangrove habitat suitability in Xiamen Bay using maximum entropy modeling combined with land use data overlay for calculating mangrove restoration potentials []; for some scholars, the ecological, sociocultural, historic, and economic characteristics of the area were evaluated in order to examine the potential of mangrove ecosystems []; and some scholars adopted a resistance system model incorporating factors such as the comprehensive pollution index of heavy metals in soil and the land type to calculate the ERP for Shuikoushan []. In general, research on ERPs has gradually emerged; previous research on ERPs has mostly focused on individual potential, with independent consideration of certain potential types in the calculation process. However, there is insufficient research on comprehensive ERPs, therefore, enhancing the ERP’s calculation method and related practical research is imperative.
The karst area is one of the four major ecologically fragile areas in China, and its ERP calculation has a strong representativeness for the rational arrangement of TER projects and the improvement of regional ecological quality. The karst landform area in Zhaoping County is large, with frequent surface water leakages, drought and flood disasters, and a fragile ecological environment. Based on the above analysis, this study uses Zhaoping County, Hezhou City, and Guangxi Province in China as research areas to explore the calculation method of an ERP. We suggest a comprehensive model for calculating the county ERP based on a scientific analysis of Zhaoping County. The research results can enrich the relevant theoretical ERP calculation methods and guidance on TER practices. These findings ultimately provide theoretical, experiential, and technical support for ecological conservation, restoration, and promotion in Zhaoping County and similar regions.
2. Materials and Methods
2.1. Overview of the Study Area
In eastern Guangxi, China, Zhaoping County is situated in the middle reaches of the Gui Jiang River. Its geographical coordinates are approximately N 23°39′ to 24°24′ and E 110°34′ to 111°19′. The county comprises undulating mountains, deep valleys, narrow flat land, high terrain in the northwest, and low terrain in the southeast (Figure 1). This unique landscape has earned it the nickname “nine mountains, half water, and half fields”. The region is marked by notable karst landforms and is frequently threatened by surface water leakage, droughts, floods, and an ecologically delicate environment. In 2021, Zhaoping County was designated as one of the 20 national key rural revitalization counties. It is also an acknowledged national demonstration county for the development of an ecological society. The results derived from ERP calculations play a crucial role in influencing its TER operations.
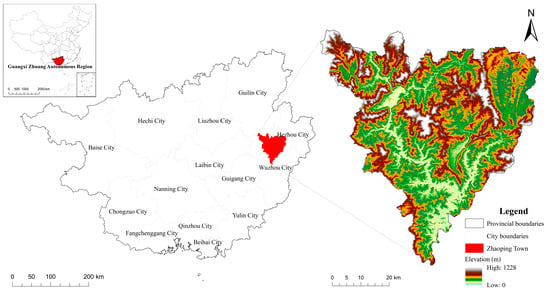
Figure 1.
Geographical location of Zhaoping County.
2.2. Data Sources
The data for this study include: ① meteorological data (temperature, precipitation, wind speed, evaporation, solar radiation, and other data), sourced from the National Qinghai-Tibet Plateau Scientific Data Center; ② normalized vegetation index data, procured from the National Qinghai-Tibet Plateau Scientific Data Center; ③ a soil data set (soil type, soil texture, soil organic matter content, etc.), derived from the Resources and Environmental Science and Data Center of Chinese Academy of Sciences and National Qinghai-Tibet Plateau Scientific Data Center; ④ DEM data, which is sourced from geospatial data cloud; ⑤ Multi-period land use remote sensing monitoring data set, geomorphological data, an ecosystem type data set, vegetation type data, and GDP spatial distribution kilometer grid data, downloaded from the Resources and Environmental Science and Data Center of China Academy of Sciences; ⑥ land use status data, interpreted from remote sensing imaging; and ⑦ general public budget expenditure data, referenced from the China County Statistical Yearbook (Table 1).

Table 1.
Main sources of data acquisition.
2.3. Research Ideas
This study aims to assess the TER in Zhaoping County. ERNP was initially calculated when considering factors such as vegetation coverage, water conservation, windbreak and sand fixation, and biodiversity potential. The ESP and SS were subsequently evaluated, and a comprehensive ERP was proposed by adjusting the ESP and SS accordingly. Finally, recommendations for optimizing the layout of TER projects and enhancing ecological service functions in Zhaoping County were provided (Figure 2).
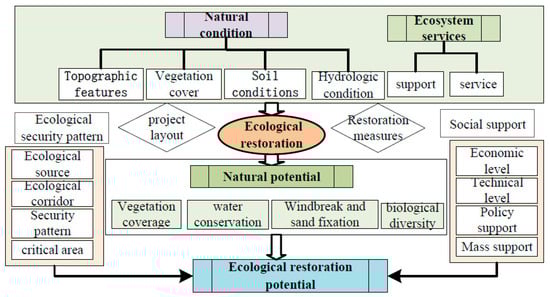
Figure 2.
Technology roadmap of this study.
2.4. Ecological Restoration Natural Potential
The potential of several types of similar habitat units was assessed based on the evaluation of vegetation coverage, water conservation, windbreak and sand fixation, and biodiversity in the research area. Similar habitat units refer to areas with comparable natural habitats with similar landscape or vegetation coverage []. In other words, these regions share a comparable topography, climate, soil, and geology, as well as similar vegetation cover and ecological services. A similar habitat unit contains the highest value of vegetation coverage and ecological functions within a region. To determine the ecological potential in Zhaoping County, this study selected slope, soil type, and topographic conditions to divide similar habitat units (Figure 3), resulting in 38 categories with a total of 645 divisions. For each division, maximum values of vegetation coverage, water conservation, windbreak and sand fixation, and the biodiversity grid are calculated separately. The difference between the maximum and current values is considered the ERNP of TER.
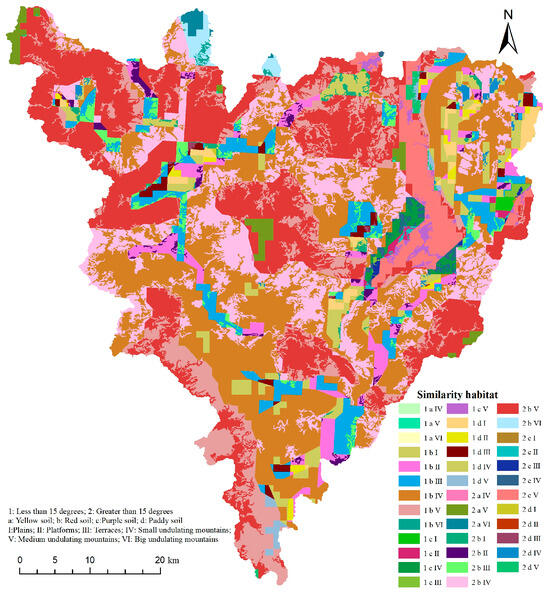
Figure 3.
Division results of the similarity habitat method in Zhaoping County.
2.4.1. Vegetation Coverage Potential
Vegetation coverage is the ratio of the vertical projection area of plants to the overall area of a particular region. A maximum value of vegetation coverage exists in similar habitat units, representing the optimal level of vegetation restoration in that area. The difference between this maximum value and the current vegetation coverage is the vegetation coverage potential. The formula used to calculate vegetation coverage is as follows:
where VC represents vegetation coverage, and NDVI is the normalized vegetation index. NDVIsoil is the NDVI value of areas with no vegetation or completely bare soil; and NDVIveg is the NDVI value of areas completely covered by vegetation. The calculation formula for determining the vegetation coverage potential is as follows:
where VCp represents the vegetation coverage potential; VCmax is the maximum value of vegetation coverage in similar habitat units to that which the grid belongs; and VC denotes the current vegetation coverage in the study area.
2.4.2. Water Conservation Potential
The term “water conservation function” refers to the service offered by a regional ecosystem in which its distinctive structure interacts with water resources to manage water flow, enhance water quality, and improve the water cycle. This function is influenced by various factors such as vegetation type, coverage, litter composition, soil thickness, and the physical properties of the soil. The maximum value of water conservation in comparable settings shows the maximum amount of possible water conservation. The difference between this maximum and the current values suggests an additional water conservation potential. The calculation formula for determining water conservation is as follows:
where TQ denotes the total water conservation (m3), Pi is the rainfall (mm), Ri is the surface runoff (mm), ETi is the evapotranspiration (mm), Ai is the area of type i ecosystem (km2), i is the type i in the study area, and j is the number of types of ecosystems in the study area. The calculation formula for the water conservation potential is as follows:
where TQp represents the water conservation potential; TQmax is the maximum value of water conservation in similar habitats to which the grid belongs; and TQ denotes the current water conservation in the study area.
2.4.3. Windbreak and Sand Fixation Potential
The windbreak and sand fixation function refers to the ability of a region’s ecosystem vegetation to stabilize the surface soil by anchoring it with roots, improving the soil structure, reducing exposed areas of soil, and increasing ground roughness, thereby preventing the soil erosion caused by wind factors such as wind speed, humidity, soil type, topography, and vegetation []. To determine the windbreak and sand fixation potential in a given habitat unit, its value was compared to that of similar units. The difference between the maximum value and the current value represents this potential. The calculation method of windbreak and sand fixation is shown in Table 2.
Table 2.
Calculation method of windbreak and sand fixation.
The calculation formula of the windbreak and sand fixation potential is as follows:
In the formula, SRp is the windbreak and sand fixation potential; SRmax refers to the maximum value of windbreak and sand fixation in similar habitats to which the grid belongs; and SR indicates the current amount of windbreak and sand fixation in the study area.
2.4.4. Biodiversity Potential
The biodiversity function refers to the role of an ecosystem in preserving species diversity, gene diversity, and ecosystem diversity in a region. The habitat quality module of the InVEST model analyzes habitat quality by examining land use/cover maps and assessing the extent of the biodiversity threat posed by various land types. Habitat quality is a measure of biodiversity; a higher habitat quality index indicates a higher level of habitat quality and larger biodiversity []. In this study, cultivated land, urban land, rural residential land, and other construction land, were selected as stress factors, and the attenuation function types, maximum influence distance, and the weights of their stress factors were determined based on research in the existing literature and the current land use status in Zhaoping County. The habitat suitability for each stress factor and its relative sensitivity (Table 3 and Table 4) were also defined. Finally, the regional habitat quality was calculated using the InVEST model.
Table 3.
Maximum influence distance and weight of stress factors in biodiversity analysis in Zhaoping County.
Table 4.
Habitat suitability and its relative sensitivity to different stress factors in Zhaoping County.
The maximum value of biodiversity in similar habitat units is the highest biodiversity that can be achieved, and the difference between this maximum value and the current value represents the biodiversity potential:
where Qp is the biodiversity potential; Qxjm is the maximum value of the habitat quality index of similar habitat units to which the grid belongs; and Qxj is the biodiversity of grid x in land use type j.
2.5. Ecological Security Pattern
The process of calculating the ESP involves several steps. Initially, the habitat quality in Zhaoping County was evaluated, and suitable terrestrial ecological sources from existing nature reserves were identified. The main rivers in Zhaoping County were chosen as the study area for this water-based research. Using the least cumulative resistance model, an ecological resistance surface was then generated, considering variables such as land use type, altitude, and slope resistance. Lastly, using the spatial analytic capabilities of ArcGIS, an ecological corridor was identified based on the ecological source and comprehensive resistance surface in order to construct the ESP. To determine the level of the ESP, buffer zone analysis was conducted by measuring the distance between the ecological source and the ecological corridor. A closer proximity between these two indicates a higher level of the ESP. The levels of the ESP are categorized into five tiers: low level, relatively low level, medium level, relatively high level, and high level.
2.6. Social Support
Public budget expenditures on energy saving and environmental preservation play a vital role in the implementation of TER and environmental governance. This study proposes that in regions with a greater GDP and level of economic growth, the government should dedicate a larger portion of its budget to TER projects. In these areas, there is a stronger willingness to restore ecological balance, resulting in a more effective implementation of TER []. This study considers villages and towns as evaluation units to calculate the SS of TER. The calculation formula for SS is as follows:
where Socialp is the SS of TER, GDPij is the average GDP of township i of administrative village j, GDPi is the average GDP of township i, and Ai is the average general public budget expenditure of township i (10,000 Yuan/km2).
2.7. Comprehensive Ecological Restoration Potential
The comprehensive ERP is calculated based on the ERNP, considering the ESP and SS. This calculation involves weighting and combining the four functions of the ERNP, with ESP and SS used for correction. The correction coefficient can be found in Table 5. The formula for calculating the comprehensive ERP is as follows:
where Pt is the comprehensive REP, VCps is the standardized vegetation coverage potential, TQps is the standardized water conservation potential, SRps is the standardized potential of windbreak and sand fixation potential, Qps is the standardized potential of biodiversity, and E and S are the correction coefficients of ESP and SS.
Table 5.
Correction coefficients of ecological security pattern and socialization support.
3. Results
3.1. Ecological Restoration Natural Potential
3.1.1. Vegetation Coverage Potential
The present situation of vegetation coverage and the vegetation coverage potential in Zhaoping County were calculated. The results show that the vegetation coverage in Zhaoping County is high, with values ranging from 0 to 1, especially in the western region (Figure 4a). The vegetation coverage potential also varies from 0 to 1, decreasing gradually from northeast to southwest. In the study area, 82.33% of the regional vegetation coverage potential index is below 0.5, while only 7.21% of the potential index exceeds a value of 0.75. In Northeast China, areas with a greater potential for vegetation coverage are primarily dispersed in small undulating mountains, indicating that there is still an opportunity for vegetation coverage in Zhaoping County (Figure 4b).
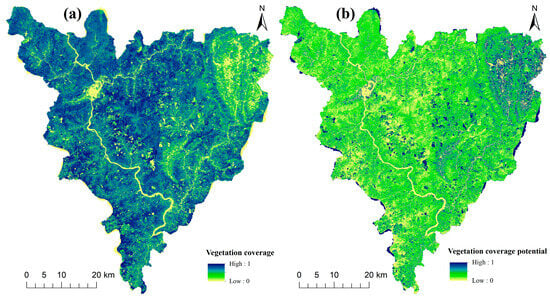
Figure 4.
Vegetation coverage and vegetation coverage potential in Zhaoping County: (a) vegetation coverage levels; (b) vegetation coverage potential.
3.1.2. Water Conservation Potential
The existing quantity and possibilities for water conservation in Zhaoping County have been determined. The data indicate that the current water conservation levels vary throughout the county, with higher levels in the northwest and lower levels in the southeast (Figure 5a). The highest recorded water conservation is 2.12 × 10³ m3/hm2, which is mainly distributed in rivers and lakes, especially in the Gui Jiang basin. Conversely, the lowest amount is −1.57 × 10³ m3/hm2, mainly located in the southern region of Zhaoping. The water conservation potential ranges from 0 to 3.31 × 10³ m3/hm2, gradually increasing from northwest to southeast. This tendency contradicts the documented changes in Zhaoping County surface runoff and yearly average precipitation (Figure 5b). Over a quarter of the area’s water conservation potential index exceeds 1 × 10³ m3/hm2, predominantly concentrated in the mountainous regions of southern and eastern Zhaoping County. These results suggest that there are considerable possibilities for improving water conservation efforts in these regions.
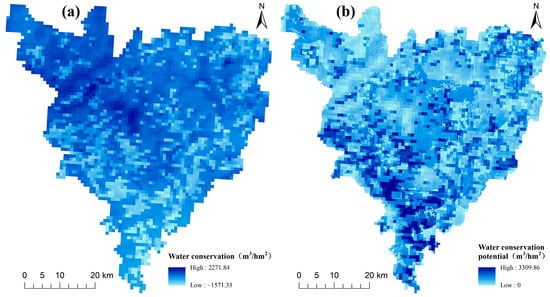
Figure 5.
Water conservation levels and water conservation potential in Zhaoping County: (a) water conservation levels; (b) water conservation potential.
3.1.3. Windbreak and Sand Fixation Potential
The study conducted in Zhaoping County assessed the current and potential windbreak and sand fixation capabilities of the region. The findings indicate that the highest amount of windbreak and sand fixation in Zhaoping County is 0.24 t/km2·a (Figure 6a), with a relatively uniform spatial distribution. The eastern region exhibits a higher capacity for windbreak and sand fixation. The windbreak and sand fixation potential ranges between 0 and 0.24 t/km2·a, with over 40% of areas having a potential value greater than 0.15 t/km2·a, which is mainly distributed in the middle undulating mountains in the northeast of Zhaoping County and near the Gui Jiang watershed. Factors such as the soil erodibility index, soil crust factor, and organic matter content contribute to strong overall windbreak and sand fixation (Figure 6b).
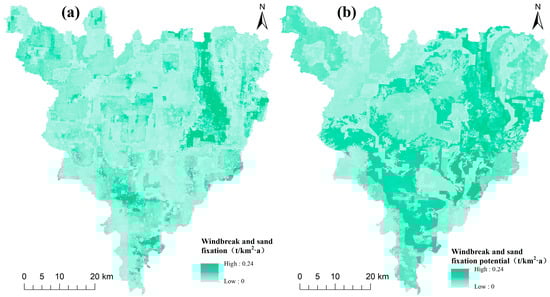
Figure 6.
Windbreak and sand fixation levels and potential in Zhaoping County: (a) windbreak and sand fixation levels; (b) windbreak and sand fixatio potential.
3.1.4. Biodiversity Potential
The InVEST model was designed to evaluate the habitat quality in the research region and to depict its current biodiversity status. This investigation finds that Zhaoping County has a high level of biodiversity overall, with the exception of a few places in the northeast, northwest, and southeast (Figure 7a). However, the overall biodiversity potential in Zhaoping County is relatively low, with most areas scoring below 0.20. The regions with relatively high potential are generally located in the small undulating mountains of the northeast and on platforms located away from urban areas in the northwest and southeast (Figure 7b).
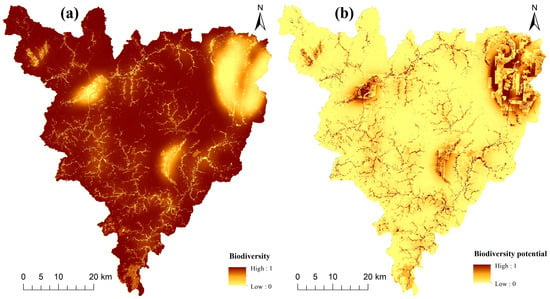
Figure 7.
Biodiversity status and biodiversity potential in Zhaoping County: (a) biodiversity status; (b) biodiversity potential.
3.2. Ecological Security Pattern
The ESP is constructed through a process that involves ecological source identification, the construction of an ecological resistance surface, and the identification of ecological corridors (Figure 8a), which results in the determination of four land ecological source areas and six ecological corridors, with a total area of 393.17 km2 and a total length of 109.04 km. To study the buffer zone surrounding ecological sources and corridors, the following distances are considered: 1 km, 2 km, 3 km, 4 km, and more than 4 km. The closer a region is to an ecological source and ecological corridor, the greater its TER significance. Low level, comparatively low level, medium level, relatively high level, and high level, are the five categories of ESP proficiency in Zhaoping County (Figure 8b). Approximately 60.42 percent of the total land area of Zhaoping County is classified as high or relatively high level, primarily in the middle and northern sections. In contrast, 27.23 percent of Zhaoping County’s entire area have low and relatively low level ESPs, primarily in the southern part.
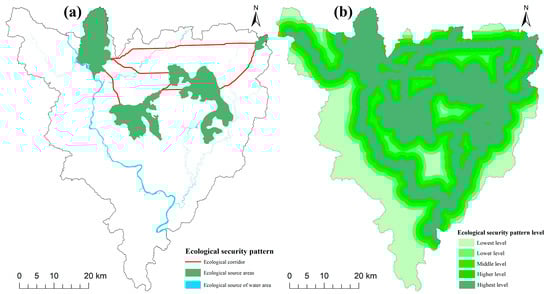
Figure 8.
Ecological security pattern of Zhaoping County: (a) ecological security pattern; (b) ecological security pattern levels.
3.3. Social Support
The ability for the social support of TER in Zhaoping County was analyzed. The data demonstrate a substantial gap between the average GDP levels of the various towns in Zhaoping County. Specifically, the northern area of Zhaoping, including Zhaoping and Huangyao, has a greater GDP than the relatively lower southern region, including the Muge Township (Figure 9a). This spatial distribution pattern is also reflected in the average public budget expenditure across Zhaoping County. The towns with higher expenditures are Zhaoping, Zouma Township, and Beituo, while the Muge Township and Huangyao have lower expenditures (Figure 9b). The classification results reveal that the majority of communities with a greater capacity for social support are located in the northern region. The municipality with the highest level of support capabilities is Zhaoping, followed by the Zouma Township, Huangyao, and Beiduo. The Muge Township in the south, Fenghuang Township in the east, Wenzhu, and Xianhui Yao Township in the north, have lower a support capacity (Figure 9c).
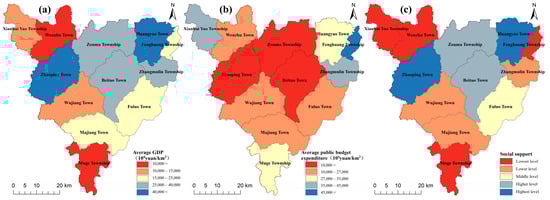
Figure 9.
GDP, general public budget expenditure, and social support for Zhaoping County: (a) average GDP levels; (b) average public budget expenditure levels; (c) social support levels.
3.4. Comprehensive Ecological Restoration Potential
The comprehensive ESP results in Zhaoping County indicate that the potential index is between 0 and 1 (Figure 10). Greater potential values are predominantly located in the western and northeastern regions of Zhaoping County, whilst lower potential values are concentrated in the northwestern and southern regions. Specifically, areas with a potential index below 0.2 cover an area of 417.40 km2, accounting for 15.18% of the total area of Zhaoping County. Areas with a potential index between 0.2 and 0.3 cover 1366.69 km2, accounting for 43.97% of the total area; areas with a potential index between 0.3 and 0.4 cover an area of 855.94 km2, accounting for 27.54% of the total area; those between 0.4 and 0.5 cover an area of 303.25 km2, accounting for 9.75% of the total area; areas with a potential index greater than 0.5 cover an area of 110.03 km2, accounting for 3.54% of the total area.
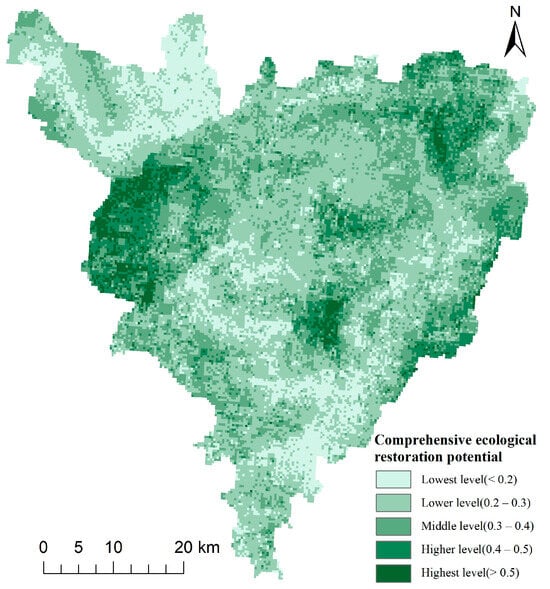
Figure 10.
Comprehensive ecological restoration potential in Zhaoping County.
4. Discussion
4.1. The Ecological Restoration Natural Potential Is the Basic Ecological Restoration Potential
The ERNP in Zhaoping County can be categorized into four types: vegetation coverage potential, water conservation potential, windbreak and sand fixation potential, and biodiversity potential. The distribution of these potentials varies across the study area. The vegetation coverage potential decreases gradually from the northeast to southwest, and areas with high vegetation coverage potential are mainly distributed in small undulating mountains in the northeast; the areas with high water conservation potential are primarily located in the southern and eastern mountainous regions of the study area; and the areas with high windbreak and sand fixation potential are primarily located in the northeast undulating mountains and near the coast. The ERNP exhibits an inverse spatial distribution relationship with current land use patterns. The results of the ERNP analysis strongly correlate with the overall and regional natural conditions, particularly land cover types. Areas with high vegetation coverage mostly consist of woodland and grassland, while those with low vegetation coverage predominantly comprise cultivated land or bare land. Northern Zhaoping County has a greater level of water conservation than southern Zhaoping County, which suggests that southern regions have a stronger capacity for water conservation. The overall windbreak and sand fixation potentials in Zhaoping County are not notably high and are distributed unevenly over the territory. Moreover, Zhaoping County has a generally high biodiversity potential, but its ecological restoration cability remains relatively low. The majority of the county’s ecologically restorable regions are located in the county’s northeast.
4.2. The Ecological Security Pattern and Social Support Affect Ecological Restoration
Low-level, relatively low-level, medium-level, comparatively high-level, and high-level proficiency are the five levels of the ESP in Zhaoping County. Approximately 60.42 percent of Zhaoping County’s total land area is classified as relatively high or high-level. The larger the ESP level, the greater the significance of ecological security and the greater the need for TER. In order to sustain the regional ESP level, TER projects must be implemented in certain regions. A TER project is a comprehensive initiative that requires support from national policies, investments, local economies, policies, and the public. This study primarily uses economic conditions to gauge the scale of SS. In developed regions where there is a significant investment in TER and widespread awareness among the public, implementation of TER projects tends to be smoother. The classification findings for SS in Zhaoping County indicate that the majority of towns with superior SS abilities are located in the northern region.
4.3. Strategies for Improving the Ecological Restoration Potential
The ERNP serves as the foundation of a comprehensive ERP. This paper’s ERNP represents the theoretical potential achievable through TER projects. However, a number of issues prevent its practical application. The ESP and SS are used as correction factors to adjust the ERNP and generate a comprehensive ERP to account for these constraints. The data reveal that the regions with the highest ERP are primarily located in the western, northeastern, and central regions. These regions have a relatively low slope, overall low vegetation coverage, and significant potential for water conservation and windbreak/sand fixation, but low biodiversity potential. Given their high levels of ESPs and substantial presence of SS, it is essential to improve vegetation coverage in these regions while executing ecological diversity protection programs in order to improve the function of regional ecological services. The majority of Zhaoping County’s medium-level comprehensive ERP areas are located in the central, southwest, and southeast regions. These areas have a high vegetation coverage and biodiversity index but low potential for vegetation coverage and biodiversity. However, they have a high potential for water conservation, windbreak, and sand fixation. Therefore, it is important to prioritize water conservation and implement relevant TER projects in these areas. The areas with a low ERP are predominantly situated in parts of the northwest and south areas of Zhaoping County. Despite having high vegetation coverage, strong water conservation capacities, and windbreak/sand fixation measures already in place—resulting from a high biodiversity index—they demonstrate a lower ERNP value than other regions. For these regions, natural protection and restoration efforts should be prioritized; natural restoration should take precedence, while artificial promotion simultaneously supplements these efforts; comprehensive plans encompassing landscape management and forest preservation should be developed to effectively enhance ecological service functions across landscapes, forests, lakes, and grasslands.
5. Conclusions
High-intensity land development and utilization activities have caused problems such as ecological environment destruction and ecosystem function degradation. As China strives to build an ecological civilization, TER is receiving increased attention. As the county is the primary unit for TER implementation, it is vital to examine the ERP. This research covers Zhaoping County in Hezhou City as a case study region, beginning with the definition of the TER objectives and the measurement of the ERNP, which includes plant coverage, water conservation, windbreak and sand fixation, and biodiversity. The ESP and SS are reviewed based on these readings to alter the ERNP for an appropriate ERP computation. The findings provide recommendations for the natural restoration, pattern optimization, and function enhancement of TER in Zhaoping County. This study reveals that the ERNP in Zhaoping County is mainly affected by ecological function, and there is a big gap between different potentials. The ERP values range from 0 to 1 when the ESP and SS components are taken into account. The majority of places with a higher potential value are located in the west and northeast of Zhaoping County. In comparison, the majority of areas with a lower potential value are located in the northwest and south. These comprehensive ERP findings can inform decisions regarding TER project placement, performance evaluation, and policy formulation.
The calculation methods for ERPs in existing studies are mostly based on a single potential, such as vegetation restoration, water conservation, etc. In the existing potential estimation studies, Marsh et al. used interviews to explore the impact of ecological restoration activities on human well-being []; Yan et al. identified the ecological source via the MSPA method and InVEST model, and identified the key areas of ecological restoration for Shanghai’s land space using circuit theory []; De Montis et al. constructed an ESP and circuit theory to identify plaques, corridors, and nodes that need ecological restoration, thereby proposing ecological restoration measures []; Yi et al. and Zhao et al. calculated the vegetation restoration potential of the Loess Plateau using a similar habitat approach [,], etc. However, most of these studies are limited to the TER’s single ecological function potential assessment method, and there are currently few comprehensive analyses. This study explored the comprehensive ERP calculation method considering the ESP and SS from four ERNPs, which makes up for the shortcomings of the existing studies. The method proposed in this study can be applied to most TER areas, especially ecologically fragile areas. Its main advantage is that it can realize the calculation of the ERP by types and stages, and carry out TER engineering arrangements according to regional characteristics and development stages This study calculates ERP entirely based on the current ecological circumstances of the area without accounting for land use changes or climatic variations over time. Therefore, additional research is required to investigate how the ERP may vary in time and space. It is necessary to strengthen the application of real-time ecological monitoring data in the field. The results of this study suggest that the impacts of TER projects on regional ecological quality and ESP should be considered comprehensively in TER planning to maximize the benefits of TER projects. In the process of formulating and implementing ecological restoration policies, it is also necessary to base the policies on regional characteristics and SS, and emphasize the operability of planning and policies.
Author Contributions
M.L.: conceptualization, methodology, software, visualization, and writing—original draft. H.H.: data curation, software, and formal analysis. X.L.: software, validation, visualization, conceptualization, funding acquisition, and writing—review and editing. X.T.: data curation, methodology, formal analysis, and writing—original draft. All authors have read and agreed to the published version of the manuscript.
Funding
This research was supported by the National Key R&D Program of China (2022YFC3802805) and the Youth Fund of the Beijing Academy of Agricultural and Forestry Sciences (QNJJ202126).
Data Availability Statement
Data will be made available on request.
Conflicts of Interest
The authors declare that they have no known competing financial interests or personal relationships that could have appeared to influence the work reported in this paper.
References
- Hooper, T.; Beaumont, N.; Griffiths, C.; Langmead, O.; Somerfield, P. Assessing the sensitivity of ecosystem services to changing pressures. Ecosyst. Serv. 2017, 24, 160–169. [Google Scholar] [CrossRef]
- Dadashpoor, H.; Azizi, P.; Moghadasi, M. Land use change, urbanization, and change in landscape pattern in a metropolitan area. Sci. Total Environ. 2019, 655, 707–719. [Google Scholar] [CrossRef]
- Ran, Y.J.; Lei, D.M.; Li, J.; Gao, L.P.; Mo, J.X.; Liu, X. Identification of crucial areas of territorial ecological restoration based on ecological security pattern: A case study of the central Yunnan urban agglomeration. Ecol. Indic. 2022, 143, 109318. [Google Scholar] [CrossRef]
- Nie, W.; Shi, Y.; Siaw, M.J.; Yang, F.; Wu, R.; Wu, X.; Zheng, X.; Bao, Z. Constructing and optimizing ecological network at county and town Scale: The case of Anji County, China. Ecol. Indic. 2021, 132, 108294. [Google Scholar] [CrossRef]
- Romanelli, J.P.; Fujimoto, J.T.; Ferreira, M.D.; Milanez, D.H. Assessing ecological restoration as a research topic using bibliometric indicators. Ecol. Eng. 2018, 120, 311–320. [Google Scholar] [CrossRef]
- Cairns, J. The recovery process in damaged ecosystems. J. Ecol. 1980, 69, 1062. [Google Scholar]
- Yi, X.; Bai, C.Q.; Liang, L.W.; Zao, Z.C.; Song, W.X.; Zang, Y. The evolution and frontier development of land ecological restoration research. J. Nat. Resour. 2020, 35, 37–52. [Google Scholar] [CrossRef]
- James, M.O.; Glenn, E.G. Ecoregions of the Conterminous United States: Evolution of a Hierarchical Spatial Framework. Annals of the Association of American Geographers. Environ. Manag. 2014, 54, 1249–1266. [Google Scholar] [CrossRef]
- Lv, T.Y.; Zeng, C.; Lin, C.X.; Liu, W.P.; Cheng, Y.P.; Li, Y.B. Towards an integrated approach for land spatial ecological restoration zoning based on ecosystem health assessment. Ecol. Indic. 2023, 147, 110016. [Google Scholar] [CrossRef]
- Gómez-Baggethun, E.; Tudor, M.; Doroftei, M.; Covaliov, S.; Năstase, A.; Onără, D.; Mierlă, M.; Marinov, M.; Doroșencu, A.; Lupu, G.; et al. Changes in ecosystem services from wetland loss and restoration: An ecosystem assessment of the Danube Delta (1960–2010). Ecosyst. Serv. 2019, 39, 100965. [Google Scholar] [CrossRef]
- Elmqvist, T.; Setälä, H.; Handel, S.; Van, D.P.; Aronsom, J.; Blignaut, J.; Gomez-Baggethun, E.; Nowak, D.; Kronenberg, J.; de Groot, R. Benefits of restoring ecosystem services in urban areas. Curr. Opin. Environ. Sustain. 2015, 14, 101–108. [Google Scholar] [CrossRef]
- Marsh, p.; Auckland, S.; Dudley, T.; Kendal, D.; Flies, E. A mountain of health benefits? Impacts of ecological restoration activities on human wellbeing. Wellbeing Space Soc. 2023, 4, 100132. [Google Scholar] [CrossRef]
- Merino-Martin, L.; Commander, L.; Mao, Z.; Stevens, J.; Miller, B.; Golos, P.; Mayence, C.; Dixon, K. Overcoming topsoil deficits in restoration of semiarid lands: Designing hydrologically favorable soil covers for seedling emergence. Ecol. Eng. 2017, 105, 102–117. [Google Scholar] [CrossRef]
- Yan, Y.Y.; Sun, Y.W.; Liu, M. Identification and restoration strategy of key areas for territorial space ecological restoration in Shanghai, China based on ecological security pattern. Chin. J. Appl. Ecol. 2022, 33, 3369–3378. [Google Scholar] [CrossRef]
- Pan, N.H.; Du, Q.Q.; Guan, Q.Y.; Tan, Z.; Sun, Y.F.; Wang, Q.Z. Ecological security assessment and pattern construction in arid and semi-arid areas: A case study of the Hexi Region, NW China. Ecol. Indic 2022, 138, 108797. [Google Scholar] [CrossRef]
- Peng, J.; Yang, Y.; Liu, Y.X.; Hu, Y.N.; Du, Y.Y.; Meersmans, J. Linking ecosystem services and circuit theory to identify ecological security patterns. Sci. Total Environ. 2018, 644, 781–790. [Google Scholar] [CrossRef]
- Lin, W.H.; Wen, Z.F.; Wu, S.J.; Bi, Y. Identification and optimization of ecological security patterns in the Chengdu-Chongqing Economic Zone. Acta Ecol. Sin. 2023, 43, 1–13. [Google Scholar] [CrossRef]
- Sun, L.H.; Liu, H.; Wang, D.; Hao, H.G. Research on Ecological Security Pattern Construction Based on the Evaluation of Ecosystem Services and Eco-Environmental Sensitivity. Res. Environ. Sci. 2022, 35, 2508–2517. [Google Scholar] [CrossRef]
- Feng, Y.W.; Zhen, J.H.; Tian, T.Y. Optimization of land protection and restoration based on ecological security pattern: A case study of Hohhot-Baotou-Ordos Region in Inner Mongolia. J. Nat. Resour. 2022, 37, 2915–2929. [Google Scholar] [CrossRef]
- Shen, Z.; Gao, Y.; Liu, Y.X.; Cui, L.H.; Song, C.L. Research on the Identification and Strategies of Key Areas for Integrated Territorial Consolidation Based on Ecological Security Pattern: A Case Study of Zhuanghe City, Liaoning Province. China Land Sci. 2022, 36, 24–35. [Google Scholar] [CrossRef]
- Kukkala, A.S.; Moilanen, A. Ecosystem services and connectivity in spatial conservation prioritization. Landsc. Ecol. 2017, 32, 5–14. [Google Scholar] [CrossRef] [PubMed]
- Keeley, A.T.H.; Beier, P.; Gagnon, J.W. Estimating landscape resistance from habitat suitability: Effects of data source and nonlinearities. Landsc. Ecol. 2016, 31, 2151–2162. [Google Scholar] [CrossRef]
- De Montis, A.; Caschili, S.; Mulas, M.; Modica, G.; Ganciu, A.; Bardi, A.; Ledda, A.; Dessena, L.; Laudari, L.; Fichera, C.R. Urban–rural ecological networks for landscape planning. Land Use Policy 2016, 50, 312–327. [Google Scholar] [CrossRef]
- Modica, G.; Pratico, S.; Laudari, L.; Ledda, A.; Di Fazio, S.; De Montis, A. Implementation of multispecies ecological networks at the regional scale: Analysis and multi-temporal assessment. J. Environ. Manag. 2021, 289, 112494. [Google Scholar] [CrossRef] [PubMed]
- Zhou, S.Q.; Zhao, K. Evaluation on the effect of grassland degradation ecological restoration project: A new perspective of heterogeneous farmers and herdsmen’s satisfaction. J. Arid Land Resour. Environ. 2019, 33, 43–49. [Google Scholar] [CrossRef]
- Luo, M.; Zhou, Y.; Ju, Z.S.; Wei, H.B.; Zhang, S.W. Technological model and benefit pre-evaluation of eco-environmental rehabilitation engineering of typical mines in the Nanling area of Northern Guangdong Province under the pilot framework of the eco-restoration of mountains-rivers-forests-farmlands-lakes-grasslands. Acta Ecol. Sin. 2019, 39, 8911–8919. [Google Scholar] [CrossRef]
- Ye, Y.S.; Lin, Y.B.; Liu, S.C.; Luo, M. Social-ecological system (SES) analysis framework for application in ecological restoration engineering of mountains-rivers-forests-farmlands-lakes-grasslands: Utilizing the source area of Qiantang River in Zhejiang Province as an example. Acta Ecol. Sin. 2019, 39, 8846–8856. [Google Scholar] [CrossRef]
- Wu, W.; Li, C.X.; Chen, X.C. Evaluation of the effectiveness of a coastal ecological restoration project based on ecosystem services: A case study on Yingwuzhou Wetland, China. J. East China Norm. Univ. (Nat. Sci.) 2020, 211, 98–108. [Google Scholar] [CrossRef]
- Zhu, L.Y.; Chen, Y.Y.; Wang, Y.W.; Wang, C.R.; Wei, Y.S.; Zhang, W.; Chu, T.C. Impact Assessment of the Ecological Restoration Project on Qingjing Lake in Tianjin. J. Hydroecol. 2022, 43, 18–24. [Google Scholar] [CrossRef]
- De la Rosa-Velazquez, M.I.; Ruiz-Luna, A. Social valuation of the ecosystem services from coastal wetlands: Current status and perspectives. Acta Biol. Colomb. 2021, 25, 403–413. [Google Scholar] [CrossRef]
- Dan, Y.Z.; Peng, J.; Zhang, Z.M.; Xu, Z.H.; Mao, Q.; Dong, J.Q. Territorially ecological restoration zoning based on the framework of degradation pressure, supply state and restoration potential: A case study in the Pearl River Delta region. Acta Ecol. Sin. 2020, 40, 8451–8460. [Google Scholar]
- Yang, Q.Y.; Zhang, H.Z.; Tang, Q. Ecological restoration zoning of territorial space in Chongqing City based on adaptive cycle model. ACTA Geogr. Sin. 2022, 77, 2583–2598. [Google Scholar] [CrossRef]
- Tu, J.L.; Hou, D.R.; Chen, Y.R.; Ding, M.T.; An, W.Y.; Liu, W.P.; Zhu, C.Y. Systematic identification and restoration of key areas for ecological restoration of territorial space: A case study of Caidian District, Wuhan City. J. Huazhong Agric. Univ. 2022, 41, 47–55. [Google Scholar] [CrossRef]
- Zhou, J.; Wang, H.W.; Tan, B.; Ma, C.; Wang, X.Q.; Dai, X.Y. Construction of ecological security pattern and identification of ecological rehabilitation zones in Kaidu River Basin. Acta Ecolo Gicasinica 2022, 42, 10127–10137. [Google Scholar] [CrossRef]
- Zhang, H.T.; Li, J.L.; Tian, P.; Pu, R.L.; Cao, L.D. Construction of ecological security patterns and ecological restoration zones in the city of Ningbo, China. J. Geogr. Sci 2022, 32, 663–681. [Google Scholar] [CrossRef]
- Sun, R.; Jin, X.B.; Zhao, Q.L.; Han, B.; Zhang, X.L.; Li, H.B.; Hu, J.; Zhou, Y.K. Comprehensive zoning of cultivated land consolidation potential integrating “quality-pattern-function” in China. Trans. Chin. Soc. Agric. Eng. 2020, 36, 264–275. [Google Scholar] [CrossRef]
- Fang, Y.; Wang, J.; Huang, L.Y.; Zhai, T.L. Determining and identifying key areas of ecosystem preservation and restoration for territorial spatial planning based on ecological security patterns: A case study of Yantai city. J. Nat. Resour. 2020, 35, 190–203. [Google Scholar] [CrossRef]
- Wang, P.; Zhao, W. Ecological restoration zoning of territorial space in typical karst region: A case study of Maotiao River Basin in Guizhou. J. Nat. Resour. 2022, 37, 2403–2417. [Google Scholar] [CrossRef]
- Zhai, X.; Lan, A.J.; Liao, Y.; Mao, C.Y.; Shi, H.J.; Zhong, J.S. Quantitative Identification of Key Areas of Land Space Ecological Restoration Based on the Ecological Security Pattern-A Case Study of Guizhou Province. Res. Soil Water Conserv. 2022, 29, 322–329+343. [Google Scholar] [CrossRef]
- Ishtiaque, A.; Myint, S.W.; Wang, C. Examining the ecosystem health and sustainability of the world’s largest mangrove forest using multi-temporal MODIS products. Sci. Total Environ. 2016, 569, 1241–1254. [Google Scholar] [CrossRef]
- Tang, X.M.; Pan, Y.C.; Hao, X.Y.; Liu, Y. Calculation method of cultivated land consolidation ecological potential in China. Trans. Chin. Soc. Agric. Eng. 2015, 31, 270–277. [Google Scholar] [CrossRef]
- Zhang, R.J.; Jiang, G.H.; Zhou, D.Y.; Sun, F.G.; Wang, X.P. Calculation method of qualitative potential of farmland consolidation. Trans. Chin. Soc. Agric. Eng. 2013, 29, 238–244. [Google Scholar] [CrossRef]
- Guan, X.K.; Zhang, F.R.; Qu, Y.B.; Li, L. Comprehensive Evaluation on the Effects of Spatial-Temporal Allocation of Rural Residential Area Consolidation in Beijing City. China Land Sci. 2010, 24, 30–35. [Google Scholar] [CrossRef]
- Sun, J.W.; Luo, J.; Kong, X.S.; Cui, J.X.; Tian, Y. Zoning and Potential Calculation for Rural Settlements Consolidation In Qinba Mountainous Area Based On Spatial Characteristics. Hum. Geogrephy 2017, 32, 80–87+94. [Google Scholar] [CrossRef]
- Zhai, X.Q.; Su, L.; Pei, J.B.; Wang, J.K. Subarea Utilization of Cultivated Land and Zoning of Its High-Standard Farmland Construction in Liaoning Province. Chin. J. Soil Sci. 2015, 46, 1056–1062. [Google Scholar] [CrossRef]
- Wang, K.; Li, L.; Li, P. Study on High-standard Farmland Construction Based on Ecological Security and Food Security. J. Ecol. Rural Environ. 2021, 37, 706–713. [Google Scholar] [CrossRef]
- Yi, H.J.; Zhang, X.P.; He, L.; Zou, Y.D.; Lv, D.; Xu, X.M.; He, J.; Wang, Y.C.; Tian, Q.L. Vegetation restoration potential and land use change in different geomorphological areas of the Loess Plateau. Trans. Chin. Soc. Agric. Eng. 2022, 38, 255–263. [Google Scholar] [CrossRef]
- Zhao, G.J.; Mu, X.M.; Tian, P.; Gao, P.; Sun, W.Y.; Xu, W.L. Prediction of Vegetation Variation and Vegetation Restoration Potential in the LoessPlateau. J. Soiland Water Conserv. 2021, 35, 205–212. [Google Scholar] [CrossRef]
- Gao, H.D.; Pang, G.W.; Li, Z.B.; Cheng, S.D. Evaluating the potential of vegetation restoration in the Loess Plateau. ACTA Geogr. Sin. 2017, 72, 863–874. [Google Scholar] [CrossRef]
- Zhang, D.; Wang, Y.Y.; Yu, W.W.; Ma, Z.Y.; Chao, B.X.; Chen, G.C.; Chen, B.; Hu, W.J. Assessment of the habitat suitability and restoration potential of mangroves in Xiamen Bay, China. J. Appl. Oceanogr. 2021, 40, 43–55. [Google Scholar]
- Chávez, M.V. Mangrove Ecological Corridor Restoration of the Mangrove Ecosystem—Case Study: Municipalities of Eloy Alfaro and Rioverde in Ecuador; Universidade de Lisboa: Lisboa, Portugal, 2018. [Google Scholar]
- Zhou, M.; Oi, Z.X.; Lv, J.W.; Liu, X. Ecological Restoration Potential of Abandoned Industrial and Mining Areas-A Case Study of Shuikoushan Township. J. Northwest For. Univ. 2021, 36, 273–281. [Google Scholar] [CrossRef]
- Gao, J.L.; Hao, Y.G.; Ding, G.D.; Liu, F.; Xin, Z.M.; Xu, J.; Zhang, J.B.; Zhao, Y.M. Primary assessment on the wind-breaking and sand-fixing function of the vegetation and its value in Ulan Buh desert ecosystem. J. Arid Land Resour. Environ. 2013, 27, 41–46. [Google Scholar] [CrossRef]
- Liu, H.Y.; Lin, M.; Zhou, R.B.; Zhong, L. Spatial and temporal evolution of habitat quality in Guangdong-Hong Kong-Macao Greater Bay Area based on InVEST model. Ecol. Sci. 2021, 40, 82–91. [Google Scholar] [CrossRef]
Disclaimer/Publisher’s Note: The statements, opinions and data contained in all publications are solely those of the individual author(s) and contributor(s) and not of MDPI and/or the editor(s). MDPI and/or the editor(s) disclaim responsibility for any injury to people or property resulting from any ideas, methods, instructions or products referred to in the content. |
© 2023 by the authors. Licensee MDPI, Basel, Switzerland. This article is an open access article distributed under the terms and conditions of the Creative Commons Attribution (CC BY) license (https://creativecommons.org/licenses/by/4.0/).