Article

Impacts of Urbanization and Its Parameters on Thermal and Dynamic Fields in Hangzhou: A Sensitivity Study Using the Weather Research and Forecasting Urban Model

1
Zhejiang Institute of Meteorological Sciences, Hangzhou 310008, China
2
State Key Laboratory of Severe Weather, Chinese Academy of Meteorological Sciences, Beijing 100081, China
3
Ocean College, Zhejiang University, Zhoushan 316021, China
*
Author to whom correspondence should be addressed.
Land 2023, 12(11), 1965; https://doi.org/10.3390/land12111965
Submission received: 19 September 2023 / Revised: 19 October 2023 / Accepted: 21 October 2023 / Published: 24 October 2023

Abstract

:
The impact of urbanization and the sensitivity of urban canopy parameters (UCPs) on a typical summer rainfall event in Hangzhou, China, is investigated using three groups of ensemble experiments. In this case, urbanization leads to higher temperatures, lower mixing ratios, lower wind speeds before precipitation, and more precipitation in and around the urban area. Both the thermal and dynamical effects of urbanization contribute to an increase in temperature and precipitation, with thermal effects contributing 71.2% and 63.8% to the temperature and precipitation increase, respectively, while the thermal and dynamical impacts cause the opposite changes to the mixing ratio and wind speed. Compared to the other three meteorological elements, the model has the largest uncertainty in the simulation of precipitation, which includes the sensitivity of the different parameterization schemes to the simulation of precipitation in urban areas, and the uncertainty brought by the urban effect on precipitation is not confined within the city but extends to the surrounding areas as well. Temperature and mixing ratio are more sensitive to thermal-related UCPs, while the wind speed is mainly affected by the structural parameters. These variations, however, are sometimes contradictory to precipitation changes, which further adds to the complexity of precipitation simulation.

1. Introduction

Land cover and land use (LCLU) changes disrupt surface energy fluxes and thus interfere with exchanges of heat, water, and aerosols between the land surface and the atmosphere [1]. Of all the underlying surface types, large cities are experiencing the highest intensity of LCLU changes, which leads to a series of climate and environmental issues, such as urban heat islands (UHIs) [2,3,4], extreme rainfall [5,6], and air pollution [7,8]. With rapid urbanization occurring since the late last century, many observational studies show statistically significant increases in the frequency of short-duration extreme rainfall in major megacities during the warm season [9,10]. In addition, most of the extreme rainfall events take place under the influences of warm and wet airstreams with weak baroclinicity [11,12,13].
In the last few years, our understanding of the impact of urbanization has greatly advanced thanks to Numerical Weather Prediction (NWP) models [14,15,16]. To consider the effects of urban areas within NWP models, different parameterizations have been developed, for example, the single-layer urban canopy model (SLUCM) [17,18] and building effect parameterization (BEP) [19], to take into account urban-scale processes within mesoscale models, and they are currently implemented in the Weather Research and Forecasting (WRF) model [20]. In general, urbanization can produce less soil moisture, higher surface temperature, and lower average wind speed [16,21,22]. However, the urban modification of rainfall and its dominant physical mechanisms is more complex [23,24,25]. For example, the UHI magnitude will determine different impacts on precipitation enhancements spatially [26,27]. The strong UHI will increase atmospheric instability in the boundary layer and help transport more water vapor into the upper atmosphere, resulting in both an increased amount and frequency of extreme precipitation over cities [11,28,29]. In contrast, in the presence of strong winds or weak UHI, convective systems usually bifurcate over cities due to the building barrier effect, resulting in reduced rainfall in both urban centers and downwind areas [30,31]. More studies agree that the impact of urban land cover on precipitation is not only determined by their influence on local convergence but also modulated by large-scale weather systems [32]. For cases with a strong synoptic forcing, the urban impact is relatively weak [33]. When the synoptic forcing is weak, however, the urban impact on local convergence dominates [31]. Therefore, the feedback mechanism of cities to rainfall is highly uncertain.
To correctly perform numerical simulations for assessing the role of cities, an adequate representation of urban canopy parameters (UCPs) is required [34,35,36]. In fact, the urban morphology determined by UCPs can greatly affect the thermal and dynamical fields in urban areas [37]. For instance, the increased surface roughness due to the construction of buildings plays a positive role in convective initiation/enhancement [38], evapotranspiration decreases by changing vegetated surfaces into impervious surfaces [39], and the decreased surface albedo, increased building height, and increased anthropogenic heat release are sensitive to surface temperature [40,41] and UHI intensity [42]. These altered environmental factors can further influence when, where, where, and how intense urban precipitation occurs [43]. Some studies further suggest that the relationship between model performances and UCPs varied in different weather conditions and meteorological elements. For example, the impacts of updating urban fraction and urban morphology were obvious on wind speed but minor on temperature and humidity in both Beijing and Guangzhou, China [44,45]. The LCLU changes due to urban expansion lead to a reduction in precipitation in the Beijing–Tianjin–Hebei metropolitan region [46,47] but an increase in the Yangtze River Delta [48,49] and the Guangdong–Hong Kong–Macao Greater Bay Area [50,51]. However, these studies mainly focus on the impact of changes in either a single UCP or the entire UCP dataset on the urban environment; a diagnostic analysis of isolating the contributions of these UCPs on the thermal and dynamic fields has been conducted fewer times.
To better explain why the modeling of precipitation in urban areas has large uncertainties and how urbanization affects precipitation, three sets of sensitivity simulations, including changes in parameterization schemes, LCLU, and UCPs, are carried out to study a typical summer heavy rainfall event over the city of Hangzhou, China. Hangzhou had an urban (impervious) surface area of around 8289 km2 and a permanent population of 12.3 million in 2022 (Zhejiang Statistical Bureau; http://tjj.zj.gov.cn/col/col1525563/index.html accessed on 20 July 2023). Wide roads and high-rise buildings are being constructed in Hangzhou, which changes the physical properties of the underlying surface and has a great impact on the urban environment [52]. Located in the Yangtze River Delta adjacent to the coast, Hangzhou, like many other major cities on the east coast of China, is quite vulnerable to local heavy precipitation that occurs abruptly. These factors make the city ideal for investigating the urban mechanisms responsible for local heavy rainfall modification. The paper is organized as follows: The description of the synoptic background, model configuration, and sensitivity experiments are given in Section 2. Section 3 evaluates the performance of the model and discusses the impacts of urbanization and UCPs on this rainfall event. The discussion and conclusion are presented in Section 4 and Section 5, respectively.

2. Materials and Methods

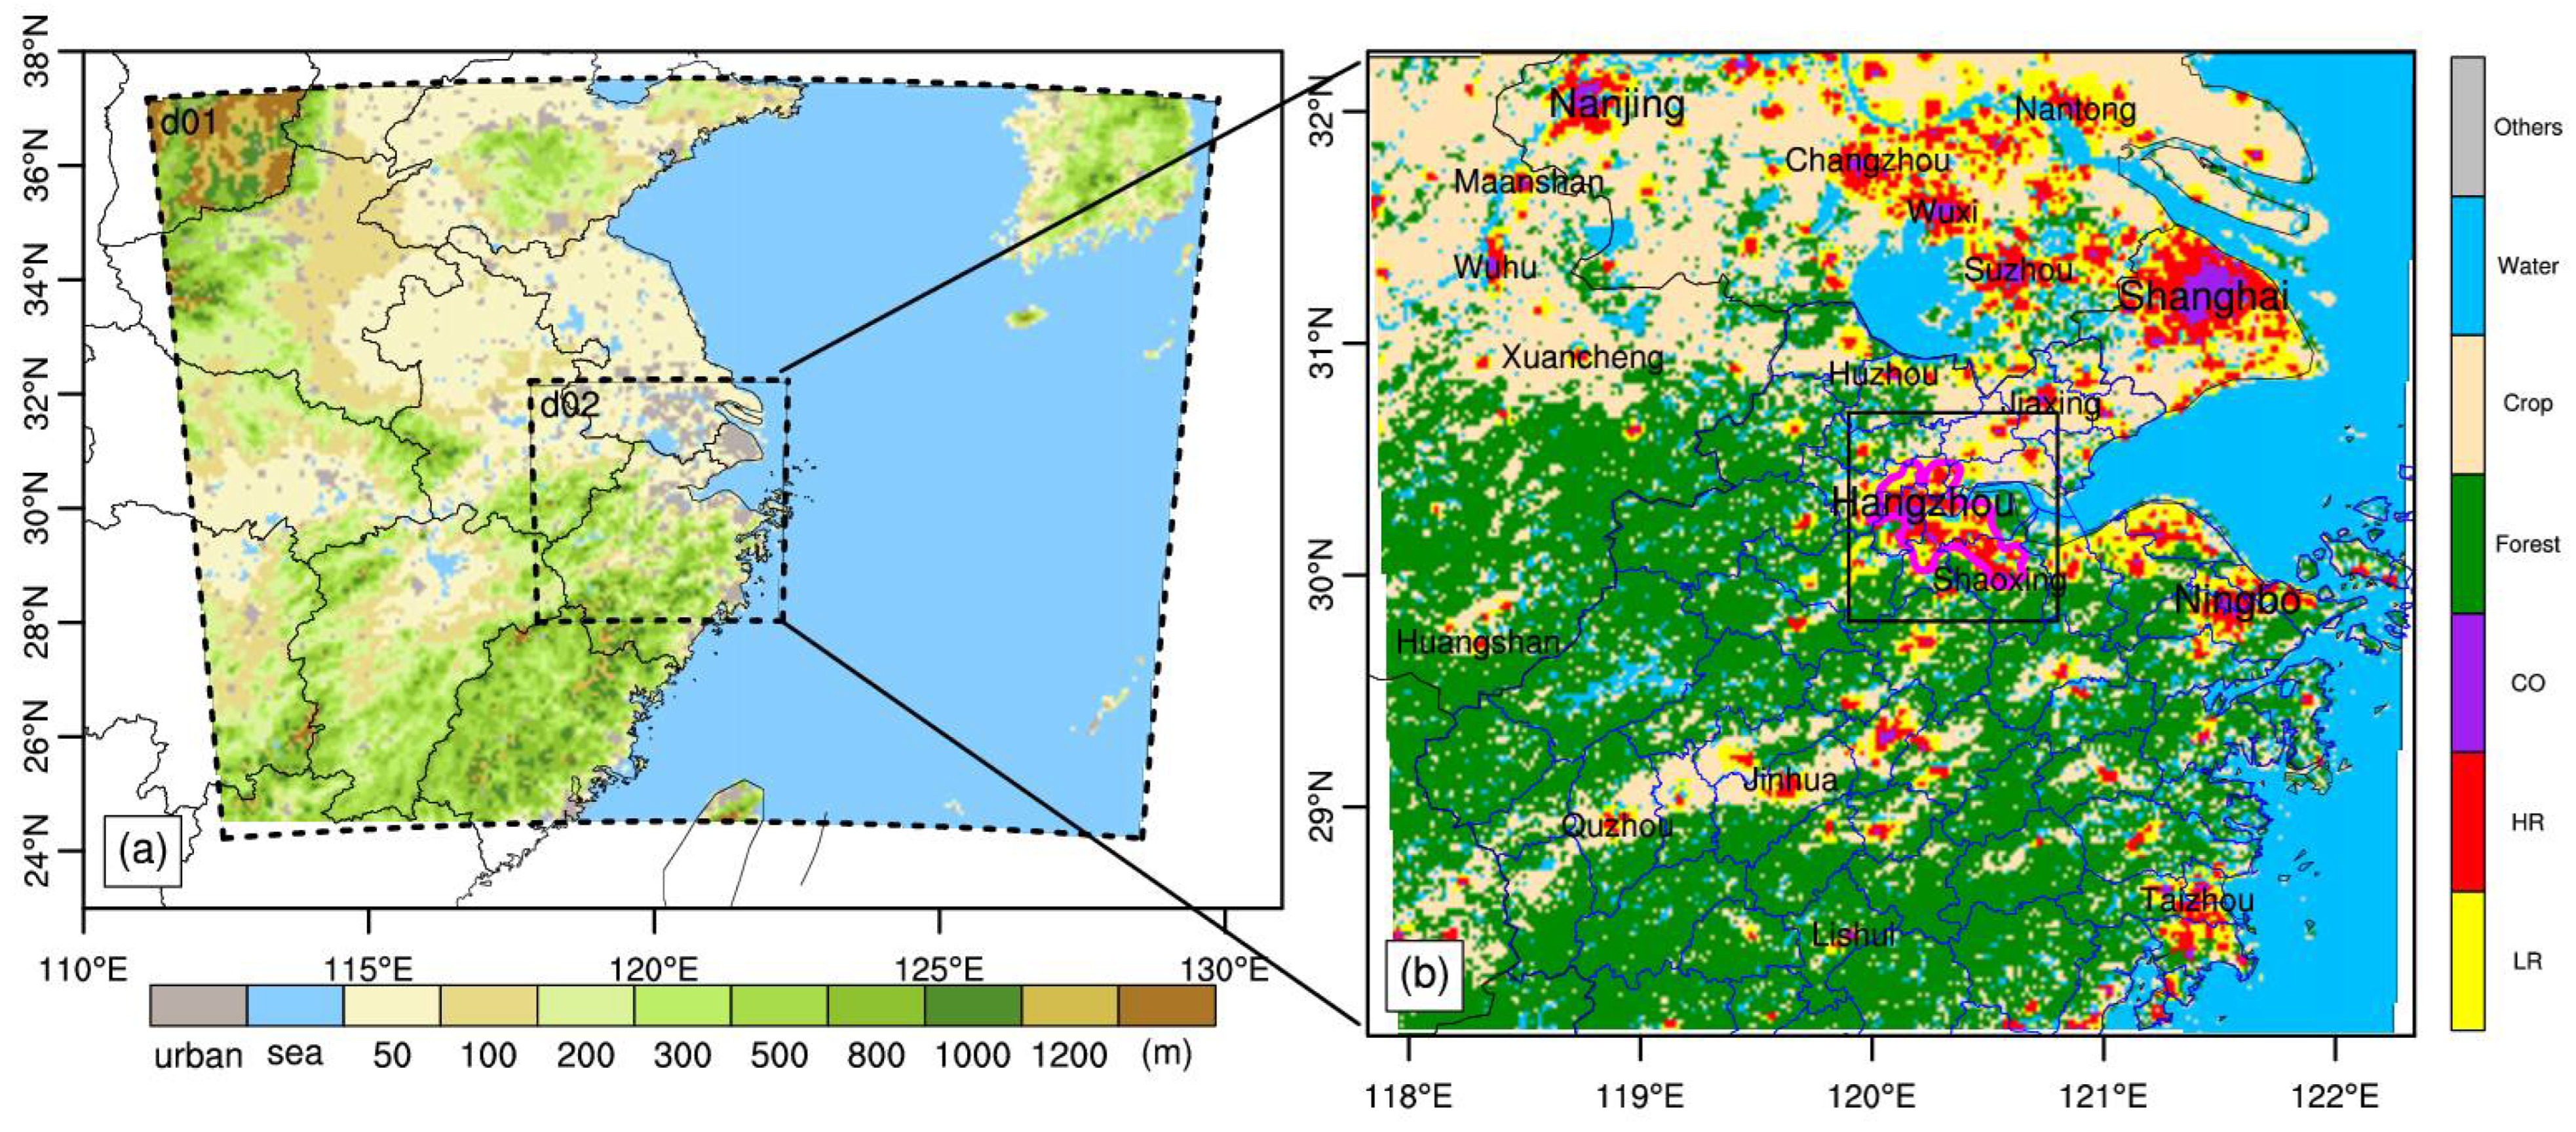
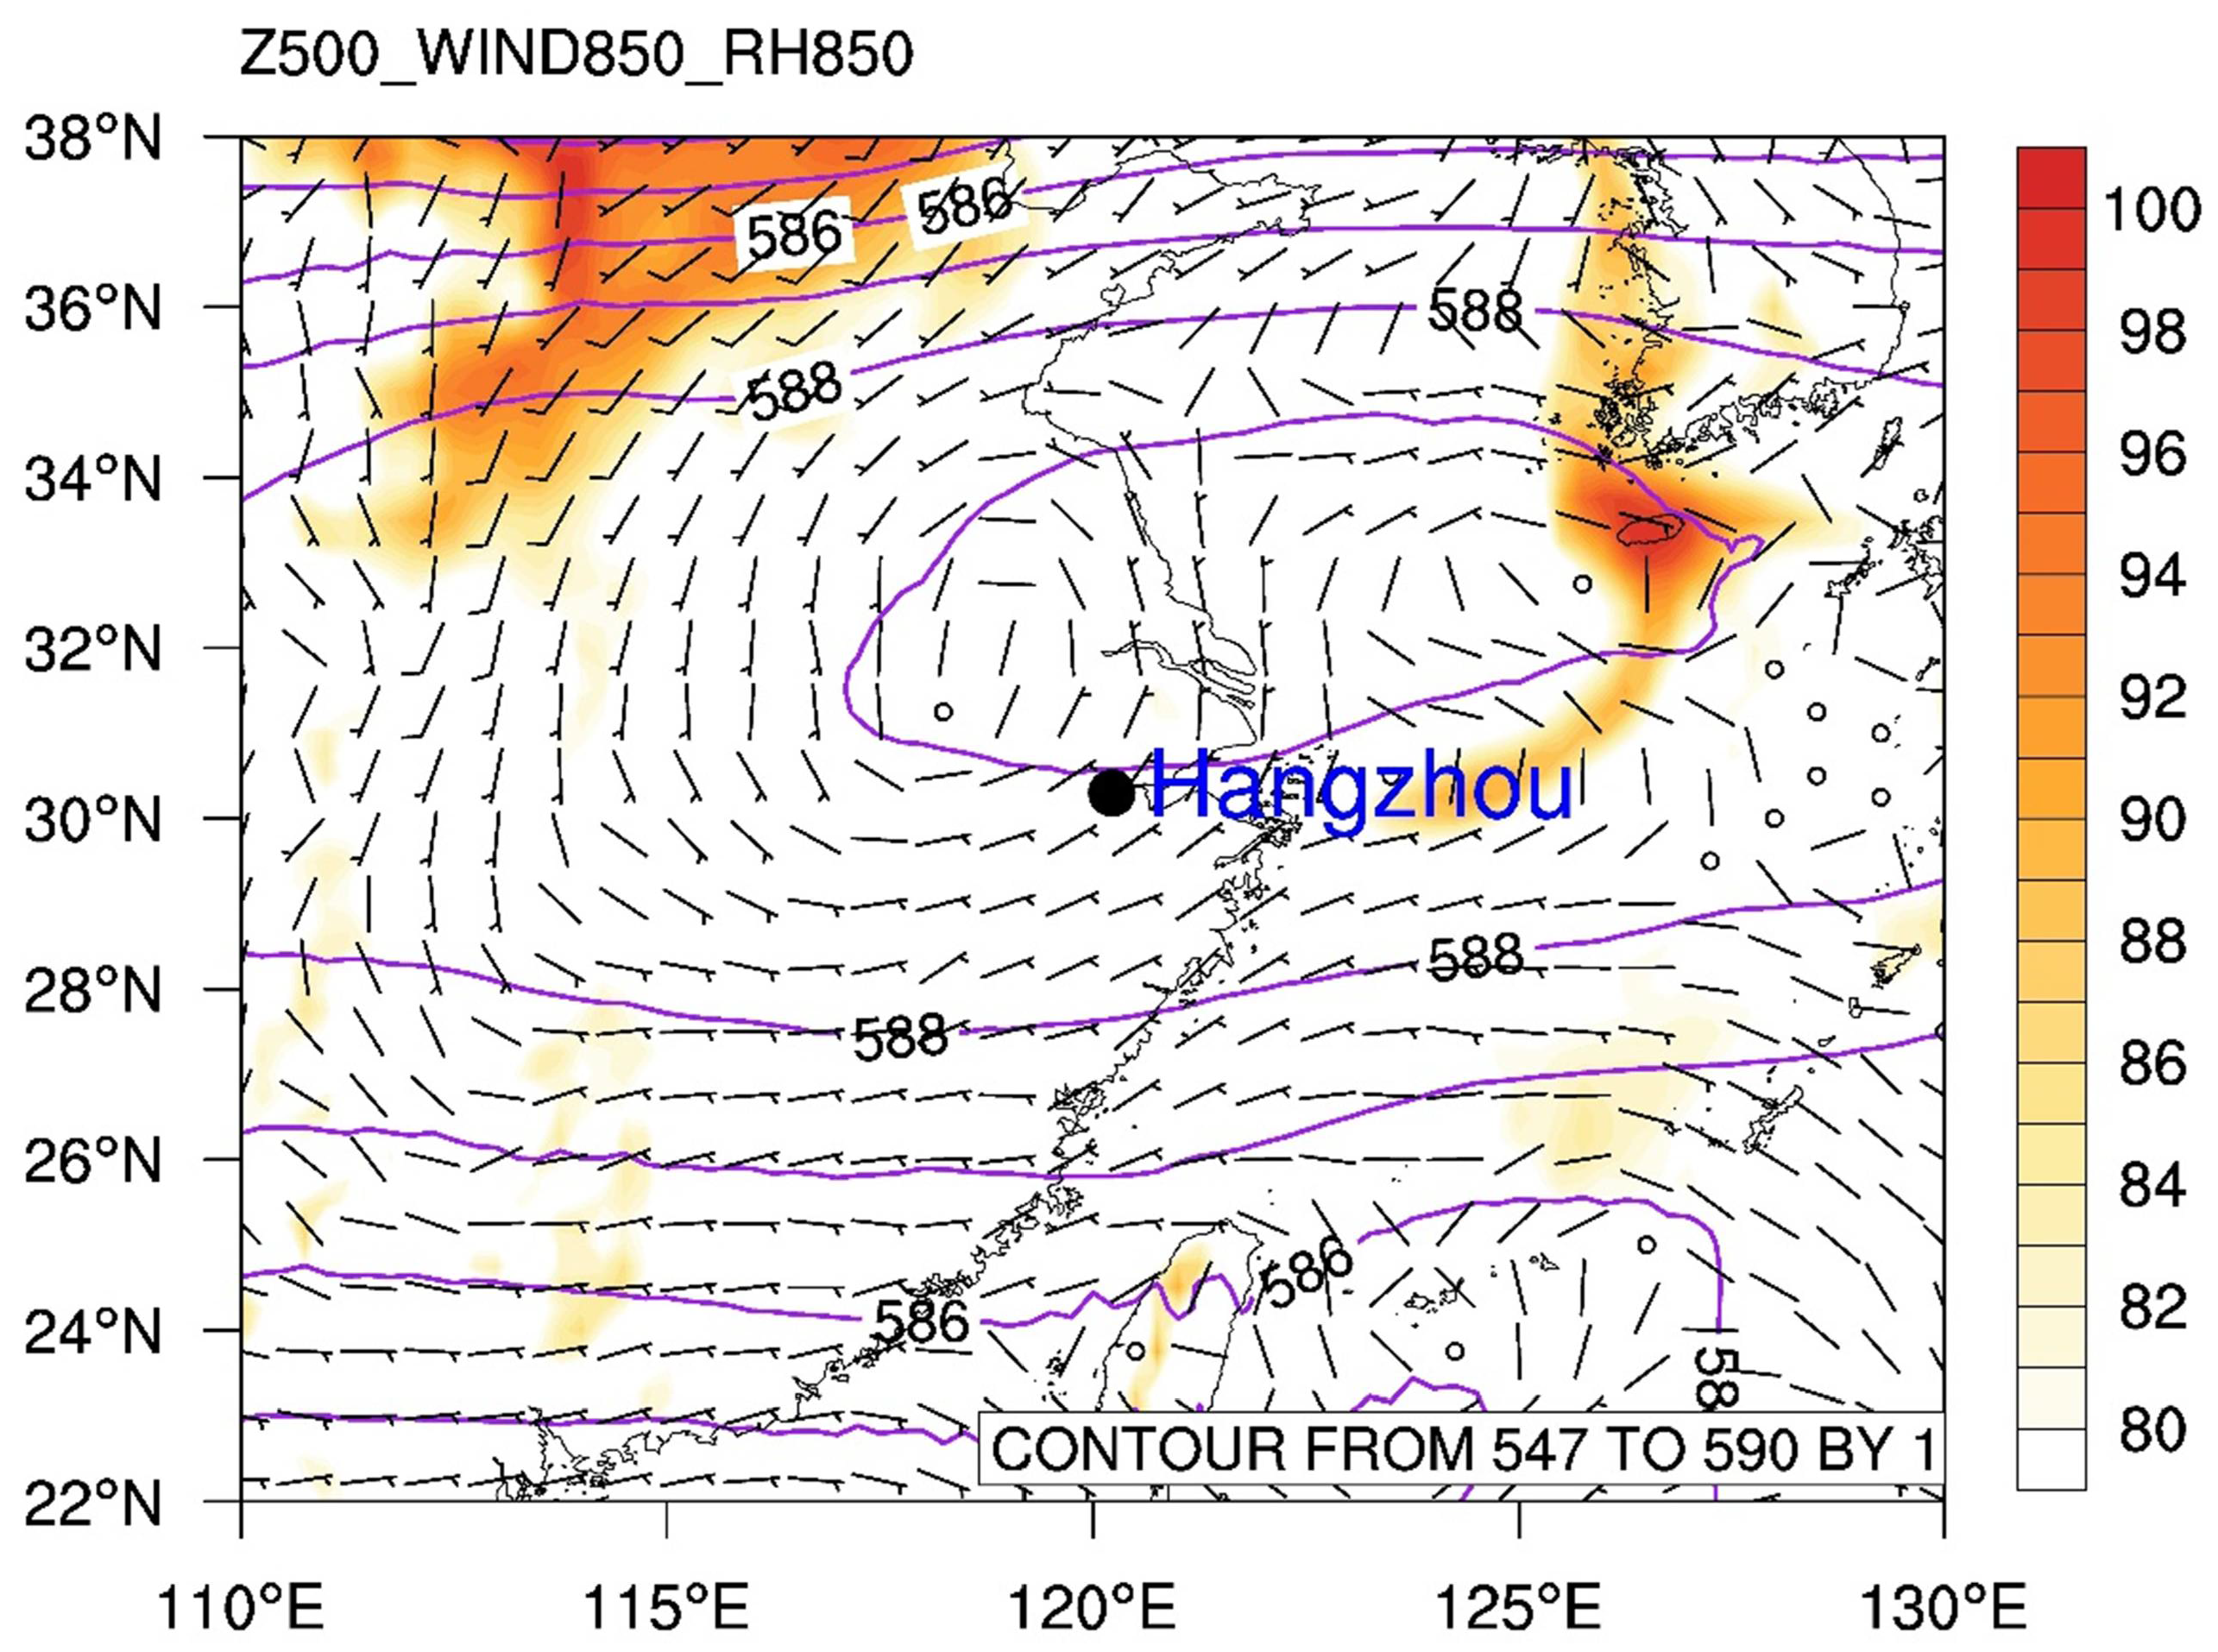
2.1. Synoptic Background

The selected summer rainfall case occurred between 13:00 and 18:00 Beijing Standard Time (BST; +8 h Coordinated Universal Time) on 26 July 2018, with a maximum hourly rainfall amount exceeding 114.7 mm at Liancheng Station (30.367° N, 120.283° E) near downtown Hangzhou. Before and during this event, Hangzhou was dominated by the uniform West Pacific subtropical high-pressure system, with relatively weak winds and less favorable moisture conditions (Figure 1). Moreover, high-temperature phenomena (≥38 °C at 10:00 BST) were observed in Hangzhou before the precipitation. The UHI intensity reached up to 0.77 °C during 10–13 BST, which is larger than the historical 10-year average (2012–2021) UHI intensity (0.48 °C) of Hangzhou in the same period in summer. This synoptic pattern is not conducive to forming regional rainfall but is favorable to initiating local rainfall. Therefore, this case is suitable to study the impacts of urbanization on local heavy precipitation and the prior environmental conditions.

2.2. Model Configuration

The model used in the current study is the WRF-ARW coupled with urban model version 4.0.2 (http://www2.mmm.ucar.edu/wrf/users accessed on 1 May 2021), which is widely used for mesoscale numerical simulation research around the world [53]. Figure 2a shows the terrain of our study area and the location of Hangzhou. All the simulations have two one-way nested domains centered at (31.0° N, 120.5° E), with a horizontal grid spacing (grid numbers) of 4 km (353 × 403) and 1 km (457 × 413), respectively. The vertical coordinate contains 51 full-sigma levels from the surface to 10 hPa. Approximately eight of these levels are designed below 1 km to provide a fine vertical resolution within the planetary boundary layer, and the lowest half-sigma level height is approximately 35 m above ground. The black rectangle box (119.9–120.8° E, 29.8–30.7° N) in Figure 2b is referred to as the control region in this study, as both the urban area and heavy precipitation are concentrated in this region.
The description of the model configuration is summarized in Table 1. Considering that the ensemble simulation is a more effective way of assessing the urban impact on local weather [54,55], 24 tests were designed using three microphysical schemes, two planetary boundary layer parameterization schemes, two land surface schemes, and two urban surface schemes, respectively. In addition, the RRTMG [56] is employed for both shortwave and longwave radiation schemes in the simulation. No cumulus parameterization is used, given that the model can resolve deep convective updrafts [53]. All the physical schemes used are identical for both nests.
All the simulations were initialized at 02 BST on 26 July 2018, and integrated for 18 h. The hourly ERA5 reanalysis data [65] with a resolution of 0.25° × 0.25° were used to provide the initial and lateral boundary conditions. No data assimilation or nudging were performed to avoid the influence of other factors. Considering the rapid urban expansion in and around Hangzhou, the default MODIS 20-category land use dataset [66] used in our study was updated by a more inhomogeneous and detailed urban land cover and fraction dataset at 1 km × 1 km resolution [67]. Using this dataset has been proved to better simulate the UHIs [52,67] and extreme rainfall [68] in Hangzhou. The updated land use map is shown in Figure 2b, and the Hangzhou–Shaoxing mega-city with an urban fraction ≥0.2 is highlighted with a magenta solid line.

2.3. Numerical Experiment Design

Three groups of numerical experiments, i.e., GROUP I, II, and III, are designed in our study (Table 2). In GROUP I, there are a total of 24 ensemble members with the same model configurations, except for different combinations of physical parameterization schemes. Every ensemble member is named by the option of the selected physical parameterization schemes, e.g., the name of “m2p2s2u1” represents that Lin (2), MYJ (2), Noah (2), and SLUCM (1) are selected for the microphysics, PBL physics, land surface, and urban physics schemes of this ensemble member, respectively. The control ensemble forecast (ENCTL) includes these 24 members running with the updated real land use data. Another ensemble forecast (referred to as ENNoUB) is designed the same as the ENCTL. However, we replace the urban land use with cropland in each member to investigate the impact of urbanization.
In GROUP II, three sensitivity tests (referred to as NOTH, NODY, and NOUB) are conducted and compared to the control simulation called CTL (the member of “m16p8s4u2” in ENCTL) to investigate the thermal and dynamical effects of urbanization on this event. The NOTH, NODY, and NOUB runs are designed the same as the CTL, but we artificially removed the urban thermal and dynamical effects, respectively. The urban process, as a part of the land surface process, influences the bottom boundary variables in WRF following Equation (1).
V g r i d = V v e g × 1 w u r b + V u r b × w u r b
where  V g r i d  is the variable (e.g., surface temperature) from the surface to the lowest layer of the grid;  V v e g  is the same variable from the land surface model for the natural vegetation surfaces;  V u r b  is the same variable from the urban canopy model for the artificial surfaces; and  w u r b  is the fraction coverage of artificial surfaces. The urban thermal effect is removed by setting  w u r b = 0  for the thermal-related variables, i.e., albedo, surface temperature (TSK), sensible heat flux (HFX), latent heat flux (LH), and ground heat flux (GRDFLX). The dynamical effect is removed by setting  w u r b = 0  for the dynamical-related variables, i.e., friction velocity (UST) and momentum.
In GROUP III, another 16 sensitivity tests (i.e., SEN1, SEN2, …, and SEN16) are conducted. Each sensitivity test is the same as the CTL but with a decrease or increase in one UCP (such as the building height) by 50%. The sensitivity results are compared with the CTL to systematically explore the effects of UCPs on the convective initiation and the prior urban environmental conditions.
The observed meteorological variables, including precipitation, 2 m temperature (T2M), 2 m mixing ratio (Q2M), and 10 m wind speed (WS10M), are derived from the minute-level surface observations maintained by the Zhejiang Meteorological Bureau, China Meteorological Administration. The gauged variables are interpolated into the model grid using the inverse distance-weighted method [69,70]. Thus, the gridded observation data are used for a quantitative evaluation of the model performance. The evaluation of the effect of urbanization on this precipitation event is divided into three components: (1) on the atmospheric conditions (e.g., T2M, Q2M, and WS10M) prior to the rainfall occurrence (from 10:00 to 13:00 BST on 26 July 2018); (2) on the accumulated precipitation (from 13:00 to 18:00 BST on 26 July 2018); and (3) on convective initiation by changes in the UCPs (from 13:00 to 14:00 BST on 26 July 2018).

3. Results

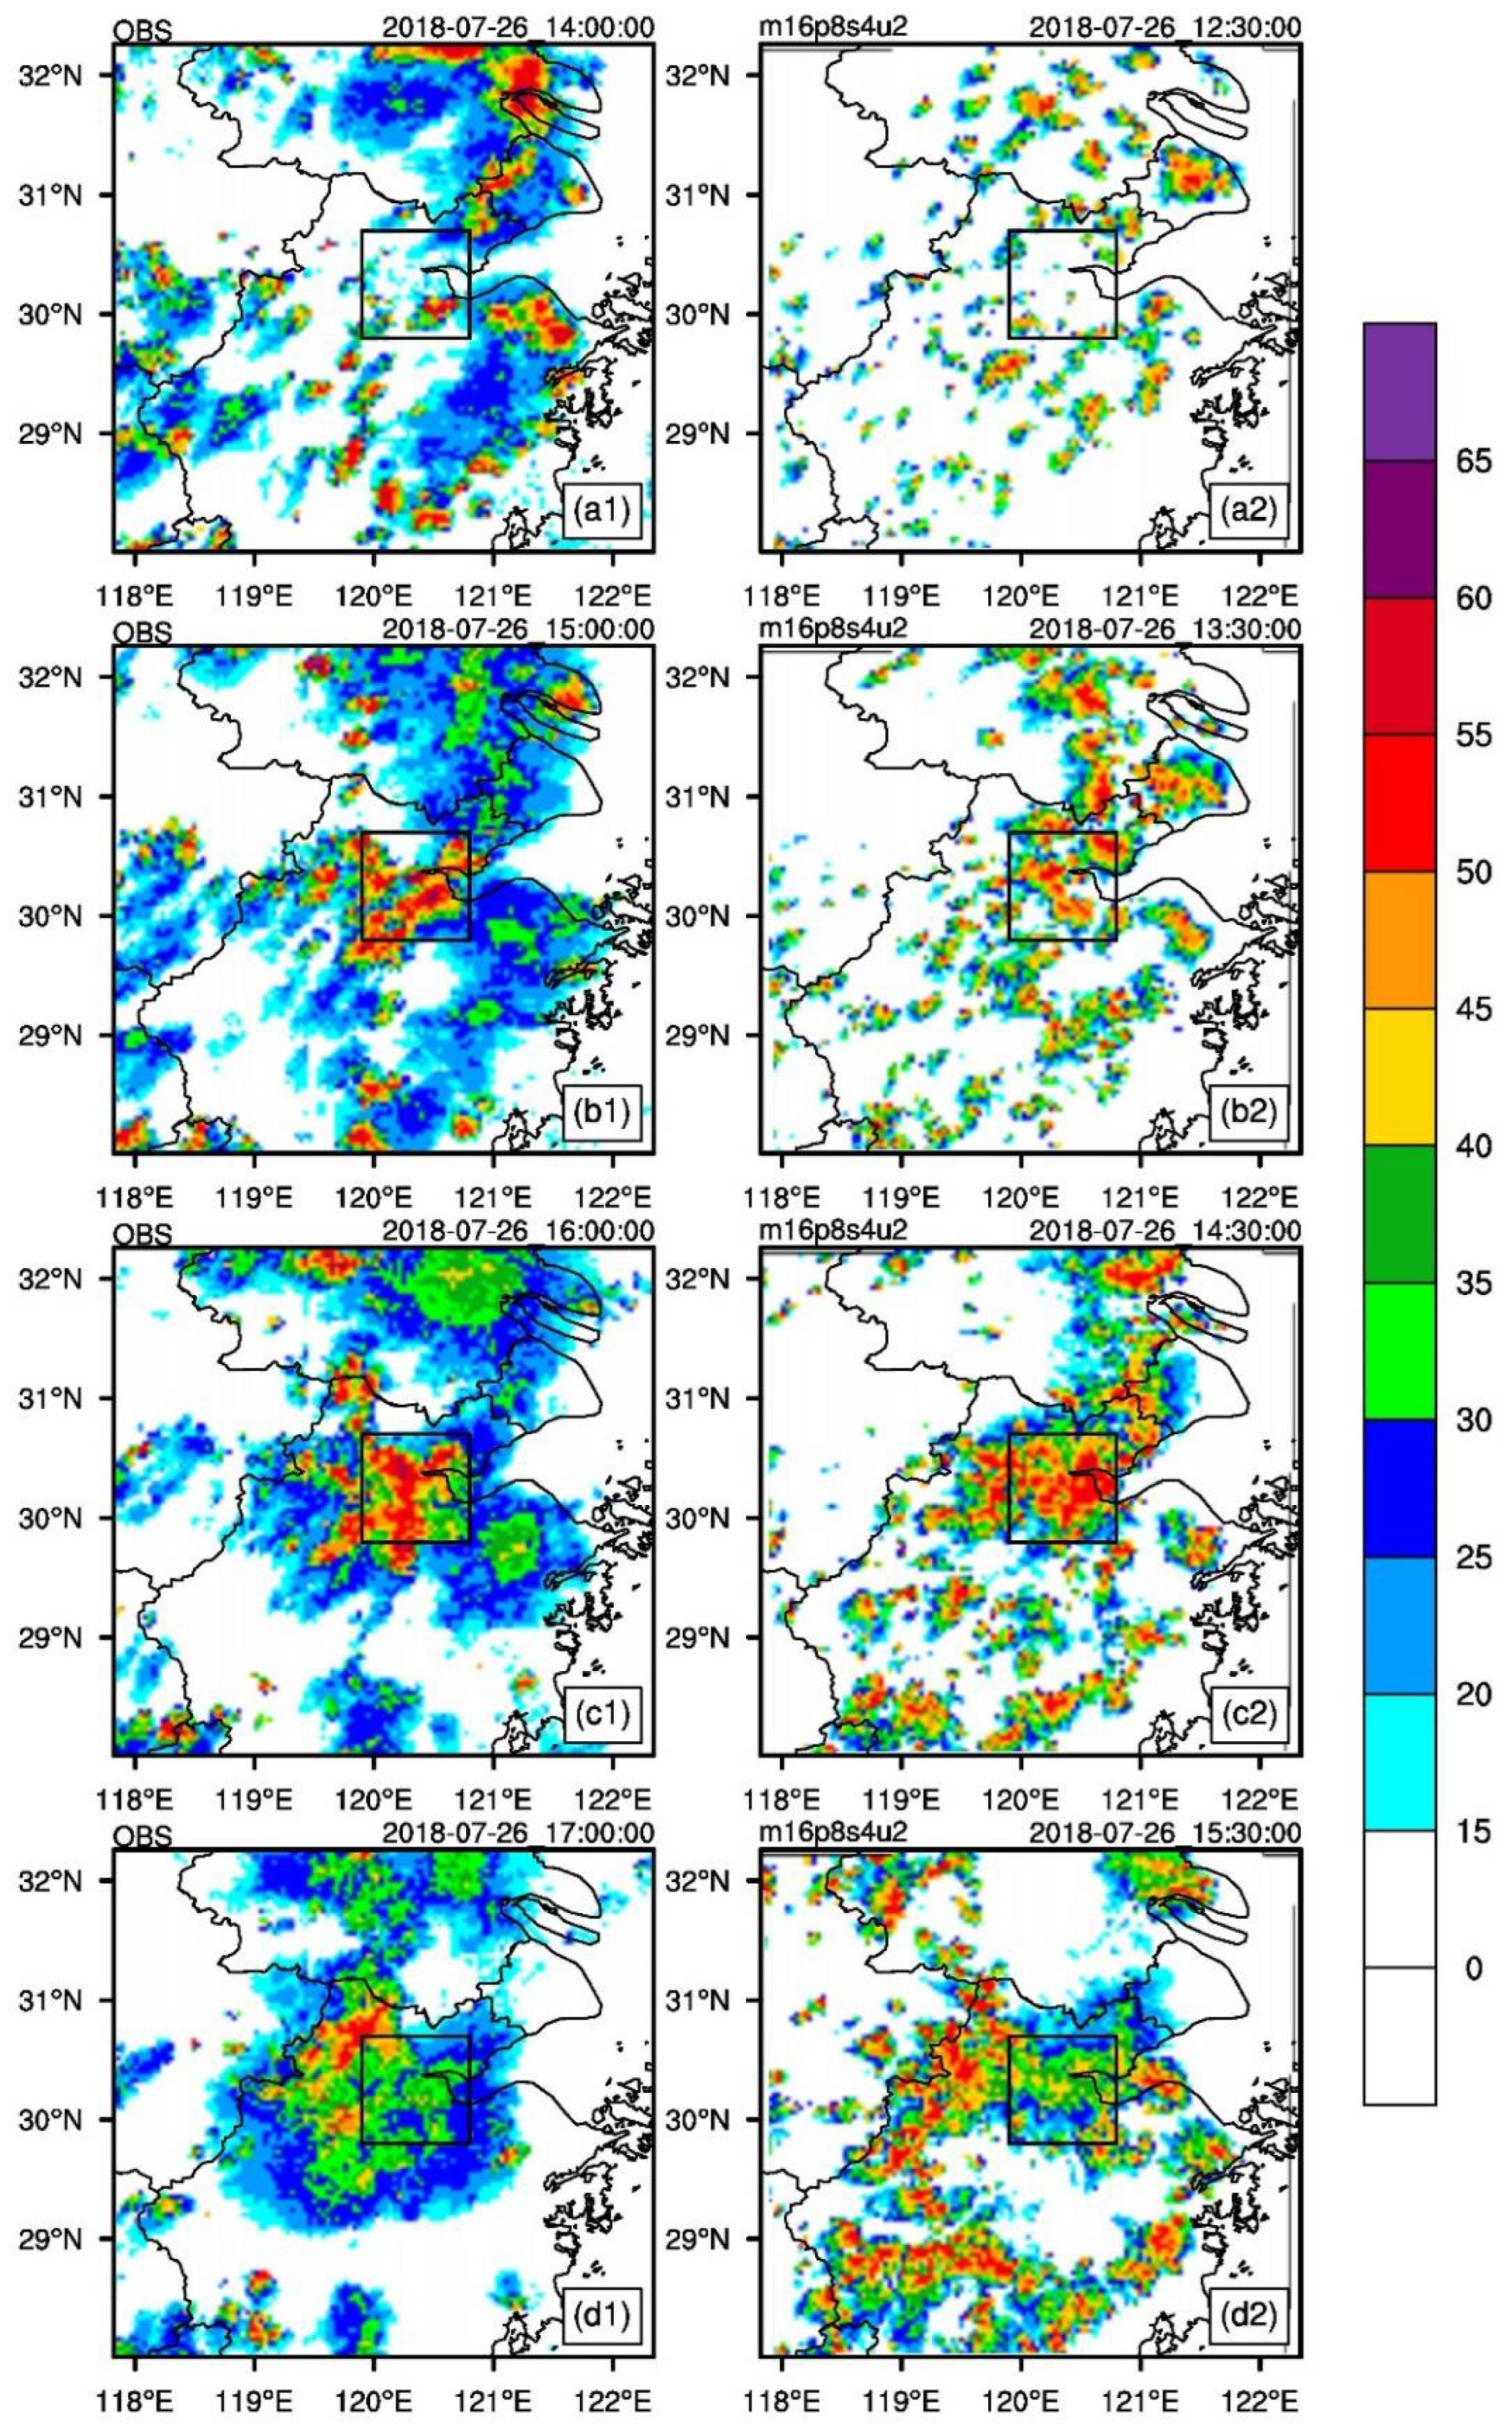
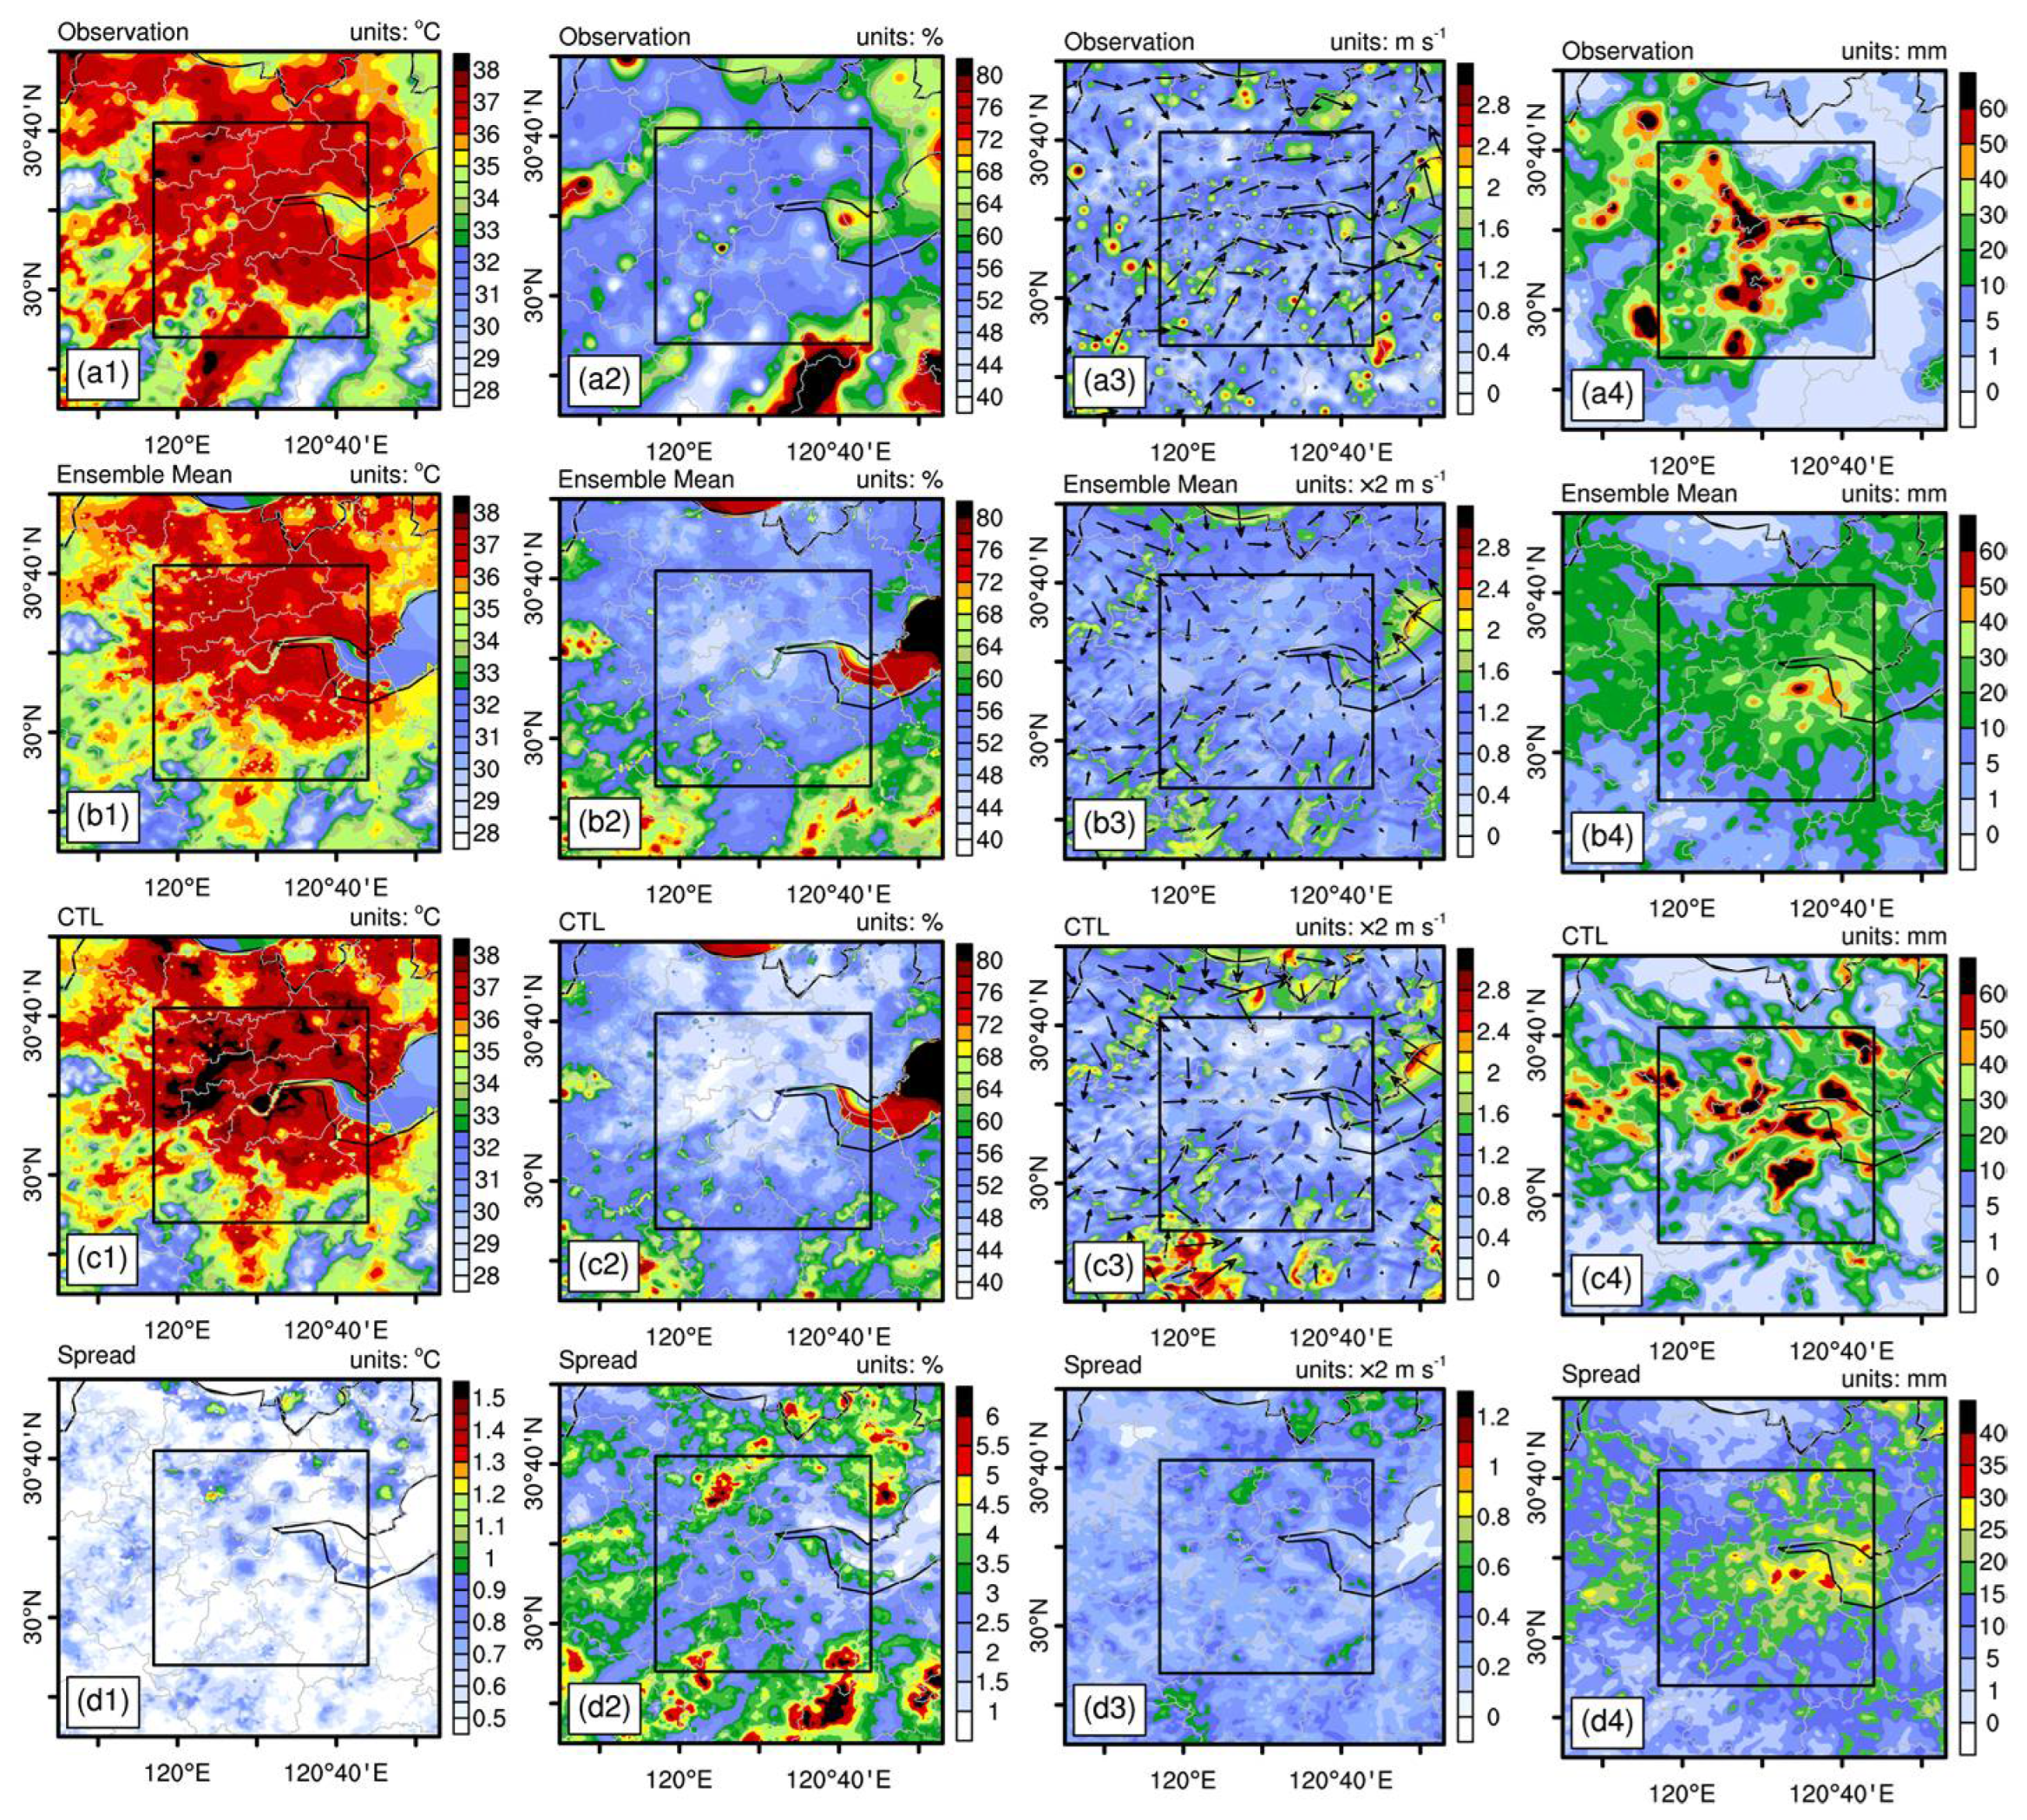
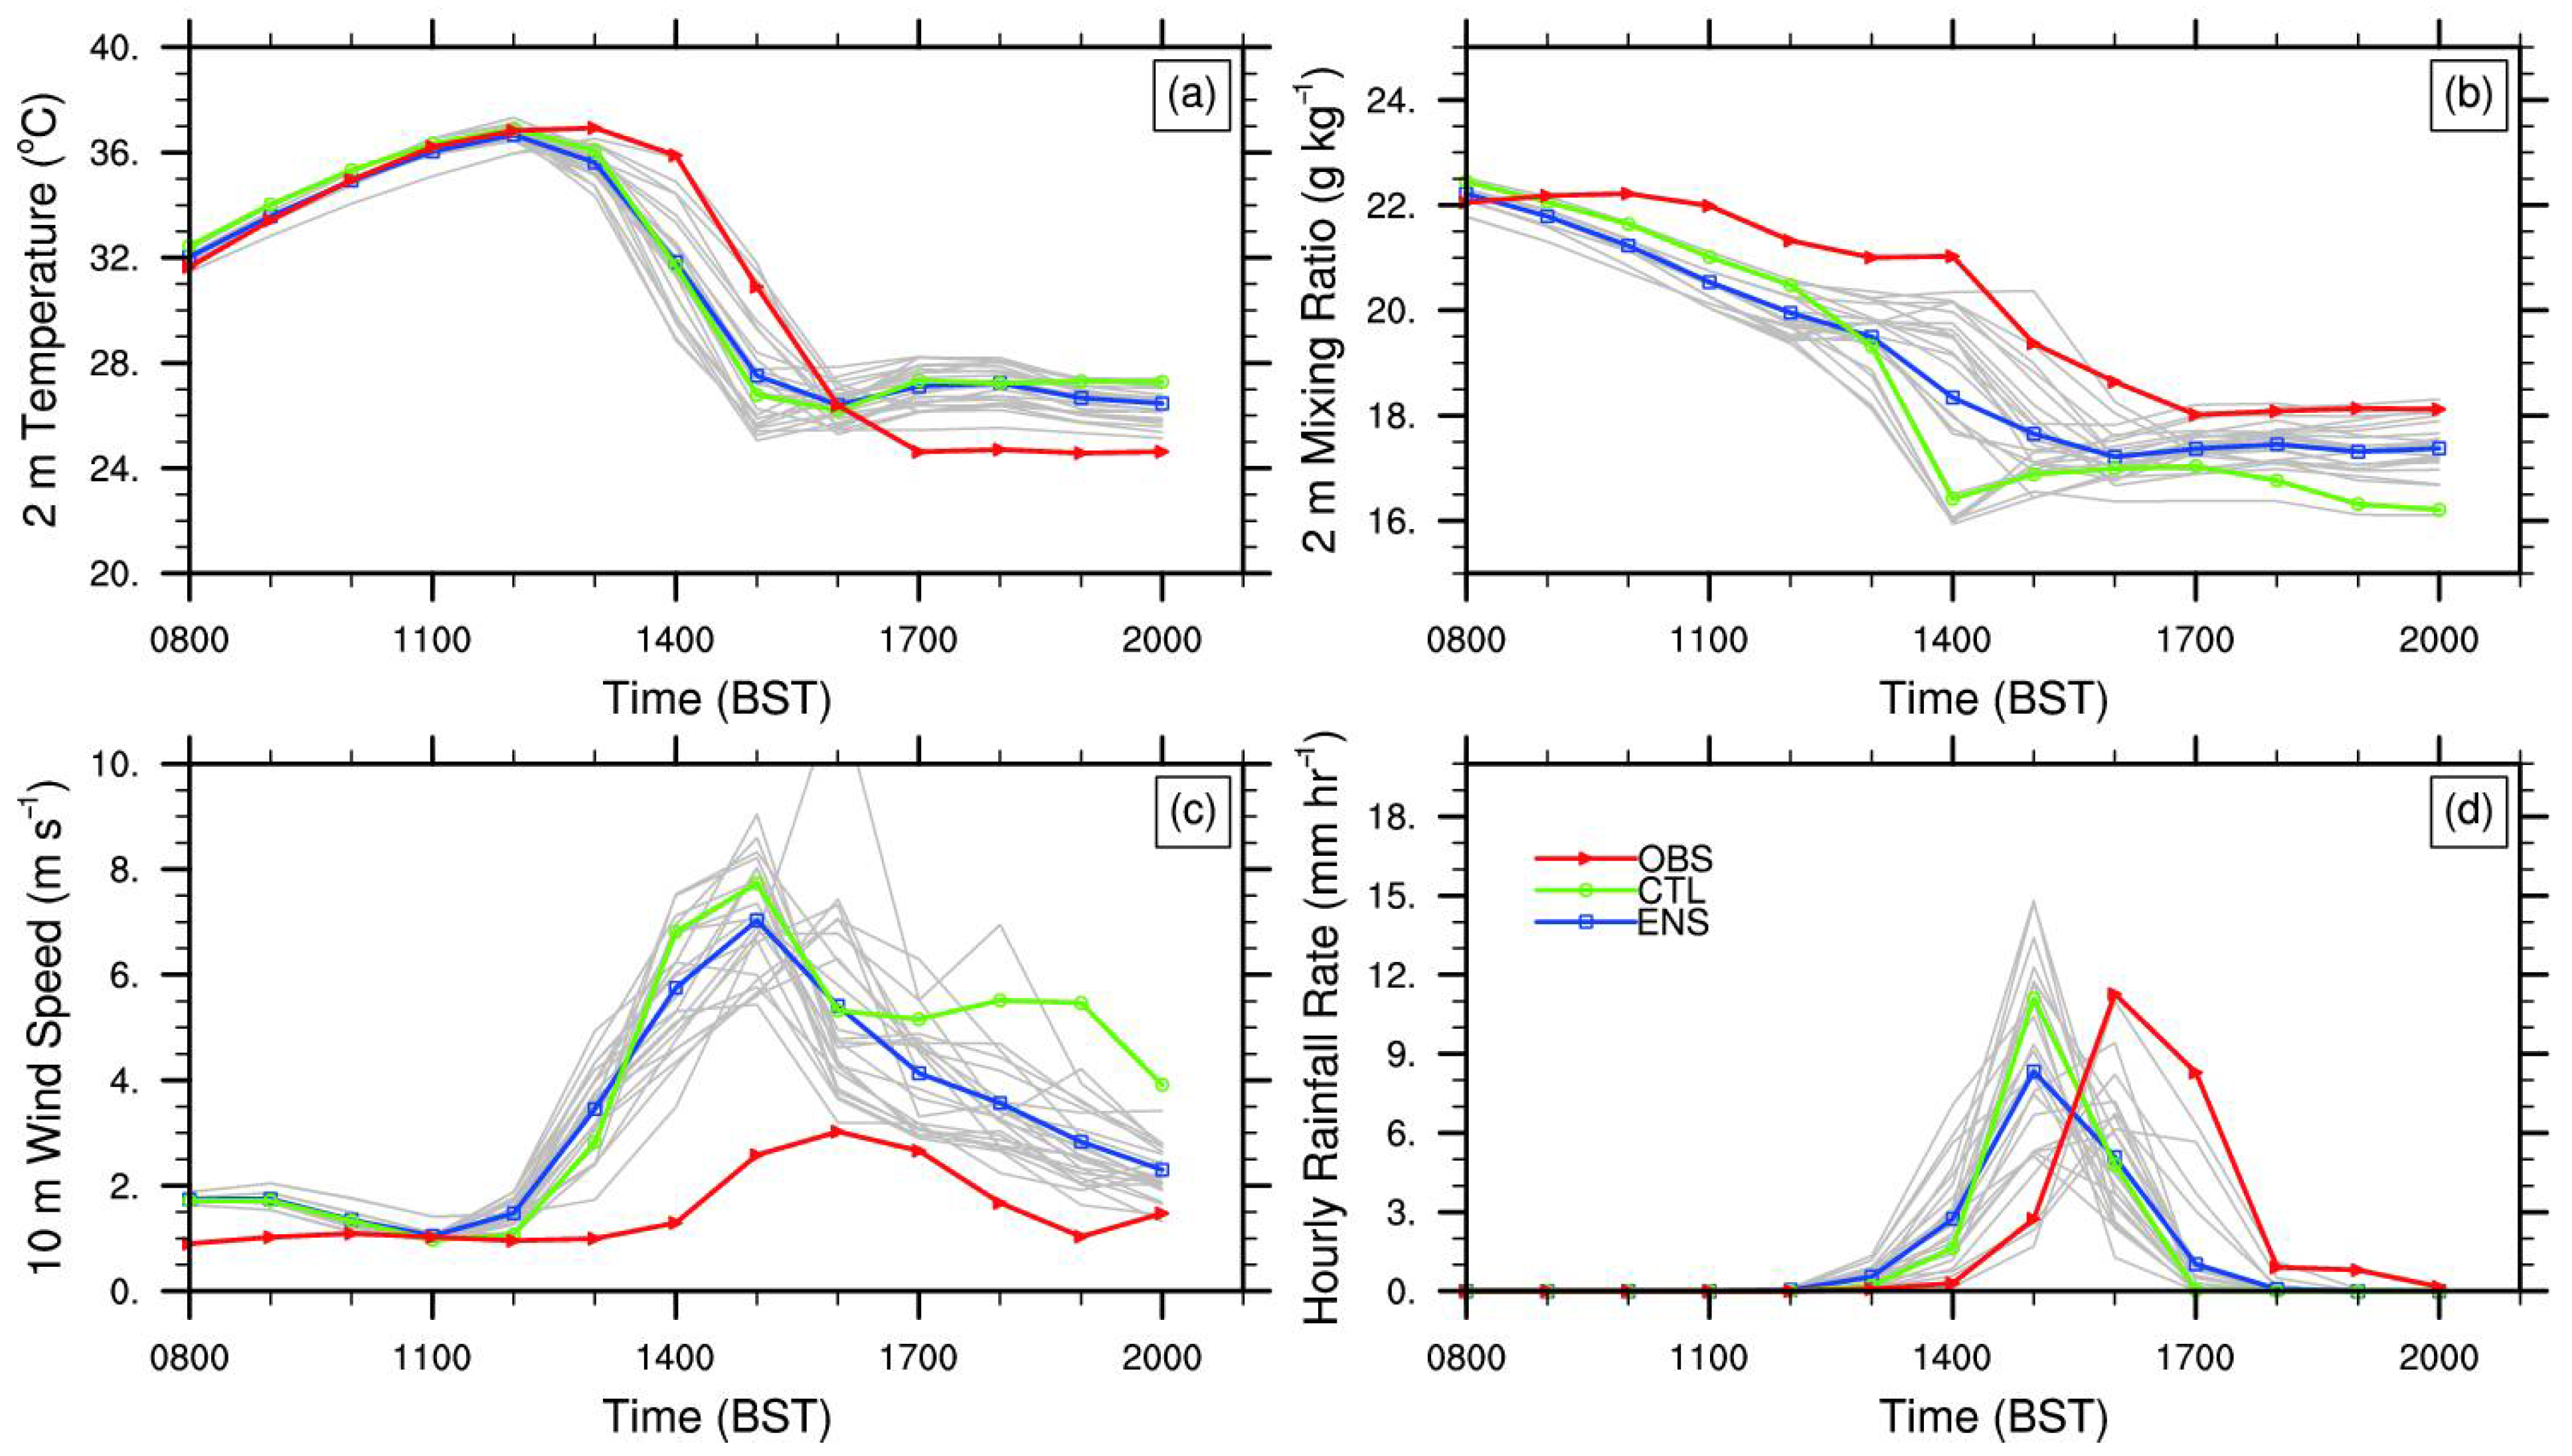
3.1. Evaluation of WRF Simulation

The accumulated precipitation from 13:00 to 18:00 BST on 26 July 2018 is simulated using 24 ensemble tests with different combinations of physical schemes using a map of current land use (ENCTL in Group I). The threat score (TS) is used to evaluate the performance of each test in predicting the accumulated precipitation (Table 3). The TS is defined as follows:
T S = N a N t N b
where Na is the number of simulations that capture the observation, Nb is the number of missing grids, and Nt is the number of total grids, respectively.
The performance of the model in capturing the occurrence of rainfall (≥0.1 mm) is generally good, with an average of TS > 0.85 accuracy, although the model performance gradually decreases at higher accumulations. Comparing the TS among all the members in each rainfall intensity category (≥0.1, ≥10, ≥25, and ≥50 mm), the microphysics scheme plays a key part in forecasting rainfall, and the majority of the members with higher TS use the microphysics scheme of WDM6 (16). When other parametrization schemes are the same, members using the BEP scheme usually obtain higher TSs than those using SLUCM. Yu et al. [44] also suggest that the BEP scheme performs better than the SLUCM scheme over the urban core of Beijing. A combination of the WDM6 (16), BouLac (8), Noah MP (4), and BEP (2), i.e., m16p8s4u2, finds the highest TS when precipitation is ≥10 and ≥25 mm and the second-highest TS when precipitation is ≥0.1 mm. From the evolution of radar echoes, the convective system first initiates in the southeast corner of the control region at around 14:00 BST (Figure 3(a1)). Then, it moves northwestward with a rapid intensification in the next two hours (Figure 3(b1,b2)). The radar echo reaches its maximum value at 16:00 BST in downtown Hangzhou and then gradually weakens and moves out of the control region in a northwesterly direction (Figure 3(d1)). In general, the m16p8s4u2 successfully captures the evolution of the heavy-rain-producing convective system, except for an approximate shift of 1.5 h in advance (Figure 3(a2–d2)). Therefore, the m16p8s4u2 in the ENCTL is chosen as the CTL.
The averaged T2M, Q2M, and WS10M before precipitation (from 10:00 to 13:00 BST on 26 July 2018) and the accumulated precipitation (from 13:00 to 18:00 BST on 26 July 2018) of the ENCTL are both qualitatively (Figure 4) and quantitatively (Table 4) compared with the observations. The deviation (BIAS) and root-mean-square error (RMSE) based on the following definitions are used to analyze the averaged uncertainty of the four meteorological variables.
B I A S = 1 N i = 1 N X i Y i
R M S E = 1 N i = 1 N X i Y i 2
where  X i  and  Y i    represent the variable in each grid from WRF model and observation, respectively.
Compared with the observation (Figure 4(a1)), the ensemble means of ENCTL (Figure 4(b1)) capture the main features of T2M, with a slight underestimation in the southern part of the control region, and the CTL successfully reports an extremely high temperature of 39 °C in the urban area (Figure 4(c1)). The spread of T2M is small in the ENCTL (Figure 4(d1)), indicating that the high temperature and the UHI are both well reproduced by most members. Accompanied by the hot weather, Hangzhou is also characterized by low moisture (Figure 4(a2)) and low wind speed (Figure 4(a3)). Both the ENCTL and the CTL ensemble mean capture these features, i.e., relatively smaller values of Q2M (Figure 4(b2,c2)) and WS10M (Figure 4(b3,c3)) within the control region than those outside the control region. These scenarios, known as the urban heat islands, dry islands, and turbid islands (exacerbated by low wind speed), are similar to those shown by previous studies [19,36,54].
The accumulated precipitation is mainly concentrated in the control region (Figure 4(a4)). The CTL well reproduces the spatial distribution and magnitude of the accumulated precipitation (Figure 4(c4)). In the ensemble mean of the ENCTL, precipitation is also concentrated in the control region, although the rainfall magnitude is underestimated, and the rainfall center shifts about 35 km to the east (Figure 4(b4)). This is a common issue that signals that extreme rainfall may be weakened by the ensemble mean [55]. Different from the T2M, Q2M, and WS10M, the spread of precipitation (Figure 4(d4)) is much larger inside the control region, indicating more uncertainties in forecasting precipitation in the urban area than in natural land use.
The ensemble means of BIAS are −1.43 °C, −1.83 g kg−1, 1.31 m s−1, and −6.14 mm for T2M, Q2M, WS10M, and precipitation, respectively. The ensemble means of RMSE are 1.97 °C, 2.54 g kg−1, 1.73 m s−1, and 29.08 mm for T2M, Q2M, WS10M, and precipitation, respectively (Table 4). Compared to the magnitude of the ensemble means, the variations in BIAS and RMSE are relatively small in T2M, Q2M, and WS10M compared to those in precipitation, which suggests that the performance of the model in forecasting the first three variables could be improved less by changing the options of various physical schemes but quite valuable for forecasting short-term local heavy rainfall.
A comparison of the hourly variations in T2M, Q2M, WS10M, and precipitation averaged within the control region between the observation and the ENCTL suggests that most of the members capture the evolution of this event, especially the T2M variation before the convective initiation (Figure 5). However, the T2M drops faster during the precipitation period and remains at a higher level in the ENCTL than in the observation (Figure 5a). In addition, most of the members underestimate Q2M (Figure 5b) but overestimate WS10M (Figure 5c) during the study period. The wind speed overestimations are also found for other cities in summertime as well [71]. The premature drop in T2M may be related to the early triggering of convection. Furthermore, similar to the CTL (Figure 3), the precipitation starts 0–2 h earlier in most members (Figure 5d), which may be a common bias in simulating local convection.
From the analysis above, the ENCTL captures the characteristics of meteorological elements before and during the heavy precipitation event. Compared with the environmental conditions (i.e., T2M, Q2M, and WS10M) before convective initiation, the ENCTL has greater uncertainty for simulating precipitation within the urban area. The ensemble member of m16p8s4u2 in the ENCTL is chosen as the control run (CTL) in this study. For the next two subsections, the individual and combined impacts of thermal and dynamical effects of urbanization and the impact of individual UCPs on this local heavy rainfall event are further examined.

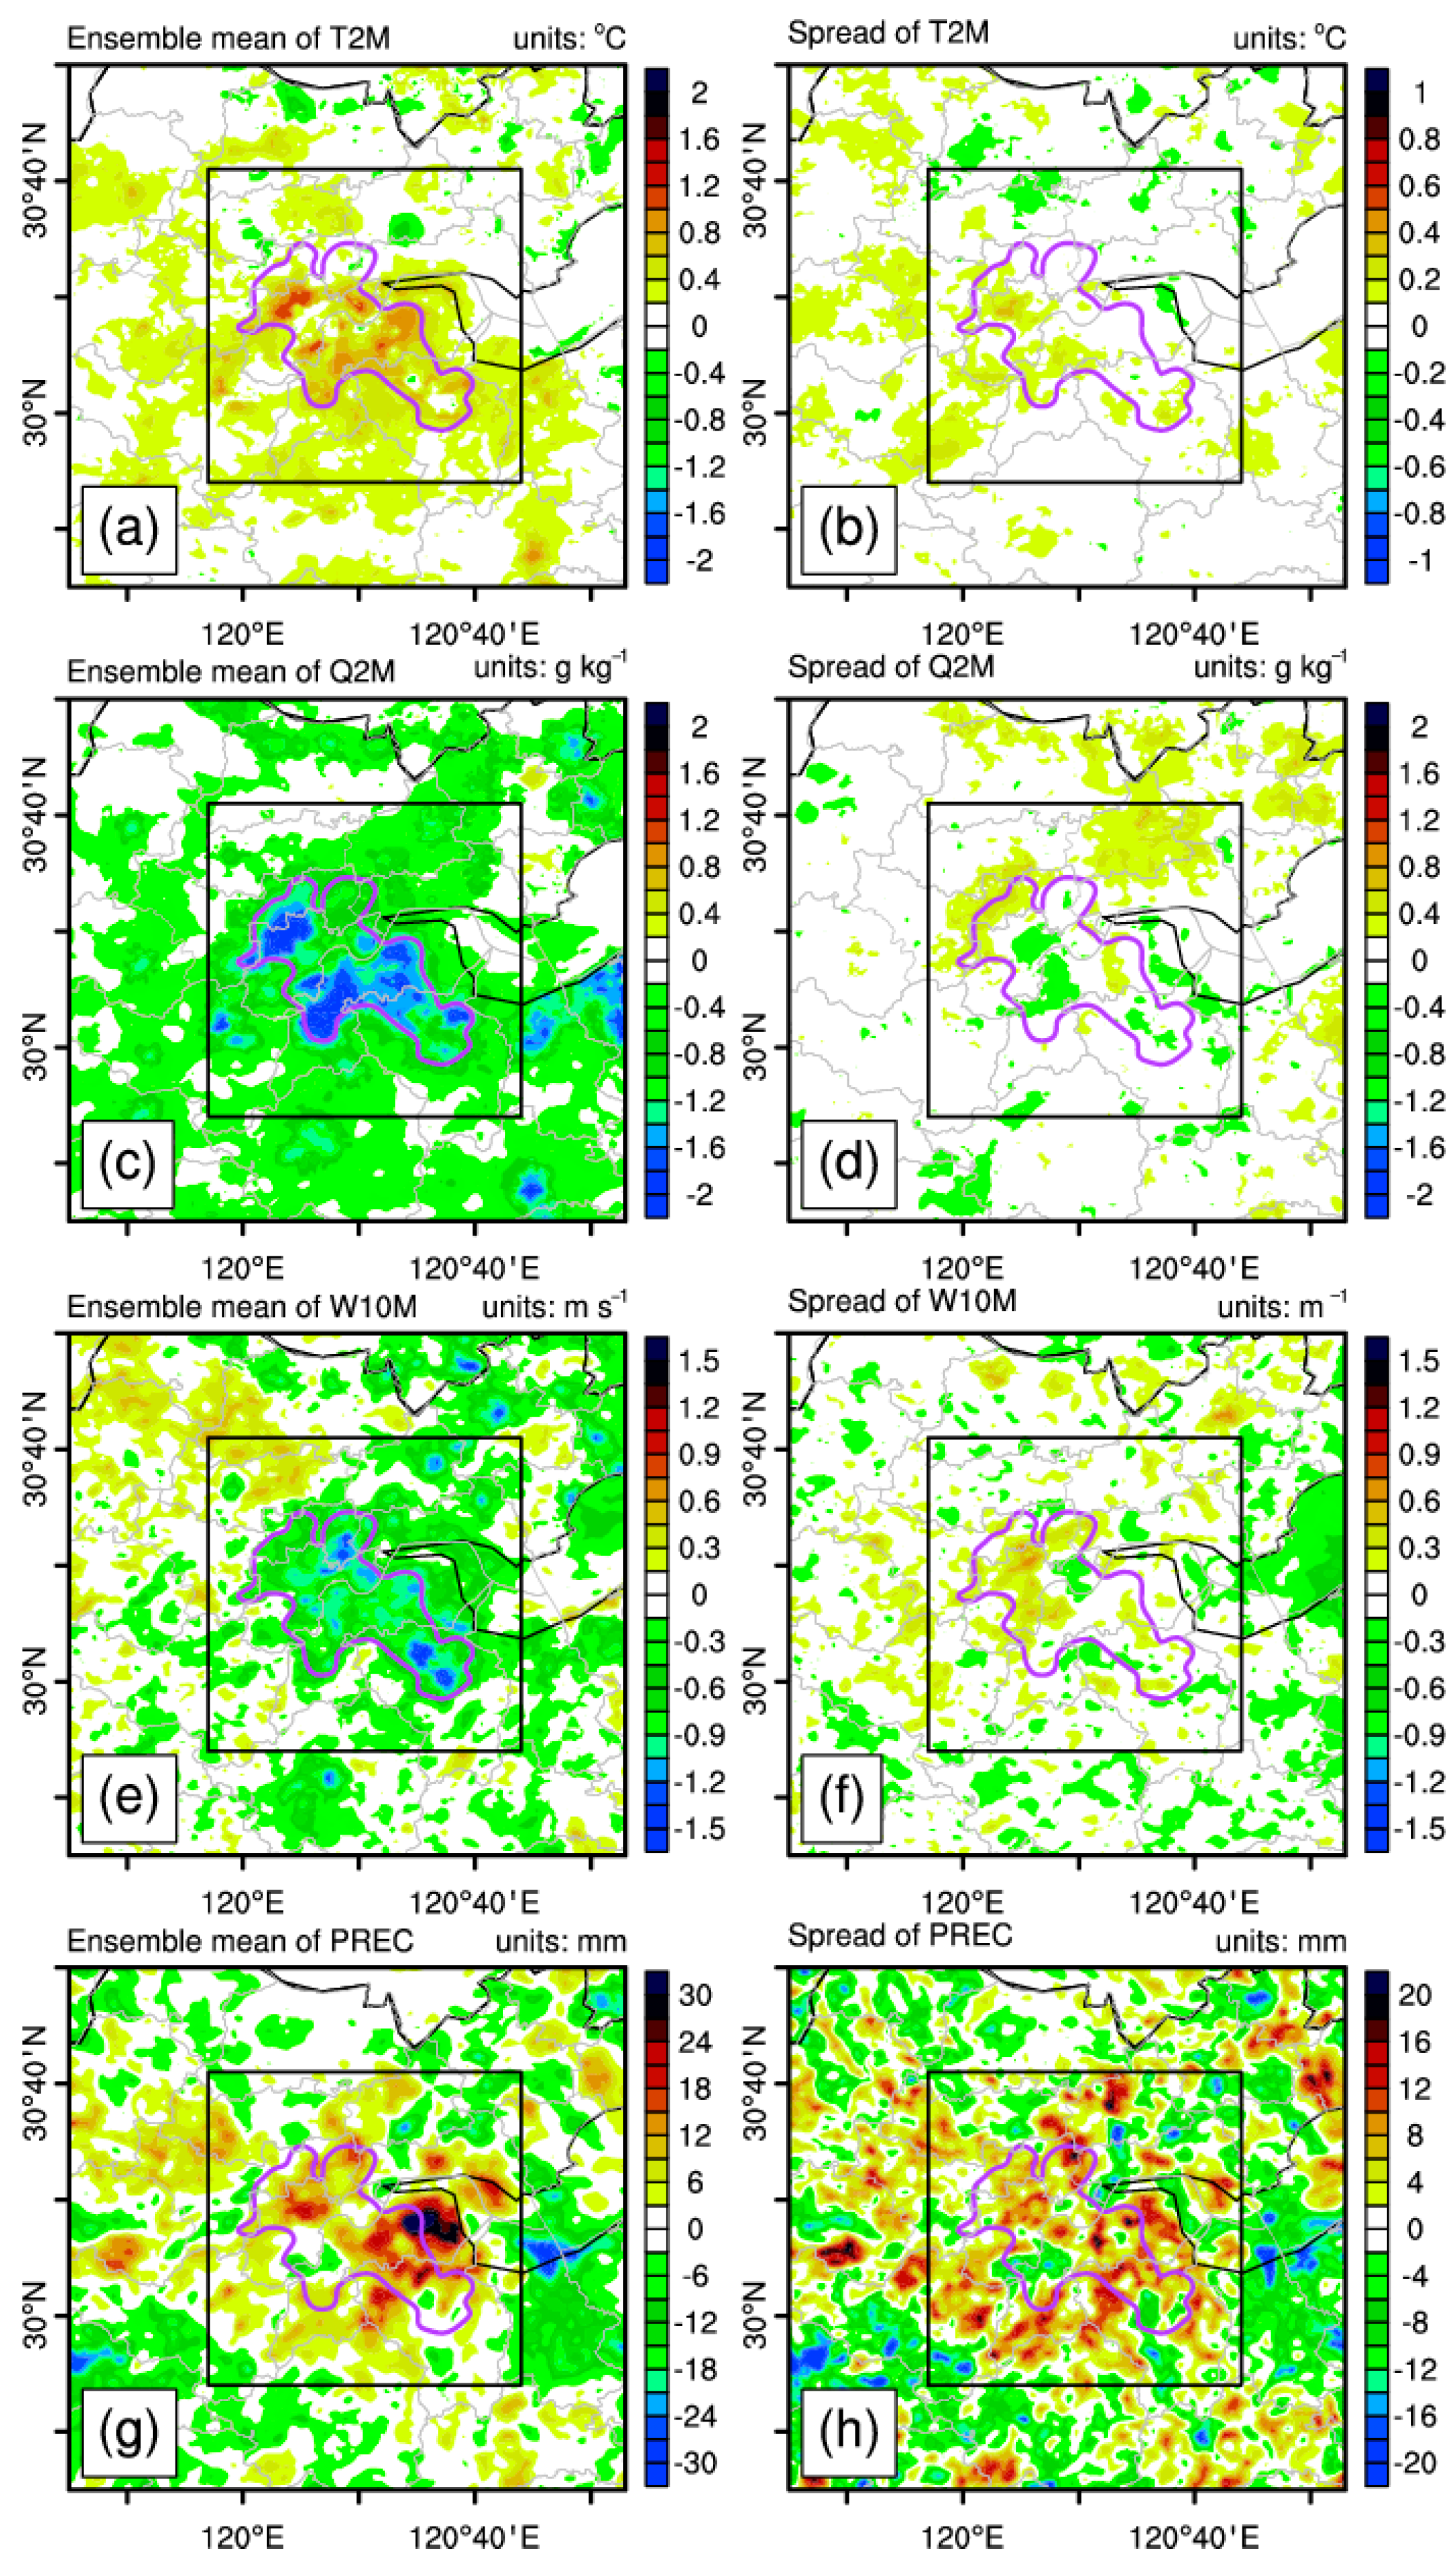
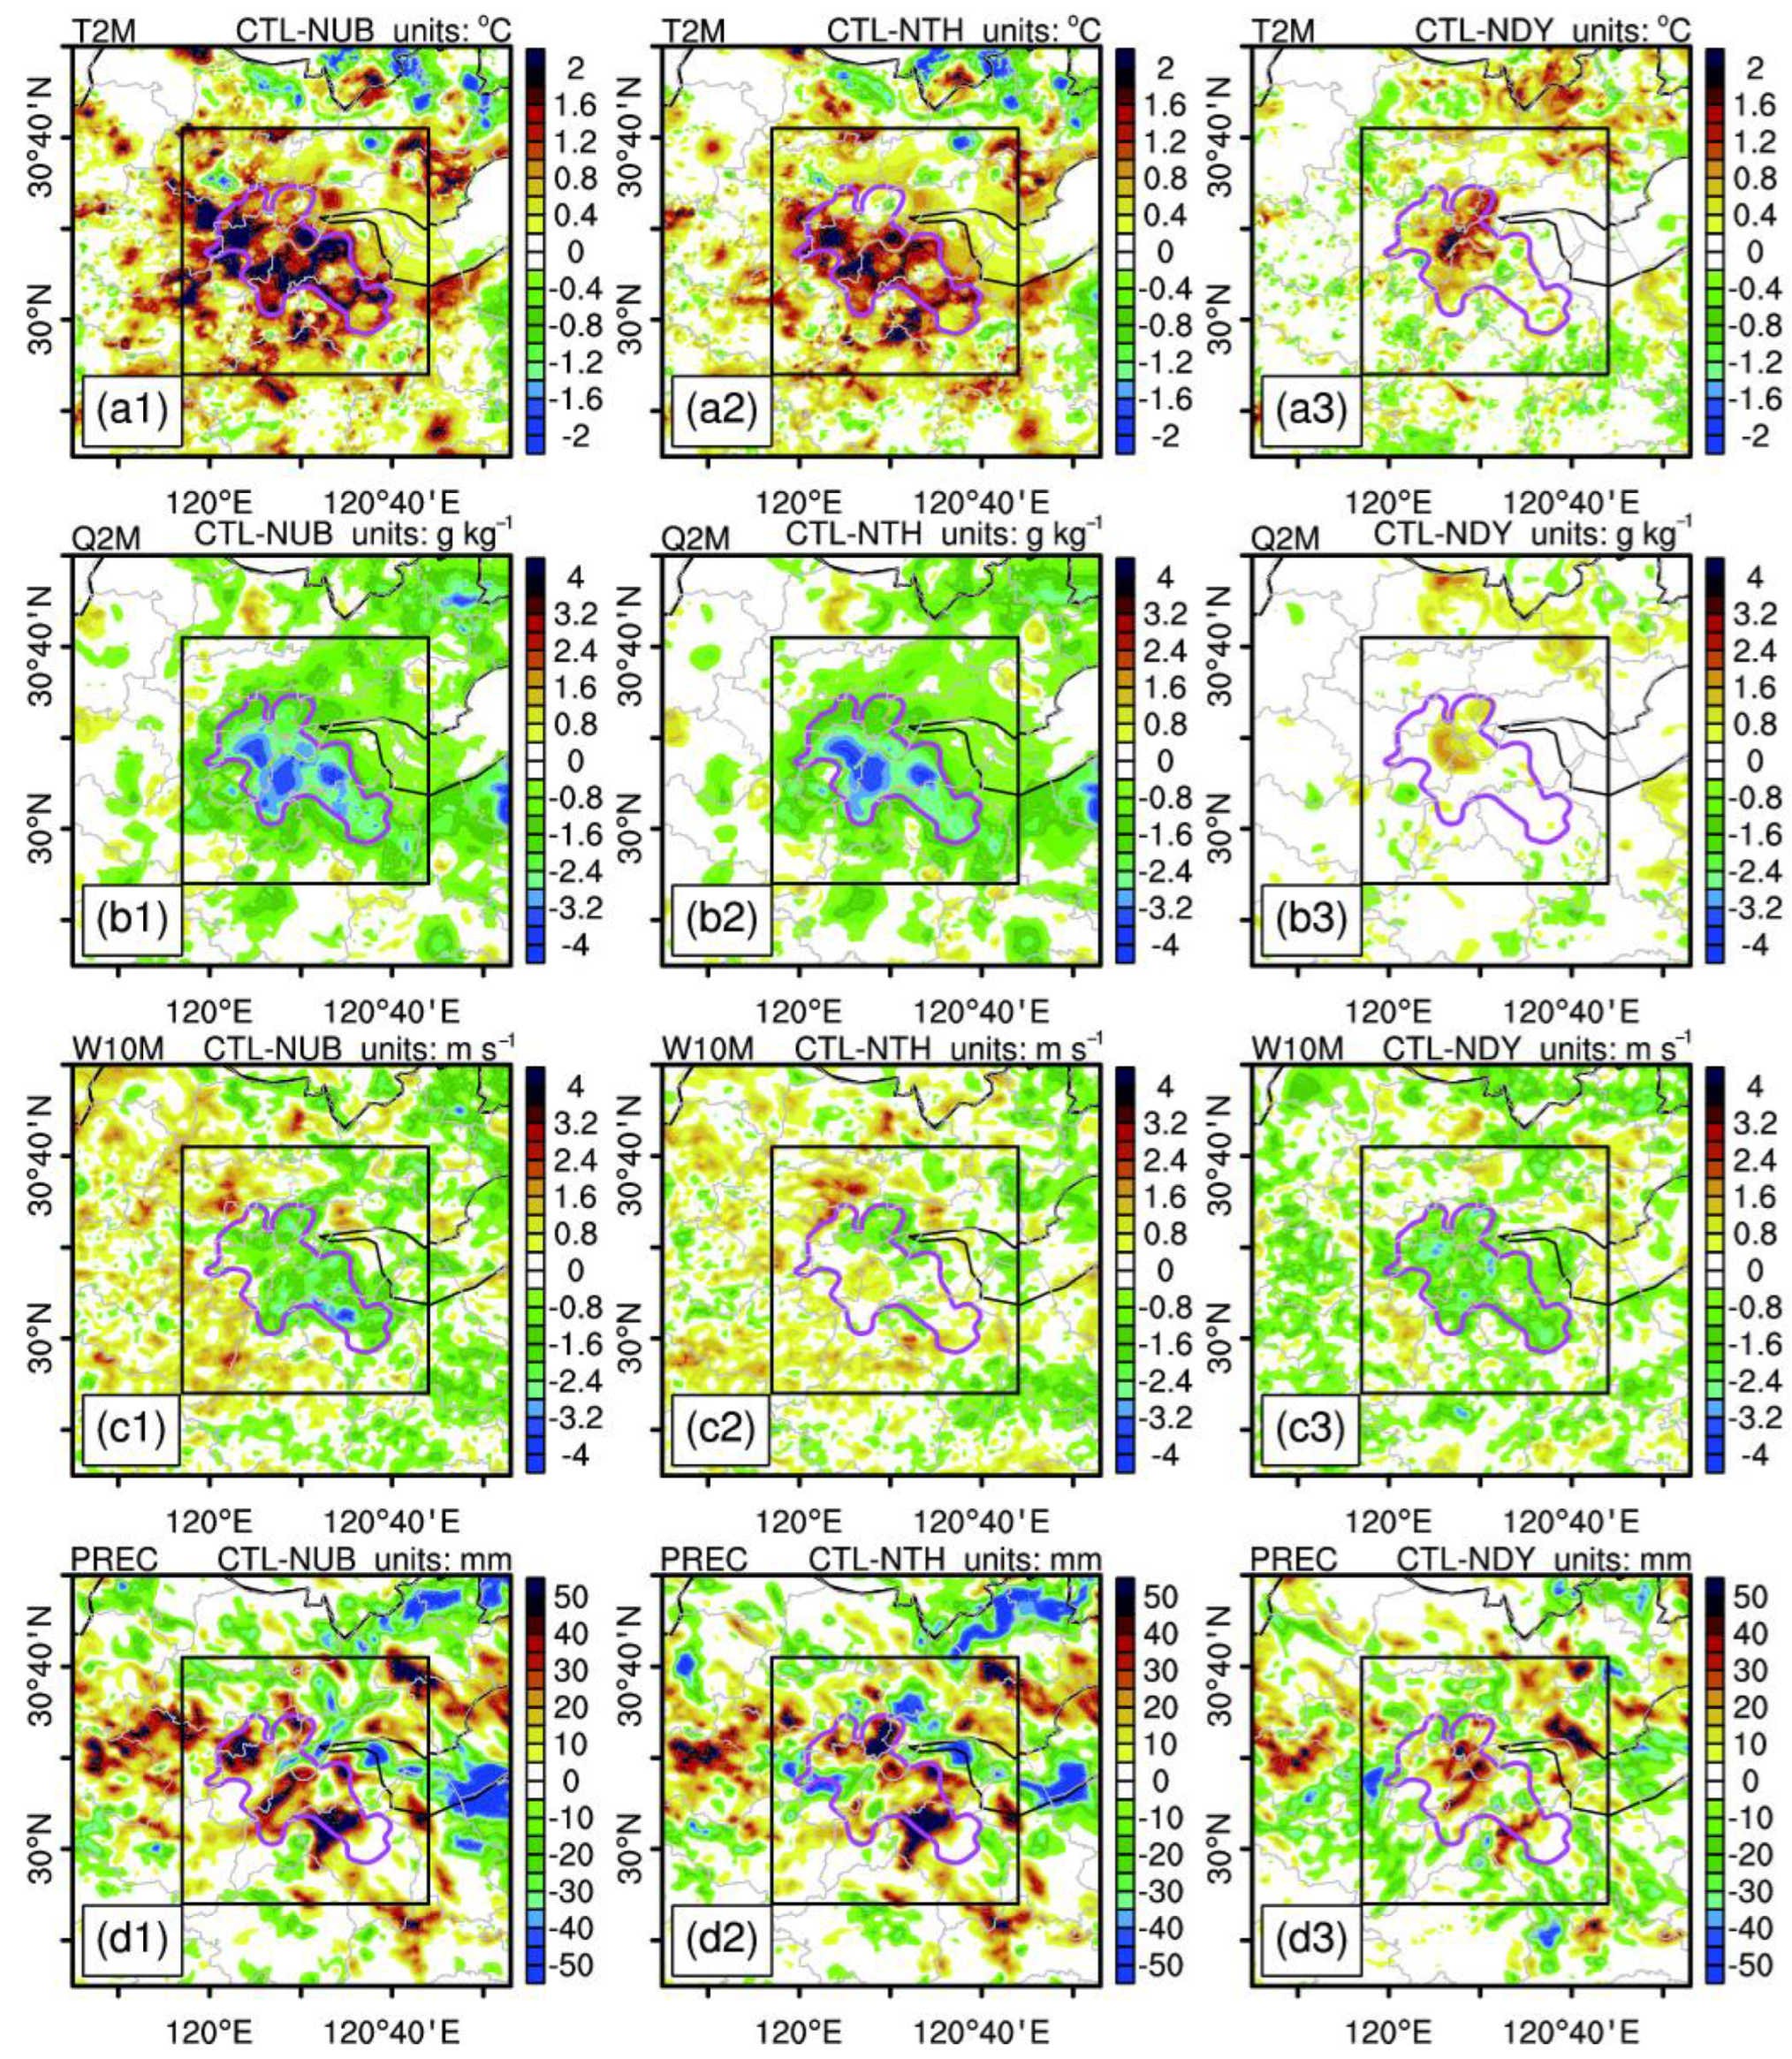
3.2. Evaluation of the Urban Effect

The impact of urbanization is first examined by comparing the differences in T2M, Q2M, WS10M, and accumulated precipitation between ENCTL and ENNoUB (Figure 6). The increase in the ensemble mean of T2M is 0.4–1.2 °C in the urban area, which is much larger than in the surrounding nonurban areas (Figure 6a). On the contrary, urbanization causes the mixing ratio to decrease by 0.5–1.8 g kg−1 in the urban area (Figure 6c). This is consistent with previous findings that evaporation in the urban area is reduced by impervious surfaces and reduced green vegetation fraction [46,72]. The wind speed decreases by 0.3–1.0 m s−1 in the urban area due to the drag effect of buildings (i.e., the pressure differences across individual roughness elements; Figure 6e). The positive anomaly center of precipitation is located at the junction between the urban area and Hangzhou Bay (Figure 6g). The presence of urban areas by the bayside can enhance the thermodynamic contrast between land and water that favors the water–land breeze front and promotes the formation of a convergence zone [73,74]. Meanwhile, the differences in the spread of T2M (Figure 6b), Q2M (Figure 6d), and WS10M (Figure 6f) are mainly concentrated in the urban area; however, the difference in the spread of precipitation occurs both in and out of the control region (Figure 6h). This suggests that the uncertainty brought about by the urban effect on precipitation occurs within the city and affects the surrounding areas to a similar extent. Notably, the spatial distribution of spread in precipitation is similar to that of the ensemble mean (Figure 6g), which indicates that the ensemble method is quite valuable for assessing the urban impact on local heavy precipitation [75].
The individual and combined impacts of the thermal and dynamical effects of urbanization are further examined by comparing the simulated results of NUB, NTH, and NDY with CTL (GROUP II). Both the thermal and dynamical effects contribute to an increase in T2M (Figure 7(a1–a3)). The regional averaged values of T2M suggest that the contribution of the thermal effect is more than twice that of the dynamical effect (71.2% vs. 28.8%; Figure 8a). For changes in Q2M, although the dynamical effect is a positive contribution, the thermal effect plays a major role and contributes to a decrease in Q2M (Figure 7(b1–b3) and 8b). The thermal and dynamical effects are also opposite to the changes in wind speed in the urban area (Figure 7(c2) vs. Figure 7(c3)). However, since the dynamical effect is dominant (Figure 8c), the WS10M in the urban area is decreased due to urbanization. This is also consistent with the difference in WS10M between ENCTL and ENNoUB (Figure 6e). Different from the first three variables, both the influences of thermal and dynamical effects of urbanization on precipitation present a positive and negative distribution in the urban area (Figure 7(d1–d3)). The regional averaged values suggest that they play an overall positive role and contribute to an increase in precipitation by 63.8% and 36.2%, respectively (Figure 8d). For the thermal effect, the increased temperature and thermal turbulence activity (Figure S1) help intensify atmospheric instability and convective initiation/enhancement. For the dynamical effect, increased friction velocity and turbulent kinetic energy flux (TKEP; Figure S2) could increase the turbulent mixing strength and facilitate convergence, increasing the precipitation in turn.

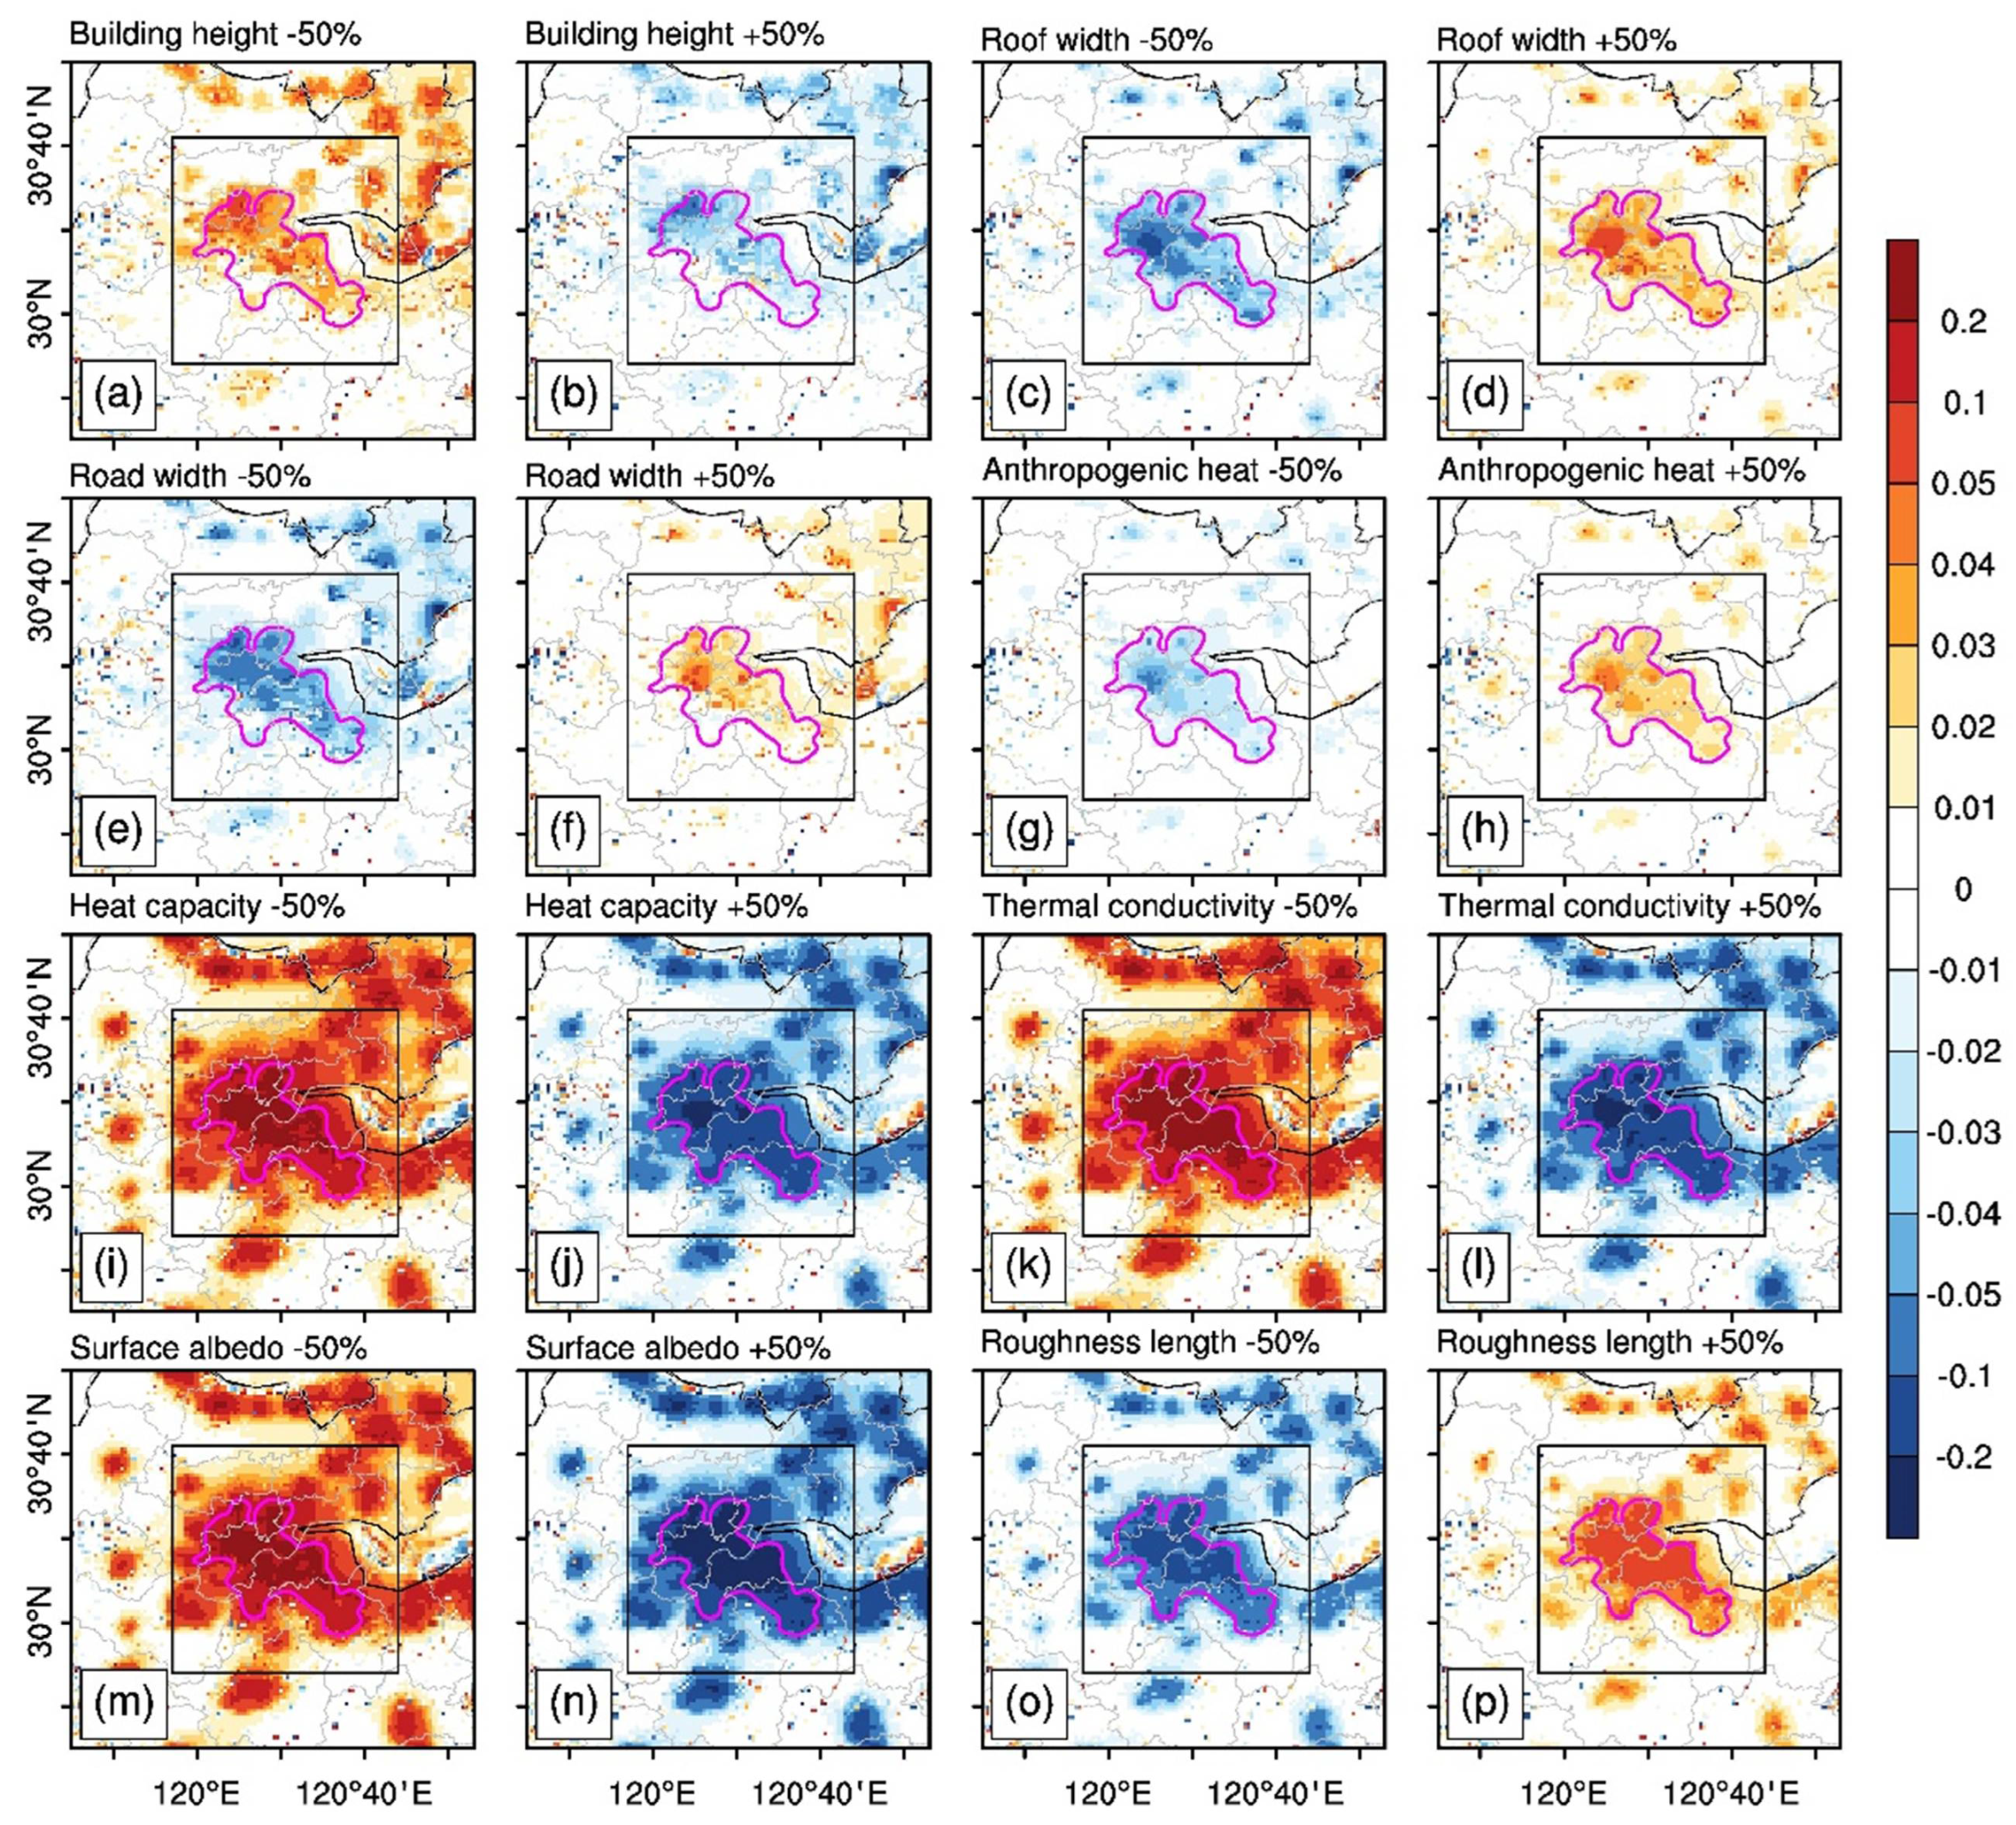
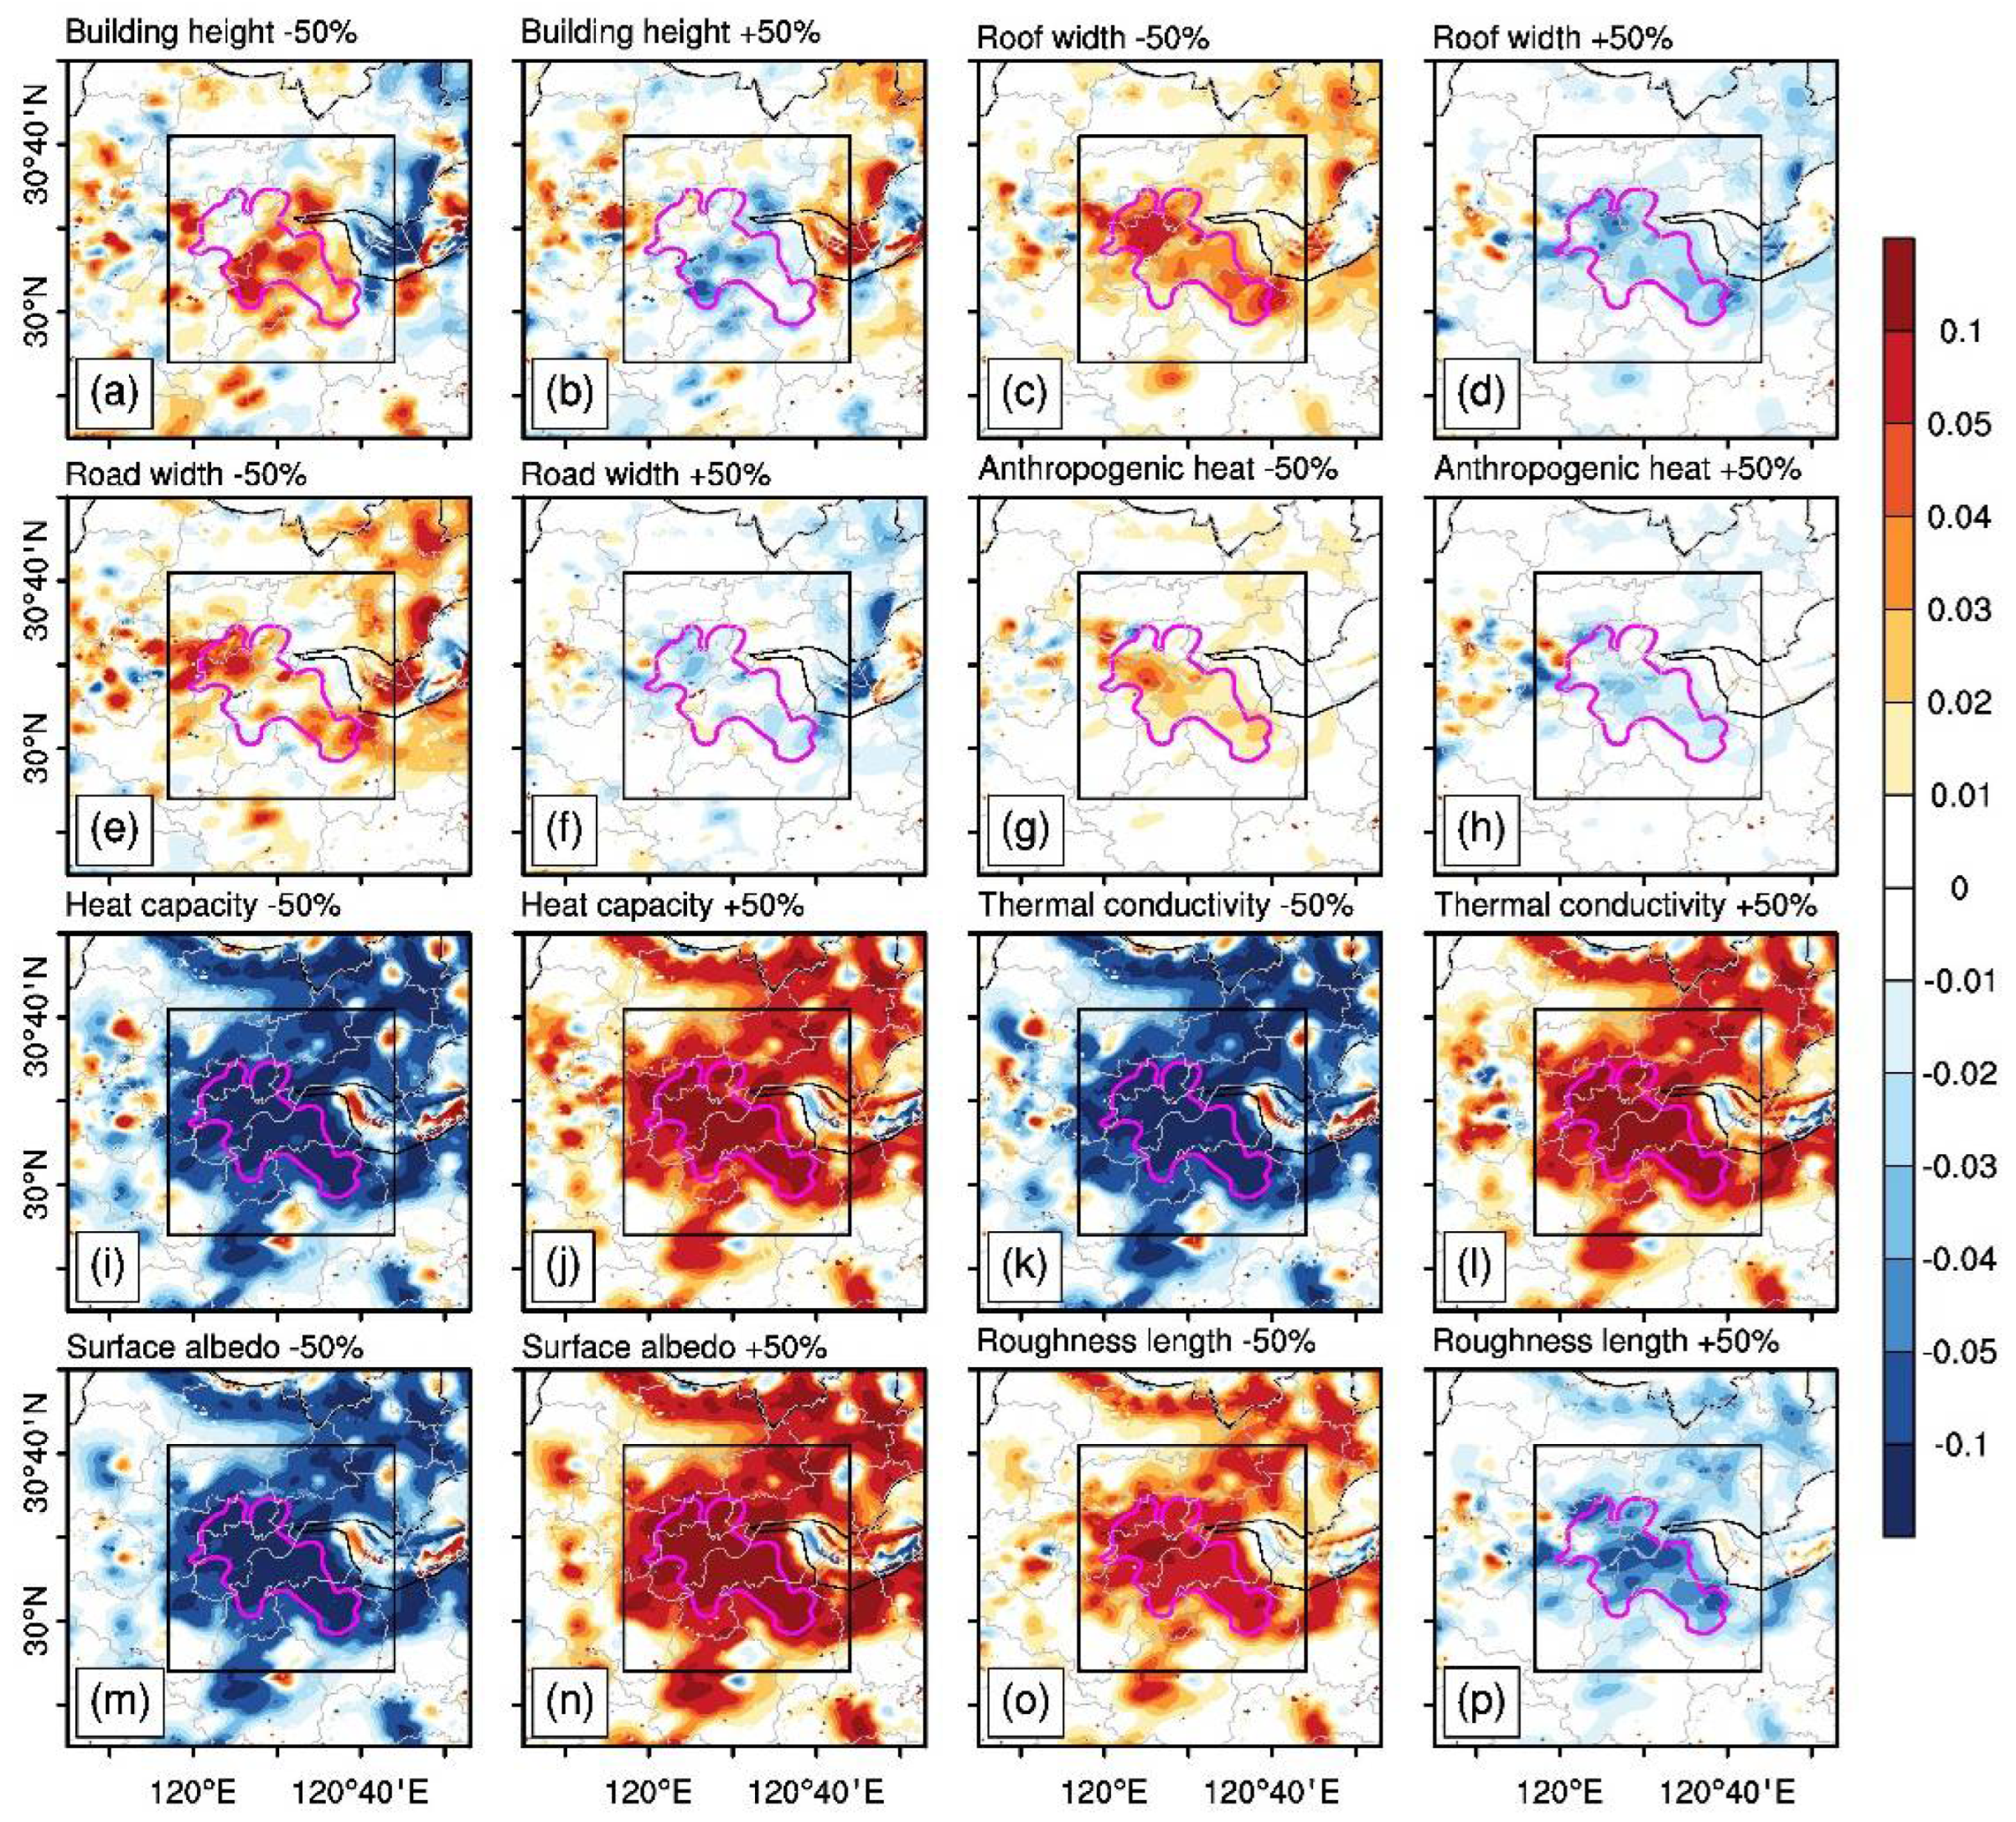
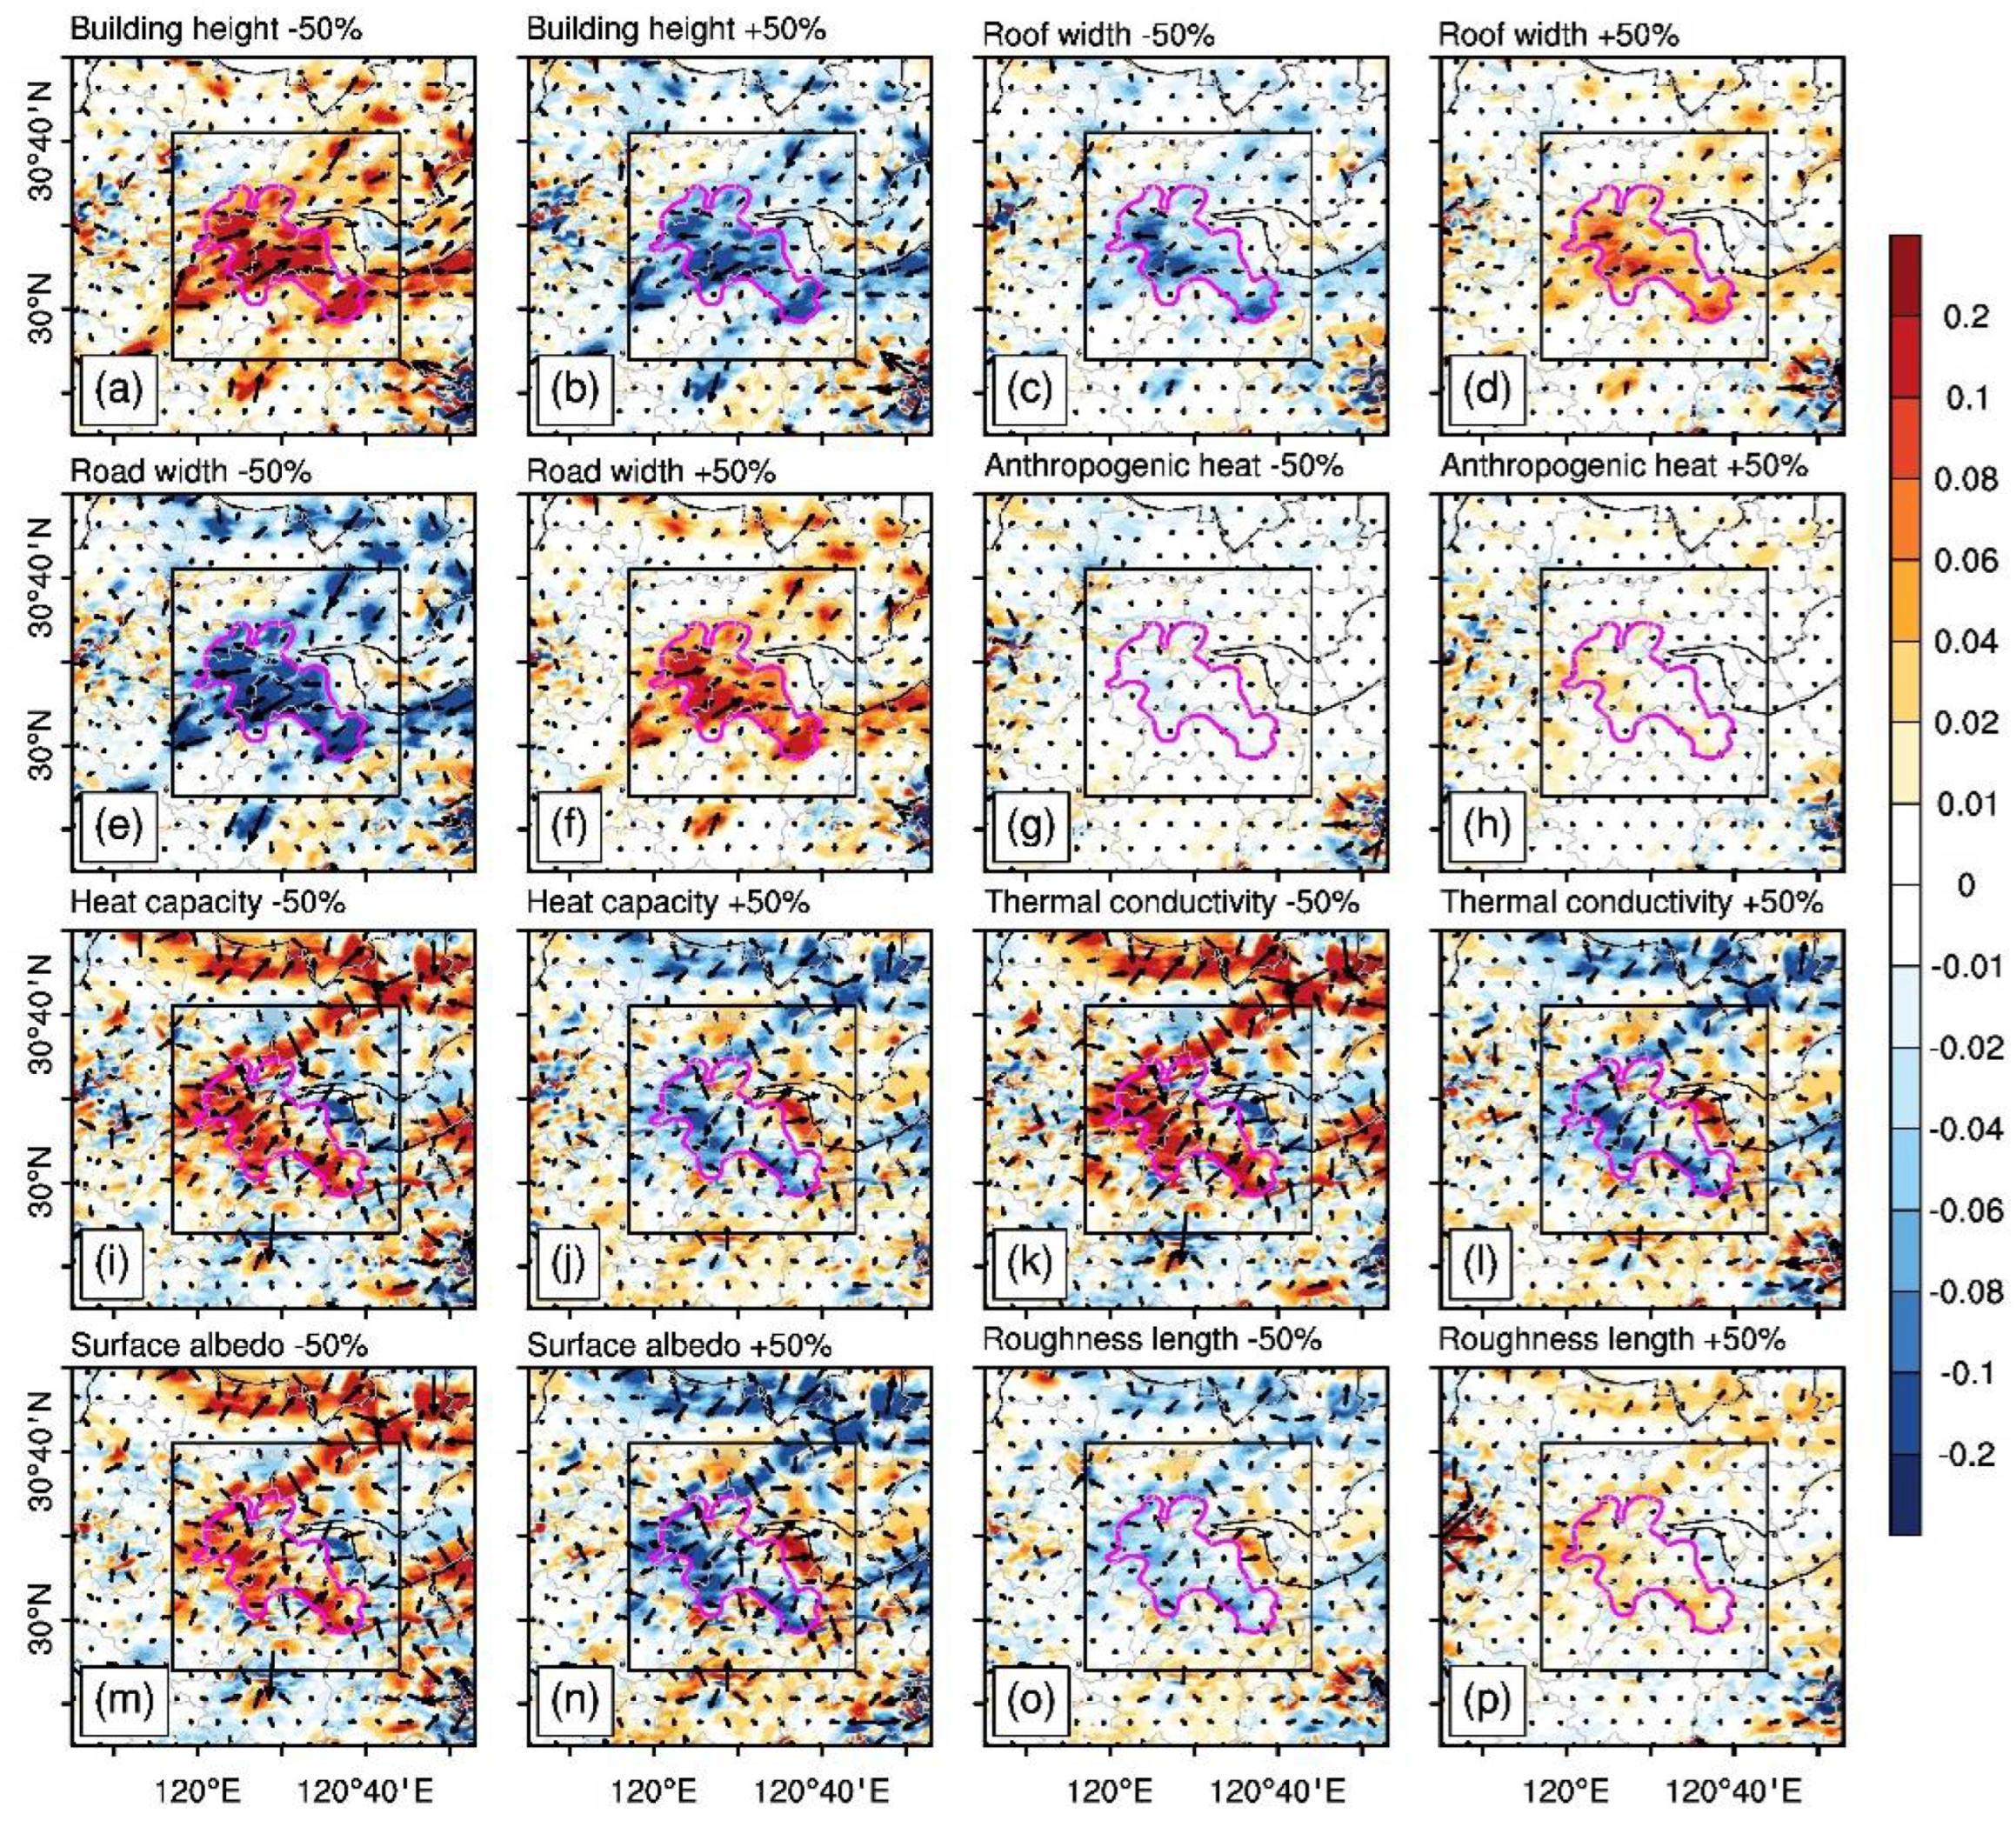
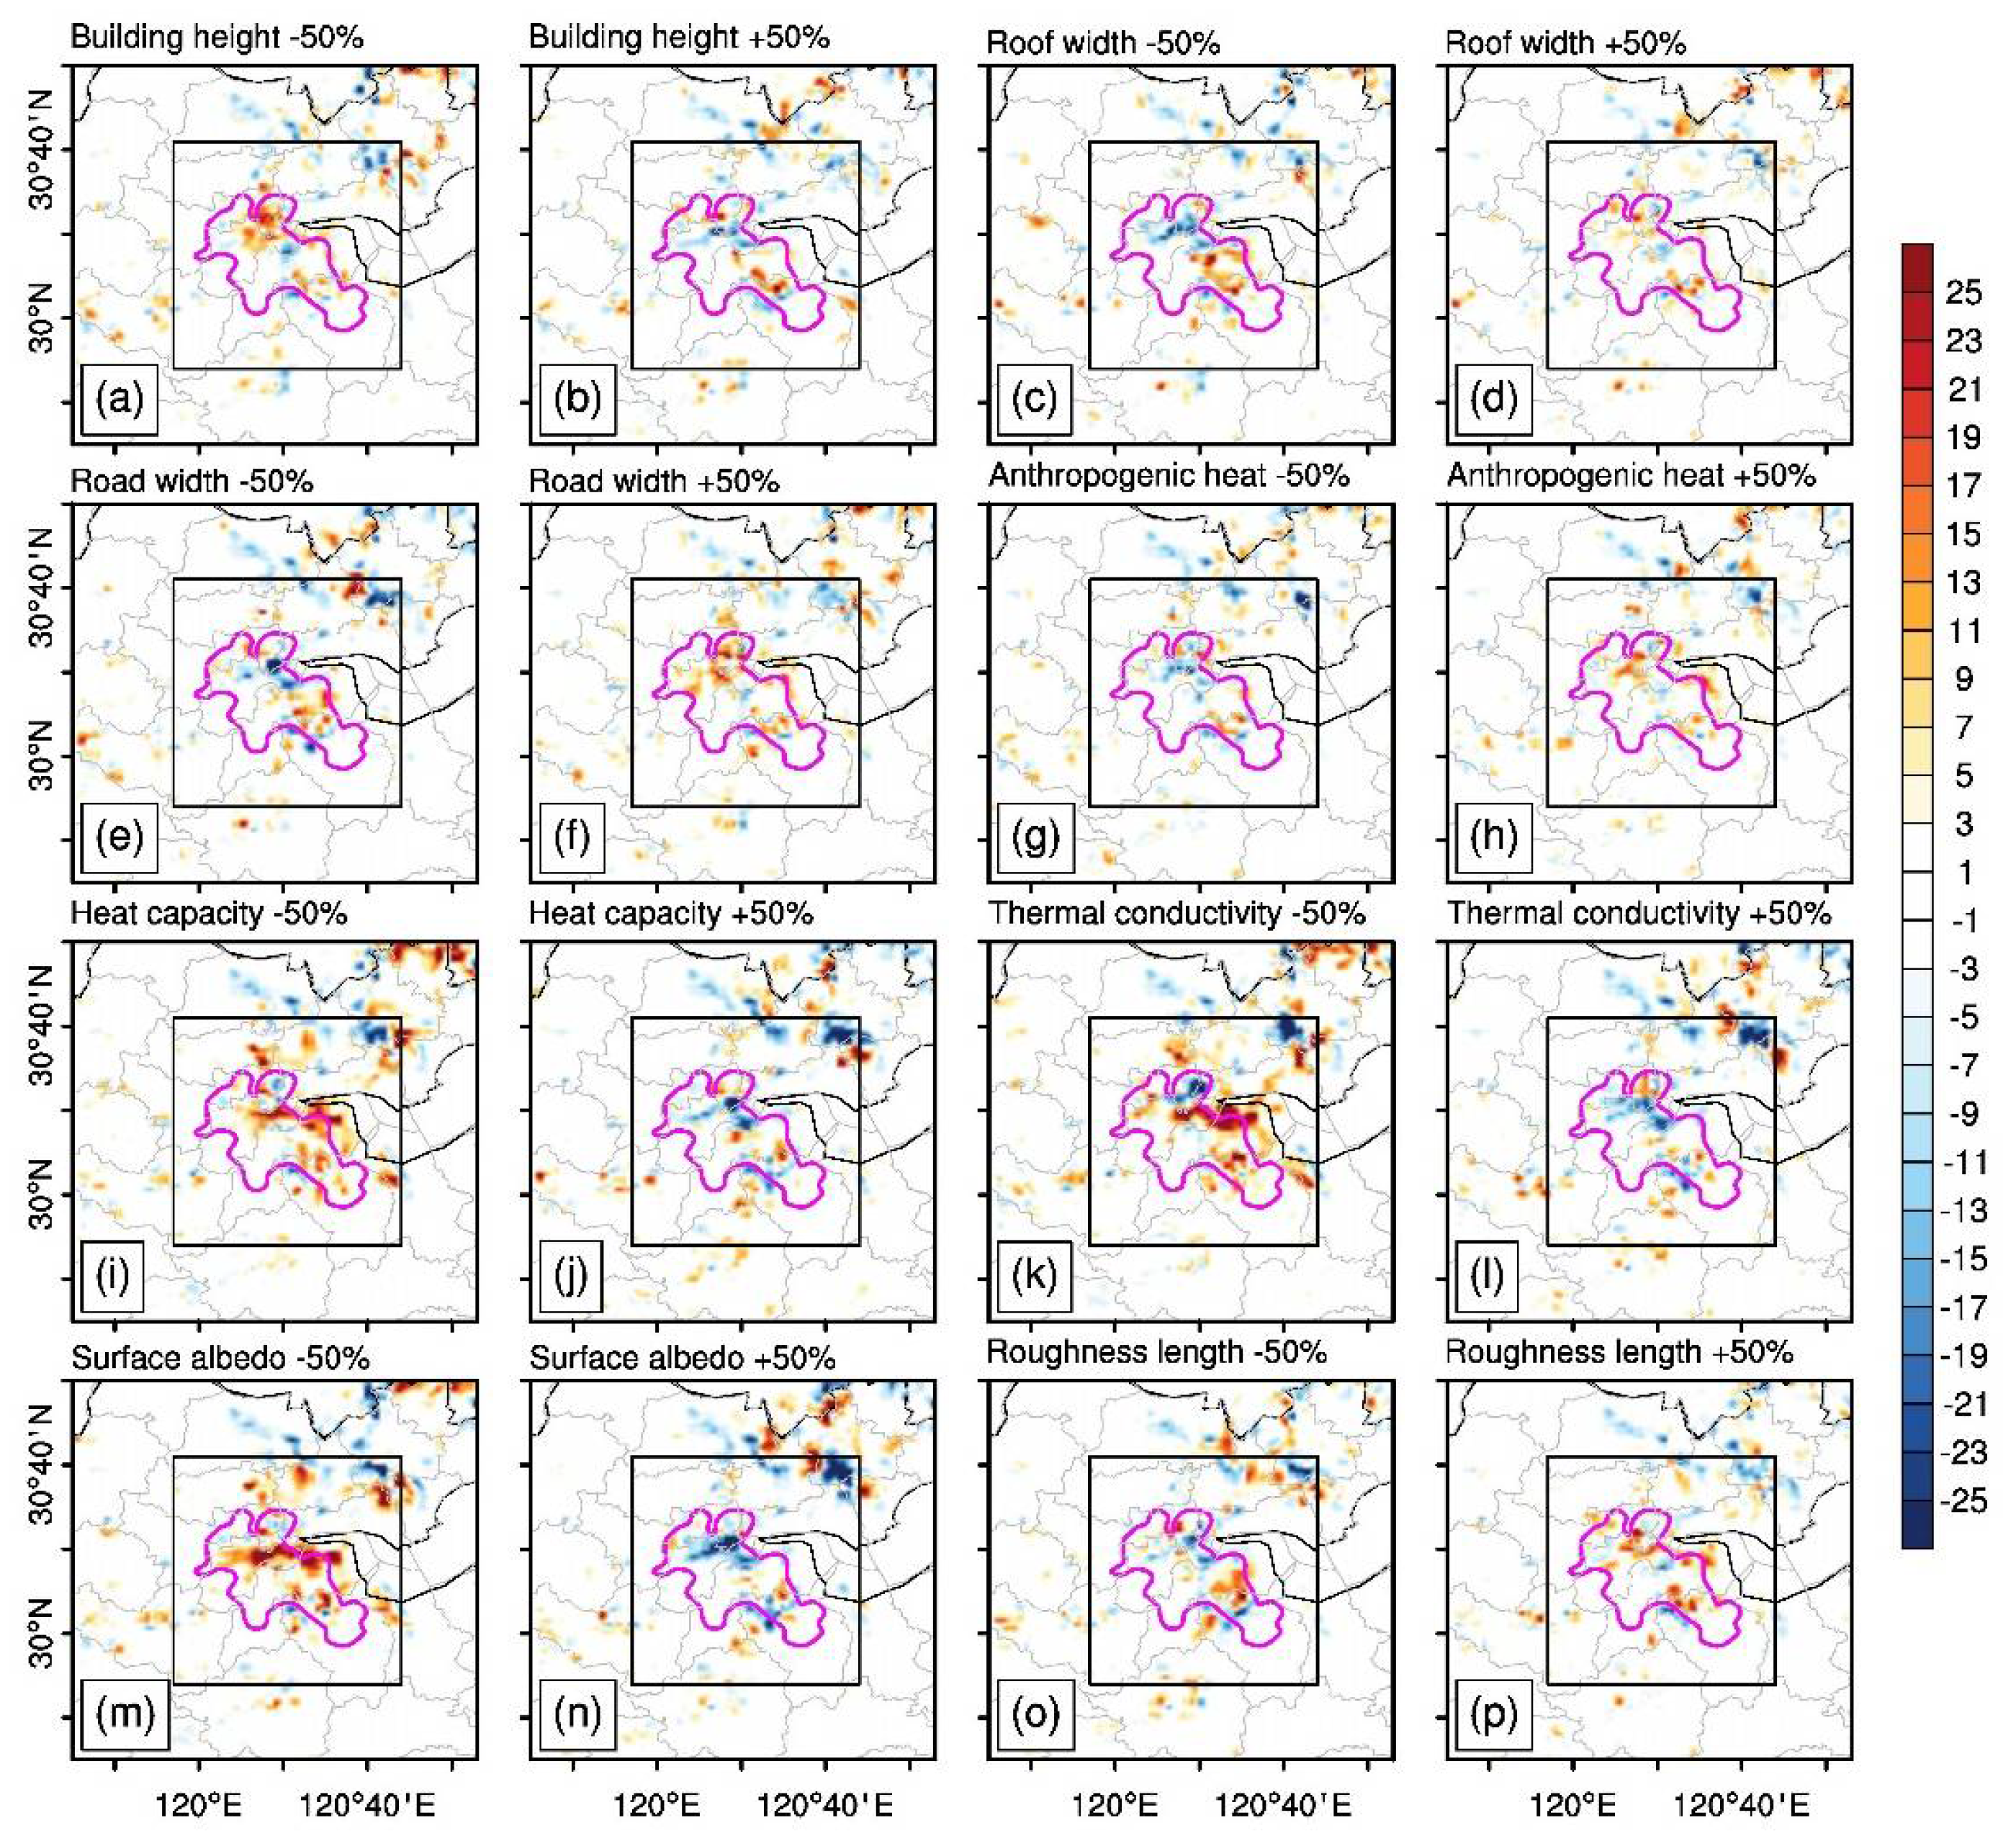
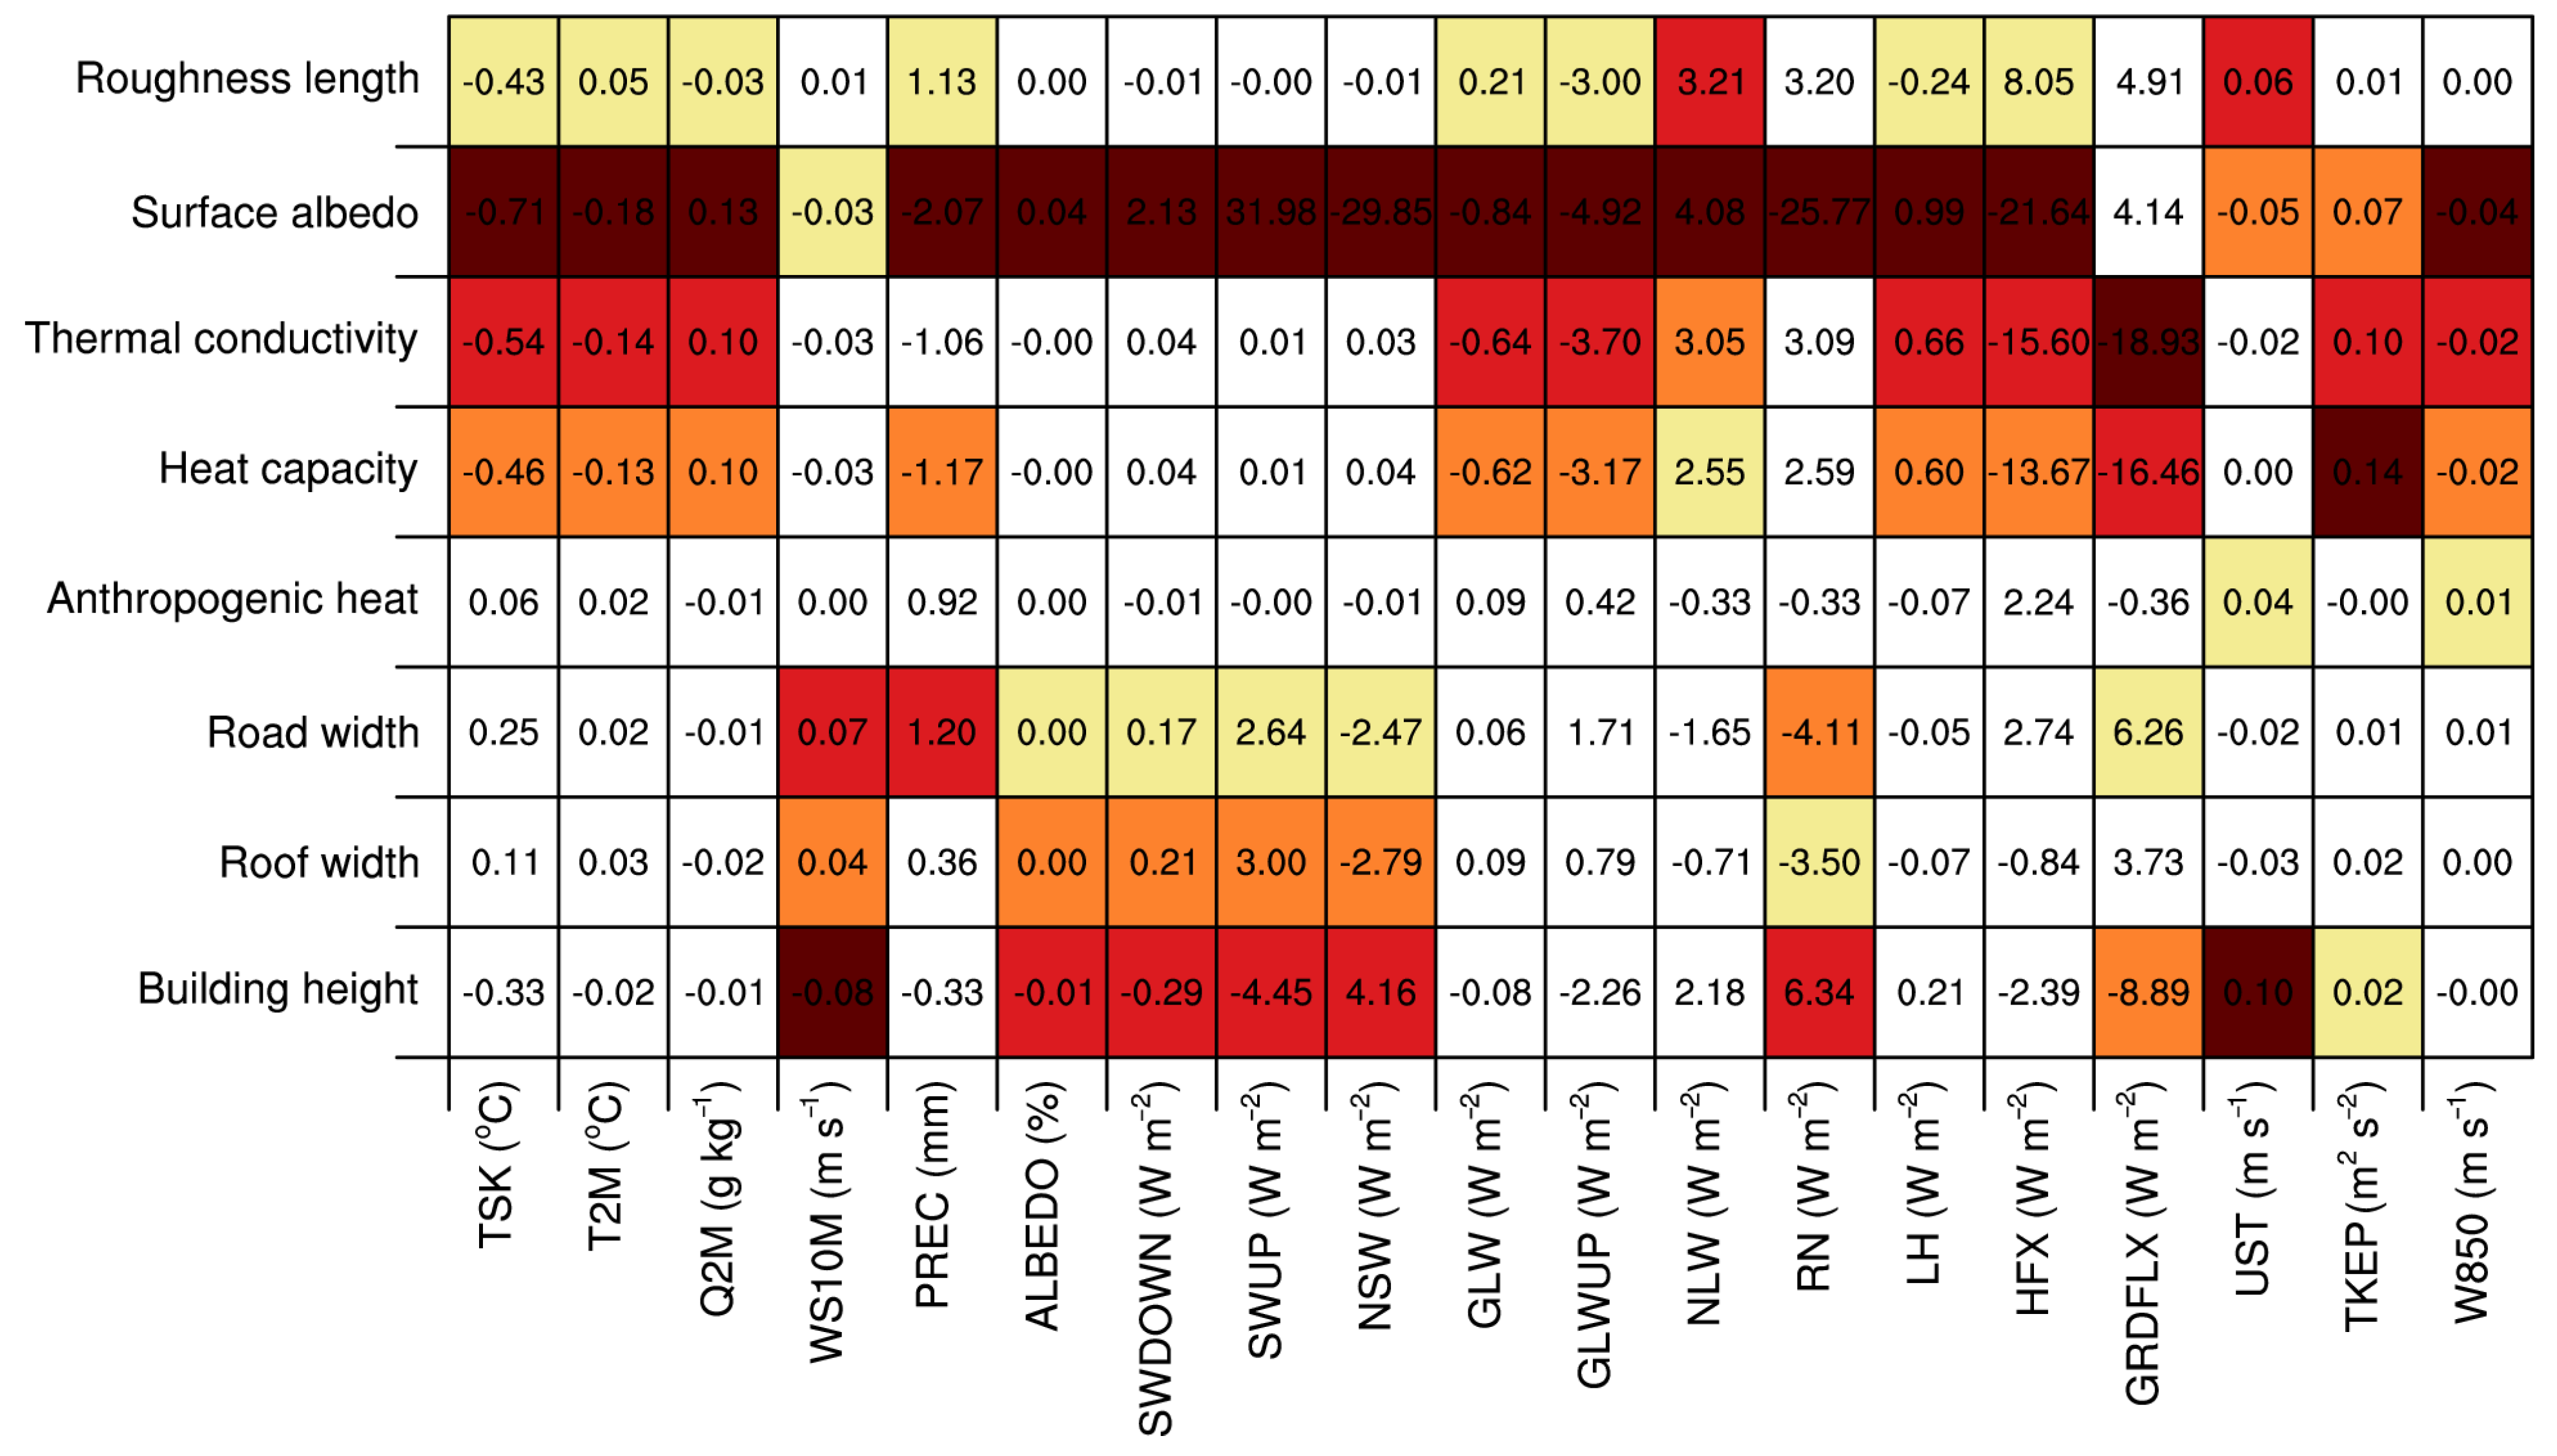
3.3. Sensitivity Analysis of Urban Canopy Parameters

For such local, short-term heavy rainfall events, the environmental conditions before convective initiation are crucial for simulating the entire rainfall event. Most recent studies on urban climate and weather have viewed the role of UCPs as an integrated external force [45,76,77], but few of them mentioned the individual role of specific UCPs in the urban area. In this subsection, eight important parameters characterizing the urban canopy (i.e., building height, roof width, road width, anthropogenic heat, heat capacity, thermal conductivity, surface albedo, and roughness length) are selected and increased/decreased by 50%, separately (GROUP III). Each of the 16 sensitivity experiments is compared with the CTL for the differences in T2M (Figure 9), Q2M (Figure 10), and WS10M (Figure 11) before precipitation (at 10:00 BST on 26 July 2018) and of the subsequent convective initiation (during 13:00–14:00 BST on 26 July 2018; Figure 12), respectively.
For changes in T2M (Figure 9), UCPs of building height, heat capacity, thermal conductivity, and surface albedo have a negative feedback effect. The increased building height may mitigate the UHI intensity at the pedestrian level due to the shading effects of high-rise buildings [42]. Compared to the building height, T2M is more sensitive to the changes in the latter three thermal-related UCPs (Figure 9i–n). The temperature decreases by about 0.05–0.2 °C in the urban area by increasing the heat capacity, thermal conductivity, or surface albedo, and the changes in T2M are not limited to urban areas but reflected around the city as well. On the contrary, changes in roof width, road width, anthropogenic heat, and roughness length have a positive effect on T2M. Among these four UCPs, the roughness length has the most significant effect, increasing the temperature in urban areas by 0.04–0.08 °C (Figure 9o,p). The effects of UCPs on Q2M (Figure 10) are the opposite of those on T2M, except for changes in the building height. The seemingly contradictory contributions of increasing temperature and decreasing humidity to changes in precipitation make the uncertainty of the impact of urbanization on precipitation even greater.
For the three structural parameters related to the changes in WS10M, the building height has a negative effect (Figure 11a,b), while the roof width (Figure 11c,d) and the road width (Figure 11e,f) are positive. In addition, three other thermal-related UCPs (i.e., heat capacity, thermal conductivity, and surface albedo) also have similar negative effects on WS10M, except at the junction of the city and the waters of Hangzhou Bay (Figure 11i–n). The decreased wind speed within the city and the increased wind speed at the edge of the city favor wind convergence and the subsequent convective initiation/enhancement in the urban area. This is consistent with the differences in the ensemble mean of the accumulated precipitation amount between ENCTL and ENNoUB (Figure 6g).
The influences of UCPs on precipitation during the convective initiation stage (Figure 12) are less uniformly distributed than those on the other three meteorological elements. Both positive and negative feedback effects can be observed in the urban area, suggesting large uncertainties in forecasting heavy precipitation there. This may be because, in response to favorable conditions for convective initiation, the UCPs sometimes have a contradictory effect on the urban environmental conditions (T2M, Q2M, and WS10M). For example, increasing the surface albedo favors moisture and wind convergence within the city but decreases the temperature and thermal instability, presenting an overall negative effect on convective initiation (Figure 12n). Once again, this illustrates the complexity of urban effects on precipitation.
Figure 13 lists the differences in more meteorological variables (X-axis) averaged in the control region when increasing the values of the eight UCPs (Y-axis) by 50% individually to better illustrate the changes in the environmental conditions within urban areas. The surface albedo and the three structural parameters (i.e., building height, roof width, and road width) play an important role in the urban canopy radiation balance, i.e., changes in downward/upward shortwave radiation (SWDOWN/SWUP). The surface albedo is the parameter that has the most significant impact on most of the meteorological variables. Higher surface albedo reflects more shortwave radiation and reduces net shortwave radiation (NSW) entering the urban canopy, which leads to a decrease in both TSK and T2M. Previous studies also suggest that high surface albedo contributes significantly to reducing the TSK and canopy layer UHI [78,79]. For the effects of the three structural parameters, the effect of building height is opposite to those of roof width and road width, which is also consistent with the findings above (Figure 9, Figure 10 and Figure 11). The increase in building height (roof width/road width) leads to more (less) net radiation (RN) in the urban canopy and a decrease (increase) in TSK due to the longer (shorter) building shadow. The temperature gradient between the canopy and ground increases and causes more energy to be transported into the ground (GRDFLX), resulting in a decrease in T2M. On the other side, the heat capacity and thermal conductivity have a greater influence on the surface energy balance, i.e., changes in HFX and GRDFLX. Their increases mean that the building could store more energy in the urban canopy and conduct it into the ground, therefore causing a negative difference in both HFX and GRDFLX. The increase in roughness length enhances the mechanical turbulence of the boundary layer, causing an increase in UST. More heat (RN) is conducted to the upper boundary layer during the daytime, resulting in an increase in GRDFLX and a decrease in TSK. The anthropogenic heat is treated as an additional sensible heat source in the model, and its impact is relatively small compared to the other UCPs in this study.

4. Discussion

Local heavy precipitation is a common convective weather event in the summer on the east coast of China. However, since it usually occurs on a small scale and for a short period (i.e., less than 6 h), it is difficult to forecast and provide an early warning, and, thus, it poses a great challenge to daily city management. From the three sets of sensitivity experiments in this study, it can be seen that there are more uncertainties in forecasting precipitation in the urban area than in the other three meteorological variables (T2M, Q2M, and WS10M). This uncertainty comes from several sources. Firstly, the parameterization schemes introduce significant uncertainty in the simulation of precipitation. The uncertainties related to parameterization schemes arise from either uncertainty in the parameter or the parameterization [55]. A comparison of the parameterization schemes suggests that the microphysics scheme plays the most important role in forecasting precipitation, followed by the PBL, the land surface, and the urban physics schemes. This result is consistent with the work of Yu et al. [55] and Chen et al. [68], who also indicated that the microphysics and PBL schemes can substantially affect the temperature and moisture profiles in the lower troposphere and then have a significant impact on precipitation simulation. Secondly, the uncertainties brought about by the urban land use on precipitation are not limited to the urban area but extend to surrounding areas as well. In addition, unlike the other three meteorological variables, the effect of urbanization on precipitation shows a positive and negative staggered distribution. This may be because precipitation is the result of various meteorological elements (temperature, moisture, and wind convergence), and the impact of LCLU and UCPs on each meteorological element may sometimes be contradictory to changes in precipitation. Hence, precipitation changes may offset each other with different changes in UCPs, resulting in little changes in mean precipitation.
Although the model results are generally acceptable, it should be noted that the uncertainty in the initial field is not investigated in this study. The initial and boundary conditions were downscaled from global models (ERA5 reanalysis) with no other data assimilation or nudging performed. We believe more efforts could be made to better remove the uncertainties in the initial field, such as coupling HRLDAS to WRF [80], adjusting the initial time, and generating ensemble members by perturbing the initial field [81]. In addition, urbanization in the current study refers to a change in land use and UCPs but does not consider the impact of aerosols. The UCP values used herein are the default values in the WRF model. Future studies should consider more realistic high-resolution UCPs and atmospheric chemistry models to examine the effect of anthropogenic heat and aerosols on local heavy precipitation in cities.

5. Summary and Conclusions

A typical summer heavy rainfall event that occurred in Hangzhou, China, was chosen to analyze the sensitivity of UCPs and the individual and combined impacts of the thermal and dynamical effects of urbanization using the integrated WRF/urban modelling system.
The performance of the model was evaluated by using ensemble simulations, which included 24 members with different combinations of physical parameterization schemes (ENCTL). The results show that the ENCTL basically captures the heavy precipitation and the high temperature, low mixing ratio, and weak wind speed before precipitation, although many ensemble members underestimate the mixing ratio, overestimate the wind speed, and the convective initiation starts 0–2 h earlier than the observation.
The individual and combined impacts of the thermal and dynamical effects of urbanization were also examined. In this case, urbanization could lead to higher temperatures, lower mixing ratios, lower wind speed, and more precipitation in and around the urban area. Meanwhile, urban land use introduced more uncertainties than natural land use in forecasting the four meteorological variables, especially for precipitation. Both the thermal and dynamical effects contribute to an increase in temperature and precipitation, and the thermal effect plays a major role. The thermal and dynamical effects are the opposite of changes in the mixing ratio and wind speed, and they play a major role in each, respectively.
Eight important UCPs characterizing the urban canopy were chosen to investigate their impacts on this rainfall event before and when it began. The influences of UCPs are mainly concentrated in the urban area, although the effects of UCPs on precipitation are less evenly distributed in space than on the other three variables. The temperature, mixing ratio, and precipitation are more sensitive to changes in heat capacity, thermal conductivity, surface albedo, and roughness length, while wind speed is mainly affected by structural parameters (i.e., building height, roof width, and road width). In addition, the influences of UCPs on the urban canopy radiation balance and the surface energy balance were further explored.

Supplementary Materials

The following supporting information can be downloaded at: https://www.mdpi.com/article/10.3390/land12111965/s1, Figure S1: Differences in (a1–a3) surface skin temperature (°C), (b1–b3) surface net radiation (W m−1), (c1–c3) ground heat flux (W m−2), (d1–d3) sensible heat flux (W m−2), and (e1–e3) latent heat flux (W m−1) averaged during 10:00 to 13:00 BST on 26 July 2018 between the control test (CTL) and (left) NoUB, (middle) NoTH, and (right) NoDY test; Figure S2: Same as Figure S1 but for (a1–a3) friction velocity UST (m s−1) and (b1–b3) turbulent kinetic energy TKEP (m2 s−2) at 850h Pa during 10:00 to 18:00 BST on 26 July 2018.

Author Contributions

Conceptualization, M.W. and F.C.; methodology, M.D.; software, F.C.; validation, M.W., F.C. and X.Y.; formal analysis, M.W.; investigation, M.W.; resources, F.C.; data curation, M.D.; writing—original draft preparation, M.W.; writing—review and editing, M.W. and F.C.; visualization, M.W. and F.C.; supervision, X.Y.; project administration, F.C.; funding acquisition, F.C. All authors have read and agreed to the published version of the manuscript.

Funding

This study was supported by the National Natural Science Foundation of China (grants 42030610, 42205006, and 41971019); Zhejiang Provincial Natural Science Foundation of China (LY21D050001); the Open Grants of the State Key Laboratory of Severe Weather (2021 LASW-B21).

Data Availability Statement

The ERA5 reanalysis dataset is available at https://cds.climate.copernicus.eu/cdsapp#!/home (accessed on 18 September 2023); the WRF-ARW coupled with urban model version 4.0.2 is downloaded from http://www2.mmm.ucar.edu/wrf/users (accessed on 1 May 2021). The temperature, mixing ratio, wind field, and temperature data were provided by the Zhejiang Meteorological Bureau, China Meteorological Administration, which are available from the authors upon reasonable request.

Conflicts of Interest

The authors declare no conflict of interest.

Abbreviations

Abbreviations and Descriptions
ALBEDO surface albedo
GLW downward longwave radiation
GLWUP upward longwave radiation
GRDFLX ground heat flux
HFX sensible heat flux
LH latent heat flux
NLW net longwave radiation
NSW net shortwave radiation
PBL planetary boundary layer scheme
PREC precipitation
Q2M 2 m mixing ratio
RMSE root-mean-square error
RN net radiation
SWDOWN downward shortwave radiation
SWUP upward shortwave radiation
TKEP850 turbulent kinetic energy flux at 850 hPa
TS threat score
TSK surface temperature
T2M 2 m temperature
UCP urban canopy parameter
UHI urban heat island
UST friction velocity
WS10M 10 m wind speed
W850 vertical velocity at 850 hPa

References

  1. Han, J.; Baik, J.; Lee, H. Urban impacts on precipitation. Asia-Pac. J. Atmos. Sci. 2014, 50, 17–30. [Google Scholar] [CrossRef]
  2. Portman, D. Identifying and Correcting Urban Bias in Regional Time Series: Surface Temperature in China’s Northern Plains. J. Clim. 1993, 6, 2298–2308. [Google Scholar] [CrossRef]
  3. Ren, G.; Zhou, Y.; Chu, Z.; Zhou, J.; Zhang, A.; Guo, J.; Liu, X. Urbanization effects on observed surface air temperature trends in north China. J. Clim. 2008, 21, 1333–1348. [Google Scholar] [CrossRef]
  4. Sun, X.; Luo, Y.; Gao, X.; Wu, M.; Li, M.; Huang, L.; Zhang, D.-L.; Xu, H. On the Localized Extreme Rainfall over the Great Bay Area in South China with Complex Topography and Strong UHI Effects. Mon. Wea. Rev. 2021, 149, 2777–2801. [Google Scholar] [CrossRef]
  5. Jiang, X.; Luo, Y.; Zhang, D.; Wu, M. Urbanization Enhanced Summertime Extreme Hourly Precipitation over the Yangtze River Delta. J. Clim. 2020, 33, 5809–5826. [Google Scholar] [CrossRef]
  6. Wen, J.; Chen, J.; Lin, W.; Jiang, B.; Xu, S.; Lan, J. Impacts of Anthropogenic Heat Flux and Urban Land-Use Change on Frontal Rainfall near Coastal Regions: A Case Study of a Rainstorm over the Pearl River Delta, South China. J. Appl. Meteorol. Clim. 2020, 59, 363–379. [Google Scholar] [CrossRef]
  7. Wang, X.; Lin, W.; Yang, L.; Deng, R.; Lin, H. A numerical study of influences of urban land-use change on ozone distribution over the Pearl River Delta Region, China. Tellus B Chem. Phys. Meteorol. 2007, 59, 633–641. [Google Scholar] [CrossRef]
  8. Zhang, H.; Wang, S.; Hao, J.; Wang, X.; Wang, S.; Chai, F.; Li, M. Air pollution and control action in Beijing. J. Clean. Prod. 2016, 112, 1519–1527. [Google Scholar] [CrossRef]
  9. Mishra, V.; Dennis, P. Climatic trends in major U.S. urban areas, 1950–2009. Geophys. Res. Lett. 2011, 38. [Google Scholar] [CrossRef]
  10. Westra, S.; Alexander, L.; Zwiers, F. Global increasing trends in annual maximum daily precipitation. J. Clim. 2013, 26, 3904–3918. [Google Scholar] [CrossRef]
  11. Zhang, D. Rapid urbanization and more extreme rainfall events. Sci. Bull. 2020, 65, 516–518. [Google Scholar] [CrossRef] [PubMed]
  12. Shepherd, J. A review of current investigations of urban-induced rainfall and recommendations for the future. Earth Interact. 2005, 9, 1–27. [Google Scholar] [CrossRef]
  13. Liang, X.; Miao, S.; Li, J.; Bornstein, R.; Zhang, X.; Gao, Y.; Chen, F.; Cao, X.; Cheng, Z.; Clements, C.; et al. SURF: Understanding and predicting urban convection and haze. Bull. Amer. Meteor. Soc. 2018, 99, 1391–1413. [Google Scholar] [CrossRef]
  14. Chen, F.; Yu, B.; Wu, M.; Yang, X. Improved Urban Finescale Forecasting During a Heat Wave by Using High-Resolution Urban Canopy Parameters. Front. Clim. 2022, 3, 771441. [Google Scholar] [CrossRef]
  15. Miao, Y.; Liu, S.; Zheng, Y.; Wang, S.; Chen, B. Numerical Study of the Effects of Topography and Urbanization on the Local Atmospheric Circulations over the Beijing-Tianjin-Hebei, China. Adv. Meteor. 2015, 2015, 397070. [Google Scholar] [CrossRef]
  16. Shui, T.; Liu, J.; Zhang, P.; Liu, S.; Zhao, Z. Development of an urban canopy model for the evaluation of urban thermal climate with snow cover in severe cold regions. Build. Environ. 2016, 95, 160–170. [Google Scholar] [CrossRef]
  17. Kusaka, H.; Kimura, F. Coupling a single-layer urban canopy model with a simple atmospheric model: Impact on urban heat island simulation for an idealized case. J. Meteor. Soc. Jpn. 2004, 82, 67–80. [Google Scholar] [CrossRef]
  18. Kusaka, H.; Kondo, H.; Kikegawa, Y.; Kimura, F. A simple single-layer urban canopy model for atmospheric models: Comparison with multi-layer and slab models. Bound-Layer Meteor. 2001, 101, 329–358. [Google Scholar] [CrossRef]
  19. Martilli, A.; Clappier, A.; Rotach, M. An urban surface exchange parameterisation for mesoscale models. Bound-Layer Meteor. 2002, 104, 261–304. [Google Scholar] [CrossRef]
  20. Chen, F.; Kusaka, H.; Bornstein, R.; Ching, J.; Grimmond, S.; Grossman-Clarke, S.; Loridan, T.; Manning, K.W.; Martilli, A.; Miao, S.; et al. The integrated WRF/urban modelling system: Development, evaluation, and applications to urban environmental problems. Int. J. Climatol. 2011, 31, 273–288. [Google Scholar] [CrossRef]
  21. Liu, Y.; Chen, F.; Warner, T.; Basara, J. Verification of a mesoscale data-assimilation and forecasting system for the Oklahoma City area during the Joint Urban 2003 field project. J. Appl. Meteorol. Clim. 2006, 45, 912–929. [Google Scholar] [CrossRef]
  22. Ganeshan, M.; Murtugudde, R.; Imhoff, M. A multi-city analysis of the UHI-influence on warm season rainfall. Urban Clim. 2013, 6, 1–23. [Google Scholar] [CrossRef]
  23. Changnon, S. Rainfall changes in summer caused by St. Louis. Science 1979, 205, 402–404. [Google Scholar] [CrossRef] [PubMed]
  24. Shepherd, J.; Harold, P.; Negri, A. Rainfall modification by major urban areas: Observations from spaceborne rain radar on the TRMM satellite. J. Appl. Meteor. 2002, 41, 689–701. [Google Scholar] [CrossRef]
  25. Niyogi, D.; Lei, M.; Kishtawal, C.; Schmid, P.; Shepherd, M. Urbanization impacts on the summer heavy rainfall climatology over the eastern United States. Earth Interact. 2017, 21, 1–7. [Google Scholar] [CrossRef]
  26. Bornstein, R.; Lin, Q. Urban heat islands and summertime convective thunderstorms in Atlanta: Three case studies. Atmos. Environ. 2000, 34, 507–516. [Google Scholar] [CrossRef]
  27. Dou, J.; Wang, Y.; Bornstein, R.; Miao, S. Observed spatial characteristics of Beijing urban climate impacts on summer thunderstorms. J. Appl. Meteorol. Clim. 2015, 54, 94–105. [Google Scholar] [CrossRef]
  28. Wan, H.; Zhong, Z.; Yang, X.; Li, X. Ensembles to model the impact of urbanization for a summertime rainstorm process in Yangtze River Delta, China. Meteorol. Appl. 2015, 22, 105–112. [Google Scholar] [CrossRef]
  29. Miao, S.; Chen, F.; Li, Q.; Fan, S. Impacts of Urban Processes and Urbanization on Summer Precipitation: A Case Study of Heavy Rainfall in Beijing on 1 August 2006. J. Appl. Meteorol. Clim. 2011, 50, 806–825. [Google Scholar] [CrossRef]
  30. Dou, J.; Bornstein, R.; Miao, S.; Sun, J.; Zhang, Y. Observation and simulation of a bifurcating thunderstorm over Beijing. J. Appl. Meteorol. Clim. 2020, 59, 2129–2148. [Google Scholar] [CrossRef]
  31. Xian, T.; Guo, J.; Zhao, R.; Su, T.; Li, Z. The impact of urbanization on mesoscale convective systems in the Yangtze River Delta region of China: Insights gained from observations and modeling. J. Geophys. Res. Atmos. 2023, 128, e2022JD037709. [Google Scholar] [CrossRef]
  32. Zhong, S.; Qian, Y.; Zhao, C.; Leung, R.; Wang, H.; Yang, B.; Fan, J.; Yan, H.; Yang, X.-Q.; Liu, D. Urbanization-induced urban heat island and aerosol effects on climate extremes in the Yangtze River Delta region of China. Atmos. Chem. Phys. 2017, 17, 5439–5457. [Google Scholar] [CrossRef]
  33. Luo, Y.; Zhang, J.; Yu, M.; Liang, X.; Xia, R.; Gao, Y.; Gao, X.; Yin, J. On the Influences of Urbanization on the Extreme Rainfall over Zhengzhou on 20 July 2021, A Convection-Permitting Ensemble Modeling Study. Adv. Atmos. Sci. 2023, 40, 393–409. [Google Scholar] [CrossRef]
  34. Chen, L.; Ng, E. Quantitative urban climate mapping based on a geographical database: A simulation approach using Hong Kong as a case study. Int. J. Appl. Earth Obs. Geoinf. 2011, 13, 586–594. [Google Scholar] [CrossRef]
  35. Martilli, A. Current research and future challenges in urban mesoscale modelling. Int. J. Climatol. 2007, 27, 1909–1918. [Google Scholar] [CrossRef]
  36. He, X.; Li, Y.; Wang, X.; Chen, L.; Yu, B.; Zhang, Y.; Miao, S. High-resolution dataset of urban canopy parameters for Beijing and its application to the integrated WRF/Urban modelling system. J. Clean. Prod. 2019, 208, 373–383. [Google Scholar] [CrossRef]
  37. Ching, J.; Brown, M.; Burian, S. National Urban Database and Access Portal Tool. Bull. Am. Meteor. Soc. 2009, 90, 1157–1168. [Google Scholar] [CrossRef]
  38. Baik, J.; Kim, Y.; Chun, H. Dry and moist convection forced by an urban heat island. J. Appl. Meteor. 2001, 40, 1462–1475. [Google Scholar] [CrossRef]
  39. Kaufmann, R.; Seto, K.; Schneider, A.; Liu, Z.; Zhou, L.; Wang, W. Climate response to rapid urban growth: Evidence of a human-induced precipitation deficit. J. Clim. 2007, 20, 2299–2306. [Google Scholar] [CrossRef]
  40. Coutts, A.; Daly, E.; Beringer, J.; Tapper, N. Assessing practical measures to reduce urban heat: Green and cool roofs. Build. Environ. 2013, 70, 266–276. [Google Scholar] [CrossRef]
  41. Liu, X.; Tian, G.; Feng, J.; Wang, J.; Kong, L. Assessing summertime urban warming and the cooling efficacy of adaptation strategy in the Chengdu-Chongqing metropolitan region of China. Sci. Total Environ. 2018, 610–611, 1092–1102. [Google Scholar] [CrossRef] [PubMed]
  42. Zhou, X.; Chen, H. Impact of urbanization-related land use land cover changes and urban morphology changes on the urban heat island phenomenon. Sci. Total Environ. 2018, 635, 1467–1476. [Google Scholar] [CrossRef] [PubMed]
  43. Zonato, A.; Martilli, A.; Di Sabatino, S.; Zardi, D.; Giovannini, L. Evaluating the performance of a novel WUDAPT averaging technique to define urban morphology with mesoscale models. Urban Clim. 2020, 31, 100584. [Google Scholar] [CrossRef]
  44. Yu, M.; Chen, X.; Yang, J.; Miao, S. A new perspective on evaluating high-resolution urban climate simulation with urban canopy parameters. Urban Clim. 2021, 38, 100919. [Google Scholar] [CrossRef]
  45. Shen, C.; Chen, X.; Dai, W.; Li, X.; Wu, J.; Fan, Q.; Wang, X.; Zhu, L.; Chan, P.; Hang, J.; et al. Impacts of High-Resolution Urban Canopy Parameters within the WRF Model on Dynamical and Thermal Fields over Guangzhou, China. J. Appl. Meteorol. Clim. 2019, 58, 1155–1176. [Google Scholar] [CrossRef]
  46. Zhang, C.; Chen, F.; Miao, S.; Li, Q.; Xia, X.; Xuan, C. Impacts of urban expansion and future green planting on summer precipitation in the Beijing metropolitan area. J. Geophys. Res. Atmos. 2009, 114, D02116. [Google Scholar] [CrossRef]
  47. Zhong, S.; Qian, Y.; Zhao, C.; Leung, R.; Yang, X. A case study of urbanization impact on summer precipitation in the Greater Beijing Metropolitan Area: Urban heat island versus aerosol effects. J. Geophys. Res. Atmos. 2015, 120, 10903–10914. [Google Scholar] [CrossRef]
  48. Wang, X.; Sun, X.; Tang, J.; Yang, X. Urbanization-induced regional warming in yangtze river delta: Potential role of anthropogenic heat release. Int. J. Climatol. 2015, 35, 4417–4430. [Google Scholar] [CrossRef]
  49. Jiang, X.; Zhang, D.; Luo, Y. Influences of Urbanization on an Afternoon Heavy Rainfall Event over the Yangtze River Delta Region. Mon. Wea. Rev. 2023, 151, 815–832. [Google Scholar] [CrossRef]
  50. Wu, M.; Luo, Y.; Chen, F.; Wong, W. Observed Link of Extreme Hourly Precipitation Changes to Urbanization over Coastal South China. J. Appl. Meteor. Clima. 2019, 58, 1799–1819. [Google Scholar] [CrossRef]
  51. Li, Y.; Wang, W.; Chang, M.; Wang, X. Impacts of urbanization on extreme precipitation in the Guangdong-Hong Kong-Macau Greater Bay Area. Urban Clim. 2021, 38, 100904. [Google Scholar] [CrossRef]
  52. Chen, F.; Yang, X.; Wu, J. Simulation of the urban climate in a Chinese megacity with spatially heterogeneous anthropogenic heat data. J. Geophys. Res. Atmos. 2016, 121, 5193–5212. [Google Scholar] [CrossRef]
  53. Skamarock, W.; Klemp, J.; Dudhia, J.; Gill, D.O.; Liu, Z.; Berner, J.; Huang, X.Y. A Description of the Advanced Research WRF Version 4; NCAR Technical Notes NCAR/TN-556+STR 2019; UCAR: Boulder, CO, USA, 2019; pp. 145p. [Google Scholar]
  54. Berner, J.; Ha, S.; Hacker, J.; Fournier, A.; Snyder, C. Model uncertainty in a mesoscale ensemble prediction system: Stochastic versus multiphysics representations. Mon. Wea. Rev. 2011, 139, 1972–1995. [Google Scholar] [CrossRef]
  55. Yu, M.; Miao, S.; Zhang, H. Uncertainties in the impact of urbanization on heavy rainfall: Case study of a rainfall event in Beijing on 7 August 2015. J. Geophys. Res. Atmos. 2018, 123, 6005–6021. [Google Scholar] [CrossRef]
  56. Iacono, M.; Delamere, J.; Mlawer, E.; Shephard, M.; Clough, S.; Collins, W. Radiative forcing by long-lived greenhouse gases: Calculations with the AER radiative transfer models. J. Geophys. Res. Atmos. 2008, 113, D13103. [Google Scholar] [CrossRef]
  57. Chen, S.; Sun, W. A One-dimensional Time Dependent Cloud Model. J. Meteor. Soc. Jpn. Ser. II 2002, 80, 99–118. [Google Scholar] [CrossRef]
  58. Hong, S.; Lim, J. The WRF single-moment 6-class microphysics scheme (WSM6). J. Korean Meteor. Soc. 2006, 42, 129–151. [Google Scholar]
  59. Lim, K.; Hong, S. Development of an Effective Double-Moment Cloud Microphysics Scheme with Prognostic Cloud Condensation Nuclei (CCN) for Weather and Climate Models. Mon. Wea. Rev. 2010, 138, 1587–1612. [Google Scholar] [CrossRef]
  60. Janjić, Z. The Step-Mountain Eta Coordinate Model: Further Developments of the Convection, Viscous Sublayer, and Turbulence Closure Schemes. Mon. Wea. Rev. 1994, 122, 927–945. [Google Scholar] [CrossRef]
  61. Mesinger, F. Forecasting upper tropospheric turbulence within the framework of the Mellor-Yamada 2.5 closure. Res. Activ. Atmos. Oceanic Mod. 1993. Available online: https://www.researchgate.net/profile/Fedor-Mesinger/publication/343610849_Forecasting_upper_tropospheric_turbulence_within_the_framework_of_the_Mellor-Yamada_25_closure/links/5f341119458515b7291bc95c/Forecasting-upper-tropospheric-turbulence-within-the-framework-of-the-Mellor-Yamada-25-closure.pdf (accessed on 1 July 2018).
  62. Bougeault, P.; Lacarrere, P. Parameterization of Orography-Induced Turbulence in a Mesobeta-Scale Model. Mon. Wea. Rev. 1989, 117, 1872–1890. [Google Scholar] [CrossRef]
  63. Tewari, M.; Chen, F.; Wang, W.; Dudhia, J.; LeMone, M.A.; Mitchell, K.; Cuenca, R.H. Implementation and verification of the united NOAH land surface model in the WRF model. In Proceedings of the 20th Conference on Weather Analysis and Forecasting/16th Conference on Numerical Weather Prediction, Seattle, WA, USA, 12–16 January 2004; Volume 1115, pp. 2165–2170. [Google Scholar]
  64. Niu, G.; Yang, Z.; Mitchell, K.; Chen, F.; Ek, M.B.; Barlage, M.; Xia, Y. The community Noah land surface model with multiparameterization options (Noah-MP): 1. Model description and evaluation with local-scale measurements. J. Geophys. Res. Atmos. 2011, 116, D12109. [Google Scholar] [CrossRef]
  65. Hersbach, H.; Bell, B.; Berrisford, P.; Dahlgren, P.; Horányi, A.; Munoz-Sebater, J.; Soci, C. The ERA5 Global Reanalysis: Achieving a detailed record of the climate and weather for the past 70 years. Eur. Geophys. Union Gen. Assem. 2020, 3–8. Available online: https://ui.adsabs.harvard.edu/abs/2020EGUGA..2210375H/abstract (accessed on 12 July 2021).
  66. Strahler, A. MODIS Land Cover Product Algorithm Theoretical Basis Document (ATBD) Version 5.0. Tech. Rep. 1999, 72, 42–47. [Google Scholar]
  67. Chen, F.; Yang, X.; Zhu, W. WRF simulations of urban heat island under hot-weather synoptic conditions: The case study of Hangzhou City, China. Atmos. Res. 2014, 138, 364–377. [Google Scholar] [CrossRef]
  68. Chen, F.; Wu, M.; Dong, M.; Yu, B. Comparison of the Impacts of Topography and Urbanization on an Extreme Rainfall Event in the Hangzhou Bay Region. J. Geophys. Res. Atmos. 2022, 127, e2022JD037060. [Google Scholar] [CrossRef]
  69. Ikeda, K.; Rasmussen, R.; Liu, C.; Gochis, D.; Yates, D.; Chen, F.; Tewari, M.; Barlage, M.; Dudhia, J.; Miller, K.; et al. Simulation of seasonal snowfall over Colorado. Atmos. Res. 2010, 97, 462–477. [Google Scholar] [CrossRef]
  70. Xu, L.; Dong, M.; Chen, F. Comparison study of spatial interpolation methods based on hourly precipitation data from automatic weather stations. J. Meteor. Environ. 2017, 33, 34–43. (In Chinese) [Google Scholar]
  71. Gaur, A.; Lacasse, M.; Armstrong, M.; Lu, H.; Shu, C.; Fields, A.; Palou, F.S.; Zhang, Y. Effects of using different urban parametrization schemes and land-cover datasets on the accuracy of WRF model over the City of Ottawa. Urban Clim. 2021, 35, 100737. [Google Scholar] [CrossRef]
  72. Guo, X.; Fu, D.; Wang, J. Mesoscale convective precipitation system modified by urbanization in Beijing City. Atmos. Res. 2006, 82, 112–126. [Google Scholar] [CrossRef]
  73. Xing, Y.; Ni, G.; Yang, L.; Yang, Y.; Xing, P.; Sun, T. Modeling the impacts of urbanization and open water surface on heavy convective rainfall: A case study over the emerging Xiong’an City, China. J. Geophys. Res. Atmos. 2019, 124, 9078–9098. [Google Scholar] [CrossRef]
  74. Carter, M.; Shepherd, J.; Burian, S.; Jeyachandran, I. Integration of lidar data into a coupled mesoscale–land surface model: A theoretical assessment of sensitivity of urban–coastal mesoscale circulations to urban canopy parameters. J. Atmos. Ocean. Technol. 2012, 29, 328–346. [Google Scholar] [CrossRef]
  75. Buizza, R. Potential Forecast Skill of Ensemble Prediction and Spread and Skill Distributions of the ECMWF Ensemble Prediction System. Mon. Wea. Rev. 1997, 125, 99–119. [Google Scholar] [CrossRef]
  76. Miao, S.; Chen, F.; LeMone, M.; Tewari, M.; Li, Q.; Wang, Y. An Observational and Modeling Study of Characteristics of Urban Heat Island and Boundary Layer Structures in Beijing. J. Appl. Meteor. Clima. 2009, 48, 484–501. [Google Scholar] [CrossRef]
  77. Sun, Y.; Zhang, N.; Miao, S.; Kong, F.; Zhang, Y.; Li, N. Urban Morphological Parameters of the Main Cities in China and Their Application in the WRF Model. J. Adv. Model. Earth Syst. 2021, 13, e2020MS002382. [Google Scholar] [CrossRef]
  78. Salamanca, F.; Martilli, A.; Yagüe, C. A numerical study of the urban heat island over madrid during the DESIREX (2008) campaign with WRF and an evaluation of simple mitigation strategies. Int. J. Climatol. 2012, 32, 2372–2386. [Google Scholar] [CrossRef]
  79. Mughal, M.; Li, X.; Norford, L. Urban heat island mitigation in Singapore: Evaluation using WRF/multilayer urban canopy model and local climate zones. Urban Clim. 2020, 34, 100714. [Google Scholar] [CrossRef]
  80. Chen, F.; Manning, K.; LeMone, M.; Trier, S.B.; Alfieri, J.G.; Roberts, R.; Tewari, M.; Niyogi, D.; Horst, T.W.; Oncley, S.P.; et al. Description and evaluation of the characteristics of the NCAR high-resolution land data assimilation system. J. Appl. Meteor. Climatol. 2007, 46, 694–713. [Google Scholar] [CrossRef]
  81. Chen, J.; Xue, J.; Yan, H. A Comparison of a New Initial Condition and Model Perturbation Method for Heavy Rainfall Ensemble Prediction. Acta Meteor. Sin. 2009, 23, 53–67. [Google Scholar]
Figure 1. The ERA5 reanalysis of geopotential height at 500 hPa (solid lines), wind speed (arrow), and relative humidity (shading) at 850 hPa averaged from 09:00 to 18:00 on 26 July 2018. The black dot indicates the location of Hangzhou.
Land 12 01965 g001
Figure 2. The (a) simulated domain d01 with terrain (m) and (b) land use in domain d02. The black rectangle box (119.9–120.8° E, 29.8–30.7° N) represents the control region of this heavy rain event. The magenta solid line in (b) indicates the Hangzhou–Shaoxing mega-city with an urban fraction ≥0.2. The LR, HR, and CO in (b) represent the land use type of low-density residential, high-density residential, and commercial, respectively.
Land 12 01965 g002
Figure 3. Comparison of the (a1d1) observed and (a2d2) simulated (the member of “m16p8s4u2” in ENCTL, CTL for short) composite radar reflectivity (dBZ) at four selected times on 26 July 2018. Note an approximate shift of 1.5 h between the simulation and observation.
Land 12 01965 g003
Figure 4. Distribution of the 2 m temperature (°C) averaged during 10:00 to 13:00 BST on 26 July 2018: (a1) observation, (b1) ensemble mean, (c1) CTL run, and (d1) spread; (a2d2) the same as (a1d1) but for the 2 m mixing ratio (g kg−1); (a3d3) the same as (a1d1) but for the 10 m wind (m s−1); (a4d4) similar to (a1d1) but for the accumulated precipitation (mm) from 13:00 to 18:00 BST on 26 July 2018.
Land 12 01965 g004
Figure 5. Time series of the (a) 2 m temperature (°C), (b) 2 m mixing ratio (g kg−1), (c) 10 m wind speed (m s−1), and (d) precipitation (mm) averaged over the control region from 08:00 to 20:00 BST on 26 July 2018. The red line denotes observation, the gray lines are the 24 ensemble members, the green line is the CTL (i.e., m16p8s4u2 in ENCTL), and the blue line represents the ensemble mean.
Land 12 01965 g005
Figure 6. Differences between ENCTL and ENNoUB in the ensemble mean (left) and spread (right) of (a,b) 2 m temperature (°C) and (c,d) 2 m mixing ratio (g kg−1), and (e,f) 10 m wind speed (m s−1) during 10:00 to 13:00 BST on 26 July 2018, and (g,h) accumulated precipitation (mm) from 13:00 to 18:00 BST on 26 July 2018.
Land 12 01965 g006
Figure 7. Differences in (a1a3) 2 m temperature (°C) and (b1b3) 2 m mixing ratio (g kg−1), (c1c3) 10 m wind speed (m s−1) averaged during 10:00 to 13:00 BST on 26 July 2018, and (d1d3) accumulated precipitation (mm) during 13:00 to 18:00 BST on 26 July 2018 between the control test (CTL) and (left) NoUB, (middle) NoTH, and (right) NoDY test.
Land 12 01965 g007
Figure 8. Comparison of the impacts of total, thermal, and dynamical effects of urbanization on (a) 2 m temperature (°C), (b) 2 m mixing ratio (g kg−1), and (c) 10 m wind speed (m s−1) averaged during 10:00 to 13:00 BST on 26 July 2018, and (d) accumulated precipitation (mm) averaged during 13:00 to 18:00 BST on 26 July 2018. The red column represents a positive contribution and the blue column represents a negative contribution.
Land 12 01965 g008
Figure 9. The temperature differences (°C) at 10:00 BST on 26 July 2018 between the 16 sensitivity tests in GROUP III (i.e., SEN1, SEN2, …, SEN16) and the CTL (m16p8s4u2) by (a) decreasing the building height; (b) increasing the building height; (c) decreasing the roof width; (d) increasing the roof width; (e) decreasing the road width; (f) increasing the road width; (g) decreasing the anthropogenic heat; (h) increasing the anthropogenic heat; (i) decreasing the heat capacity; (j) increasing the heat capacity; (k) decreasing the thermal conductivity; (l) increasing the thermal conductivity; (m) decreasing the surface albedo; (n) increasing the surface albedo; (o) decreasing the roughness length; and (p) increasing the roughness length by 50%.
Land 12 01965 g009
Figure 10. The same as Figure 9 but for the 2 m mixing ratio (g kg−1): (a) decreasing the building height; (b) increasing the building height; (c) decreasing the roof width; (d) increasing the roof width; (e) decreasing the road width; (f) increasing the road width; (g) de-creasing the anthropogenic heat; (h) increasing the anthropogenic heat; (i) decreasing the heat capacity; (j) increasing the heat capacity; (k) decreasing the thermal conductivity; (l) increasing the thermal conductivity; (m) decreasing the surface albedo; (n) increasing the surface albedo; (o) decreasing the roughness length; and (p) increasing the roughness length by 50%.
Land 12 01965 g010
Figure 11. The same as Figure 9 but for the 10 m wind speed (m s−1): (a) decreasing the building height; (b) increasing the building height; (c) decreasing the roof width; (d) increasing the roof width; (e) decreasing the road width; (f) increasing the road width; (g) de-creasing the anthropogenic heat; (h) increasing the anthropogenic heat; (i) decreasing the heat capacity; (j) increasing the heat capacity; (k) decreasing the thermal conductivity; (l) increasing the thermal conductivity; (m) decreasing the surface albedo; (n) increasing the surface albedo; (o) decreasing the roughness length; and (p) increasing the roughness length by 50%.
Land 12 01965 g011
Figure 12. The same as Figure 9 but for 1 h accumulated precipitation (mm) during 13:00–14:00 BST on 26 July 2018: (a) decreasing the building height; (b) increasing the building height; (c) decreasing the roof width; (d) increasing the roof width; (e) decreasing the road width; (f) increasing the road width; (g) de-creasing the anthropogenic heat; (h) increasing the anthropogenic heat; (i) decreasing the heat capacity; (j) increasing the heat capacity; (k) decreasing the thermal conductivity; (l) increasing the thermal conductivity; (m) decreasing the surface albedo; (n) increasing the surface albedo; (o) decreasing the roughness length; and (p) increasing the roughness length by 50%.
Land 12 01965 g012
Figure 13. Differences in multiple meteorological variables averaged in the control region caused by increasing urban canopy parameters by 50% in each sensitivity test (i.e., SEN1, SEN2, …, SEN16). The colored grid points are the four most changed members in each column. The darker the color, the greater the absolute value. TSK—surface temperature, T2M—2 m temperature, Q2M—2 m mixing ratio, WS10M—10 m wind speed, PREC—precipitation, ALBEDO—surface albedo, SWDOWN—downward shortwave radiation, SWUP—upward shortwave radiation, NSW—net shortwave radiation, GLW—downward longwave radiation, GLWUP—upward longwave radiation, NLW—net longwave radiation, RN—net radiation, LH—latent heat flux, HFX—sensible heat flux, GRDFLX—ground heat flux, UST—friction velocity, TKEP—turbulent kinetic energy flux at 850 hPa, W850—vertical velocity at 850 hPa.
Land 12 01965 g013
Table 1. Model configurations.
Model SettingsD01D02
Model and versionWRF v4.0.2
Horizontal grid points403 × 353413 × 457
Δx (km)41
Vertical layers51
Cumulus physicsNone (0) *
Shortwave radiationRRTMG (4) [56]
Longwave radiationRRTMG (4) [56]
MicrophysicsPurdue Lin (2) [57], WSM6 (6) [58], WDM6 (16) [59]
PBL physicsMYJ (2) [60,61], Boulac (8) [62]
Land surfaceNoah (2) [63], NoahMP (4) [64]
Urban physicsSLUCM (1) [24], BEP (2) [19]
* The numbers in parentheses represent the option number for each physical parameterization scheme.
Table 2. Summary of the numerical experiments.
GroupWRF
Simulations
Physical Parameterization OptionsNotes
GROUP IENCTLMicrophysics (Lin(2), WSM6(6), WDM6(16))1. Choose one option from each physical group, and make up a member named by the option numbers, e.g., m2p2s2u1 represents the Lin(2), MYJ(2), Noah(2), and SLUCM(1) schemes used in this member.
2. 24 members are chosen for the numerical simulation, and the m16p8s4u2 is chosen as the control run (CTL) because of its good performance.
3. The real terrain and land use data are used in the numerical simulation (Figure 2).
Planetary Boundary layer (MYJ(2), BouLac(8))
Land Surface (Noah (2),
NoahMP(4))
Urban Surface (SLUCM(1), BEP(2))
ENNoUBSame as ENCTLSame as ENCT, replace the urban land use type with cropland.
GROUP IICTLWDM6(16) + BouLac(8) + Noahmp(4) + BEP(2)The control run in ENCTL, abbreviated as m16p8s4u2 run.
NOUBSame as CTLSame as CT but artificially remove both the thermal and dynamical effect of urbanization.
NOTHSame as CTLSame as CT but artificially removes the thermal effect of urbanization.
NODYSame as CTLSame as CTL but artificially removes the dynamical effect of urbanization.
GROUP IIICTLWDM6(16) + BouLac(8) + Noahmp(4) + BEP(2)The control run in ENCTL, abbreviated as m16p8s4u2 run.
SEN1/SEN2Same as CTLSame as CTL but decreases/increases the building height by 50%.
SEN3/SEN4Same as CTLSame as CTL but decreases/increases the roof width by 50%.
SEN5/SEN6Same as CTLSame as CTL but decreases/increases the road width by 50%.
SEN7/SEN8Same as CTLSame as CTL but decreases/increases the anthropogenic heat by 50%.
SEN9/SEN10Same as CTLSame as CTL but decreases/increases the heat capacity by 50%.
SEN11/SEN12Same as CTLSame as CTL but decreases/increases the thermal conductivity by 50%.
SEN13/SEN14Same as CTLSame as CTL but decreases/increases the surface albedo by 50%.
SEN15/SEN16Same as CTLSame as CTL but decreases/increases the roughness length by 50%.
Table 3. Threat scores (TSs) of accumulated precipitation (from 13:00 to 18:00 BST on 26 July 2018) for the ensemble study on different physical schemes *.
CASESTS (≥0.1 mm)TS (≥10 mm)TS (≥25 mm)TS (≥50 mm)
m2p2s2u10.87 0.32 0.16 0.02
m2p2s2u20.92 0.47 0.27 0.07
m2p2s4u10.90 0.41 0.21 0.04
m2p2s4u20.93 0.52 0.24 0.07
m2p8s2u10.84 0.44 0.19 0.02
m2p8s2u20.87 0.43 0.19 0.03
m2p8s4u10.82 0.43 0.28 0.16
m2p8s4u20.86 0.41 0.19 0.06
m6p2s2u10.87 0.34 0.14 0.00
m6p2s2u20.88 0.34 0.07 0.00
m6p2s4u10.90 0.36 0.16 0.02
m6p2s4u20.85 0.37 0.14 0.02
m6p8s2u10.86 0.28 0.10 0.11
m6p8s2u20.92 0.39 0.14 0.02
m6p8s4u10.84 0.43 0.17 0.04
m6p8s4u20.84 0.40 0.12 0.00
m16p2s2u10.92 0.53 0.26 0.03
m16p2s2u20.92 0.48 0.15 0.02
m16p2s4u10.90 0.49 0.15 0.02
m16p2s4u20.92 0.61 0.34 0.02
m16p8s2u10.86 0.52 0.20 0.04
m16p8s2u20.93 0.53 0.19 0.02
m16p8s4u10.90 0.60 0.30 0.15
m16p8s4u20.92 0.56 0.33 0.07
Mean0.87 0.37 0.14 0.03
* The colored grid points are the top 25% of members. The darker the color, the higher the model performance.
Table 4. The deviation (BIAS) and root-mean-square error (RMSE) of accumulated precipitation (from 13:00 to 18:00 BST on 26 July 2018) for the ensemble study on different physical schemes.
VariablesScoresEnsemble MeanEnsemble Variation
T2MBIAS (°C)−1.430.27
RMSE (°C)1.970.16
Q2MBIAS (g kg−1)−1.830.42
RMSE (g kg−1)2.540.20
WS10MBIAS (m s−1)1.310.13
RMSE (m s−1)1.730.09
PRECBIAS (mm)−6.1413.64
RMSE (mm)29.082.22
Disclaimer/Publisher’s Note: The statements, opinions and data contained in all publications are solely those of the individual author(s) and contributor(s) and not of MDPI and/or the editor(s). MDPI and/or the editor(s) disclaim responsibility for any injury to people or property resulting from any ideas, methods, instructions or products referred to in the content.

