
Land Cover Changing Pattern in Pre- and Post-Earthquake Affected Area from Remote Sensing Data: A Case of Lushan County, Sichuan Province


Abstract
:1. Introduction
2. Materials
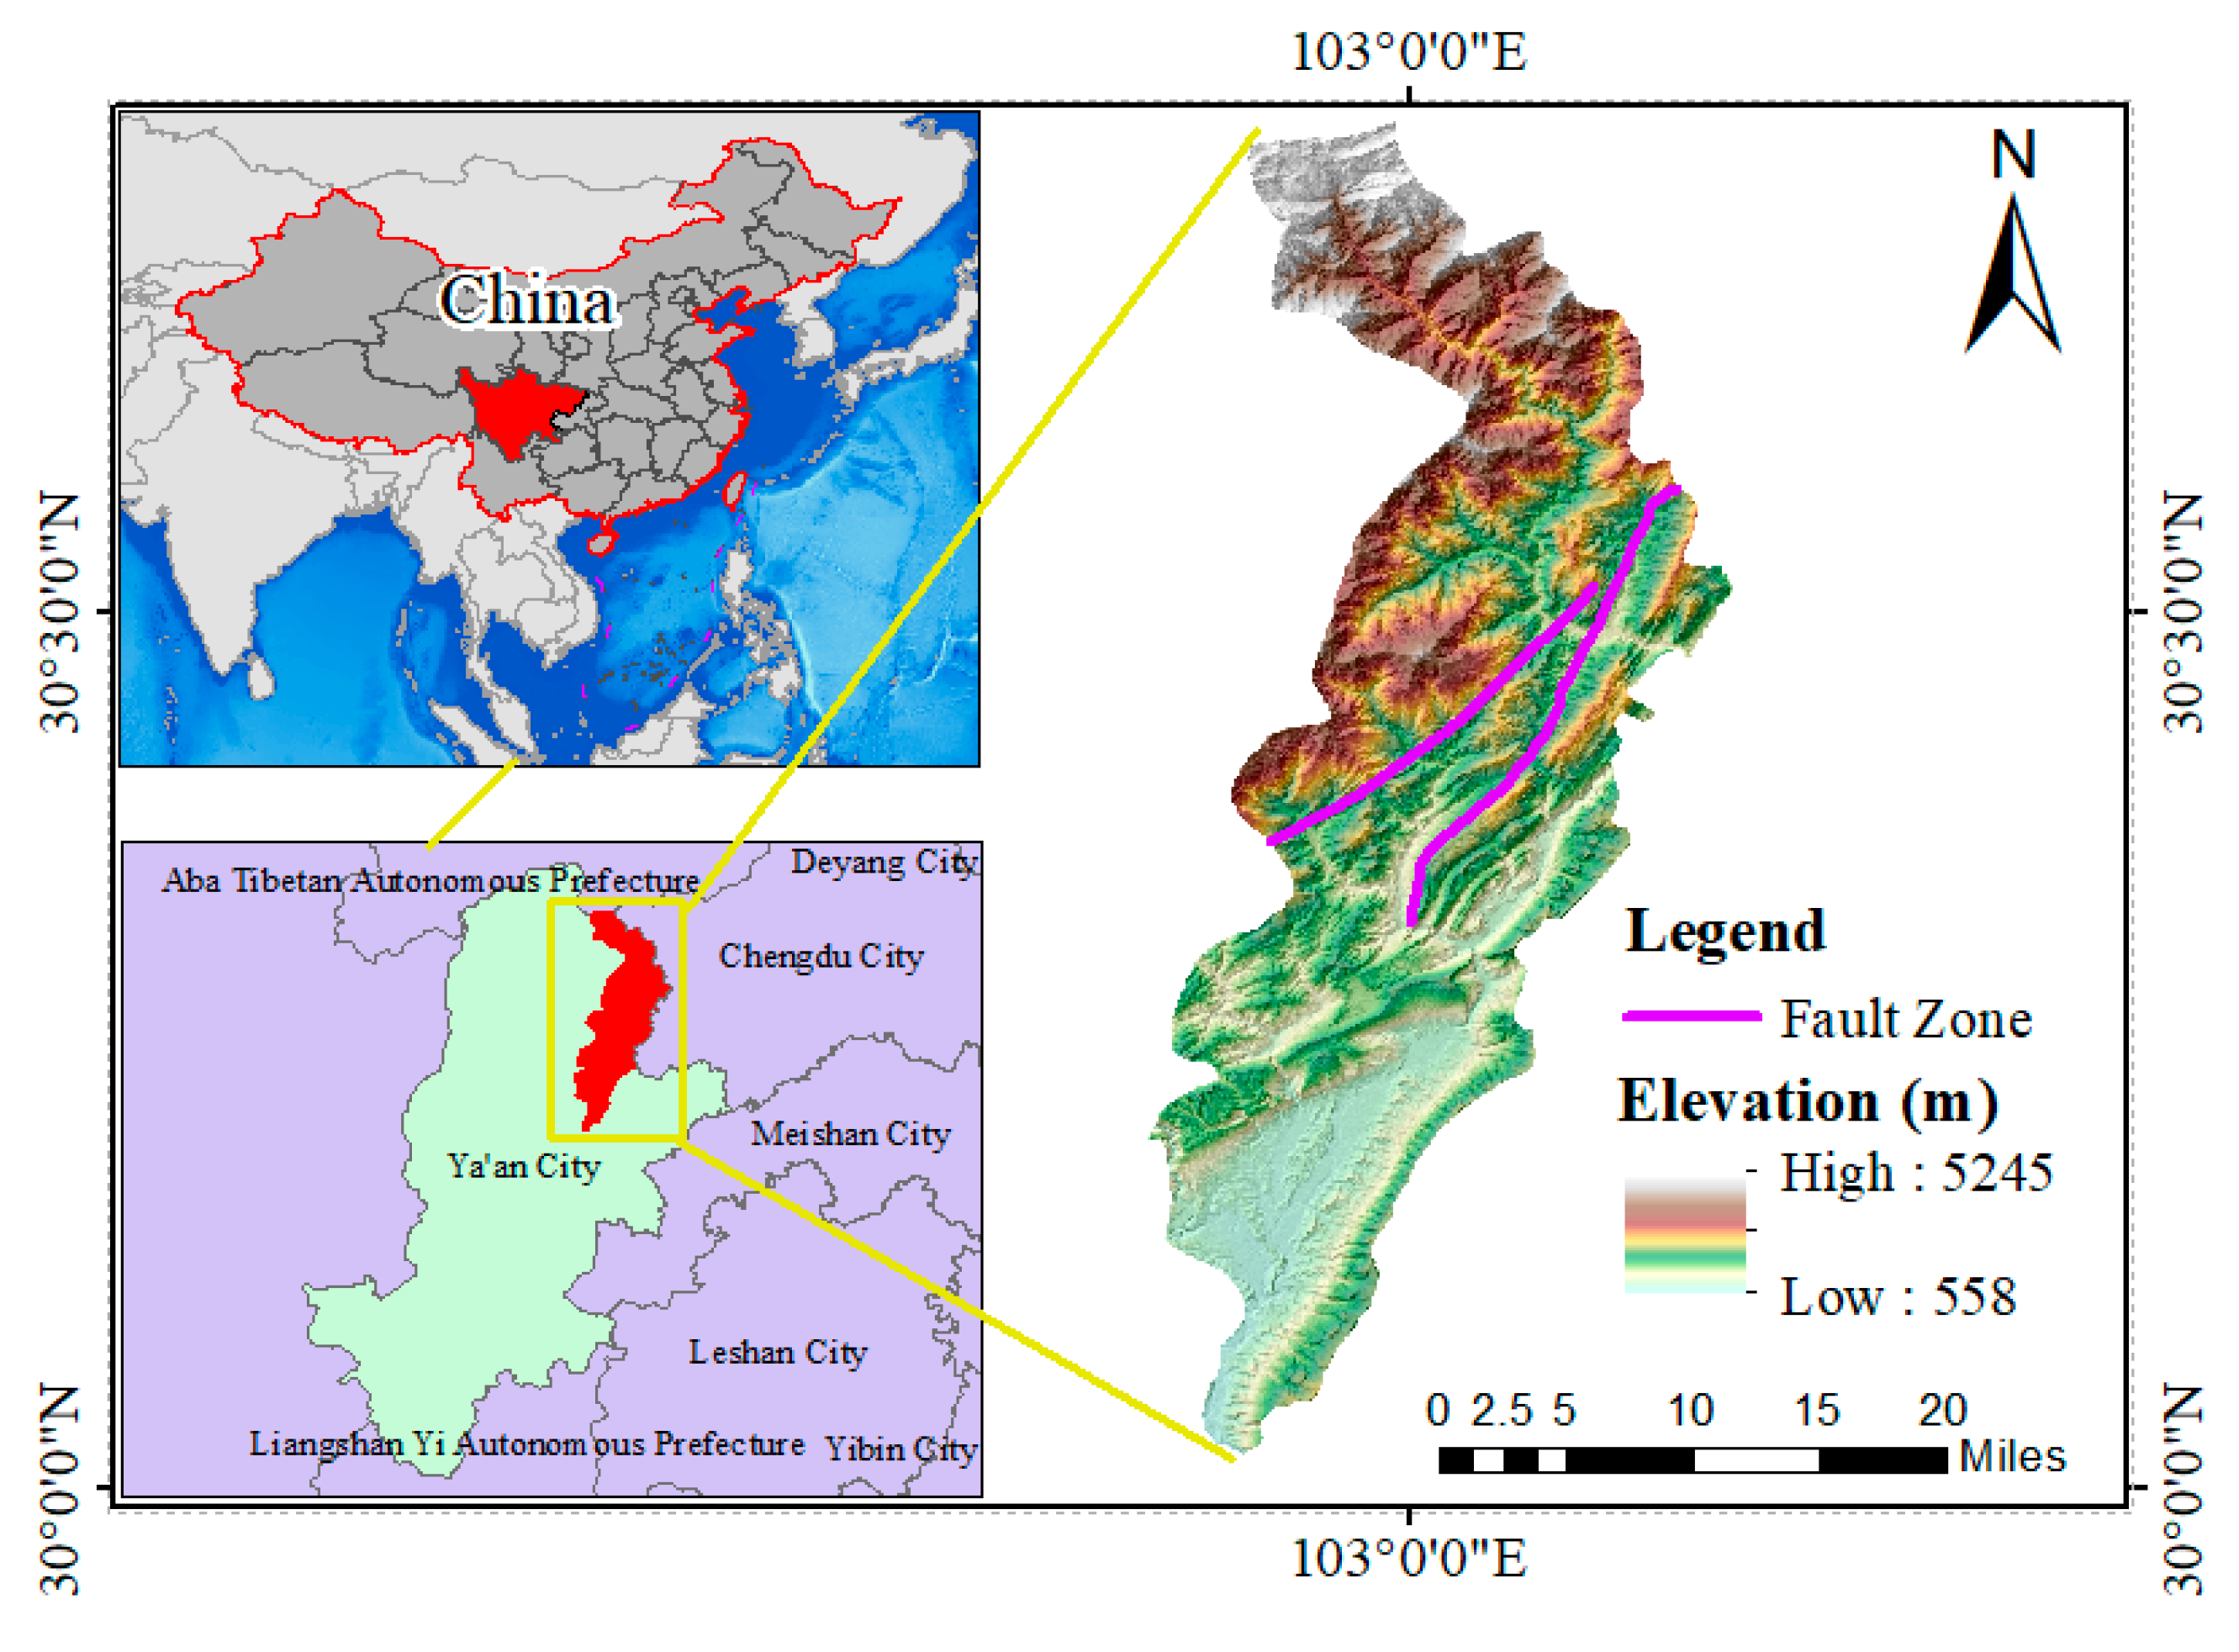
2.1. Study Area
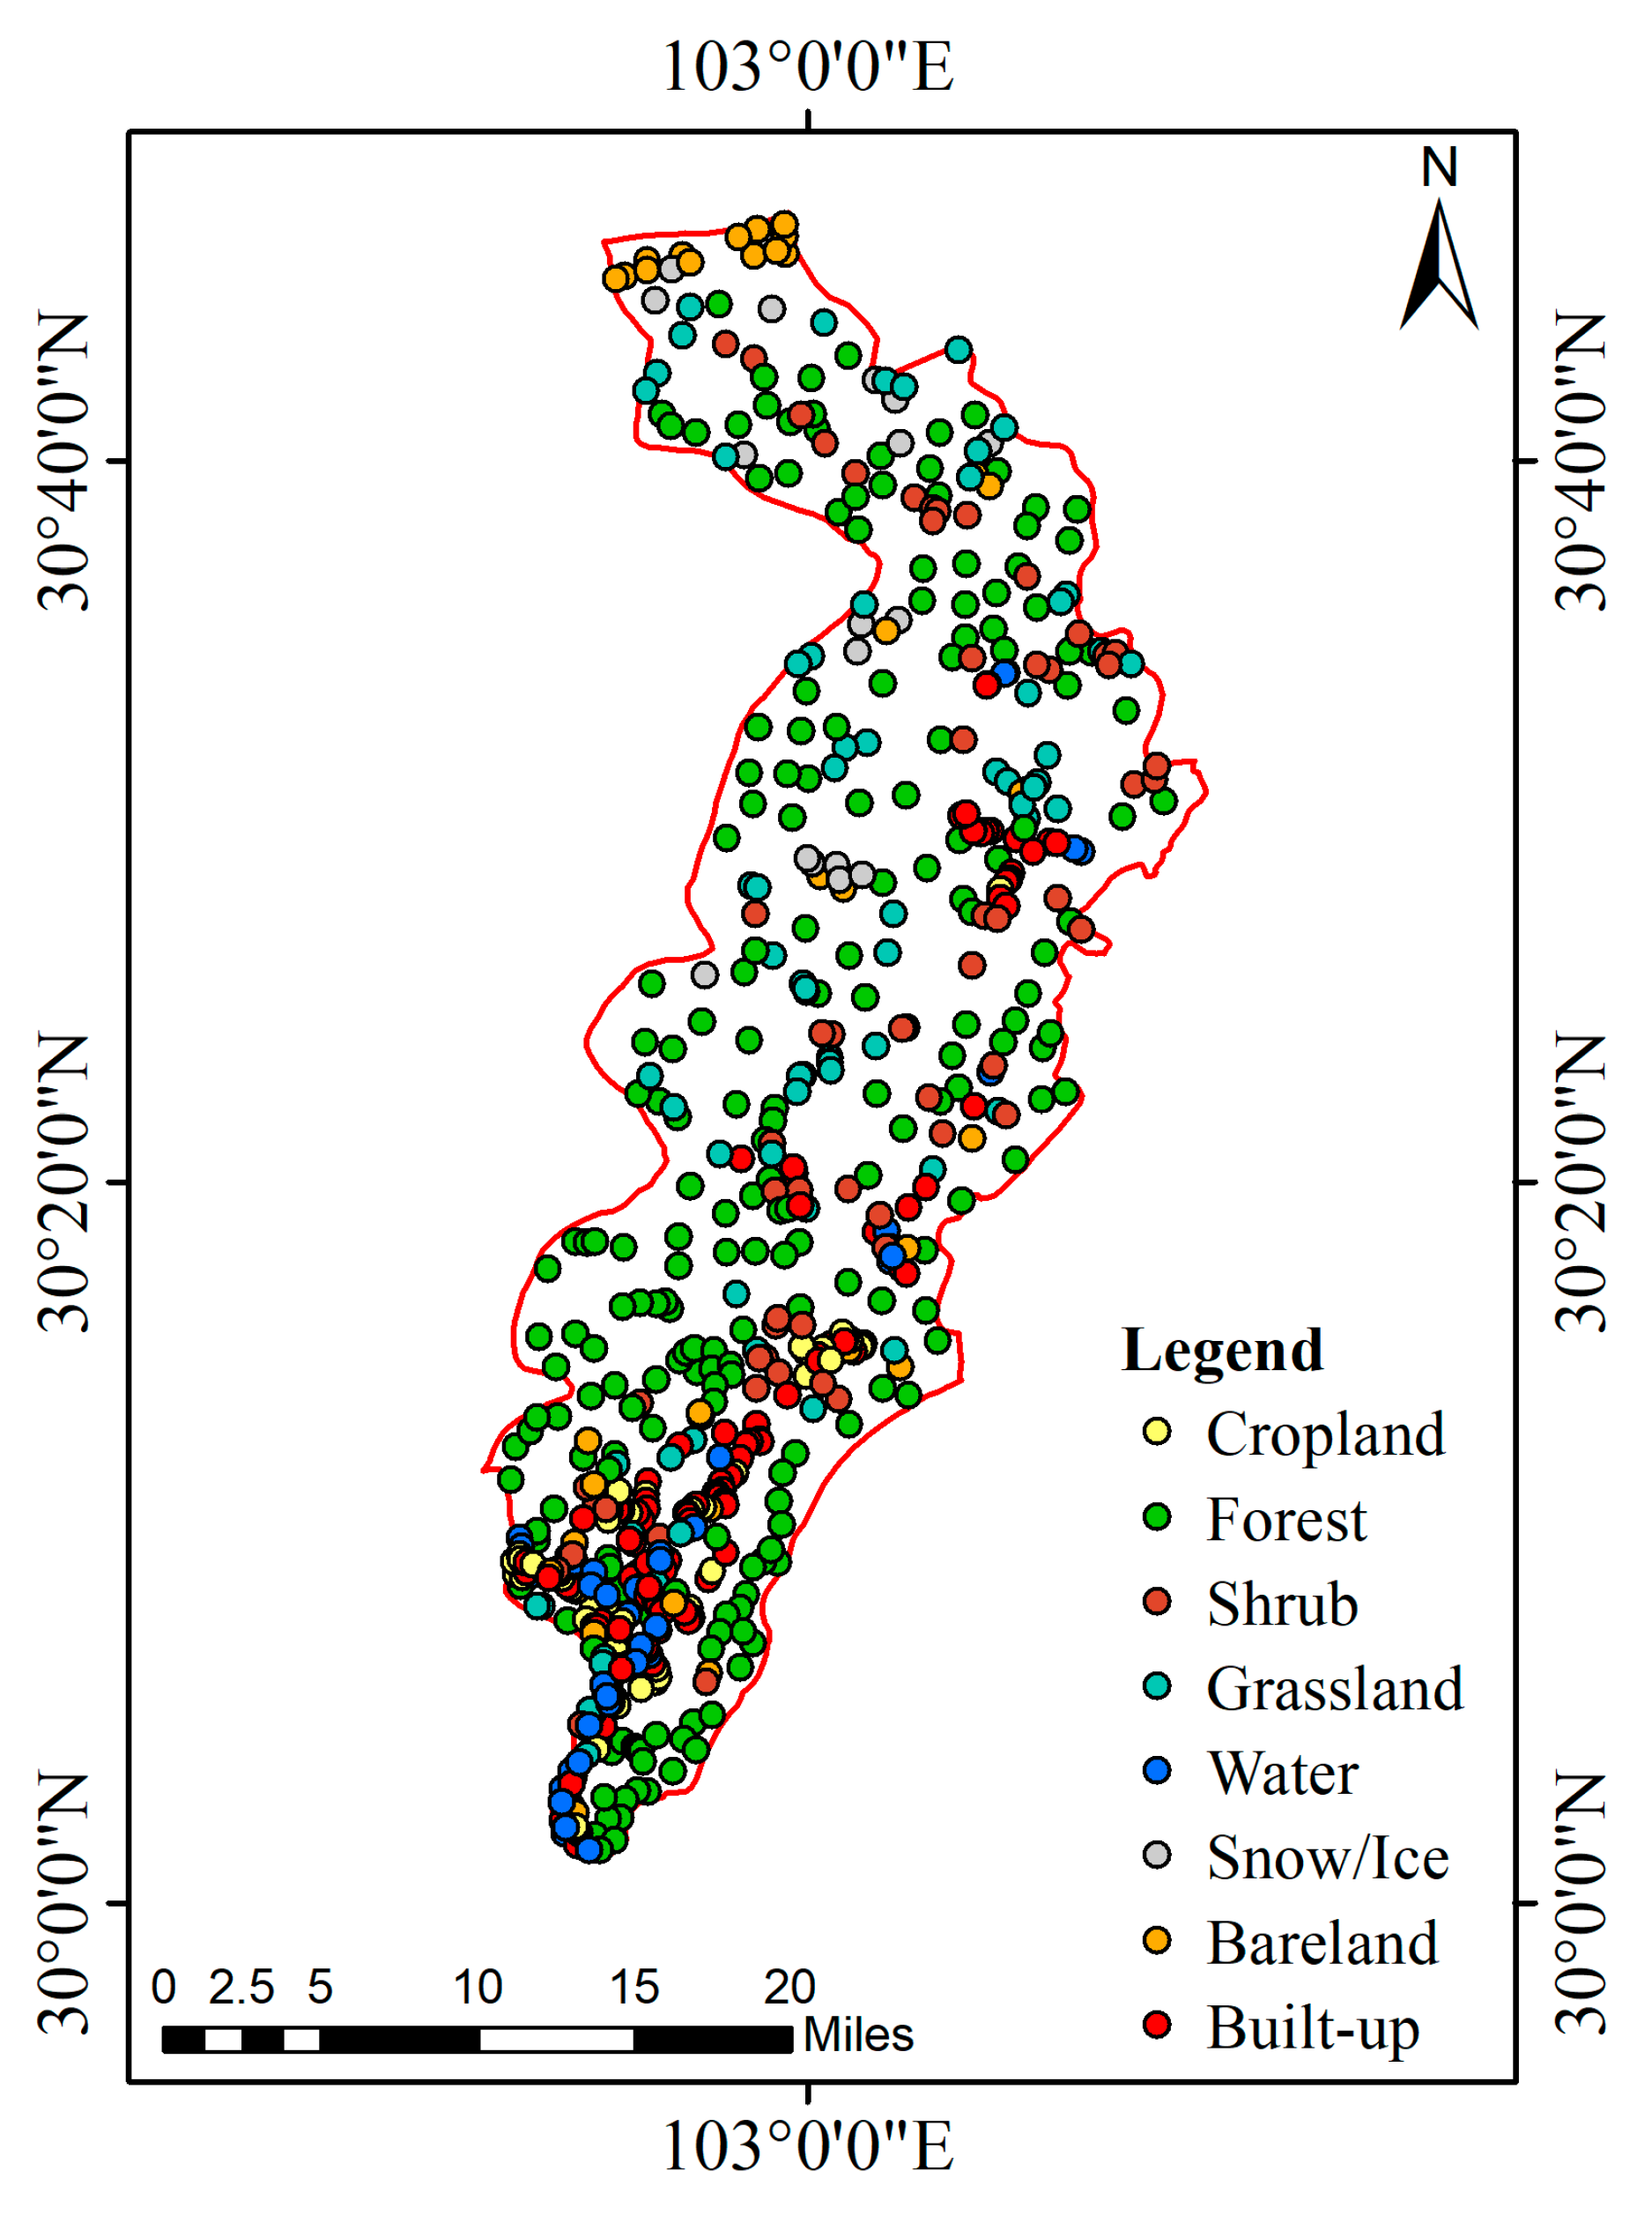
2.2. Data and Preprocessing
3. Methods
3.1. Composite Land Cover Index
3.2. Land Cover Transfer Matrix
3.3. Landscape Ecology Index
3.4. Fracture Zone Buffer Analysis Method
4. Results
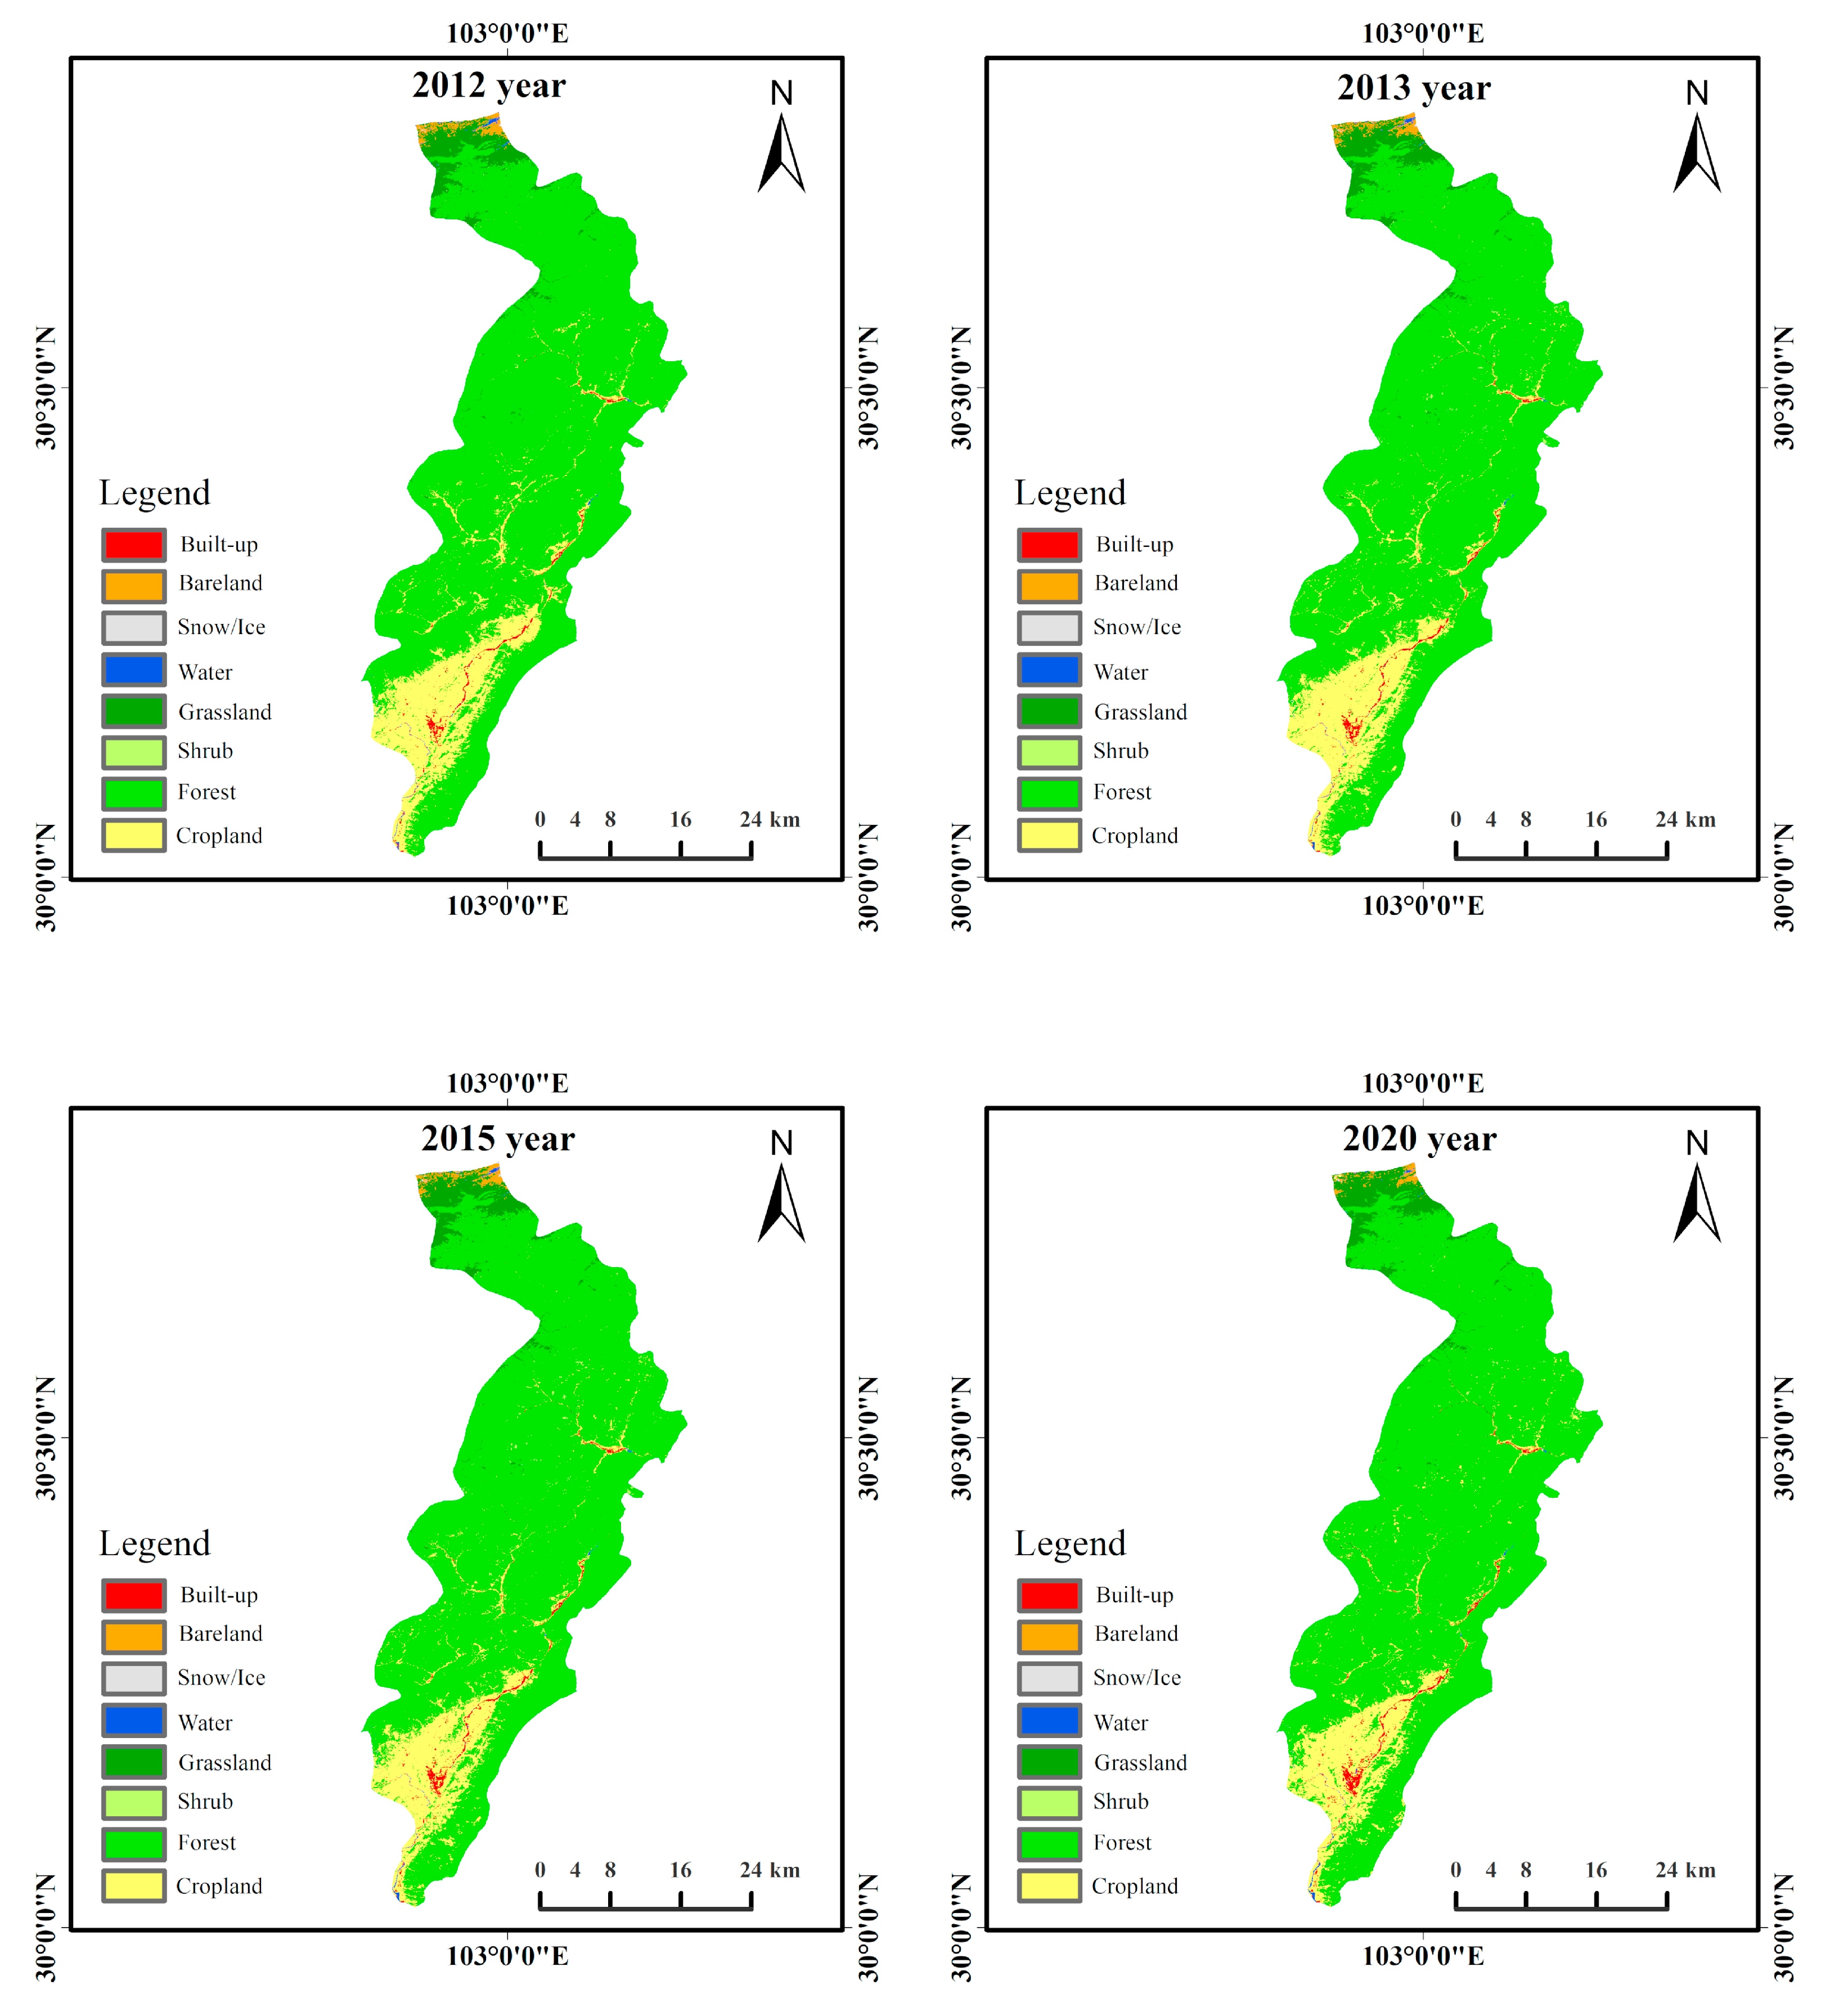
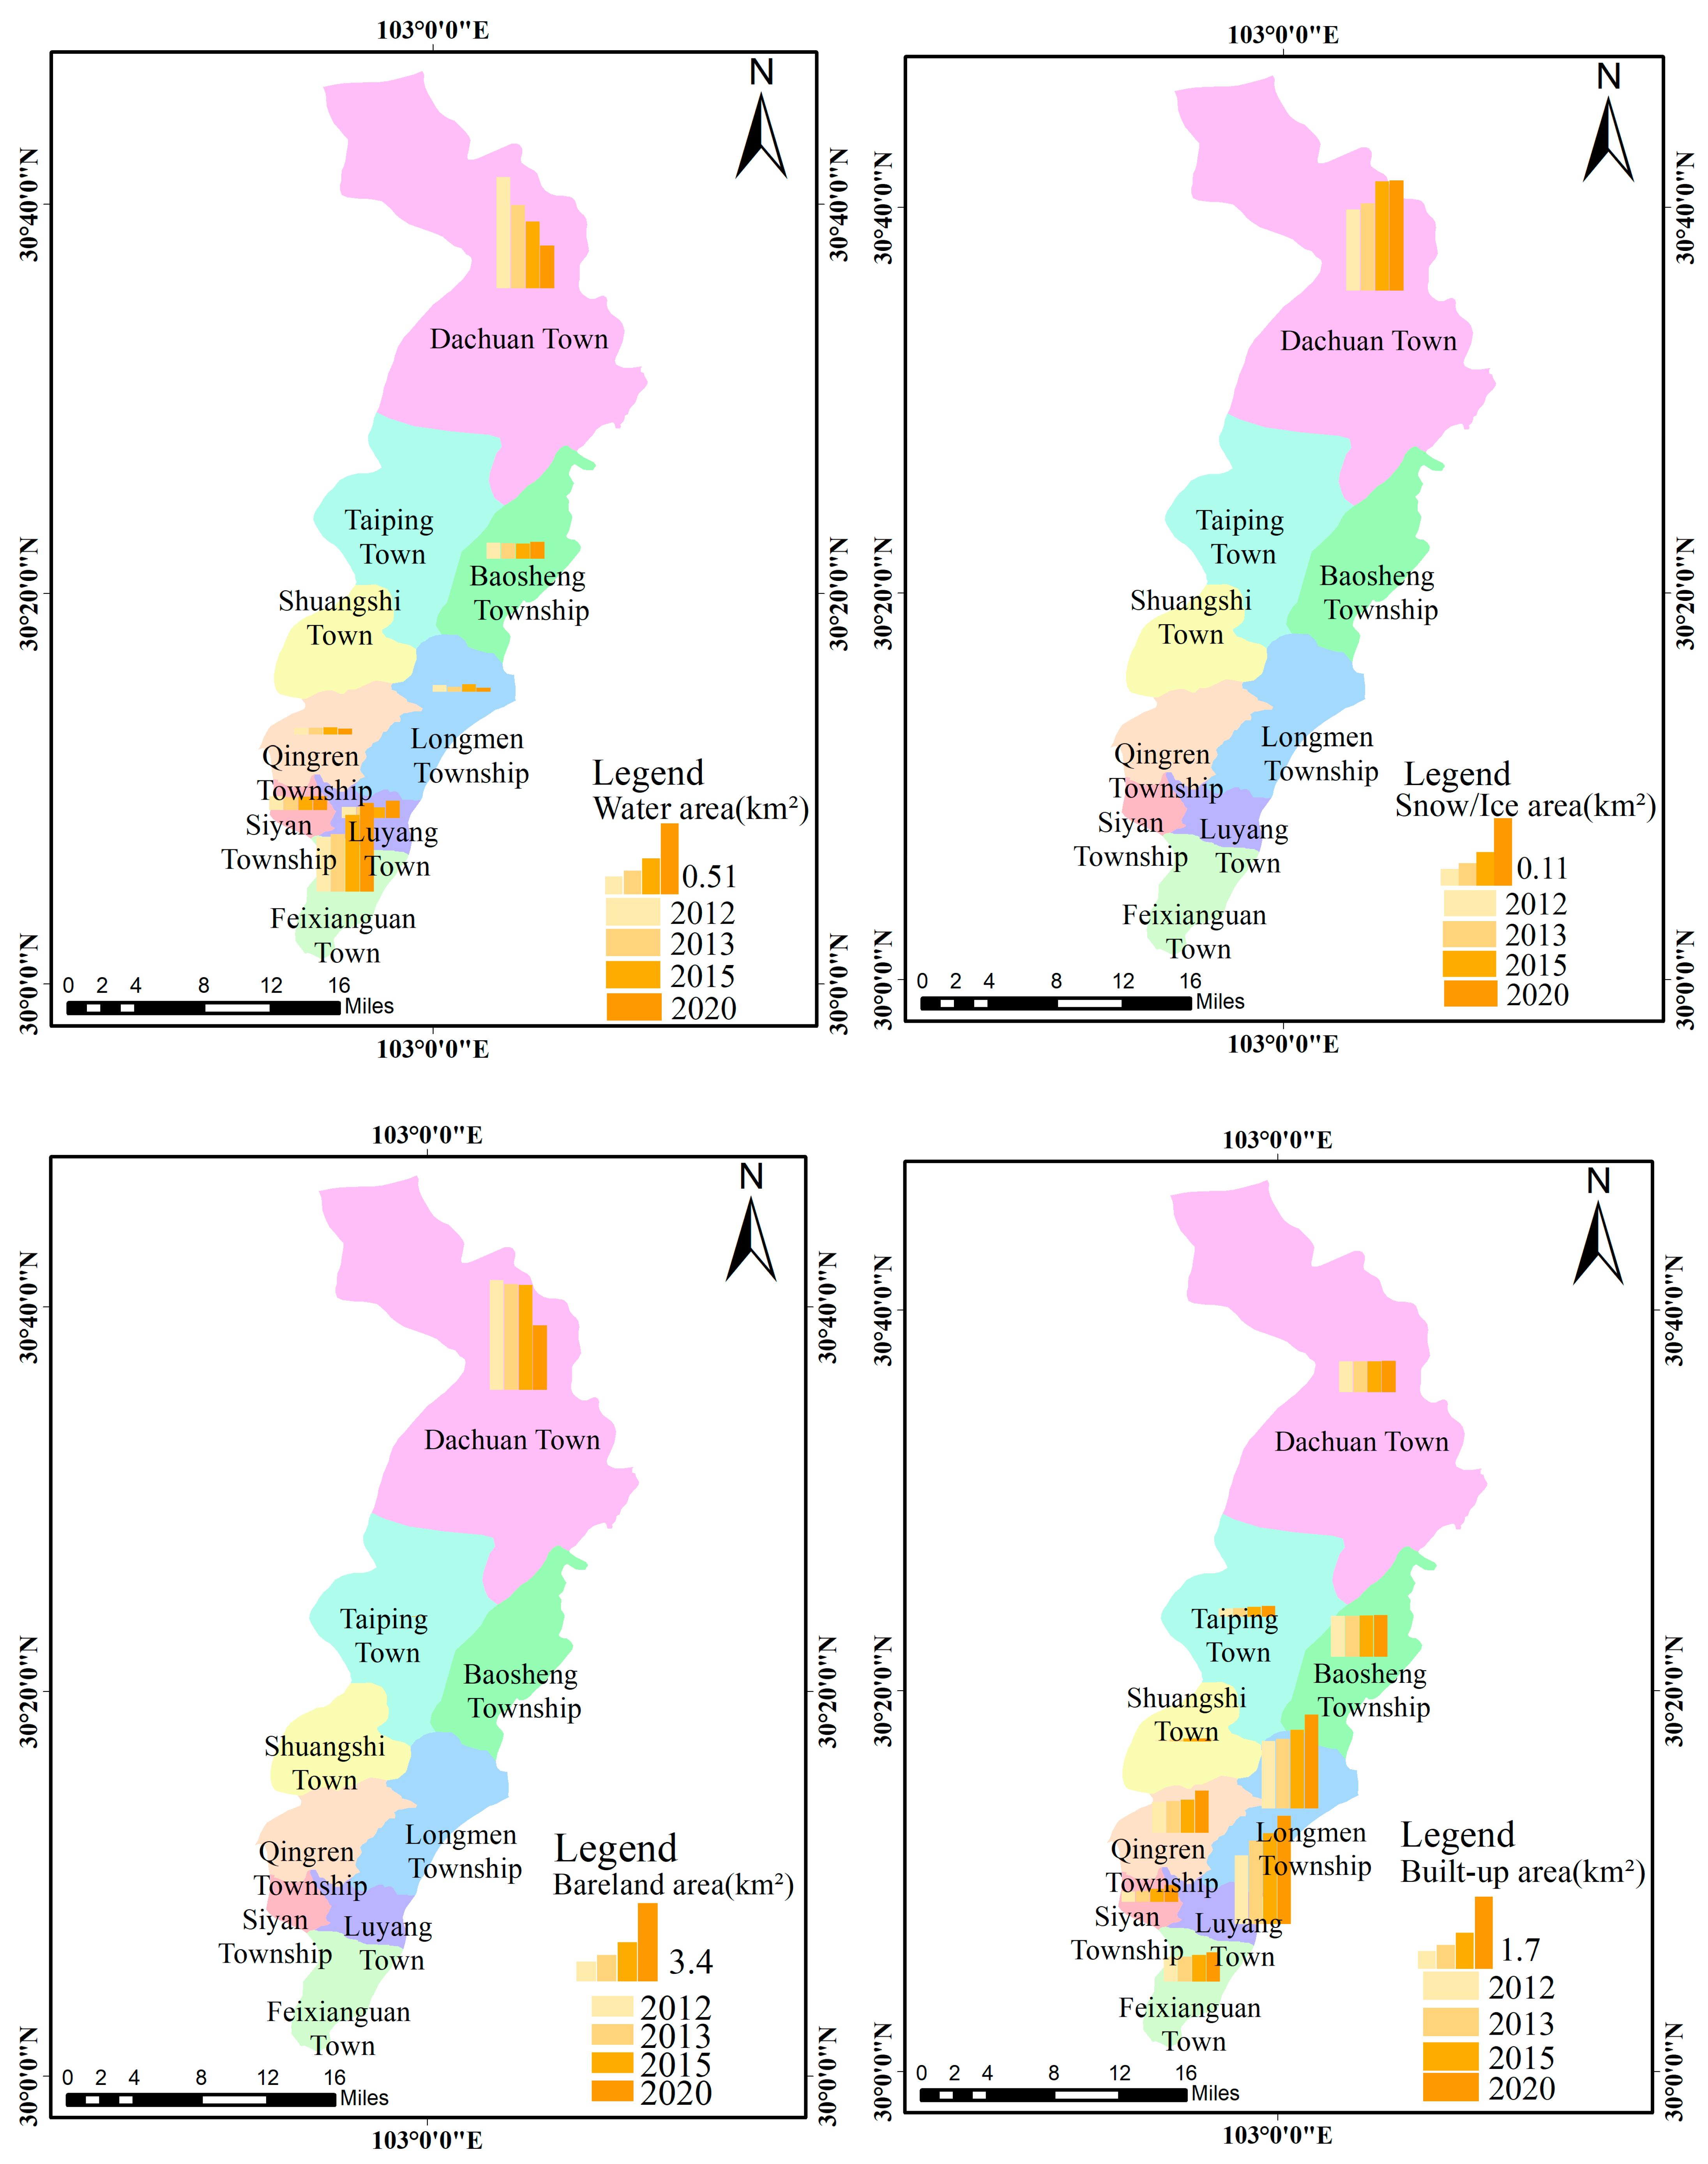
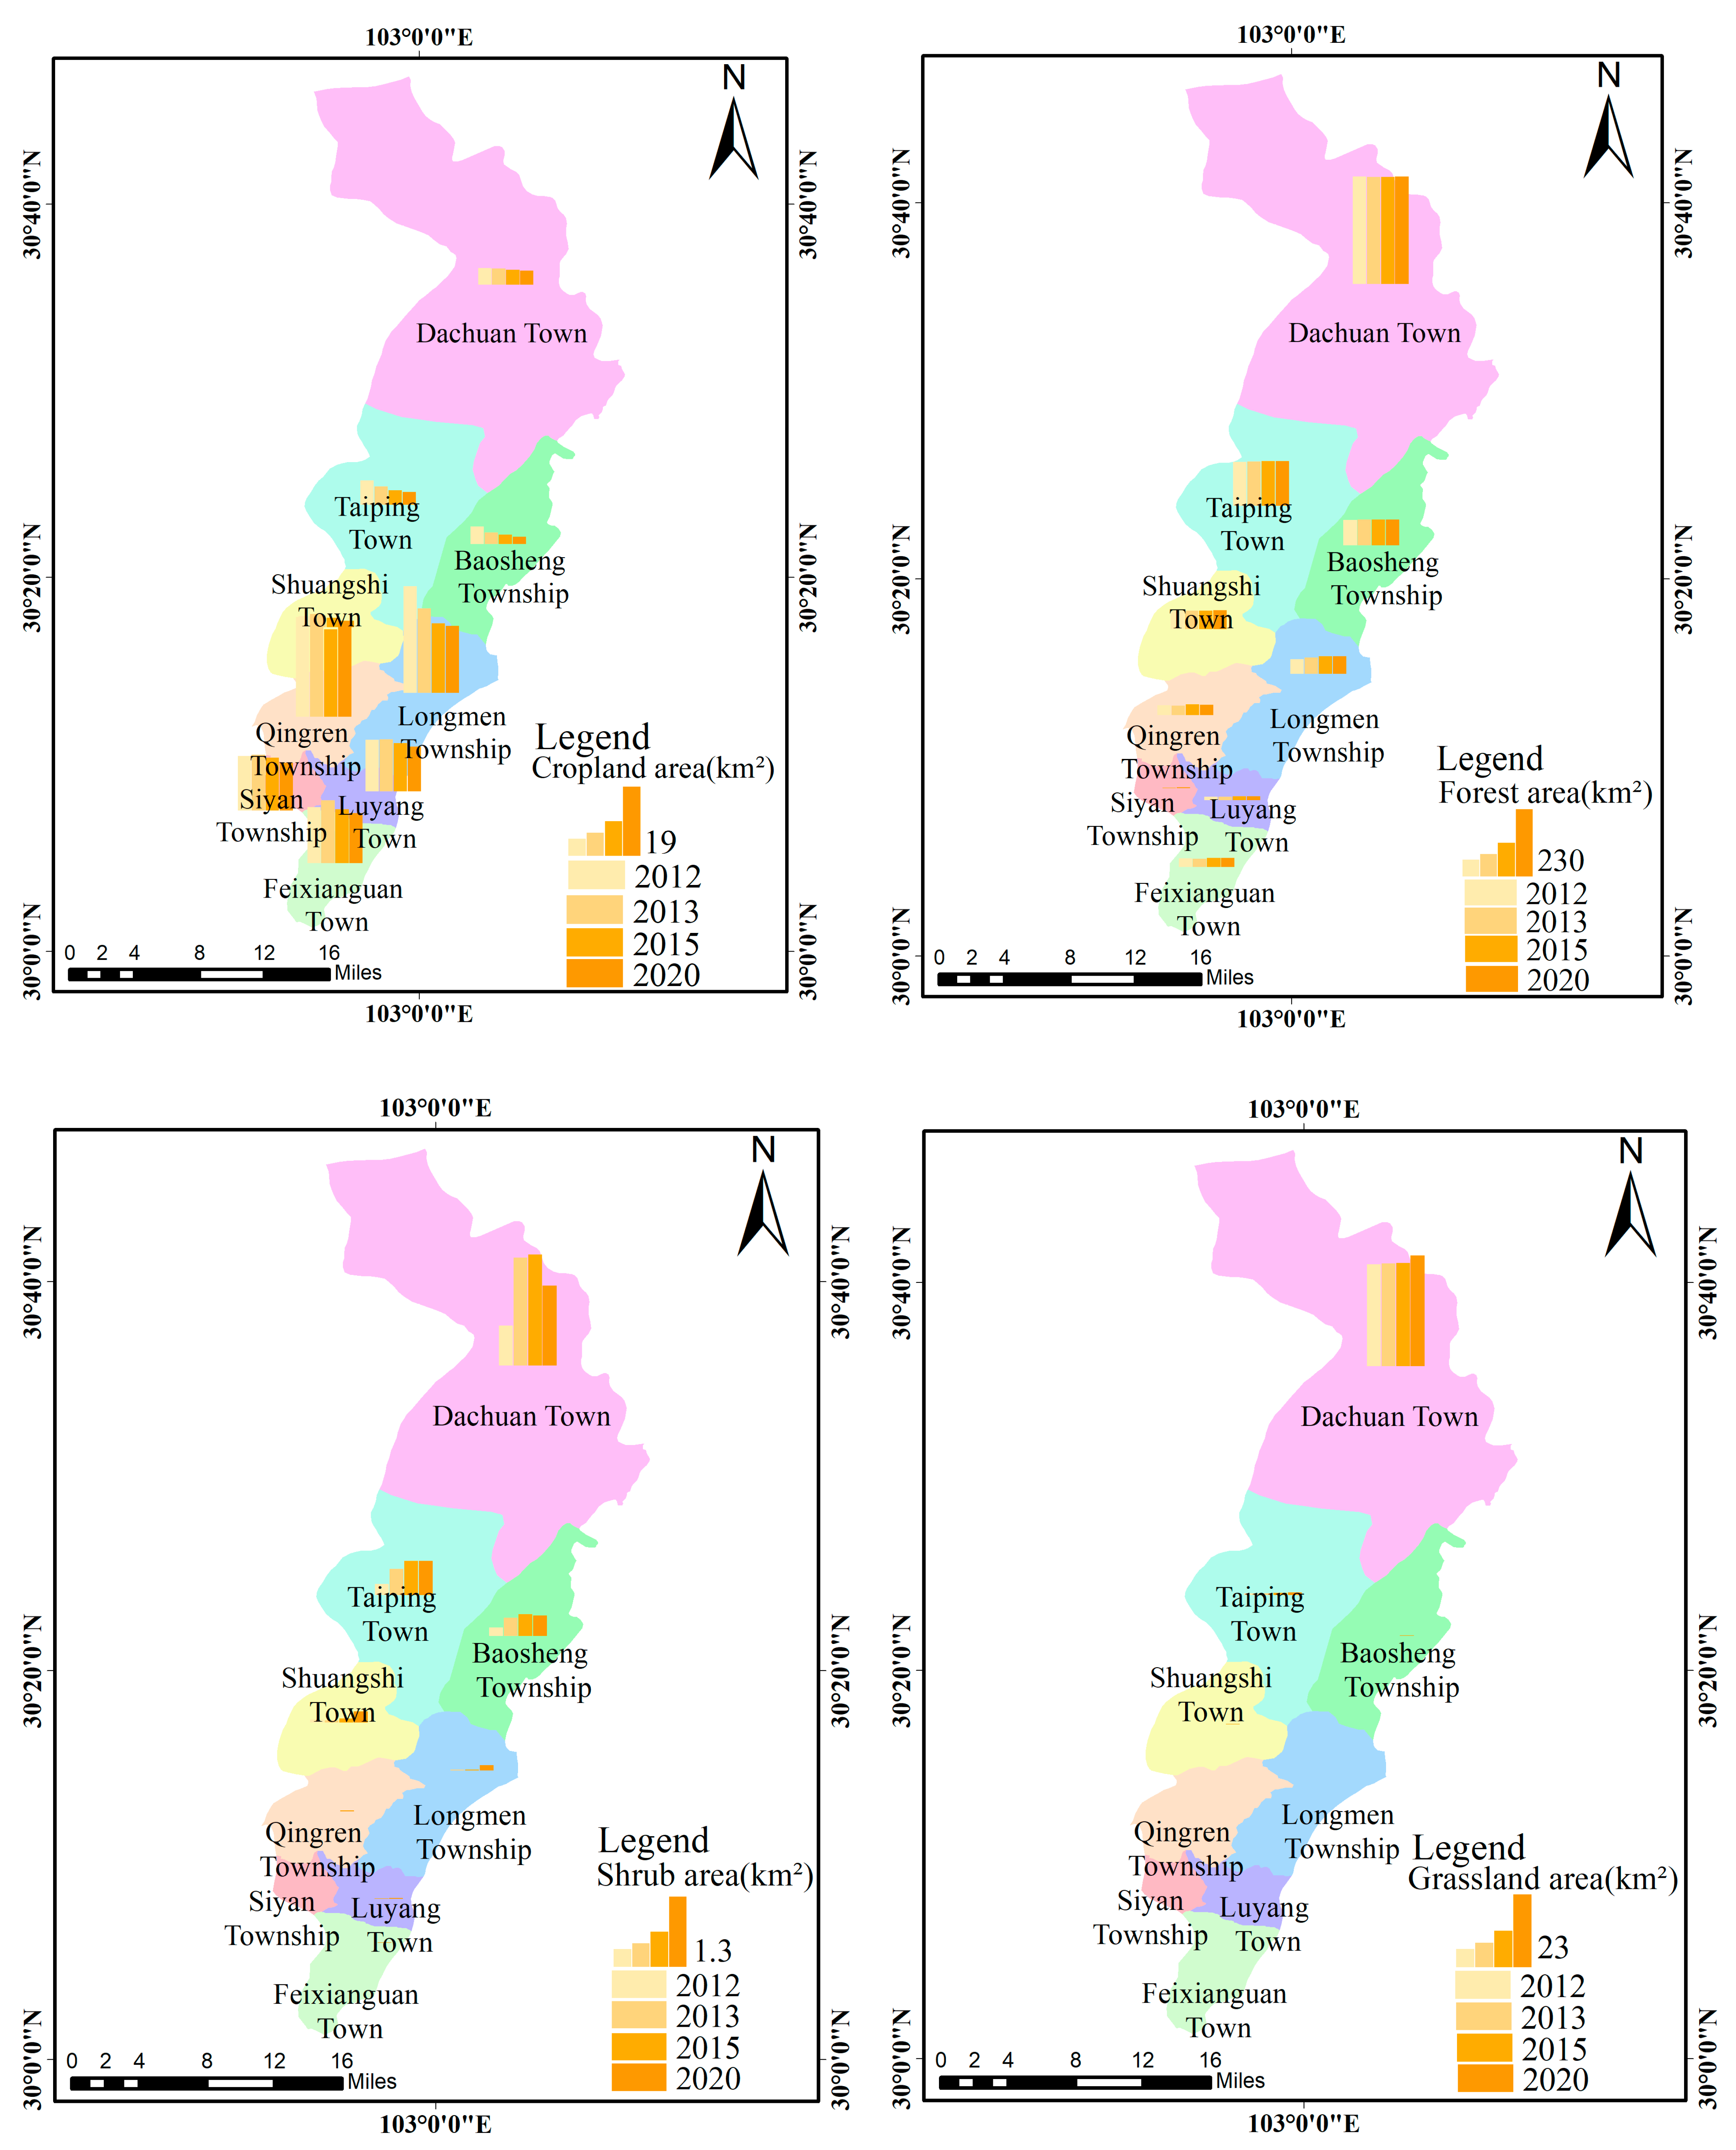
4.1. Analysis of Land Cover Area Changes
4.2. Analysis of the Extent of Mutual Land Cover Transfers
4.3. Analysis of Changes in the Extent of Land Cover
4.4. Analysis of the Spatial and Temporal Evolution of the Landscape Pattern
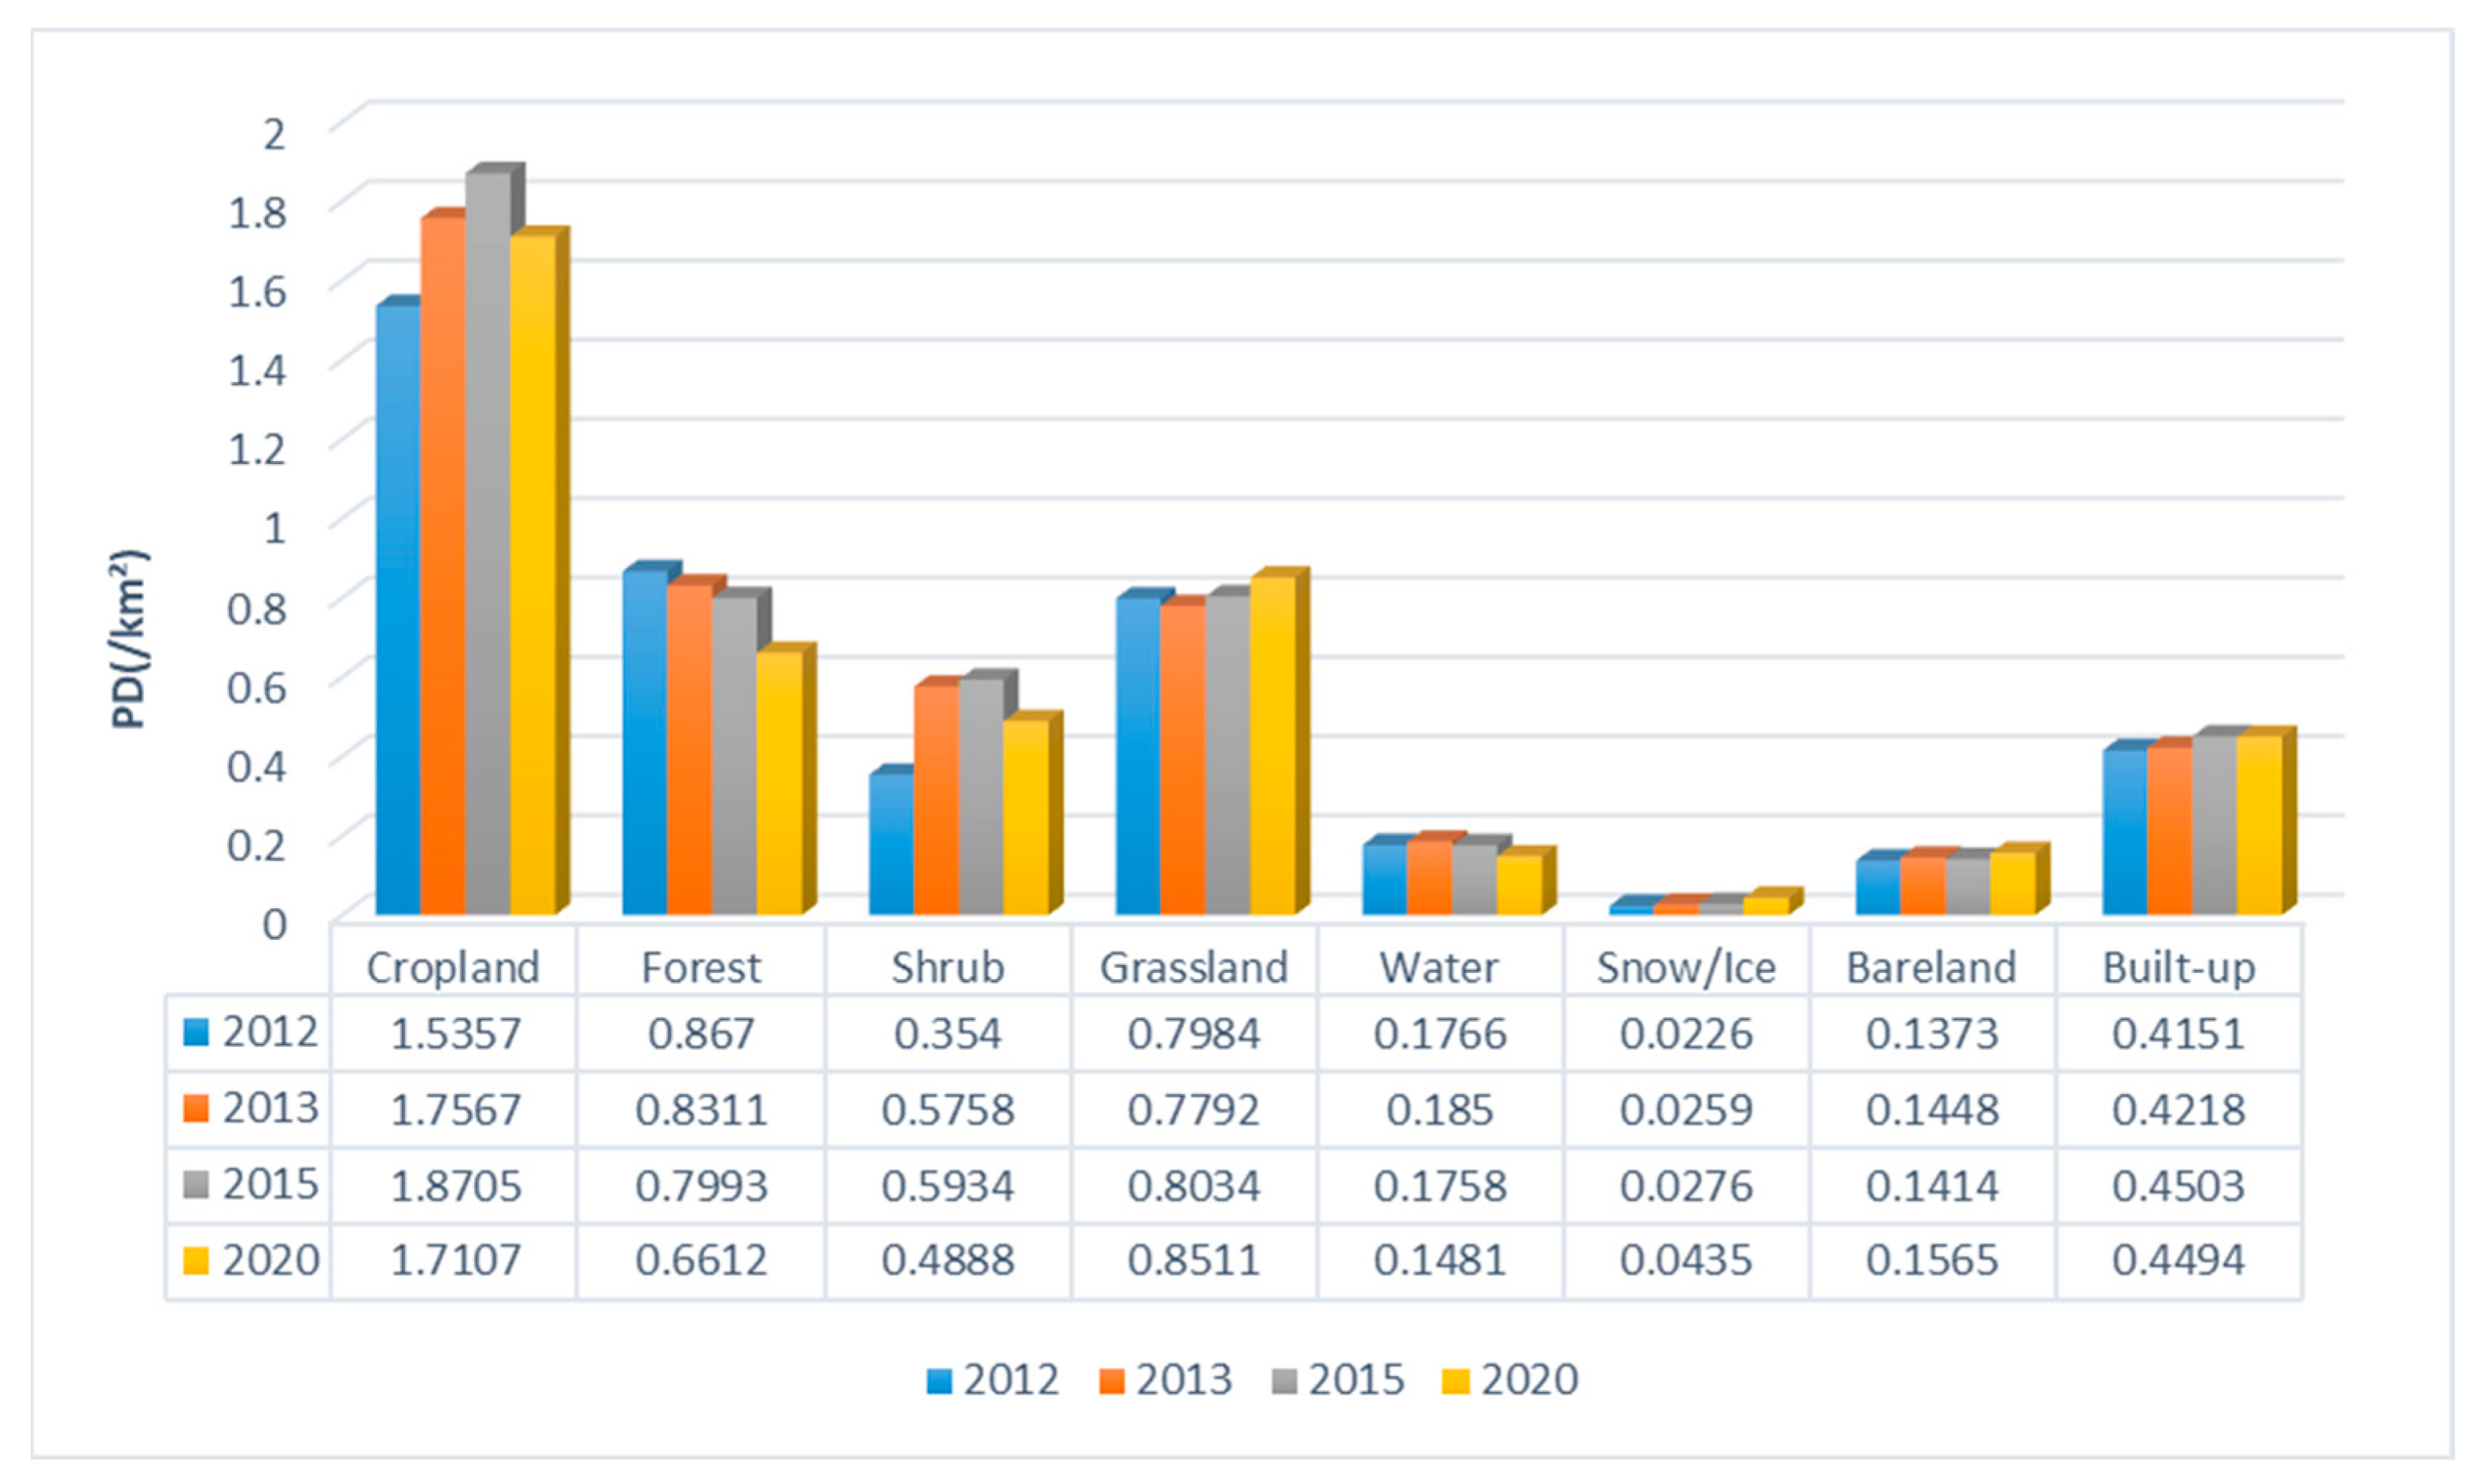
4.4.1. Time-Varying Characteristics of Landscape Indices
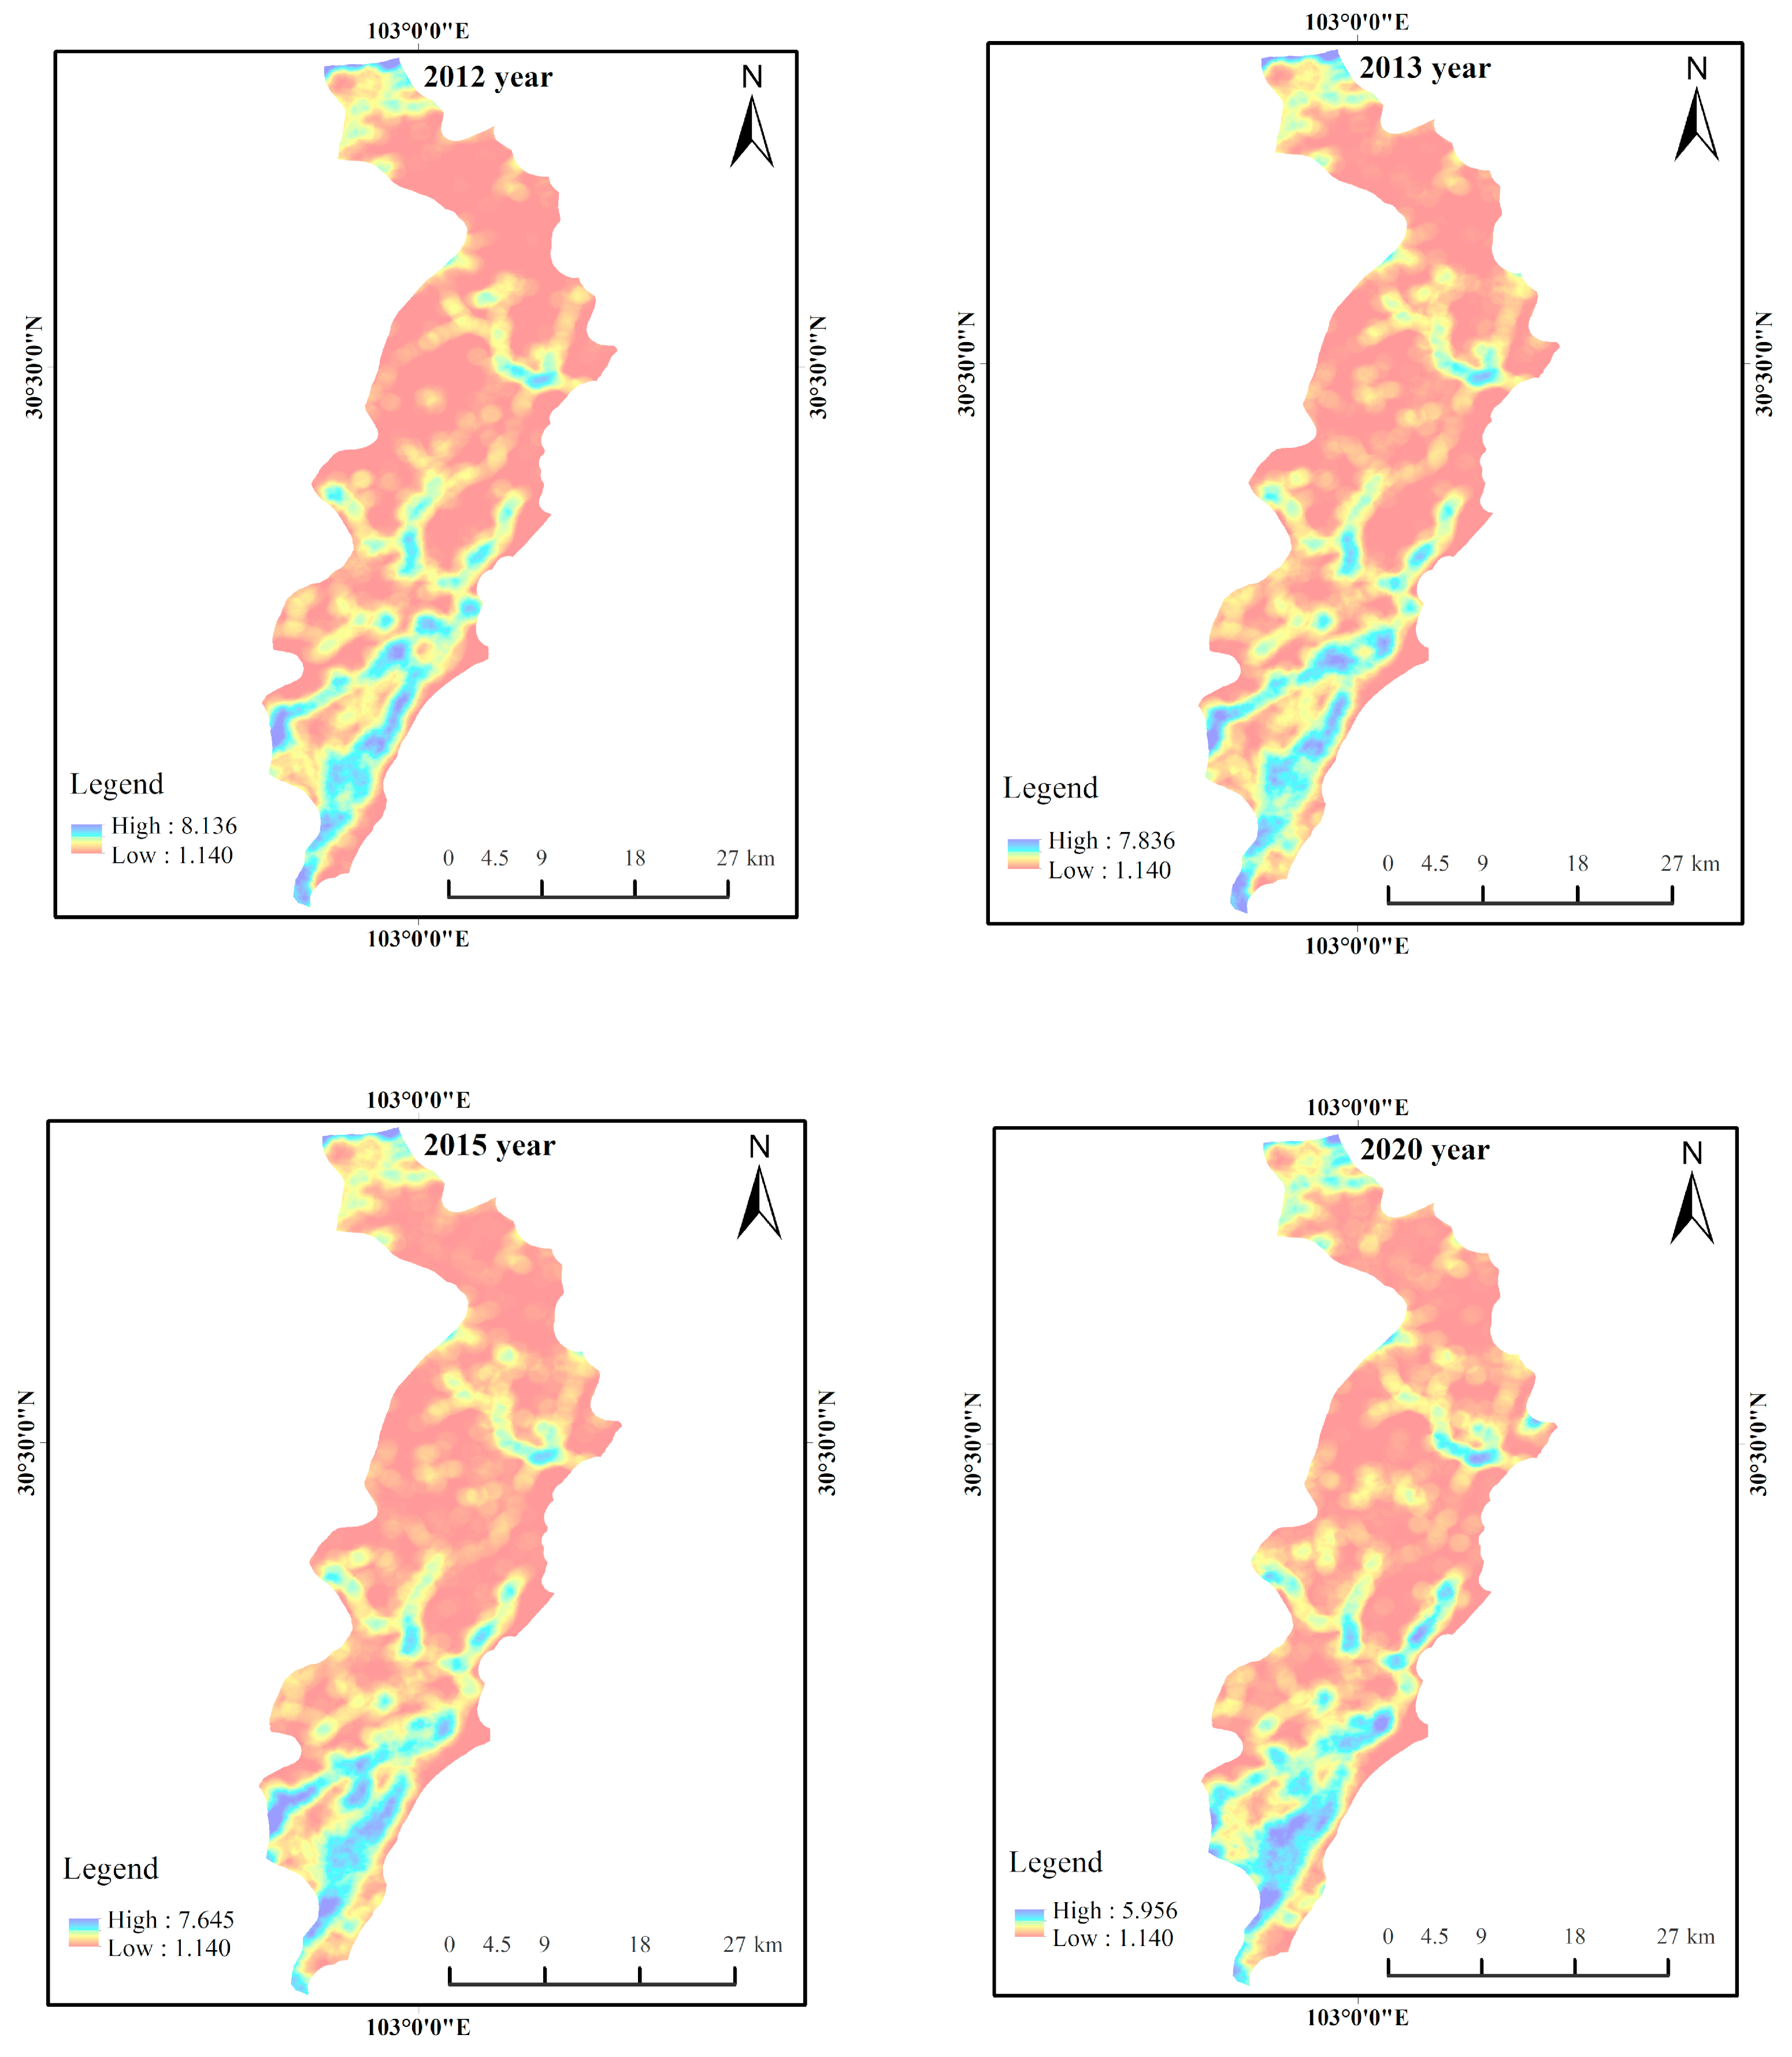
4.4.2. Spatial Variability Characteristics of Landscape Indices
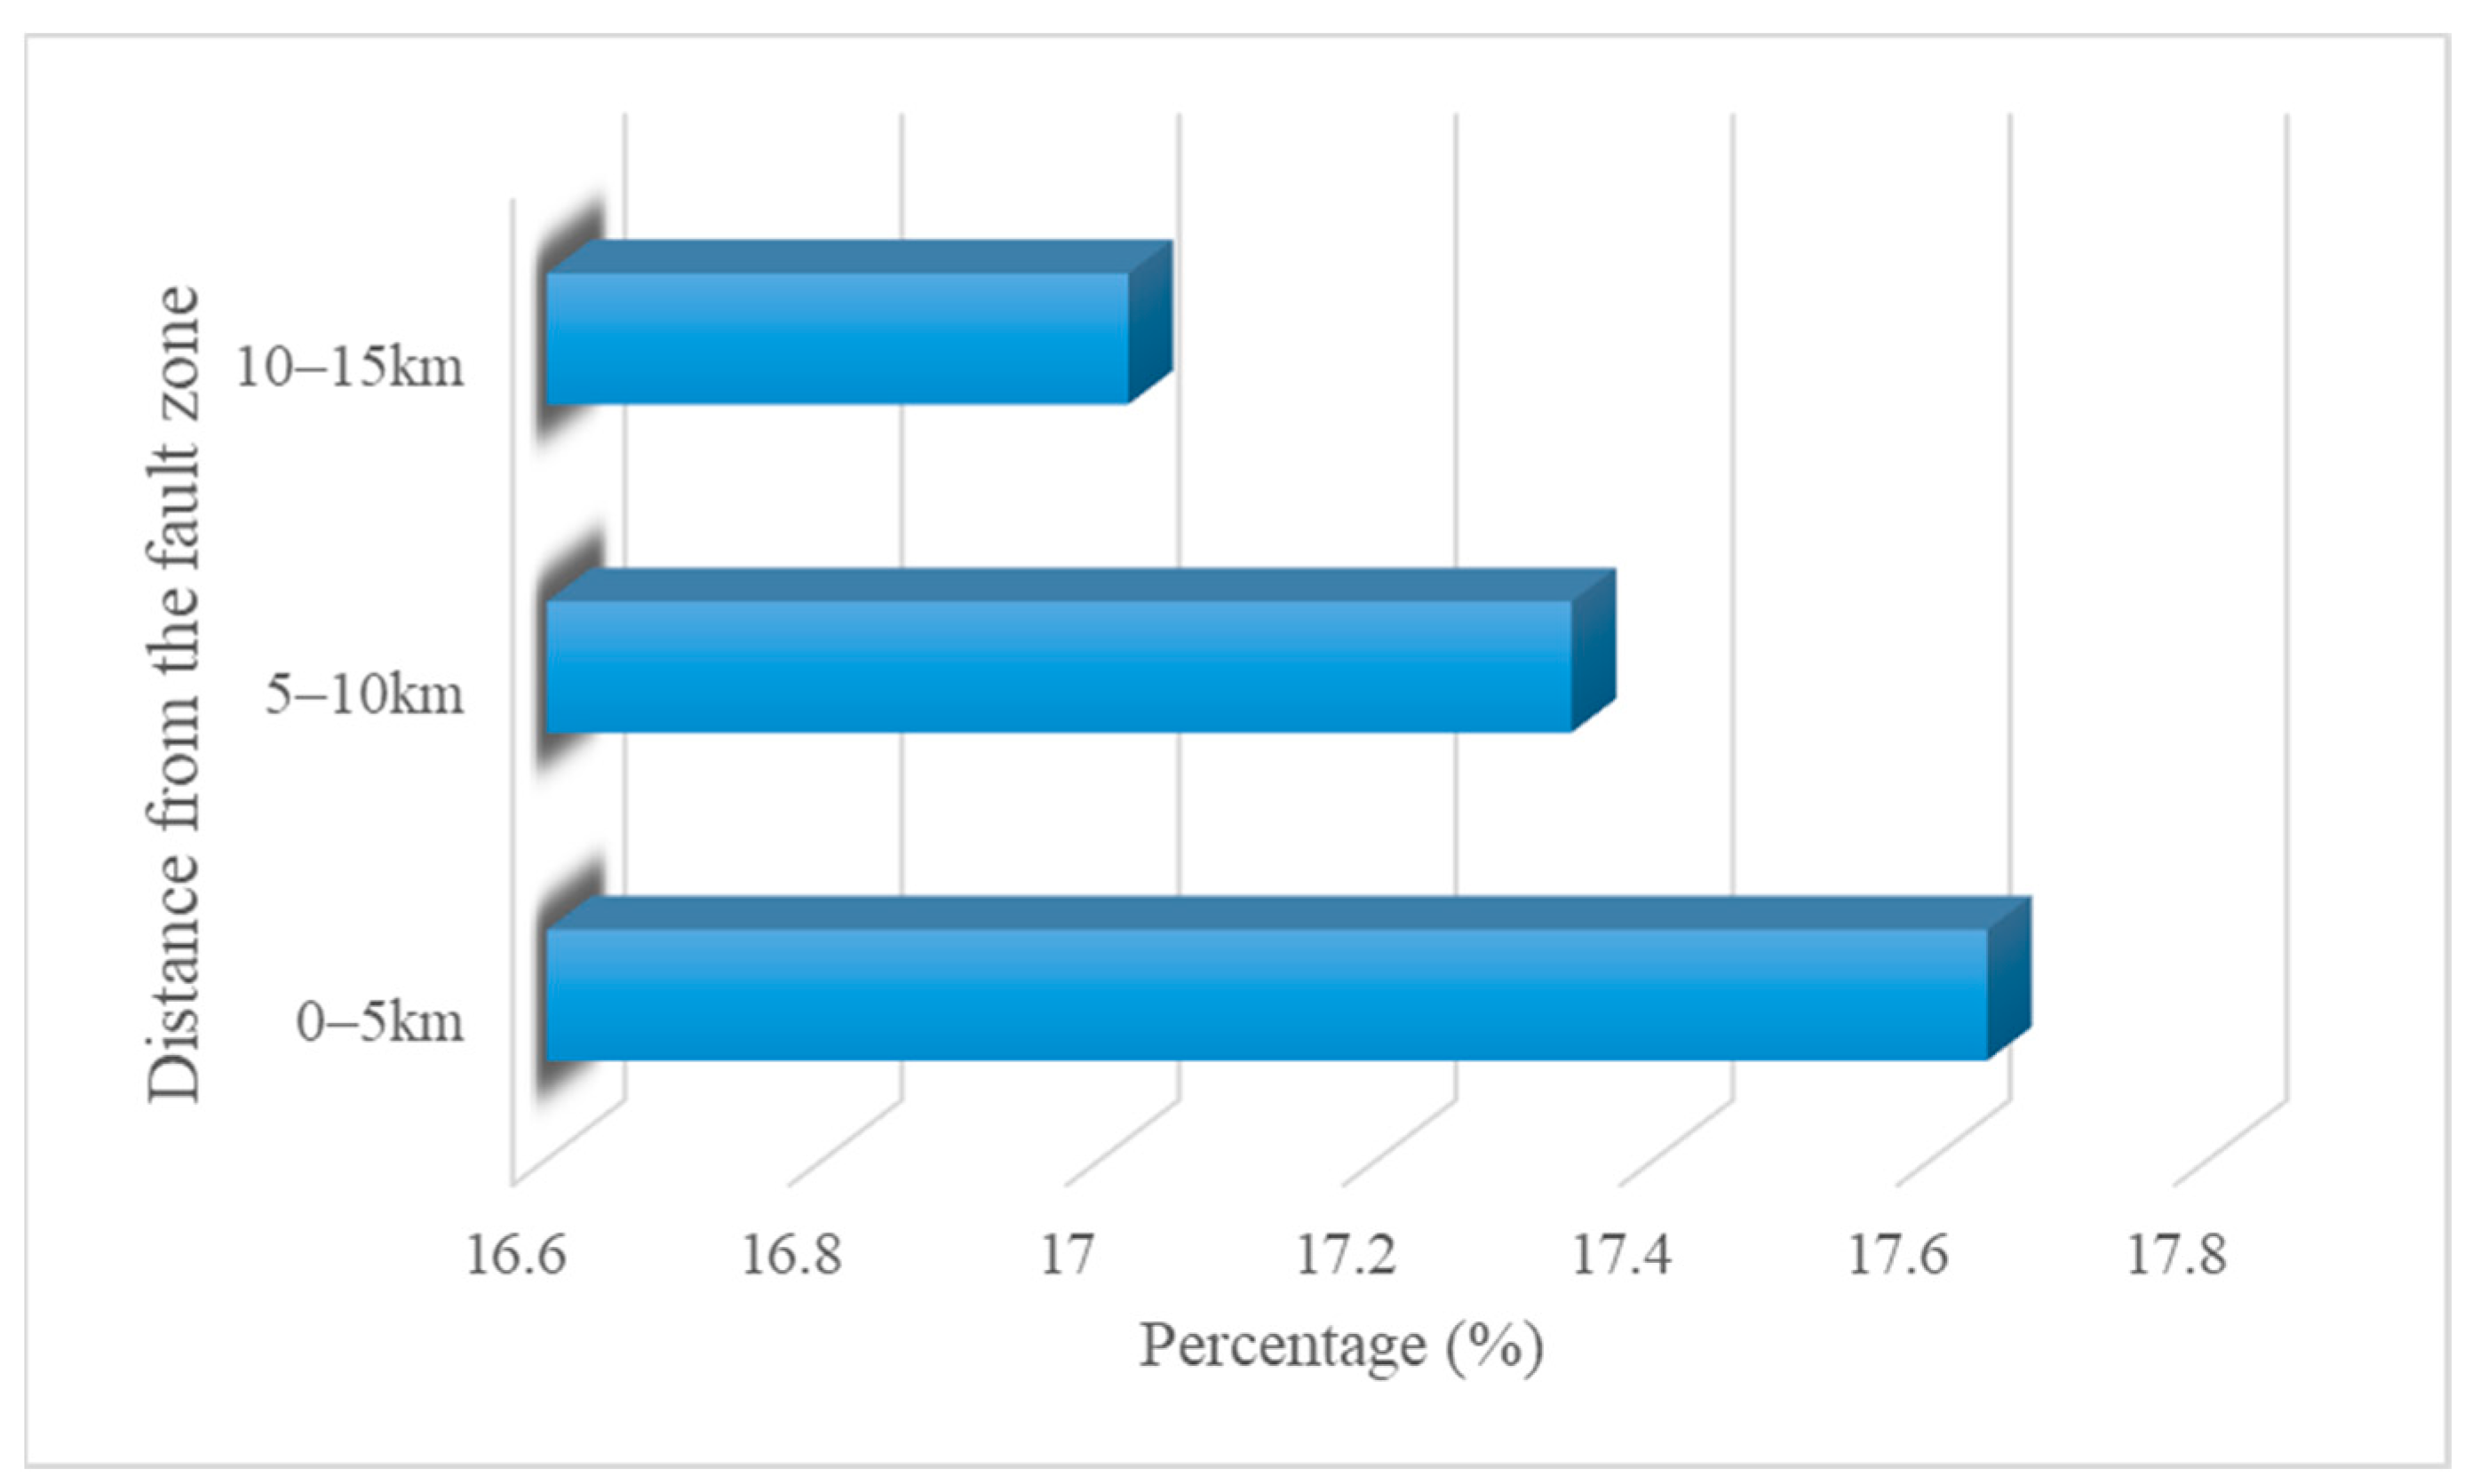
4.5. Fracture Zone Buffer Zone Land Cover Change Results
5. Discussion
5.1. Analysis of the Interaction between Land Cover Change and Seismic Hazards in Earthquake-Affected Areas
5.2. Analysis of the Impact of Human Factors on Land Cover Change in Earthquake-Affected Areas
5.3. Advantages and Limitations of Remote Sensing Monitoring in Disaster Environmental Change Assessment
6. Conclusions
Author Contributions
Funding
Data Availability Statement
Conflicts of Interest
References
- Liu, J.; Deng, X. Progress of the research methodologies on the temporal and spatial process of LUCC. Chin. Sci. Bull. 2010, 55, 1354–1362. [Google Scholar] [CrossRef]
- Huang, N.; Wang, L.; Song, X.-P.; Black, T.A.; Jassal, R.S.; Myneni, R.B.; Wu, C.; Wang, L.; Song, W.; Ji, D. Spatial and temporal variations in global soil respiration and their relationships with climate and land cover. Sci. Adv. 2020, 6, eabb8508. [Google Scholar] [CrossRef] [PubMed]
- Rajsekhar, D.; Gorelick, S.M. Increasing drought in Jordan: Climate change and cascading Syrian land-use impacts on reducing transboundary flow. Sci. Adv. 2017, 3, e1700581. [Google Scholar] [CrossRef] [PubMed] [Green Version]
- Khan, M.M.H.; Bryceson, I.; Kolivras, K.N.; Faruque, F.; Rahman, M.M.; Haque, U. Natural disasters and land-use/land-cover change in the southwest coastal areas of Bangladesh. Reg. Environ. Chang. 2015, 15, 241–250. [Google Scholar] [CrossRef]
- Barros, J.L.; Tavares, A.O.; Santos, P.P. Land use and land cover dynamics in Leiria City: Relation between peri-urbanization processes and hydro-geomorphologic disasters. Nat. Hazards 2021, 106, 757–784. [Google Scholar] [CrossRef]
- Xiang, M.; Deng, Q.; Duan, L.; Yang, J.; Wang, C.; Liu, J.; Liu, M. Dynamic monitoring and analysis of the earthquake Worst-hit area based on remote sensing. Alex. Eng. J. 2022, 61, 8691–8702. [Google Scholar] [CrossRef]
- Cui, P.; Lin, Y.-M.; Chen, C. Destruction of vegetation due to geo-hazards and its environmental impacts in the Wenchuan earthquake areas. Ecol. Eng. 2012, 44, 61–69. [Google Scholar]
- Wang, Y.; Fu, B.; Xu, P. Evaluation the impact of earthquake on ecosystem services. Procedia Environ. Sci. 2012, 13, 954–966. [Google Scholar] [CrossRef] [Green Version]
- Renaud, F.; Murti, R. Ecosystems and disaster risk reduction in the context of the Great East Japan Earthquake and Tsunami—A scoping study. UNU-EHS Publ. Ser. 2013, 10. [Google Scholar] [CrossRef]
- Shou, K.; Hong, C.; Wu, C.; Hsu, H.; Fei, L.; Lee, J.; Wei, C. Spatial and temporal analysis of landslides in Central Taiwan after 1999 Chi-Chi earthquake. Eng. Geol. 2011, 123, 122–128. [Google Scholar] [CrossRef]
- Li, J.; Xie, X.; Zhao, B.; Xiao, X.; Xue, B. Spatio-Temporal Processes and Characteristics of Vegetation Recovery in the Earthquake Area: A Case Study of Wenchuan, China. Land 2022, 11, 477. [Google Scholar] [CrossRef]
- Xu, J.; Tang, B.; Lu, T. Monitoring the riparian vegetation cover after the Wenchuan earthquake along the Minjiang River valley based on multi-temporal Landsat TM images: A case study of the Yingxiu-Wenchuan section. Acta Ecol. Sin. 2013, 33, 4966–4974. [Google Scholar]
- Wang, J.; Yang, X.; Wang, Z.; Cheng, H.; Kang, J.; Tang, H.; Li, Y.; Bian, Z.; Bai, Z. Consistency Analysis and Accuracy Assessment of Three Global Ten-Meter Land Cover Products in Rocky Desertification Region—A Case Study of Southwest China. ISPRS Int. J. Geo-Inf. 2022, 11, 202. [Google Scholar] [CrossRef]
- Lary, D.J.; Alavi, A.H.; Gandomi, A.H.; Walker, A.L. Machine learning in geosciences and remote sensing. Geosci. Front. 2016, 7, 3–10. [Google Scholar] [CrossRef] [Green Version]
- Shirazy, A.; Shirazi, A.; Nazerian, H. Application of Remote Sensing in Earth Sciences–A Review. Int. J. Sci. Eng. Appl. 2021, 10, 45–51. [Google Scholar]
- Kerr, J.T.; Ostrovsky, M. From space to species: Ecological applications for remote sensing. Trends Ecol. Evol. 2003, 18, 299–305. [Google Scholar] [CrossRef]
- Tronin, A.A. Remote sensing and earthquakes: A review. Phys. Chem. Earth Parts A/B/C 2006, 31, 138–142. [Google Scholar] [CrossRef]
- Zhao, X.; Pan, S.; Sun, Z.; Guo, H.; Zhang, L.; Feng, K. Advances of satellite remote sensing technology in earthquake prediction. Nat. Hazards Rev. 2021, 22, 03120001. [Google Scholar] [CrossRef]
- Nath, B.; Niu, Z.; Singh, R.P. Land Use and Land Cover changes, and environment and risk evaluation of Dujiangyan city (SW China) using remote sensing and GIS techniques. Sustainability 2018, 10, 4631. [Google Scholar] [CrossRef] [Green Version]
- Cui, P.; Zhuang, J.; Chen, X.; Zhang, J.; Zhou, X. Characteristics and Countermeasures of Debris Flow in Wenchuan Area after the Earthquake. J. Sichuan Univ. (Eng. Sci. Ed.) 2010, 42, 10–19. [Google Scholar]
- Wang, M.; Yang, W.; Shi, P.; Xu, C.; Liu, L. Diagnosis of vegetation recovery in mountainous regions after the Wenchuan earthquake. IEEE J. Sel. Top. Appl. Earth Obs. Remote Sens. 2014, 7, 3029–3037. [Google Scholar] [CrossRef]
- Zhong, C.; Li, C.; Gao, P.; Li, H. Discovering Vegetation Recovery and Landslide Activities in the Wenchuan Earthquake Area with Landsat Imagery. Sensors 2021, 21, 5243. [Google Scholar] [CrossRef] [PubMed]
- Barua, S.K.; Boscolo, M.; Animon, I. Valuing forest-based ecosystem services in Bangladesh: Implications for research and policies. Ecosyst. Serv. 2020, 42, 101069. [Google Scholar] [CrossRef]
- Campbell, E.; Marks, R.; Conn, C. Spatial modeling of the biophysical and economic values of ecosystem services in Maryland, USA. Ecosyst. Serv. 2020, 43, 101093. [Google Scholar] [CrossRef]
- Friess, D.A.; Yando, E.S.; Wong, L.-W.; Bhatia, N. Indicators of scientific value: An under-recognised ecosystem service of coastal and marine habitats. Ecol. Indic. 2020, 113, 106255. [Google Scholar] [CrossRef]
- Tang, Q.; Li, Y.; Xu, Y. Land suitability assessment for post-earthquake reconstruction: A case study of Lushan in Sichuan, China. J. Geogr. Sci. 2015, 25, 865–878. [Google Scholar] [CrossRef]
- Yang, J.; Huang, X. The 30 m annual land cover dataset and its dynamics in China from 1990 to 2019. Earth Syst. Sci. Data 2021, 13, 3907–3925. [Google Scholar] [CrossRef]
- Breiman, L. Random forests. Mach. Learn. 2001, 45, 5–32. [Google Scholar] [CrossRef] [Green Version]
- Canters, F. Evaluating the uncertainty of area estimates derived from fuuy land-cover classification. Photogramm. Eng. Remote Sens. 1997, 63, 403–414. [Google Scholar]
- Clark, M.L.; Aide, T.M.; Grau, H.R.; Riner, G. A scalable approach to mapping annual land cover at 250 m using MODIS time series data: A case study in the Dry Chaco ecoregion of South America. Remote Sens. Environ. 2010, 114, 2816–2832. [Google Scholar] [CrossRef]
- Tung, F.; LeDrew, E. The determination of optimal threshold levels for change detection using various accuracy indexes. Photogramm. Eng. Remote Sens. 1988, 54, 1449–1454. [Google Scholar]
- Camps-Valls, G.; Tuia, D.; Gómez-Chova, L.; Jiménez, S.; Malo, J. Camps-Valls G, Tuia D, Gómez-Chova L, et al. Remote sensing image processing. Synth. Lect. Image Video Multimed. Processing 2011, 5, 1–192. [Google Scholar]
- Shi, G.; Jiang, N.; Yao, L. Land use and cover change during the rapid economic growth period from 1990 to 2010: A case study of shanghai. Sustainability 2018, 10, 426. [Google Scholar] [CrossRef] [Green Version]
- Gao, P.; Niu, X.; Wang, B.; Zheng, Y. Land use changes and its driving forces in hilly ecological restoration area based on gis and rs of northern china. Sci. Rep. 2015, 5, 1–11. [Google Scholar] [CrossRef] [PubMed] [Green Version]
- Hang, M.; He, X.; Wu, D. Analysis of land use extent changes and their spatial heterogeneity in the Chaohu Lake watershed. Soils 2015, 47, 994–1000. [Google Scholar]
- Shawul, A.A.; Chakma, S. Spatiotemporal detection of land use/land cover change in the large basin using integrated approaches of remote sensing and GIS in the Upper Awash basin, Ethiopia. Environ. Earth Sci. 2019, 78, 1–13. [Google Scholar] [CrossRef]
- Kupfer, J.A. Landscape ecology and biogeography: Rethinking landscape metrics in a post-FRAGSTATS landscape. Prog. Phys. Geogr. 2012, 36, 400–420. [Google Scholar] [CrossRef]
- Kang, J.; Sui, L.; Yang, X.; Wang, Z.; Huang, C.; Wang, J. Spatial pattern consistency among different remote-sensing land cover datasets: A case study in Northern Laos. ISPRS Int. J. Geo-Inf. 2019, 8, 201. [Google Scholar] [CrossRef] [Green Version]
- Wang, F.-X.; Zhou, W.-C. The Study on Land Use Changes of Wenchuan Disaster Area based on RS and GIS. In Proceedings of the 2009 2nd International Congress on Image and Signal Processing, Tianjin, China, 17–19 October 2009; pp. 1–5. [Google Scholar]
- Wang, L.; Tian, B.; Masoud, A.; Koike, K. Relationship between remotely sensed vegetation change and fracture zones induced by the 2008 Wenchuan earthquake, China. J. Earth Sci. 2013, 24, 282–296. [Google Scholar] [CrossRef] [Green Version]
- Yang, X.; Yang, W.-N.; Li, Y.-H.; Hu, B.-R. Land Use Land Cover Change Analysis after the Earthquake of Wenchuan. In Proceedings of the 2010 International Conference on Multimedia Technology, Ningbo, China, 29–31 October 2010; pp. 1–4. [Google Scholar]
- Wang, H.; Sassa, K.; Xu, W. Analysis of a spatial distribution of landslides triggered by the 2004 Chuetsu earthquakes of Niigata Prefecture, Japan. Nat. Hazards 2007, 41, 43–60. [Google Scholar] [CrossRef]
- Chang, K.-T.; Chiang, S.-H.; Hsu, M.-L. Modeling typhoon-and earthquake-induced landslides in a mountainous watershed using logistic regression. Geomorphology 2007, 89, 335–347. [Google Scholar] [CrossRef]
- Huang, R.; Li, W. Analysis of the geo-hazards triggered by the 12 May 2008 Wenchuan Earthquake, China. Bull. Eng. Geol. Environ. 2009, 68, 363–371. [Google Scholar] [CrossRef]
- Khazai, B.; Sitar, N. Evaluation of factors controlling earthquake-induced landslides caused by Chi-Chi earthquake and comparison with the Northridge and Loma Prieta events. Eng. Geol. 2004, 71, 79–95. [Google Scholar] [CrossRef]
- Hersperger, A.M.; Oliveira, E.; Pagliarin, S.; Palka, G.; Verburg, P.; Bolliger, J.; Grădinaru, S. Urban land-use change: The role of strategic spatial planning. Glob. Environ. Change 2018, 51, 32–42. [Google Scholar] [CrossRef]
- König, H.J.; Schuler, J.; Suarma, U.; McNeill, D.; Imbernon, J.; Damayanti, F.; Dalimunthe, S.A.; Uthes, S.; Sartohadi, J.; Helming, K. Assessing the impact of land use policy on urban-rural sustainability using the FoPIA approach in Yogyakarta, Indonesia. Sustainability 2010, 2, 1991–2009. [Google Scholar] [CrossRef] [Green Version]
- Chen, L.; Zhu, Y. Bridge Design Concept and Innovation of Chengdu-Dujiangyan Intercity Railway-Post Wenchuan Earthquake Reconstruction Project in Sichuan, China. In Proceedings of the 1st International Workshop on High-Speed and Intercity Railways, Shenzhen, China, 13 February 2012; pp. 205–216. [Google Scholar]
- Ou, J.; Li, H. The regional engineering damage and reconstruction strategy in Wenchuan earthquake of China. J. Earthq. Tsunami 2011, 5, 189–216. [Google Scholar] [CrossRef]
- Kim, J.H. Linking land use planning and regulation to economic development: A literature review. J. Plan. Lit. 2011, 26, 35–47. [Google Scholar]
- Contreras, D.; Blaschke, T.; Tiede, D.; Jilge, M. Monitoring recovery after earthquakes through the integration of remote sensing, GIS, and ground observations: The case of L’Aquila (Italy). Cartogr. Geogr. Inf. Sci. 2016, 43, 115–133. [Google Scholar] [CrossRef]


| Year | 2012 | 2013 | 2015 | 2020 |
|---|---|---|---|---|
| OA (%) | 80.52 | 82.34 | 83.51 | 85.38 |
| Kappa | 0.71 | 0.73 | 0.74 | 0.78 |
| Type of Land Cover | Bareland, Ice/Snow | Forest, Grassland, Shrubland, Water | Cropland | Built-Up |
|---|---|---|---|---|
| Grading Index | 1 | 2 | 3 | 4 |
| 2012 Land Cover Type | 2013 Land Cover Type | ||||||||
|---|---|---|---|---|---|---|---|---|---|
| Cropland | Forest | Shrub | Grassland | Water | Snow/Ice | Bareland | Built-Up | Transfer out Area | |
| Cropland | 138.6837 | 14.7888 | 0.0189 | 0.0549 | 0.0108 | 0 | 0 | 0.666 | 15.5394 |
| Forest | 8.1783 | 967.5234 | 2.4516 | 0 | 0 | 0 | 0 | 0.0009 | 10.6308 |
| Shrub | 0.0081 | 0.342 | 1.0377 | 0.0198 | 0 | 0 | 0 | 0 | 0.3699 |
| Grassland | 0.0585 | 0.1422 | 0.0234 | 42.8868 | 0.0027 | 0 | 0.1692 | 0.0036 | 0.3996 |
| Water | 0.0603 | 0.0063 | 0 | 0.1143 | 1.7181 | 0 | 0.1512 | 0.0036 | 0.3357 |
| Snow/Ice | 0 | 0 | 0 | 0.0099 | 0 | 0.1251 | 0.0216 | 0 | 0.0315 |
| Bareland | 0.0018 | 0 | 0 | 0.5319 | 0.0081 | 0.0441 | 6.1722 | 0 | 0.5859 |
| Built-up | 0 | 0 | 0 | 0 | 0.0495 | 0 | 0 | 8.7759 | 0.0495 |
| Transfer in area | 8.307 | 15.2793 | 2.4939 | 0.7308 | 0.0711 | 0.0441 | 0.342 | 0.6741 | 27.9423 |
| 2013 Land Cover Type | 2015 Land Cover Type | ||||||||
|---|---|---|---|---|---|---|---|---|---|
| Cropland | Forest | Shrub | Grassland | Water | Snow/Ice | Bareland | Built-Up | Transfer out Area | |
| Cropland | 125.5995 | 20.0502 | 0.0351 | 0.3276 | 0.1152 | 0 | 0 | 0.8631 | 21.3912 |
| Forest | 1.1025 | 980.9991 | 0.7011 | 0 | 0 | 0 | 0 | 0 | 1.8036 |
| Shrub | 0.0153 | 0.297 | 3.1671 | 0.0522 | 0 | 0 | 0 | 0 | 0.3645 |
| Grassland | 0.0315 | 0.1143 | 0.0045 | 43.0218 | 0.0036 | 0 | 0.4266 | 0.0153 | 0.5958 |
| Water | 0.018 | 0 | 0 | 0.0846 | 1.5876 | 0 | 0.0936 | 0.0054 | 0.2016 |
| Snow/Ice | 0 | 0 | 0 | 0.0018 | 0.0009 | 0.1494 | 0.0171 | 0 | 0.0198 |
| Bareland | 0.0207 | 0 | 0 | 0.4806 | 0.0108 | 0.0648 | 5.9373 | 0 | 0.5769 |
| Built-up | 0 | 0 | 0 | 0 | 0.1179 | 0 | 0 | 9.3321 | 0.1179 |
| Transfer in area | 1.188 | 20.4615 | 0.7407 | 0.9468 | 0.2484 | 0.0648 | 0.5373 | 0.8838 | 25.0713 |
| 2015 Land Cover Type | 2020 Land Cover Type | ||||||||
|---|---|---|---|---|---|---|---|---|---|
| Cropland | Forest | Shrub | Grassland | Water | Snow/Ice | Bareland | Built-Up | Transfer out Area | |
| Cropland | 106.911 | 17.4024 | 0.0702 | 0.7389 | 0.0999 | 0 | 0 | 1.5651 | 19.8765 |
| Forest | 14.1561 | 984.9627 | 2.2509 | 0.09 | 0 | 0 | 0 | 0.0009 | 16.407 |
| Shrub | 0.0414 | 2.4723 | 1.1088 | 0.2853 | 0 | 0 | 0 | 0 | 2.799 |
| Grassland | 0.1647 | 0.162 | 0.0297 | 43.2252 | 0.0495 | 0.0018 | 0.2646 | 0.0711 | 0.7416 |
| Water | 0.0288 | 0.0063 | 0 | 0.117 | 1.4256 | 0 | 0.189 | 0.0693 | 0.4041 |
| Snow/Ice | 0 | 0 | 0 | 0.0234 | 0 | 0.1152 | 0.0756 | 0 | 0.099 |
| Bareland | 0.0666 | 0.0009 | 0 | 2.8233 | 0.036 | 0.0954 | 3.4524 | 0 | 3.0213 |
| Built-up | 0.0009 | 0 | 0 | 0.0027 | 0.1476 | 0 | 0 | 10.0647 | 0.1476 |
| Transfer in area | 14.4576 | 20.0367 | 2.3508 | 3.9879 | 0.333 | 0.0954 | 0.5292 | 1.7055 | 43.4961 |
Publisher’s Note: MDPI stays neutral with regard to jurisdictional claims in published maps and institutional affiliations. |
© 2022 by the authors. Licensee MDPI, Basel, Switzerland. This article is an open access article distributed under the terms and conditions of the Creative Commons Attribution (CC BY) license (https://creativecommons.org/licenses/by/4.0/).
Share and Cite
Wang, J.; Wang, Z.; Cheng, H.; Kang, J.; Liu, X. Land Cover Changing Pattern in Pre- and Post-Earthquake Affected Area from Remote Sensing Data: A Case of Lushan County, Sichuan Province. Land 2022, 11, 1205. https://doi.org/10.3390/land11081205
Wang J, Wang Z, Cheng H, Kang J, Liu X. Land Cover Changing Pattern in Pre- and Post-Earthquake Affected Area from Remote Sensing Data: A Case of Lushan County, Sichuan Province. Land. 2022; 11(8):1205. https://doi.org/10.3390/land11081205
Chicago/Turabian StyleWang, Jun, Zhihua Wang, Hongbin Cheng, Junmei Kang, and Xiaoliang Liu. 2022. "Land Cover Changing Pattern in Pre- and Post-Earthquake Affected Area from Remote Sensing Data: A Case of Lushan County, Sichuan Province" Land 11, no. 8: 1205. https://doi.org/10.3390/land11081205
APA StyleWang, J., Wang, Z., Cheng, H., Kang, J., & Liu, X. (2022). Land Cover Changing Pattern in Pre- and Post-Earthquake Affected Area from Remote Sensing Data: A Case of Lushan County, Sichuan Province. Land, 11(8), 1205. https://doi.org/10.3390/land11081205