Article

Research on the Evaluation of Geological Environment Carrying Capacity Based on the AHP-CRITIC Empowerment Method

1
College of Surveying and Mapping Engineering, Changchun Institute of Technology, Changchun 130021, China
2
College of Jilin Emergency Management, Changchun Institute of Technology, Changchun 130012, China
3
School of Environment, Northeast Normal University, Changchun 130117, China
4
College of Water and Environmental Engineering, Changchun Institute of Technology, Changchun 130012, China
*
Author to whom correspondence should be addressed.
Land 2022, 11(8), 1196; https://doi.org/10.3390/land11081196
Submission received: 21 June 2022 / Revised: 26 July 2022 / Accepted: 27 July 2022 / Published: 29 July 2022

Abstract

:
In this study, two districts, Erdaojiang District and Dongchang District, in Tonghua City, Jilin Province, were evaluated for their geological environment carrying capacity. A total of 14 evaluation indicators were selected from the three aspects of the geological environment, ecological environment, and social environment to make it more comprehensive to evaluate the carrying capacity of the geological environment. Using the AHP and CRITIC methods, the subjective weight and objective weight of each evaluation index are obtained, and the combined weight is calculated by game theory. When combined with the GIS and combined weights, the distribution map of the geological environment carrying capacity is obtained, and it is classified into four grades: excellent, good, medium, and poor. A comprehensive evaluation of the carrying capacity of the geological environment is carried out. The following conclusions are drawn: the overall carrying capacity of the geological environment in the study area is good, and the carrying capacity of individual areas is poor. The comparative analysis of the good and poor areas provides a scientific basis for future environmental governance and urban planning and provides a scientific basis for geological disasters and mines.

1. Introduction

With the rapid growth of China’s economy and urbanization, the contradiction between social development and the resources and environment has become increasingly prominent [1]. The geological environment is the basis of resources, the environment, and engineering for all activities of human society. The main function of the geological environment is to determine whether our human society can survive better and provide the most basic support, such as a certain living space and various necessary material resources. The impact of human activities on the geological environment is huge. The environment not only faces the various wastes produced by human society but also faces significant damage to the geological environment caused by human activities. The geological environment absorbs the influence of human society, and the geological environment and human activities influence each other. The two also adapt to each other and evolve into an environment suitable for human survival activities [2]. In recent years, with the development of modern society, human beings have had an increasing demand for energy resources, and various minerals have been mined on a large scale. As a result, many mines that do not meet the mining specifications have appeared. Large-scale mining has changed many areas. Geological disasters caused by mining occur frequently, such as mudslides, landslides, and other geological disasters. Mining will also cause varying degrees of damage to vegetation, which has a great impact on human society [3]. From these geological environments, we can see that human activities have affected every aspect of the geological environment, and the same geological environment has also become one of the main factors restricting the sustainable development of human society [4]. In China, high-intensity development restricts the sustainable development of cities and towns [5]. In order to promote the construction of ecological civilization and sustainable development, it is necessary to carry out research on the carrying capacity of the geological environment. It can help us understand the status quo of the regional geological environment, clarify the bearing threshold of the geological environment for social development, and formulate more effective environmental protection policies [6].
The geological environment refers to the environmental system composed of the hydrosphere, the atmosphere, and the lithosphere [7]. It is not only affected by the atmosphere, hydrosphere, biosphere, and other spheres but also has an inseparable relationship with our human activities. The essence of mine geology refers to the relationship between man and land, that is, the relationship between mining activities and the geological environment. The geological action caused by mining activities and various geological phenomena forms a relatively independent environmental system [8], that is, the mine geological environmental system.
The earliest concept of carrying capacity originated from Malthus’s “Theory of Population” regarding the “limitation of food supply on the ability to support population growth”. Bishop expounded the comprehensive definition of environmental carrying capacity in the book “Carrying Capacity in Regional Environment Management” in 1974, which is the definition of the budding stage of geological environmental carrying capacity. [9]. We often use the carrying capacity theory to characterize the relationship between human social activities and the environment. In layman’s terms, the bearing capacity is the supporting object and the bearing object, that is, how many objects the supporting object can carry [10]. The carrying capacity of a region needs a lot of data and scientific calculation methods to be obtained. The AHP used in this paper is a calculation method that uses a relatively wide range of subjective weights [11,12]. The AHP can solve a complex decision problem according to the hierarchical structure of division. Scientific and systematic calculation yields subjective weights [13,14]. The critic is also a widely used method of calculating weights [15]. This method can reflect the characteristics of the difference distribution among the indicators and, according to the characteristics of the indicators, compare the strengths and conflicts and obtain the objective weight of the indicators [16,17] The quality of the geological environment is very important to human beings. The impact of human society on the environment is inevitable, and the changes of the geological environment are inseparable from the socioeconomic and policy background [18,19]. Human society has an increasing demand for resources, and the world’s large-scale coal mining is increasing. Large-scale mining activities have caused damage to vegetation and land and are also the main factor causing geological disasters. It has caused significant damage to the living environment of human beings [20,21]. In this paper, the carrying capacity of the geological environment is used to study the resources and environment required for the development of human society to undertake human activities. Based on the research status at home and abroad, this paper collects remote sensing data and DEM data through remote sensing and geographic information systems and conducts research and evaluation on Erdaojiang District and Dongchang District based on the geological hazard survey and zoning report of Tonghua City, Jilin Province. The application of remote sensing in the method of environmental assessment, combined with the local survey and zoning report, can be used to quickly and accurately evaluate the local environmental conditions and make reasonable plans for local development.

2. Materials and Methods

2.1. Study Area

The study area is located in the southeast of Jilin Province, bordering Liuhe County in the north, Ji’an City in the south, Tonghua County in the west, and Baishan City in the east. It is 35 km long from north to south, 38 km wide from east to west, covers an area of 745 km2, and has geographic coordinates of 125°50′–126°20′ east longitude and 41°30′–41°55′ north latitude (Figure 1). Dongchang District and Erdaojiang District have very convenient transportation. The study area has a continental monsoon climate in the north temperate zone, with a frost-free period of 125–140 days and an annual sunshine of 2411 h. Among them, the area with an average annual rainfall of 800–900 mm is distributed in the area north of the urban area of Tonghua City, and the average annual rainfall in most areas of Tonghua City is 700–800 mm. Most of them are concentrated in June–August, accounting for 61.3% of the annual precipitation. The precipitation distribution in the study area is relatively uniform, and the difference is small. Precipitation has a large external force, promoting the occurrence of geological disasters. The rainfall in Tonghua City is large and concentrated, which makes the occurrence time of geological disasters concentrated. and the loss aggravates. The surface water in the study area belongs to the waters of the Hunjiang River in the Yalu River system. The rivers are crisscrossed, and there are 12 main and secondary rivers, of which the Hunjiang is the main stream. Most of the rivers have short flow paths, rapid currents, large slopes, and strong scouring forces. The landform types in the area are mainly medium and low mountains, with inter-mountain valleys and plains distributed. The micro-topography along the river banks is often steep cliffs or steep slopes, with dense valleys between mountains and large slopes.
There are 28 major mines in the study area, of which 22 are under mining and 6 have ore to be mined. It is rich in mineral resources and has large geological reserves. There are large reserves of non-metallic minerals, non-ferrous metals, ferrous metals, and building materials. More than 50 kinds of minerals have been identified so far.

2.2. Establishment of Evaluation Indicators

This study selects multiple indicators to systematically and comprehensively evaluate the study area from the three criteria layers of geological environment, ecological environment, and social environment. Based on AHP, CRITIC, game theory, GIS, and field investigation, the study area was evaluated and analyzed. In order to carefully evaluate the geological environment carrying capacity of the mineral concentrated mining areas in Erdaojiang District and Dongchang District of Tonghua City, the geological environment survey data were collected from the Jilin Provincial Geological Environment Monitoring Station. The overall framework of this study is shown in Figure 2.

2.3. Selection and Classification of the Evaluation Index System

An appropriate, reasonable, and representative index system is the key to objectively reflecting the current situation of the study area [22]. Based on the domestic and foreign research progress of the geological environment system, combined with the geological environment, ecological environment, and social environment, research on the carrying capacity of the geological environment was carried out, and through exchanges with experts, 14 evaluation indicators were finally summarized. The principles for selecting indicators are listed in Table 1
The different influences of all the evaluation indexes of the geological environment carrying capacity in the study area are determined, and the carrying capacity of each evaluation index is scored. The impact of each index on the carrying capacity of the geological environment is different, which can be divided into positive or negative effects. The larger the slope, the steeper the surface inside the unit, and geological disasters are prone to occur, so the slope is a negative evaluation index. The denser the geological disasters, the lower the geological environment carrying capacity (CECC), which is also a negative evaluation index. The higher the altitude, the lower the regional stability and the worse the CECC, which is also a negative evaluation indicator. The closer to the fault, the more complex the geological environment and the worse the bearing capacity of the geological environment, which is a positive evaluation. In engineering geological rock formations, the harder the rock mass, the greater the bearing capacity of the geological environment. The higher the density of mines, the more serious the damage to the environment, the easier it is to cause various geological disasters, and the worse the CECC. Human production activities are inseparable from roads, and roads are greatly affected by activities. The denser the roads, the lower the carrying capacity of the geological environment. The higher the building density, the greater the transformation of the environment by people, and the lower the CECC, which is a negative evaluation index. The higher the GDP per capita, the better the CECC, because the region has an economy that can improve the local environmental conditions. The greater the population density, the more production activities of human society there are. Additionally, the greater the population density, the greater the demand for various resources in the region and the lower the CECC, which is a negative evaluation index. The river has a certain erosive effect on the surface. The larger the distribution of the water system, the worse the CECC, which is a negative index. The higher the vegetation coverage, the greater the bearing capacity of the geological environment, which is a positive indicator. The greater the precipitation, the greater the risk of geological disasters and the worse the CECC in areas with more rainfall. Land use types are classified from low to high according to industry and mining, water, grassland, cultivated land, and forest land. The indicators are classified and scored, and they are divided into five levels from low to high (V1, V2, V3, V4, V5) (Table 2).

2.4. Data Sources

The geological environment’s carrying capacity is comprehensively evaluated from the selected indicators. The selected indicators include ecological indicators, social indicators, and geological indicators, which are further divided into spatial information indicators and social and economic indicators. Spatial information indicators come from vector data and remote sensing image data. The data used in this study include: (1) DEM data coming from the geospatial data cloud sharing platform. This study used ASTER GDEM 30M resolution digital elevation data, version ASTER GDEM V002, with a vertical accuracy of 20 m and a horizontal accuracy of 30 m. The data are used to extract slope and river network data. (2) The 30 m resolution Landsat8 remote sensing image data. The Landsat OLI-8 satellite has a total of nine bands. The OLI sensor bands 1–7 and its nine multi-spectral bands have a spatial resolution of 30 m, and band 8 is a panchromatic band with a resolution of 15 m. The satellite can achieve a global coverage; its orbit type is a near-polar sun-synchronous orbit with an orbital altitude of 705 km. The normalized vegetation index NDVI was calculated by the remote sensing image processing software ENVI, and the vegetation coverage was obtained by using a suitable vegetation classification standard. (3) Geological disaster catalogue data, field survey data, and mine data provided by the geological disaster survey and zoning report of Tonghua City, Jilin Province. (4) Precipitation data are obtained by spatial interpolation after downloading from the China Meteorological Data Network. (5) Economic data obtained from the Tonghua Statistical Yearbook; population data obtained from the WorldPop dataset. Please refer to Table 3 for the specific sources of data indicators.
On the basis of the original data collection, ArcGIS 10.8 (Esri, Redlands, CA, USA) software was used to establish the thematic layers of each evaluation index, the unified transformation and projection of the coordinate system were carried out, and the coordinates adopted the unified WGS 1984 UTM Zone 52N Projected Coordinate System. The specific processing flow is not repeated here. According to the GIS reclassification function, the following indicator data map is obtained (Figure 3).

2.5. Determination of Weights

2.5.1. AHP Method

The Analytic Hierarchy Process (AHP) can reasonably determine the ranking of index weights, and they generally do not appear contrary to the actual importance [39,40]. The weight of each indicator is calculated systematically and hierarchically according to the hierarchical structure. Based on the establishment of the hierarchical model, the expert scoring method is used to compare different indicators according to their importance levels [41], thereby constructing a judgment matrix. For the eigenvector of the largest eigenvalue λ m a x of the judgment matrix, it is denoted as W i after normalization. In order to measure the size of CI, a random consistency index, RI, is introduced. It is generally considered that when the consistency ratio CR < 0.1, the consistency test is passed. It is reconstructed into a contrast matrix until the consistency check is passed. Subjective weights are obtained after the above calculations (Table 4).
λ m a x = i = 1 n ( A W ) i / n W i
C I = ( λ m a x n ) / ( n 1 )
C R = C I R I        
In the formula: λmax is the largest characteristic root; ( A W ) i is the i-th component of the vector A W ; n is the number of indicators; CR is the consistency ratio; CI is the consistency test index; RI is the random consistency index.

2.5.2. CRITIC Method

The CRITIC method can reflect the characteristics of the difference distribution between the indicators and calculate the weight based on the contrast strength and conflict between the indicators [42], as shown in Table 5. Among them, the contrast strength is expressed by the standard deviation. The larger the standard deviation, the more obvious the difference is, and the greater the impact on the bearing capacity is. The greater the correlation, the smaller the conflict, the stronger the relationship between the indicators, and the greater the impact on the bearing capacity. The calculation process is as follows: first, the standard deviation STD and covariance of each piece of index data are calculated, the covariance matrix is determined, and the correlation coefficient r i j matrix is obtained by calculating the covariance matrix.
R j = i = 1 n 1 r i j
C j = σ j   x   R j
W j = C j j = 1 n C j

2.5.3. Game Theory

Game theory is a theory and method for studying phenomena with a nature of struggle or competition. This study uses the idea and calculation method of game theory to combine the subjective weight and the objective weight, and then the combined weight obtained is also called the comprehensive weight of the indicator [43] (Table 6). The forms are more coordinated in the relationship of mutual competition, and a more balanced result is sought, which ensures the scientific nature of the geological environment assessment. The specific operation steps are as follows.
In order to make the obtained weights more reasonable and practical, use l different methods to weight each indicator and record the weight set of each indicator { ω k 1 , ω k 2 , , ω k n } k = 1, 2, …, 2, …, l. Then, the combination weight is any linear combination between l different vectors, as:
ω i = k = 1 l α k ω k i T α k > 0
In order to minimize the deviation between the comprehensive weight and the basic weight, optimize the combination coefficient:
min k = 1 l α k ω k i T ω k i 2 ( k = 1 , 2 , l )
According to the differential properties of the matrix, and by taking the optimal first derivative of Equation (12), it can be transformed into:
[ ω 1 i ω 1 i T ω 1 i ω 2 i T ω 1 i ω l i T ω 2 i ω 1 i T ω 2 i ω 2 i T ω 2 i ω l i T ω l i ω 1 i T ω l i ω 2 i T ω l i ω l i T ] [ α 1 α 2 α l ] = [ ω 1 i ω 1 i T ω 2 i ω 2 i T ω l i ω l i T ]
Calculate the composite weights
α k * = α k k = 1 l α k
Obtain the comprehensive index weights
ω i * = k = 1 l α k * ω k i T

2.5.4. Evaluation Model

The geological environment evaluation value C j is calculated using a weighted linear combination. The information from the 14 standardized evaluation indicators contained in each grid is multiplied by the comprehensive weight to calculate the comprehensive value [44].
C j = i = 1 n w i × e i

3. Evaluation Results and Analysis

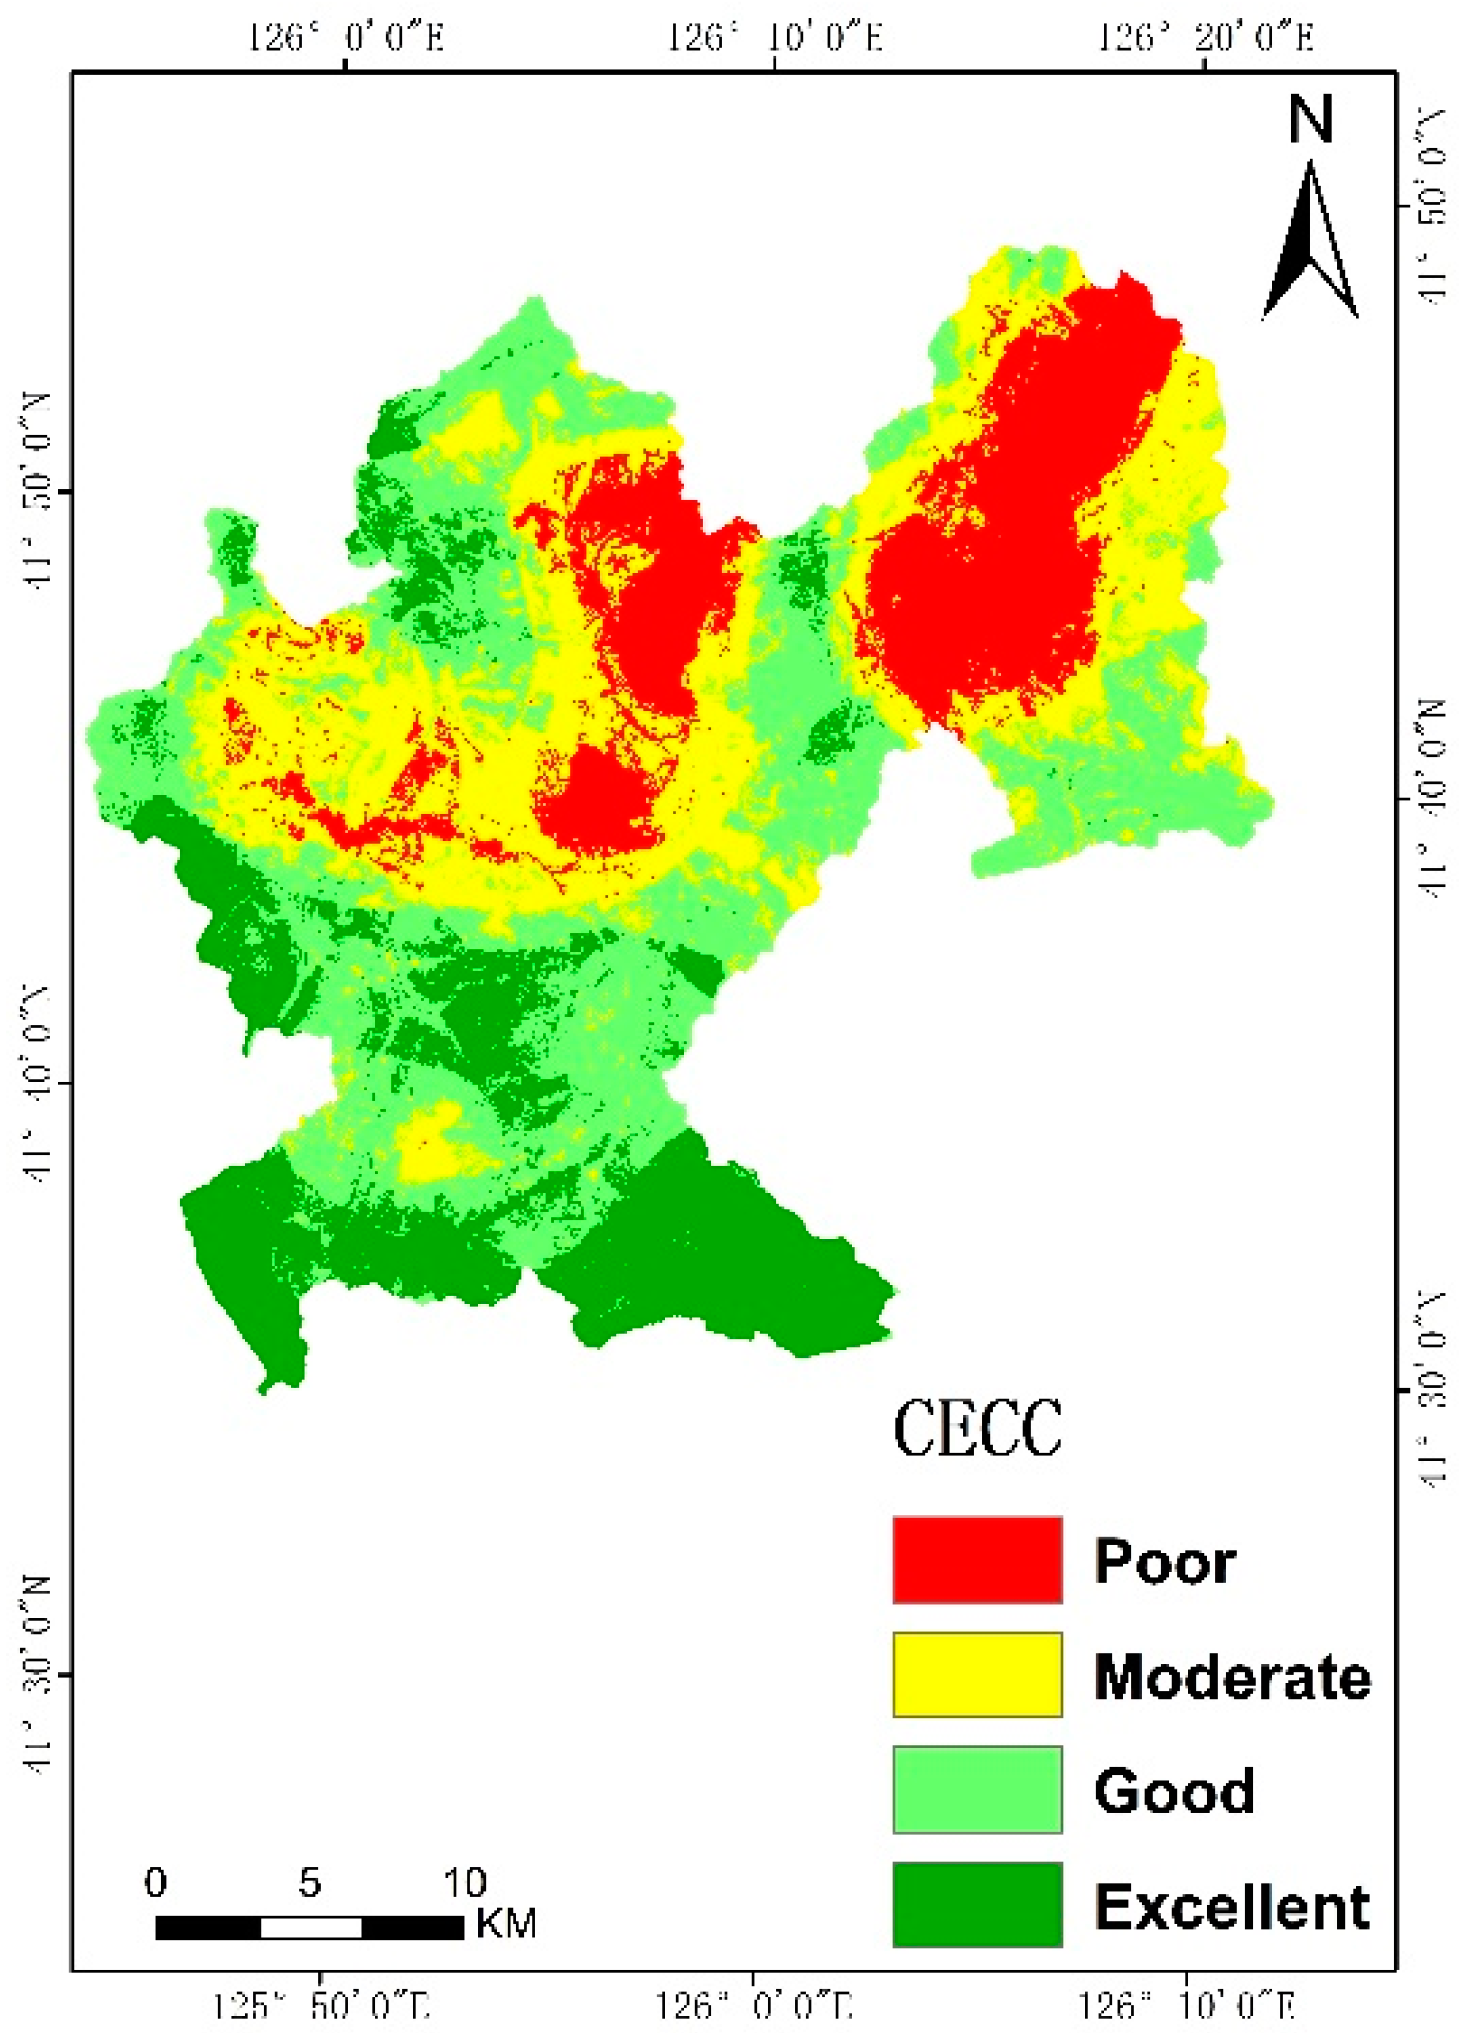
Based on the above evaluation methods and models, the raster layer of each evaluation index is multiplied by the comprehensive weight for the weighted summation through the raster calculation function of ArcGIS to obtain the spatial grading map of the bearing capacity of each subsystem. Using the natural discontinuity method, it is divided into four bearing capacity grades: excellent, good, medium, and poor (Figure 4). At the same time, statistics of the zoning results on the research bearing capacity are recorded. As shown in the table containing the geological environment’s bearing capacity results, the areas corresponding to excellent, good, medium, and poor are 149.1 km2, 255.74 km2, 203.14 km2, and 133.7 km2, and the area proportions are 20.10%, 34.48%, 27.39%, and 18.03%, respectively (Table 7).
Dongchang District of Tonghua City has jurisdiction over Huantong Township, Jiangdong Township, and Jinchang Town, and Erdaojiang District of Tonghua City has jurisdiction over Erdaojiang Township, Yayuan Town, Wudaojiang Town, and Tiechang Town. There are seven townships in the survey area. From the bearing capacity classification chart, we can see that the bearing capacity of Yayuan Town, Wudaojiang Town, the south and east of Erdaojiang Township, and the middle of Jiangdong Township are poor. There is a large number of concentrated mines and disaster-prone areas in these areas. These areas have many dense faults. The lithology of the stratum is dominated by siltstone, mudstone, and shale. The local slope is large, and the vegetation coverage is low, resulting in serious soil erosion, high population density, and social activities. The distribution characteristics of the population density are similar. The terrain is negatively correlated, that is, most of the population is concentrated in the mountain valley plain area. Among them, the densely populated areas are distributed in the urban area of Tonghua and various townships; the densely populated areas are distributed in the northeastern part of Erdaojiang Township and the central and northern parts of Jinchang Town; and the remaining areas are sparsely populated areas.
The areas with a medium carrying capacity are the eastern and western areas of Wudaojiang Town, most of Jiangdong Township, some areas in the middle of Jinchang, and the central and eastern areas of Huantong Township. There are relatively concentrated mines and disaster-prone points in the local areas. The terrain is relatively flat, the vegetation coverage is low, and the fault zone is relatively developed. It is composed of several faults and has more residential land.
The good and excellent areas account for 54.58% of the total study area. The vegetation coverage in this area is relatively high—mainly, coniferous forest, broad-leaved forest, and mixed coniferous and broad-leaved forest. There are fewer mining sites, fewer buildings, a lower population density, fewer human engineering activities, and a relatively stable geological environment.
With the improvement of the economic level of the survey area in recent years, the scale of residents’ various living, production, and engineering construction activities has expanded unprecedentedly, and human activities have become a huge driving force for changes in the geological environment and have induced geological disasters in the survey area. Under the influence of human activities, it can cause the movement of rock and soil and the migration of groundwater. When it exceeds the stable state, it often causes geological disasters. The quarry, the excavation of new houses, the toe of the road, and the cutting of the roads in the survey area can easily lead to geological disasters such as collapses and landslides. Underground mining activities can easily lead to geological disasters such as ground collapses, among others. The main reason for inducing geological disasters is the blindness and unscientific nature of human engineering activities, which is caused by the incongruity between engineering construction and the geological environment. It is mainly manifested in the destruction of vegetation, cutting slopes, and digging feet, the unreasonable mining of mine resources, and the random accumulation of waste residues, resulting in the deterioration of the ecological and geological environment, serious soil erosion, and frequent geological disasters such as collapses, landslides, debris flows, and ground subsidence. Compared with natural geological disasters, human engineering-induced geological disasters are more frequent and more harmful. First, the breadth and speed of human engineering activities are beyond the bearing range of the geological environment in many cases. That is, in many areas where geological disasters cannot occur, geological disasters are caused by human engineering activities. Secondly, the geological disasters induced by human engineering activities mostly occur in the areas where the population is concentrated and the human economy is developed, so the hazards are great. Geological disasters caused by human engineering activities are controllable.

4. Conclusions

This study takes Erdaojiang District and Dongchang District of Tonghua City, Jilin Province, as examples and establishes a research system for evaluating the geological environment carrying capacity of the study area. This paper selects 14 evaluation indicators from three aspects: geological environment, social environment, and ecological environment. In the previous evaluation methods, the weight calculation is often either subjective or objective, which makes the calculated weight have obvious objectivity and limitations. This paper adopts the method of combining subjective weight and objective weight to calculate the weight and uses GIS to combine the combination. The weight is obtained to obtain the status and spatial pattern of the geological environment’s carrying capacity of the study area, which enables us to better analyze the bearing capacity of the study area.
The results show that the areas with an excellent geological environmental carrying capacity account for 20.10% of the total area, and the areas with a good geological environment account for 34.48% of the total area. The medium area accounts for 27.39% of the total area, and the poor area accounts for 18.03% of the total research area. Among them, the excellent area accounts for 54.58% of the research area. The human society in this area has fewer activities, fewer disaster-susceptible points, fewer industrial and mining sites, and higher vegetation coverage. Such areas have a strong geological environment carrying capacity. Alternative choices can be performed in the definition of the geological and socioeconomic factors used in the model. These different choices could lead to different modelling results. The selection index of each region is different, the influencing factors are different, and the bearing capacity of the local geological environment is also different.
The geological environment’s carrying capacity can characterize the system’s resource-giving ability and the environment’s self-adjustment ability, and it can be used to indicate the pros and cons of the mine’s geological environment system. It runs through all the processes of mineral resource planning, exploration, development, pit closure, and restoration. It can measure whether the development of mineral resources and the geological environment of mines develop harmoniously. By carrying out relevant explorations on the carrying capacity of the geological environment of mines, the development intensity of mines is limited so as to rationally utilize limited mineral resources and efficiently utilize the land space area, which is in line with the “green mines”, “green economy”, “development in protection”, and “protection in development” sustainable development ideas.

Author Contributions

Conceptualization, J.Q., Y.Z. and J.Z.; methodology, J.Q.; software, J.Q., C.D. and C.W.; validation, Y.Z. and C.D.; formal analysis, J.Z.; investigation, J.Q., Z.C. and Z.P.; resources, Y.Z.; data curation, C.W. and J.Q.; writing—original draft preparation, J.Q.; writing—review and editing, J.Q., Y.Z. and J.Z.; visualization, J.Q.; supervision, Y.Z. and Y.C.; project administration, Y.Z. and Y.C. All authors have read and agreed to the published version of the manuscript.

Funding

This research was funded by the Jilin Province Development and Reform Commission, grant number: 2021C044-3.

Institutional Review Board Statement

Not applicable.

Informed Consent Statement

Not applicable.

Data Availability Statement

Not applicable.

Acknowledgments

Thanks are extended to each of the authors for their contributions to this research, both in terms of data and data collection and evaluation models, as well as in terms of computation and writing, which are the result of a joint effort.

Conflicts of Interest

The authors declare no conflict of interest.

References

  1. Xi, X.; Wang, S.; Yao, L.; Zhang, Y.; Niu, R.; Zhou, Y. Evaluation on geological environment carrying capacity of mining city—A case study in Huangshi City, Hubei Province, China. Int. J. Appl. Earth Obs. Geoinf. 2021, 102, 102410. [Google Scholar] [CrossRef]
  2. Ma, P.; Cui, L. Understanding and thinking about geological environment work. China Land Resour. Econ. 2017, 30, 54–59. [Google Scholar]
  3. Wang, F. Research on Resources and Environmental Carrying Capacity Based on GIS Technology; Taiyuan University of Technology: Taiyuan, China, 2012. [Google Scholar]
  4. Feng, Z.; Li, P. The Genesis and Evolution of the Concept of Carrying Capacity: A View of Natural Resources and Environment. J. Nat. Resour. 2018, 33, 1475–1489. [Google Scholar]
  5. Song, W.; Song, W.; Gu, H.; Li, F. Progress in the Remote Sensing Monitoring of the Ecological Environment in Mining Areas. IJERPH 2020, 17, 1846. [Google Scholar] [CrossRef] [PubMed] [Green Version]
  6. Hao, Q.; Deng, L.; Feng, Z. Carrying capacity reconsidered in spatial planning: Concepts, methods and applications. J. Nat. Resour. 2019, 34, 2073–2086. [Google Scholar] [CrossRef]
  7. Keller, E.A.; Burt, E.M. Environmental Geology; CE Merrill Publishing Company: Columbus, OH, USA, 1985; ISBN 0-675-20373-2. [Google Scholar]
  8. Xu, Y. Mine Environmental Geology and Geological Environment. Northwest Geol. 2005, 38, 108–112. [Google Scholar]
  9. Bishop, A.B. Carrying Capacity in Regional Environment Management; Government Printing Office: Washington, DC, USA, 1974. [Google Scholar]
  10. Jin, Y.; Jin, X.; Li, C. Evaluation of Urban Land Carrying Capacity Based on Coupling Curve of Confined and Pressured Pressure—A Case Study of 32 Cities in Zhejiang Province. Geogr. Res. 2018, 37, 1087–1099. [Google Scholar]
  11. Sonker, I.; Tripathi, J.N.; Singh, A.K. Landslide susceptibility zonation using geospatial technique and analytical hierarchy process in Sikkim Himalaya. Quat. Sci. Adv. 2021, 4, 100039. [Google Scholar] [CrossRef]
  12. Panchal, S.; Shrivastava, A.K. A comparative study of frequency ratio, Shannon’s entropy and analytic hierarchy process (AHP) models for landslide susceptibility assessment. ISPRS Int. J. Geo-Inf. 2021, 10, 603. [Google Scholar] [CrossRef]
  13. Achour, Y.; Boumezbeur, A.; Hadji, R.; Chouabbi, A.; Cavaleiro, V.; Bendaoud, A.E. Landslide susceptibility mapping using analytic hierarchy process and information value methods along a highway road section in Constantine, Algeria. Arab. J. Geosci. 2017, 10, 194. [Google Scholar] [CrossRef]
  14. Liu, R.; Pu, L.; Zhu, M.; Huang, S.; Jiang, Y. Coastal resource-environmental carrying capacity assessment: A comprehensive and trade-off analysis of the case study in Jiangsu coastal zone, eastern China. Ocean. Coast. Manag. 2020, 186, 105092. [Google Scholar] [CrossRef]
  15. Diakoulaki, D.; Mavrotas, G.; Papayannakis, L. Determing objective weights in multiple criteria problems: The CRITIC method. Comput. Oper. Res. 1995, 22, 763–770. [Google Scholar] [CrossRef]
  16. Žižović, M.; Miljković, B.; Marinković, D. Objective methods for determining criteria weight coefficients: A modification of the CRITIC method. Decis. Mak. Appl. Manag. Eng. 2020, 3, 149–161. [Google Scholar] [CrossRef]
  17. Alinezhad, A.; Khalili, J. New Methods and Applications in Multiple Attribute Decision Making (MADM); Springer: Cham, Switzerland, 2019; pp. 199–203. [Google Scholar]
  18. Manzoor, S.A.; Griffiths, G.H.; Robinson, E.; Lukac, M. Linking Pattern to Process: Intensity Analysis of Land-Change Dynamics in Ghana as Correlated to Past Socioeconomic and Policy Contexts. Land 2022, 11, 1070. [Google Scholar] [CrossRef]
  19. Zhang, S.; Zhao, K.; Ji, S.; Guo, Y.; Wu, F.; Liu, J.; Xie, F. Evolution Characteristics, Eco-Environmental Response and Influencing Factors of Production-Living-Ecological Space in the Qinghai–Tibet Plateau. Land 2022, 11, 1020. [Google Scholar] [CrossRef]
  20. Yang, Z.; Li, W.; Pei, Y.; Qiao, W.; Wu, Y. Classification of the type of eco-geological environment of a coal mine district: A case study of an ecologically fragile region in Western China. J. Clean. Prod. 2018, 174, 1513–1526. [Google Scholar] [CrossRef]
  21. Wang, X.; Han, J.; Lin, J. Response of Land Use and Net Primary Productivity to Coal Mining: A Case Study of Huainan City and Its Mining Areas. Land 2022, 11, 973. [Google Scholar] [CrossRef]
  22. He, F.; Gu, L.; Wang, T.; Zhang, Z. The Synthetic Geo-Ecological Environmental Evaluation of a Coastal Coal-Mining City Using Spatiotemporal Big Data: A Case Study in Longkou, China. J. Clean. Prod. 2017, 142, 854–866. [Google Scholar] [CrossRef]
  23. Mukai, S.; Billi, P.; Haregeweyn, N.; Hordofa, T. Long-term effectiveness of indigenous and introduced soil and water conservation measures in soil loss and slope gradient reductions in the semi-arid Ethiopian lowlands. Geoderma 2021, 382, 114757. [Google Scholar] [CrossRef]
  24. Lin, J.; Chen, W.; Qi, X.; Hou, H. Risk Assessment and Its Influencing Factors Analysis of Geological Hazards in Typical Mountain Environment. J. Clean. Prod. 2021, 309, 127077. [Google Scholar] [CrossRef]
  25. Chang, S.; Zhang, S. Geological Engineering Handbook; China Architecture & Building Press: Beijing, China, 2007. [Google Scholar]
  26. Yang, X.; Tang, G.; Liu, X.; Li, F.; Zhu, S. Theory, Method and Application of Digital Terrain Analysis. Chin. J. Geogr. 2009, 64, 1058–1070. [Google Scholar]
  27. Owen, J.R.; Kemp, D.; Lèbre, É.; Svobodova, K.; Pérez Murillo, G. Catastrophic tailings dam failures and disaster risk disclosure. Int. J. Disaster Risk Reduct. 2019, 42, 101361. [Google Scholar] [CrossRef]
  28. Qin, Y.; Cao, L.; Darvishi Boloorani, A.; Wu, W. High-Resolution Mining-Induced Geo-Hazard Mapping Using Random Forest: A Case Study of Liaojiaping Orefield, Central China. Remote Sens. 2021, 13, 3638. [Google Scholar] [CrossRef]
  29. Lin, D.; Li, L. Environmental Study on Mining Area Living Environment Satisfaction Evaluation-Taking an Example of Huainan City. EKOLOJI 2019, 28, 851–855. [Google Scholar]
  30. Jeong, Y.; Yu, J.; Wang, L.; Shin, J. Spectral Responses of As and Pb Contamination in Tailings of a Hydrothermal Ore Deposit: A Case Study of Samgwang Mine, South Korea. Remote Sens. 2018, 10, 1830. [Google Scholar] [CrossRef] [Green Version]
  31. Economou-Eliopoulos, M.; Megremi, I. Contamination of the Soil–Groundwater–Crop System: Environmental Risk and Opportunities. Minerals 2021, 11, 775. [Google Scholar] [CrossRef]
  32. Xue, M.; Zhang, X.; Sun, X.; Sun, T.; Yang, Y. Expansion and Evolution of a Typical Resource-Based Mining City in Transition Using the Google Earth Engine: A Case Study of Datong, China. Remote Sens. 2021, 13, 4045. [Google Scholar] [CrossRef]
  33. Worlanyo, A.S.; Jiangfeng, L. Evaluating the Environmental and Economic Impact of Mining for Post-Mined Land Restoration and Land-Use: A Review. J. Environ. Manag. 2021, 279, 111623. [Google Scholar] [CrossRef]
  34. Wang, P.; Sun, Z.; Hu, Y.; Cheng, H. Leaching of Heavy Metals from Abandoned Mine Tailings Brought by Precipitation and the Associated Environmental Impact. Sci. Total Environ. 2019, 695, 133893. [Google Scholar] [CrossRef]
  35. Chen, L.; Zhang, H.; Zhang, X.; Liu, P.; Zhang, W.; Ma, X. Vegetation Changes in Coal Mining Areas: Naturally or Anthropogenically Driven? CATENA 2022, 208, 105712. [Google Scholar] [CrossRef]
  36. Lamich, D.; Marschalko, M.; Yilmaz, I.; Bednářová, P.; Niemiec, D.; Kubečka, K.; Mikulenka, V. Subsidence Measurements in Roads and Implementation in Land Use Plan Optimisation in Areas Affected by Deep Coal Mining. Environ. Earth Sci. 2016, 75, 69. [Google Scholar] [CrossRef]
  37. Aşıcı, A.A. Economic growth and its impact on environment: A panel data analysis. Ecological Indicators 2013, 24, 324–333. [Google Scholar] [CrossRef] [Green Version]
  38. Macarof, P.; Statescu, F. Comparasion of NDBI and NDVI as Indicators of Surface Urban Heat Island Effect in Landsat 8 Imagery: A Case Study of Iasi. Present Environ. Sustain. Dev. 2017, 11, 141–150. [Google Scholar] [CrossRef] [Green Version]
  39. Panchal, S.; Shrivastava, A.K. Landslide hazard assessment using analytic hierarchy process (AHP): A case study of National Highway 5 in India. Ain Shams Eng. J. 2022, 13, 101626. [Google Scholar] [CrossRef]
  40. Abuzaid, A.S.; AbdelRahman, M.A.; Fadl, M.E.; Scopa, A. Land degradation vulnerability mapping in a newly-reclaimed desert oasis in a hyper-arid agro-ecosystem using AHP and geospatial techniques. Agronomy 2021, 11, 1426. [Google Scholar] [CrossRef]
  41. Wu, X.; Hu, F. Analysis of ecological carrying capacity using a fuzzy comprehensive evaluation method. Ecol. Indic. 2020, 113, 106243. [Google Scholar] [CrossRef]
  42. Odu, G.O. Weighting methods for multi-criteria decision making technique. J. Appl. Sci. Environ. Manag. 2019, 23, 1449–1457. [Google Scholar] [CrossRef] [Green Version]
  43. Zhou, J. Evaluation of Slope Stability Based on Game Theory Combination Weighting Method Based on Fuzzy Mathematics. People’s Pearl River 2021, 42, 14–20+27. [Google Scholar]
  44. Yang, Z.; Li, W.; Li, X.; Wang, Q.; He, J. Assessment of eco-geo-environment quality using multivariate data: A case study in a coal mining area of Western China. Ecol. Indic. 2019, 107, 105651. [Google Scholar] [CrossRef]
Figure 1. Location and land use types of the study area.
Land 11 01196 g001
Figure 2. Flowchart of the GECC evaluation study.
Land 11 01196 g002
Figure 3. Spatial distribution of the evaluation factors: (a) Vegetation cover, (b) Land use types, (c) NDBI, (d) Water distribution, (e) Slope, (f) Elevation, (g) Mine distribution density, (h) Annual rainfall, (i) Stratigraphy lithology, (j) Distance from fault, (k) Geological disaster density, (l) Road density, (m) Economy GDP, (n) Population density.
Land 11 01196 g003aLand 11 01196 g003bLand 11 01196 g003c
Figure 4. Evaluation results of GECC.
Land 11 01196 g004
Table 1. Selection principles of evaluation indicators.
Criterion LayerIndicator LayerSelection Principle
Geological environmentSlopeIn some mountainous and hilly areas, the disasters caused by the slope are relatively high, and the disasters caused are mainly the following: collapse, landslides, and mudslides. [23]
Distance from faultAlong large tectonic fault zones, landslides and collapses often occur in groups [24], especially in areas with frequent mining activities.
Stratigraphy lithologyThe properties of rock and soil are related to the safety and rationality of mine development and will have an impact on the bearing capacity of the mine geological environment [25]. Lithology is divided into four categories, namely, hard rock, soft and hard rock, average hardness, and soft rock.
ElevationDEM data can directly reflect the topography and mountain height of the region. It is an important method and means by which people can study the geological environment and disasters in this area [26].
Mining densityMine development is the most important human economic activity in this area. The higher the density of the mining sites, the more likely it is that geological disasters will occur, and the lower the carrying capacity of the mine geological environment will be [27].
Geological disaster densityGeological hazards are the representative factors that directly reflect the regional geological environment [28]. The complex terrain, poor natural geological environment, and intense human mining activities have resulted in the frequent occurrence of various geological disasters in the region, which have brought huge losses to the lives and properties of local residents. Geological disasters pose a major threat to the geological environment.
EcosystemVegetation coverThe greatest harm caused by low vegetation coverage is soil erosion, which, in turn, causes geological disasters and reduces the bearing capacity [29].
Water distributionThe distribution of water systems is inseparable from human engineering activities. For example, the discharge of mine wastewater and factory wastewater will cause a certain degree of water pollution, which is inseparably related to the distribution density and distance of water systems [30,31].
Land use typeThe type of land use can directly reflect the changes of any eco-geological environment [32]. The spatial planning of the city can be intuitively made through the type of land use, which is more conducive to the development of the city. [33]. It can be more intuitive to determine which land type has a greater impact on the bearing capacity.
Annual rainfallAccording to statistics, rainfall is also the main cause of various geological disasters. According to the Tonghua City survey report, geological disasters such as collapses, landslides, and debris flows often occur in the rainy season, and ground subsidence and ground fissures also mostly occur in the rainy season. Precipitation will also cause harmful substances from human engineering activities and factory waste to flow into rivers, causing serious environmental problems [34] and having a significant impact on the carrying capacity of the geological environment.
Social environmentPopulation densityThe development and utilization of land and mineral resources by humans have accelerated the degradation of the ecological and geological environment. Mine development is closely related to population density [35].
Road densityThe density of the roads represents the degree of human activity in the area. The denser the road, the more intense the activity in the area, and it also has a considerable impact on the carrying capacity, which is often negative [36].
GDPThe level of per capita GDP can reflect the intensity of human social production activities in a region [37].
NDBIBuilding density can be used to reflect the disturbance and damage of human engineering activities to the geological environment in the study area [38]
Table 2. Classification of indicators.
IndicatorsHierarchical Assignment
V1V2V3V4V5
Lithology-soft rockaverage hardnesssoft and hard rockhard rock
Elevation>1000800~1000600~800400~600<400
Slope>5540~5525~4015~25<15
Distance to fault<600600~12001200~18001800~3000>3000
Geohazardmore seriousseriousgenerallylighterlight
Miningmuchmuchgenerallylessnone
Vegetation coverno coveragelow coveragelow to mediummediumhigh
Annual rainfall>1011995~1011982~995971~982<971
Water>0.660.28~0.660.19~0.280.01~0.19<0.01
Land useindustrial and mining, residentialwatersgrasslandarable landwoodland
Per capita density>360210~360100~210100~30<30
GDP<1.031.03~1.731.73~2.732.73~4.14>4.14
Road density>6.353.43~6.351.72~6.350.56~1.72<0.56
NDBI>0.50.5~0.10.1~−0.1−0.1~−0.2<−0.2
Table 3. Data type, resolution, and sources.
Assessment IndexData TypesResolutionData Source
SlopeRaster data30 mASTER GDEM V2 slope extract
Annual rainfallRaster data1 km1 km monthly precipitation dataset for China
Stratigraphy lithologyVector data1:250,000Regional Geological
Water Vector data1:250,000National
Distance from faultVector data1:1,000,000Catalog Service for Geographic Information
Vegetation Coverage (FC)Raster data30 mLandsat 8 OIL
ElevationRaster data30 mASTER GDEM
NDBI 30 m
Economy GDPDocumentation Tonghua Statistical Yearbook
Land useRaster data30 mFROM-GLC version2
Population densityRaster data100 mWorldPop
Road densityVector data1:1,000,000Catalog Service for Geographic Information
Mine distribution densityVector data1:50,000Geological Environment Monitoring Station
Geological disaster densityVector data1:50,000Geological Environment Monitoring Station
Table 4. Subjective weights.
Target LayerCriterion LayerCriterion Layer WeightIndicator LayerIndicator Layer WeightSubjective Weight
Geological environment carrying capacityGeological environment0.633Elevation0.1340.085
Geohazard0.1530.097
Slope0.2150.036
Lithology0.2150.136
Distance to fault0.0820.052
Mining0.3590.227
Ecosystem0.216Vegetation Coverage0.4450.047
Water0.2830.030
Annual rainfall0.1070.011
Land use type0.1650.018
Social environment0.106Per capita density0.1980.052
GDP0.1400.036
Road density0.3870.101
NDBI0.2750.072
Table 5. Objective weights.
Target LayerCriterion LayerIndicator LayerSTDRjCjObjective Weight
Geological environment carrying capacityGeological environmentElevation0.4928.5413.6640.053
Geohazard0.4408.3773.6840.053
Slope0.4308.4633.6420.052
Stratigraphic lithology0.40211.3544.5610.066
Distance from fault0.40218.3677.3860.107
Mining0.42012.0015.0430.073
EcosystemVegetation Coverage0.43917.4127.6490.110
Water distribution0.41515.0836.2610.090
Annual rainfall0.4678.4383.9420.057
Land use type0.4309.1943.9550.057
Social environmentPer capita density0.4459.6844.3090.062
GDP0.4289.2133.9480.057
Road density0.40519.2557.7960.113
NDBI0.3998.6923.4670.050
Table 6. Combined weights.
Target LayerCriterion LayerIndicator LayerSubjective WeightObjective WeightCombined Weight
Geological environment carrying capacityGeological environmentElevation0.0850.0530.079
Geohazard0.0970.0530.089
Slope0.0360.0520.039
Stratigraphic lithology0.1360.0660.124
Distance from fault0.0520.1070.062
Mining density0.2270.0730.199
EcosystemVegetation Coverage0.0470.1100.058
Water distribution0.0300.0900.041
Annual rainfall0.0110.0570.019
Land use type0.0180.0570.025
Social environmentPer capita density0.0520.0620.054
GDP0.0360.0570.040
Road density0.1010.1130.103
NDBI0.0720.0500.068
Table 7. GECC bearing capacity value and area ratio.
Partition LevelPoorModerateGoodExcellent
GECC1.98–2.902.9–3.303.3–3.73.7–4.4
Area(km2)133.70203.14255.74149.10
Area ratio18.03%27.39%34.48%20.10%
Publisher’s Note: MDPI stays neutral with regard to jurisdictional claims in published maps and institutional affiliations.

