Abstract
Changes in land use have several impacts on soil organic carbon (C) and nitrogen (N) cycling, both of which are important for soil stability and fertility. Initially, the study area was barren uncultivated desert land. During the late 1960s, the introduction of a canal in the arid region converted the barren deserts into cultivated land. The objectives of the present study were to evaluate the effects of various land use systems on temporal changes in soil organic C and N pools, and to evaluate the usefulness of different C and N management indices for suitable and sustainable land use systems under arid conditions. We quantified soil organic C and N pools in five different land uses of the Ghaggar flood plains, in hot, arid Rajasthan, India. The study focused on five land use systems: uncultivated, agroforestry, citrus orchard, rice–wheat, and forage crop. These land use systems are ≥20 years old. Our results showed that total organic carbon (TOC) was highest (7.20 g kg−1) in the forage crop and lowest in uncultivated land (3.10 g kg−1), and it decreased with depth. Across different land uses, the very labile carbon (VLC) fraction varied from 36.11 to 42.74% of TOC. In comparison to the uncultivated system, forage cropping, rice–wheat, citrus orchard, and agroforestry systems increased active carbon by 103%, 68.3%, 42.5%, and 30.6%, respectively. Changes in management and land use are more likely to affect the VLC. In soil under the forage crop, there was a considerable improvement in total N, labile N, and mineral N. Lability index of C (LIC), carbon management index (CMI), and TOC/clay indices were more sensitive to distinguishing land uses. The highest value of CMI was observed in the forage crop system followed by rice–wheat and agroforestry. In the long term, adoption of the forage crop increased soil quality in the hot, arid desert environment by enhancing CMI and VLC, which are the useful parameters for assessing the capacity of land use systems to promote soil quality.
1. Introduction
Hot, arid regions of India spanning across ~31.7 million hectares are characterized by a variety of landforms, soils, fauna, flora, and water resources as well as human activities [1,2]. As population and food demand continuously increase, these desert soils of hot, arid regions of India are being converted into arable lands, and more rapidly for the last 60 years. Desert soils, however, have been harmed by increased wind erosion and salinity due to agricultural exploitation. There is an enormous amount of carbon (C) stored in desert ecosystems, and they store almost one-third of all terrestrial C (total C) [3,4], whereas 10% of the worldwide soil organic carbon (SOC) stock is found in arid and semiarid regions [5]. However, intensive cultivation, shrinking water resources, low biological productivity, severe erosion, and extreme climatic conditions in the arid regions of India have decreased the SOC [4,6]. As a result, identifying and implementing appropriate management techniques and land uses for arid regions to maintain or improve the SOC stock and recalcitrant or passive C pool are needed to enhance and sustain productivity while mitigating climate change.
Soil organic matter (SOM) is a critical component of soil quality and consequently a primary predictor of agricultural system sustainability [7]. Climate and management methods or cropping systems are the primary determinants of SOM maintenance in diverse land use systems. An important function of the SOM is to store nutrients, promote plant growth, and also sustain soil biodiversity, drive the nutrient cycle, maintain soil structural stability, increase infiltration of water, maintain porosity, and prevent erosion [8]. The dynamics of soil quality are determined by changes in SOM under crop cultivation. The primary constituents of SOM, SOC, and total nitrogen (TN) are strongly linked to a wide range of physical, chemical, and biological aspects of soil. Therefore, SOC and TN are used as important indicators of soil quality [9,10]. Since these labile forms of C and N are particularly sensitive to changes caused by agricultural management, they are employed to quantify SOM [11]. The total soil N content is the sum of all N pools in soil, most of which are organic in form and turn inorganic upon decomposition of SOM. For many arable crops, organic N mineralization is the primary process of N nutrition, and its potential in soil is regarded as a superior measure of fertility. Therefore, derived C and N indices such as carbon/N lability, carbon lability index, carbon pool index, and carbon management index (CMI)/nitrogen management index (NMI) may be used to analyze changes in SOM [7,12].
Knowledge of variations in SOC and TN under diverse land uses is required to understand the feasibility of applying conservation techniques to maintain production and safeguard the environment. CMI and NMI are good early indicators of whether or not a specific agricultural system is contributing to better soil quality. Land use changes can have a big influence on soil C storage. Agroforestry systems, diversified crop cycles, higher cropping intensity, and horticultural crops might all help to boost soil C sequestration [13]. However, very little information is available on these aspects for sandy desert soils of India. The current study examines the impact of diverse land uses on various soil organic C and N pools, as well as CMI and NMI. The objectives of this research were (a) to assess the effects of different land use patterns/systems on temporal variations in soil organic C and N pools in India’s hot desert area; and (b) to evaluate the use of several C and N management indices as early indicators of overall C and N changes in various land uses in dry (arid) conditions. This knowledge would enable farmers to cultivate desert soils appropriately for long-term sustainability.
2. Materials and Methods
2.1. Study Sites
The study sites were the central state farm and central cattle breeding farm in the Suratgarh block of Sri Ganganagar district, Rajasthan, which lie between 29°20′53′′ N to 29°24′47′′ N latitude and 73°30′0′′ E to 73°37′38′′ E longitude and are situated at 171 m above mean sea level (Figure 1). The physiography was western plain–semiarid transitional plains, which constitute hot, arid sandy plains, and the agro-eco sub-region of the Ghaggar flood plains. The major soil series was Suratgarh soil series (fine, loamy, mixed (cal.) hyperthermic family of Ustochreptic Haplocambids). The dominant soils are deep to very deep. The soils are slightly alkaline (pHw of 8.31) and organic C and CaCO3 were 0.20 and 4.8%, respectively [14].
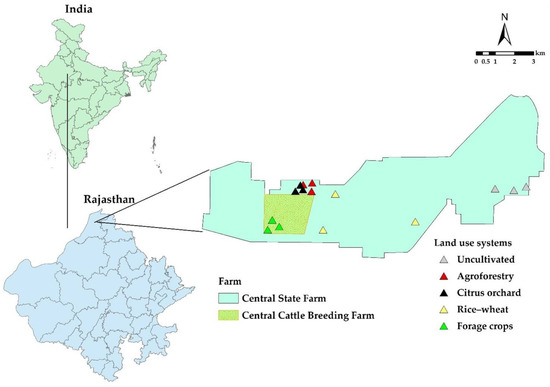
Figure 1.
Study area and soil sampling locations in various land use systems of a hot, arid desert climate.
2.2. Land Use Changes
Initially, the study area was barren uncultivated desert land during the 1950s. In the late 1960s, the introduction of a canal in the arid region converted the barren deserts into cultivated land. The lands were brought under field as well as plantation crops and agroforestry trees since 1955. For this study, five different land use systems, namely (i) uncultivated, (ii) agroforestry, (iii) citrus orchard, (iv) rice–wheat system, and (v) forage crops were selected. All of the selected land uses were more than 20 years old, to examine the long-term impact of land uses on the buildup of SOC and N and their pools. Here, we compared SOC and N pools of different land uses with uncultivated land considering the initial soil condition with reference to climatic and topographic conditions (Table 1).

Table 1.
Description of land use systems prevailed in the hot arid regions of India.
2.3. Soil Sampling and Analyses
During May 2015, three composite soil samples were taken using an auger at five intervals of 0–20, 20–40, 40–60, 60–80, and 80–100 cm from each land use type. Each sampling site had three plots, and as a result a total of 75 (5 land uses × 5 depths × 3 plots) composite samples were considered for laboratory analysis. Core samples were collected separately for determination of bulk density (BD).
The collected samples were analyzed for BD, pH, electrical conductivity (EC), cation exchange capacity (CEC), texture, and different pools of soil organic C and N following standard protocols. Soil BD was determined by core sampler (with known value) method [15]. Soil texture, pH, EC, and CEC were measured by Jackson’s technique [16]. The rapid titration technique was used to examine calcium carbonate (CaCO3) [17]. Wet oxidation method was used to determine total organic C (TOC) in soil [18]. By treating the soil with 0.02 M KMnO4, oxidizable carbon (KMnO4-C) was calculated [19]. Particulate organic carbon (POC) was determined following the procedure as outlined by Camberdella and Elliot [20]. The difference between TOC and POC was used to determine mineral-associated organic carbon (MOC). Wet oxidation was used to estimate the oxidizable organic C (OOC) content of soil [21]. For the estimation of very labile C (VLC), labile C (LC), less labile C (LLC), and non-labile C (NLC), the modified Walkley and Black technique was used [22] with different concentrations of H2SO4 (5, 10, and 20 mL of concentrated (36.0 N) H2SO4 in the ratios of 0.5:1, 1:1, and 2:1). The amount of TN in the soil was assessed by digesting it with concentrated H2SO4 [23]. Keeney and Nelson’s approach for determining inorganic N (NH4+-N and NO3—-N) was followed [24]. Organic N (Org-N) was calculated by deducting inorganic N from TN. The mineralizable N (labile N) was determined by the alkaline potassium permanganate (KMnO4-N) method [25].
2.4. Soil Quality Indices
Carbon management index (CMI) and nitrogen management index (NMI) were derived using the dynamics of SOC and N. The reference was an uncultivated soil near the experimental field; CMI and NMI were both set to 100.
CMI was calculated using the Blair et al. [7] mathematical methodologies, which are detailed below:
CPI is for C pool index, while LIC stands for C lability index. The following are the formulas for calculating the CPI and LIC:
The NMI was estimated using the techniques described by Gong et al. [26], which are identical to CMI [7]:
NPI stands for N pool index, while LIN stands for N lability index. The NPI and LIN are calculated using the following method:
C/N, POC/TOC, OOC/LBN, TOC/clay, C stratification ratio (CSR), and N stratification ratio (NSR) have all been proven to be good indicators for assessing soil quality (SQI) [27]. The ratio of TOC concentration to the TN concentration gave soil C/N ratio, and the other indices were derived by considering the same criteria. CSR and NSR were determined by comparing parameter values in the surface soil (0–20 cm) to those at a deeper depth [27,28].
2.5. Carbon and Nitrogen Stock
The SOC and N stock was calculated by multiplying their respective TOC and TN value with BD and depth of soil as:
SOC stock (Mg ha−1) = TOC (or TN) (g kg−1) × BD (Mg m−3) ×Depth (m) × 10
2.6. Statistical Analysis
Duncan’s multiple range test (DMRT) at p < 0.05 was performed to find out specific differences between means of different soil depths as well as land use systems. Pearson’s correlation matrix was used to assess the link between distinct pools of organic C and N and soil characteristics. A principal component analysis (PCA) was used to summarize the entire variance of the data for the examined depth (0–100 cm) data utilizing land use systems, which included all fractions of soil organic carbon and nitrogen as well as soil quality indicators (SQI). All these statistical analyses were performed by the R software version 3.6.2 [29]. The prncomp() function and ggplot2 package of R were used for principal component analysis and graph preparation, respectively.
3. Results
3.1. Effects of Land Use Systems on Soil Properties
The mean BD varied from 1.47 (forage crop) to 1.52 Mg m−3 (agroforestry) (Table 2). The mean BD, on the other hand, was not significantly altered depending on the land use scheme. The soil EC varied from 0.18 to 0.51 dS m−1 across the land use systems, with forage crop soils having considerably lower soil EC (p < 0.05) than the other land use systems. However, there was no substantial change in soil pH and EC across soil depths within the land use system. The pattern of CEC became more uneven as soil depth increased across all land uses. The agroforestry system showed higher total CaCO3 compared to all land uses. CaCO3 concentration rose by 57.8%, 72.8%, 16.6%, and 1.11% in 0–20 cm soil depth in fodder crop, rice–wheat, citrus orchard, and agroforestry, respectively, over uncultivated soil. With respect to particle size fractions, i.e., sand and silt contents, which varied from 23.0 to 37.65% and 34.19 to 47.74%, respectively, soils under diverse land uses did not differ substantially (p < 0.05). The clay content ranged from 22.69 to 39.64% across various land uses and the mean clay content of the various land use systems did not differ much. However, with increasing depth there were significant changes in clay contents in forest and rice–wheat land use systems.
Table 2.
In a hot, arid climate, the depth-wise distribution of soil attributes as influenced by various land use systems.
3.2. Effects of Land Use on TOC, POC, MOC, and KMnO4-C
Although the content of TOC, POC, MOC, and KMnO4-C varied greatly amongst land uses, their order of magnitude remained stable throughout different depths (Table 3). The average TOCs for various land uses were varied in the order of forage crop (7.20 g kg−1) > rice–wheat (4.70 g kg−1) > citrus orchard (4.11 g kg−1) > agroforestry (3.54 g kg−1) > uncultivated (3.10 g kg−1). It was observed that different land uses significantly affected the MOC fraction. In uncultivated, agroforestry, citrus orchard, rice–wheat, and fodder crops, MOC varied from 1.10 to 2.81, 0.97 to 3.79, 1.76 to 3.67, 0.94 to 5.51, and 2.92 to 7.38 g kg−1, respectively, along the depth. In comparison to uncultivated land, the KMnO4−C rose by 31.7 to 104.8% in various cultivated land uses.
Table 3.
Depth-wise distribution of total organic carbon (TOC), particulate organic carbon (POC), mineral-associated organic carbon (MOC), and KMnO4 oxidizable carbon (KmnO4-C) as affected by different land use systems in a hot, arid environment.
3.3. Effects of Land Use on OOC and its Fractions
The OOC and its fractions are extensively used in several agricultural sustainability or environmental quality monitoring programs. In the forage crop, rice–wheat, citrus orchard, and agroforestry systems, OOC buildup was 7.29, 5.95, 5.17, and 4.34 g kg−1, respectively, compared to 2.95 g kg−1 in uncultivated soil (0–20 cm depth) (Table 4). The increases in OOC under the forage crop and rice–wheat was 116% and 74% greater over the uncultivated soil. The magnitude OOC under a gradient of oxidizing environments was as follows: under all land uses, NLC > LLC > LC > VLC. VLC concentrations in diverse land uses ranged from 0.19 to 1.27 g kg−1 along the soil profile up to a depth of 100 cm. The LC and LLC concentrations of various land uses ranged from 0.46 to 2.60 g kg−1 and 0.43 to 3.41 g kg−1, respectively. NLC concentration was found to be maximum (3.78 g kg−1) in 0–20 cm of the forage crop and minimum (0.92 g kg−1) in 80–100 cm of uncultivated land. In all land uses, the share of passive carbon pools (LLC and NLC) was higher than the active carbon pools (VLC and LC). There was no significant difference in OOC fractions with depth in agroforestry and uncultivated land.
Table 4.
In a hot, arid environment, the depth-wise distribution of oxidizable organic C (OOC) and its fractions as impacted by different land use systems.
3.4. Effects of Land Use on TN and its Fraction
Higher accumulation of TN, Org-N, and KMnO4-N in the surface layers observed under all the land uses and different pools of lability showed a decreasing trend with increasing soil depth (Table 5). With respect to concentration of C fractions, the distribution of N fractions throughout depth in each land use followed a decreasing pattern. Average TN content followed the order: forage crop (488 mg kg−1) > rice–wheat (323 mg kg−1) > citrus orchard (316 mg kg−1) > agroforestry (244 mg kg−1) > uncultivated (254 mg kg−1). However, a similar pattern was observed in the distribution of TN and Org-N contents with respect to organic carbon distribution and was comparatively higher in the forage crop followed by the rice–wheat system than in other land uses. Significantly higher mean KMnO4-Nwas maintained up to 100 cm soil depth in the forage crop (50.1 mg kg−1) over the rice–wheat (47.9 mg kg−1) and uncultivated land (28.3 mg kg−1). All the land uses showed higher accumulation of mineral N in the 0–20 cm soil depth and then decreased with depth.
Table 5.
Depth-wise distribution of total N and its fractions as impacted by different land use systems.
3.5. Carbon and Nitrogen Stock
The SOC stock distribution revealed a diminishing trend with depth across all land uses (Figure 2). The forage crop showed a maximum SOC stock (26.36 Mg ha−1) at 0–20 cm soil depth. It was found to be highest in the rice–wheat system at soil depths of 20–40 and 40–60 cm, with 18.01 Mg ha−1 and 12.59 Mg ha−1, respectively. SOC stock in the soil profile up to 100 cm depth was highest in fodder crops (52.74 Mg ha−1) and lowest in uncultivated land (22.92 Mg ha−1). TN stock followed a similar pattern as SOC stock across various land uses and depths. When compared to rice–wheat, citrus orchard, and agroforestry land use systems, forage crop land use systems had considerably larger TN stock (1.42 Mg ha−1) at the 0–20 cm depth. Rice–wheat (1.13 Mg ha−1) TN stock was also different from citrus orchard and agroforestry systems. Only in the 0–20 cm depth, the difference in TN stock between the fodder crop (0.78 Mg ha−1) and rice–wheat (0.25 Mg ha−1) was significant (p < 0.05). The TN stock did not differ between land use systems at 60–80 and 80–100 cm depths. All land uses showed no significant changes in N stock in the bottom soil layer.
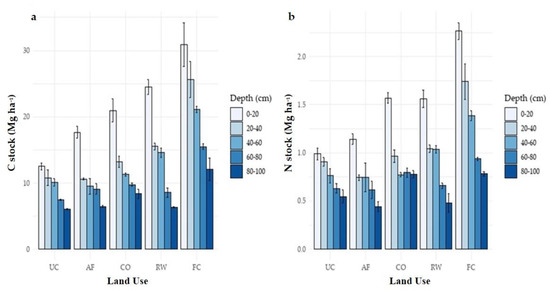
Figure 2.
(a,b) Soil organic carbon and nitrogen stock at different soil depths in different land use systems in hot, arid environment. UC, uncultivated; AF, agroforestry; CO, citrus orchard; RW, rice–wheat system; FC, forage crop.
3.6. Relationship with Soil Properties and Pools of Soil C and N
KMnO4-C displayed a negative and substantial connection with BD (r = −0.447b), pH (r = −0.691b), CaCO3 (r = −0.396b), and silt fractions (r = −0.290a) according to Pearson’s correlation matrix (Table 6). However, it was shown to have a strong and positive relationship with CEC (r = 0.453b). TOC was significantly (p < 0.01) and inversely linked with BD (r = −0.421b), pH (r = −0.766b), and CaCO3 (r = −0.364b). The SOC and N fractions had a substantial and positive relationship with the silt fractions. CEC and KMnO4-N were shown to have a substantial correlation (r = 0.504b). BD, pH, CaCO3, and silt fractions all exhibited a negative and substantial relationship with N fractions. SOC and N fractions were not related to EC, sand, and clay.
Table 6.
Correlation coefficient (r) between soil properties and various organic C and N pools in soils under different land use systems.
3.7. Soil Quality Indices
Under all land uses, the LI and CPI ranged from 0.92 to 1.18 and 1.00 to 2.54, respectively (Table 7). The ranking of the mean CMI under various land uses was as follows: forage crop (299) > rice–wheat (251) > citrus orchard (220) > agroforestry (169) > uncultivated land (147). Simple linear regression analysis revealed that OOC, KMnO4-C, VLC, and POC have strong linear correlations with CMI (Figure 3). In the 0–20 cm depth, a higher regression coefficient was found between CMI with KMnO4-C (R2 = 0.94) followed by OOC (R2 = 0.85), VLC (R2 = 0.75), and AC (R2 = 0.73). Lower soil depths had a lower regression coefficient. Rice–wheat and agroforestry had much lower CMI than forage crop systems in this study. Because rice–wheat systems exhibited considerably lower rates of soil C rehabilitation than forage systems, these data suggest that forage systems provide better choices for C sequestration in soils in arid ecosystems than rice–wheat systems. The highest value of NMI was observed in rice–wheat followed by forage crop, agroforestry, and citrus orchard. The impacts of land use on soil NPI and NMI followed the same pattern as soil TN. The reference (uncultivated) value is 100. Values below 100 suggest that the system is deteriorating, while values over 100 show that the system is improving in terms of N. The highest NMI values were obtained in the forage crop land use (205 at 0–20 cm, 165 at 20–40 cm, 138 at 40–60 cm, 158 at 60–80 cm, and 157 at 80–100 cm soil depth). The correlation between NMI and KMnO4-N (R2 = 0.89) was stronger than the correlation between NMI and mineral N (R2 = 0.60) (Figure 4). However, significantly higher NMI values were obtained from the continuous agricultural intensification compared to uncultivated soil.
Table 7.
In a hot, arid environment, depth-wise distribution of carbon and nitrogen management indices as influenced by different land use systems.
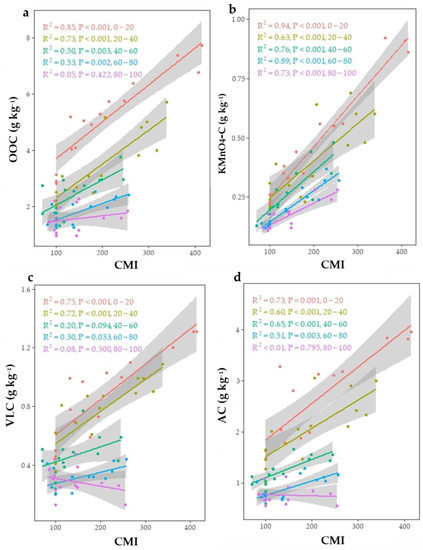
Figure 3.
Relationship between carbon management index (CMI) with (a) oxidizable organic carbon (OOC), (b) KMnO4 oxidizable organic carbon (KMnO4-C), (c) very labile carbon (VLC), and (d) active carbon (AC) at different soil depths.
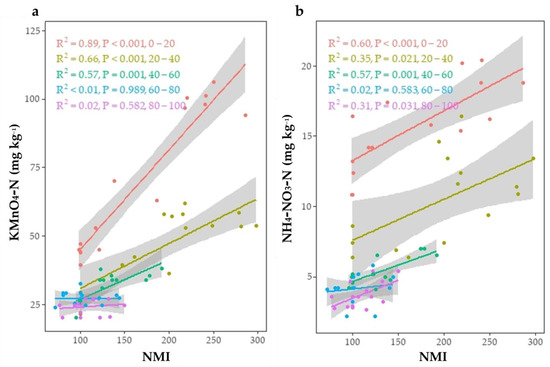
Figure 4.
Relationship between nitrogen management index (NMI) with (a) KMnO4 oxidizable organic nitrogen (KMnO4-N) and (b) mineral N (NH4-N + NO3-N) at different soil depths.
The C/N ratio is a nutrient mineralization and immobilization indicator; a lower C/N ratio (<15:1) implies a higher mineralization rate. In the top 0–20 cm depth, the forage crop and rice–wheat systems showed significantly higher C/N ratios as compared to other land uses. In most land uses, C/N ratios declined from 0–20 cm to 20–40 cm depth, except for fodder crops, which exhibited a minor rise (Figure 5). Moreover, the C/N ratio in forage crops was considerably greater (p < 0.05) than in rice–wheat and agroforestry systems below 40 cm depth.
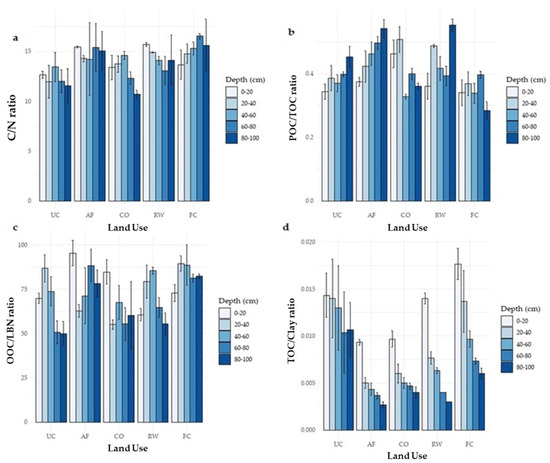
Figure 5.
Indicators of soil organic carbon and nitrogen (a) C/N ratio, (b) POC/TOC ratio, (c) OOC/LBN ratio and (d) TOC/Clay ratio at various soil depths in various land use systems. UC, uncultivated; AF, agroforestry; CO, citrus orchard; RW, rice–wheat system; FC, forage crop.
The C/N ratio in the research region was found to be greater above the standard range of 10:1 predicted in mineral soils. On the other hand, POC/TOC, OOC/LBN, and TOC/clay ratio showed differences between land use systems, with the highest values in the forage crop. Average CSR and NSR in the different land uses decreased in the following order: rice–wheat > forage crop > citrus orchard > agroforestry > uncultivated (Figure 6). As a result, the stratification ratio of C and N at lower depths was larger than in the top layers.
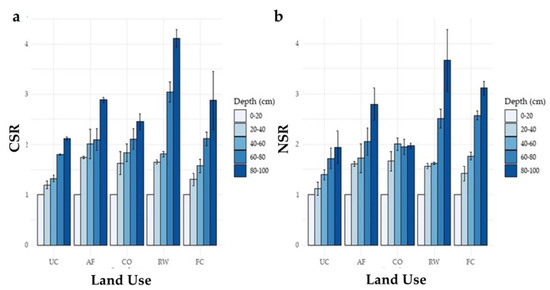
Figure 6.
(a) Carbon stratification ratio (CSR) and (b) nitrogen stratification ratio (NSR) at different soil depths in different land use systems. UC, uncultivated; AF, agroforestry; CO, citrus orchard; RW, rice–wheat system; FC, forage crop.
PCA is a more precise data selection approach of which variables or indices were more influential in differentiating land uses from the combined 0–100 cm data. The dimensionality of the data set in a PCA was defined by correlations and scatter plot matrices between variables, which selected variable candidates that may explain the variance in sensitivity indices for various fractions with respective pool sizes. The first two principal components (PCs) of the data set explained 83.9% and 8.32% of total variance, respectively (Table 8). The highly weighted variable in PC1 included TOC, OOC, POC, AC, TN, profile C, and N stock. In the PC2, variables of NLC, NH4-N, and NO3-N were found highly weighted. Regarding SQI, the PCA allowed a clearer differentiation of the land uses. The PC1 explained 32.0% of the variance where CMI, NPI, CPI, and CSR presented a positive and significant association (Table 9). The second PC explained 19.2% of the variance, where LIN, LIC, and POC/TOC ratio exhibited positive and significant associations in that component. Therefore, considering the mean value of SQI, it can be assumed that CMI, NPI, CPI, CSR, LIN, LIC, and POC/TOC ratio were the most sensitive indices for segregating land uses.
Table 8.
Principal component (PC) study of soil organic carbon and nitrogen pools in a hot, arid environment under various land use systems.
Table 9.
In a hot, arid environment, principal component analysis of soil organic carbon and nitrogen indices under various land use systems.
The loading of each variable (arrows) and the scores of each land use (points) are shown in the PCA bi-plot (Figure 7). The length of the arrows and angle between them (cosine) approximates the variance and their correlations, respectively. The bi-plot between PC1 and PC2 has four quadrants. Our objective here is to establish some relation between the land use systems in different quadrants with the SOC and N fractions and their indices. The bi-plot showed an overlapping pattern while considering individual scores of each land use. For the TOC, NLC, MOC, PC, and TN, the forage crop was somewhat tilted to the right along the PC1 axis. Along the PC2 axis, rice–wheat scores were considerably biased toward greater negative values. The rice–wheat scores were clearly more impacted toward more positive values along the PC1 axis for the CMI, NPI, CPI, CSR, LIN, LIC, and POC/TOC ratios, according to SQI in the bi-plot.
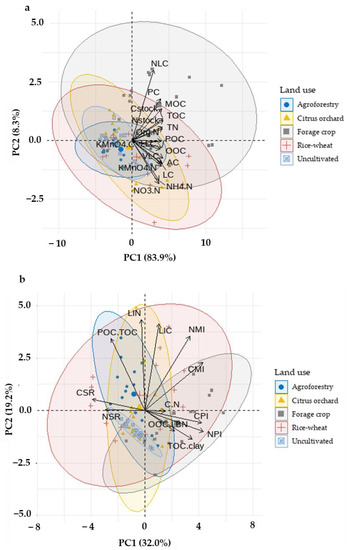
Figure 7.
Principal component analysis (PCA) bi-plot for all land use systems involving soil organic carbon (SOC) and N fractions (a) and indices (b).
4. Discussion
The soil characteristics along with C and N fractions varied greatly depending on the land use, but the order of magnitude remained similar throughout the depths. The difference in BD with soil depth was found to be substantial, with the lower depth layer having a greater BD than the topsoil layer, because of the overlying soil’s weight, which produces compaction and a decrease in SOM content [11]. In all land uses, the pH and EC patterns were more erratic as depth increased. The impacts of land use on soil pH were not significant. In lower depths, there was no influence on EC. However, in the rice–wheat combination, a significant drop in EC was noted, which could be ascribed to the use of an irrigation source to leach off soluble salt [30]. Although there was an increase in clay and silt in the subsurface layers, along with a decline in sand content, the soils were primarily sandy [31]. Long-term irrigation under rice–wheat systems may have resulted in increased fine soil particles due to sediment movement by the canal [1,32].
The current study found that cultivating desert soil for 60 years enhanced TOC and its fractions under a variety of land uses. Due to the minimal vegetation found in desert soils, organic matter input into the soil is limited. However, differing land uses and soil layers were found to have a considerable impact on the KMnO4-C fraction [11,33]. In the surface depth of the forage crop, TOC and its fraction were much higher than in the lower depths. Overall, all land use systems and soil management approaches resulted in higher organic C buildup than uncultivated land. Land use changes can have a significant influence on SOC dynamics and carbon transport [34]. High TOC might be linked to high vegetative growth, fast root proliferation, organic matter breakdown, and subsequent organic matter retention in soil aggregates owing to clay complexes, as seen by the abundance of fine soil particles. The development of clay–organic complexes and soil aggregates in the arid region was likely facilitated by soil moisture resulting from alternating wet and dry conditions, accumulating the greatest amount of SOC. The decrease in TOC on uncultivated land is due to a drop in organic matter input and oxidation of SOC because of exposing soils to the blazing sun [35].
In terms of turnover time, the particulate organic matter pool is halfway between the active and passive organic matter pools (i.e., a slow pool) [20]. The primary sources of POC in this study were leftover root biomass, agricultural residues, leaf litter, and increased microbial biomass and plant debris. The various land uses investigated had a significant impact on the POC values. The high results under land uses were consistent with the findings of Kalambukattu et al. [36] that changes in land uses can lead to particle organic matter buildup. POC accounted for 37.7% (uncultivated) to 42% (citrus orchard) of the TOC across all land uses. In dry or cold climates, the POC reported a 50% greater level of SOC [37]. The lower POC to TOC ratios in our samples are most likely owing to the hot, dry environment, which favors biological decomposition of recent organic material inputs, resulting in less POC buildup [2]. The findings of Camberdella and Elliott [20] and Six et al. [38] demonstrated that soil disturbances such as tillage can lower POC levels.
Both OOC and TOC decreased with depth in all the land uses studied, probably due to a decrease in surface litter intake in lower soil layers [33,39,40]. These results are similar to those reported by Moharana et al. [30] for rice-based cropping systems in India’s hot, dry region, where long-term farming increased the labile and recalcitrant fractions (LLC and NLC). Changes in land use were also particularly sensitive to the VLC and LC fractions of SOC [22]. This showed that monitoring the efficacy of various land uses in sustaining active C pools, which play a larger role in nitrogen cycling, is crucial. After 60 cm of soil depth, no significant difference in MOC and KMnO4-C concentrations was observed across all land uses. These findings corroborated those of Lal [41] and Gelaw et al. [42], who found that grazing field soils have greater SOC stock than agricultural soils due to more root biomass and residue returning to the surface.
Below 40 cm deep, a significant fall in the level of N fractions was seen for all land uses. The higher TN in soil cultivated with the forage crop might be attributed to the higher organic carbon, which came from the return of plant and root biomass as well as residues to the soil system [42,43]. Because of changes in SOM content and cultivation, Moharana et al. [2] found a substantial difference in KMnO4-N between barren and cultivated land. Mineral N concentrations in rice–wheat were similarly greater than in the citrus orchard and uncultivated land, showing that a higher rate of mineral fertilizer application in the rice–wheat system might boost N concentrations. Surface soil had higher KMnO4-N levels than subsurface soil, regardless of land use. This might be linked to the breakdown of root biomass in the surface layer, which releases nitrogen when organic matter is mineralized, re-leaving available nitrogen.
Despite the fact that pool sizes varied greatly among land use regimes, sensitivity indices for various fractions demonstrated that their susceptibility to change was comparable to total pools [26]. Due to different land use changes, no single pool could be employed as a sensitive indicator for SOC and N changes. VLC, LC, CMI, NPI, CPI, CSR, LIN, LIC, and POC/TOC ratio could be used as sensitive C and N indicators. The VLC was shown to be substantially more sensitive to management than the TOC. The LLC fraction, on the other hand, was far less affected by changes in land use than the TOC fraction. LBN (KMnO4-N) has a lower sensitivity than Org-N and TN, implying that it is ineffective as a sensitive indicator of land use changes. Westerhof et al. [44] indicated that the NMI was an excellent indication of N availability but not of total N. This was most likely owing to tillage’s fast mineralization of labile organic materials. Labile N by KMnO4 is a quick and easy approach to assess the nitrogen status in soils.
5. Conclusions
Influence of land use and soil depth on variations in soil C and N fractions was investigated under arid conditions in India. The VLC, CMI, and NMI, among other soil quality indices, changed dramatically with land use. The VLC was substantially more responsive to changes in land use than the TOC. Forage crop and rice–wheat soils had greater TOC and TN than uncultivated soils, showing a large potential for adopting these methods to adsorb SOC and TN in these soils. The top 0–20 cm of the forage crop contained the majority of the SOC and TN. The sensitivity indices can be used to assess their utility and detect changes in SOC and N fractions caused by land use changes. NMI demonstrated to be a valuable indicator for analyzing changes in soil quality induced by rice–wheat land use because of the significant correlations between NMI and the OOC and N fractions. The study found that anthropogenic modifications of desert soils by changing to various land uses resulted in considerable improvements in C and N stock. In the arid region, therefore, integrating appropriate forage crops and agroforestry trees into agricultural fields and adopting restorative land uses can greatly influence the sequestration of both SOC and TN. Among the various land uses, forage crops, which have a larger biomass, have a higher TOC and CMI, and are considered the optimal systems for maintaining soil health in desert soil of India. The findings are particularly unique and useful for researchers, planners, and policymakers in desert ecosystems; nevertheless, such research can be improved in the future by considering climate, management, and socioeconomic factors of the region.
Author Contributions
Conceptualization, P.C.M.; writing—original draft preparation, P.C.M., R.K.J., G.K.S., and S.S.; supervision, P.C.M.; writing—review and editing, P.K.J., K.A., P.V.V.P., P.C.M., R.L.M., and M.N.; visualization, P.C.M. and P.K.J. All authors have read and agreed to the published version of the manuscript.
Funding
The ICAR-National Bureau of Soil Survey and Land Use Planning, Nagpur, India financially supported the study.
Institutional Review Board Statement
Not applicable.
Informed Consent Statement
Not applicable.
Data Availability Statement
All data are included in the manuscript, and additional data are available with the corresponding author and will be available upon request.
Acknowledgments
For enabling this research to be completed successfully, the authors are very thankful to the Director of the ICAR-National Bureau of Soil Survey and Land Use Planning (NBSS and LUP), Nagpur, and to the Head, NBSS and LUP, Regional Center, Udaipur.
Conflicts of Interest
The authors declare that they do not have any competing or conflict of interest.
References
- Singh, S.K.; Kumar, M.; Sharma, B.K.; Tarfadar, J.C. Depletion of organic carbon, phosphorus and potassium stock under pearl millet based cropping sequence in arid environment of India. Arid. Land Res. Manag. 2007, 21, 119–131. [Google Scholar] [CrossRef]
- Moharana, P.C.; Naitam, R.K.; Verma, T.P.; Meena, R.L.; Kumar, S.; Tailor, B.L.; Singh, R.S.; Singh, S.K.; Samal, S.K. Effect of long term cropping systems on soil organic carbon pools and soil quality in western plain of hot arid India. Arch. Agron. Soil Sci. 2017, 63, 1661–1675. [Google Scholar] [CrossRef]
- Trumper, K.; Ravilious, C.; Dickson, B. Carbon in Drylands: Desertification, Climate Change and Carbon Finance. In Proceedings of the A UNEP-UNDP-UNCCD Technical Note for Discussions at CRIC 7 Istanbul, Istanbul, Turkey, 3–14 November 2008; pp. 3–14. [Google Scholar]
- Lal, R. Soils and world food security. Soil Tillage Res. 2009, 102, 1–4. [Google Scholar] [CrossRef]
- Williams, M.; Dunkerley, D.; De Deckker, P.; Kershaw, P.; Chappell, J. Evidence from the Deserts, Quaternary Environments, 2nd ed.; Arnold: New York, NY, USA, 1998. [Google Scholar]
- Ojima, D.S.; Dirks, B.M.; Glenn, E.P.; Owensby, C.E.; Scurlock, J.O. Assessment of C budget for grasslands and dry lands of the world. Water Air Soil Pollut. 1993, 70, 95–109. [Google Scholar] [CrossRef] [Green Version]
- Blair, G.J.; Lefroy, R.D.B.; Lisle, L. Soil carbon fractions based on their degree of oxidation, and the development of a carbon management index for agricultural systems. Aust. J. Agric. Res. 1995, 46, 1459–1466. [Google Scholar] [CrossRef]
- Gregorich, E.G.; Carter, M.R.; Angers, D.A.; Monreal, C.M.; Ellert, B.H. Towards a minimum data set to assess soil organic matter quality in agricultural soils. Can. J. Soil Sci. 1994, 74, 367–385. [Google Scholar] [CrossRef] [Green Version]
- Singh, S.K.; Kumar, M.; Sharma, B.K. Changes in soil properties in hot arid region of India. J. Indian Soc. Soil Sci. 2009, 57, 24–30. [Google Scholar]
- de MoraesSá, J.C.; PotmaGonçalves, D.R.; Ferreira, L.A.; Mishra, U.; Inagaki, T.M.; Ferreira Furlan, F.J.; Moro, R.S.; Floriani, N.; Briedis, C.; de Oliveira Ferreira, A. Soil carbon fractions and biological activity based indices can be used to study the impact of land management and ecological successions. Ecol. Indic. 2018, 84, 96–105. [Google Scholar] [CrossRef]
- Benbi, D.K.; Brar, K.; Toor, A.S.; Singh, P. Total and labile pools of soil organic carbon in cultivated and undisturbed soils in northern India. Geoderma 2015, 237–238, 149–158. [Google Scholar] [CrossRef]
- Ghosh, B.N.; Meena, V.S.; Alam, N.M.; Dograa, P.; Bhattacharyya, R.; Sharma, N.M.; Mishra, P.K. Impact of conservation practices on soil aggregation and the carbon management index after seven years of maize–wheat cropping system in the Indian Himalayas. Agric. Ecosyst. Environ. 2016, 216, 247–257. [Google Scholar] [CrossRef]
- Sharma, V.; Hussain, S.; Sharma, K.R.; Arya, V.M. Labile carbon pools and soil organic carbon stocks in the foothill Himalayas under different land use systems. Geoderma 2014, 232–234, 81–87. [Google Scholar] [CrossRef]
- Shyampura, R.L.; Singh, S.K.; Singh, R.S.; Jain, B.L.; Gajbhiye, K.S. Soil Series of Rajasthan; (NBSS Publ. No. 95); NBSS & LUP: Nagpur, India, 2002. [Google Scholar]
- Veihmeyer, F.J.; Hendrickson, A.H. Soil density and root penetration. Soil Sci. 1948, 65, 487–493. [Google Scholar] [CrossRef]
- Jackson, M.L. Soil Chemical Analysis; Prentice Hall India Pvt. Ltd.: New Delhi, India, 1967. [Google Scholar]
- Richards, L.A. Diagnosis and Improvement of Saline and Improvement of Saline and Alkali Soils. In USDA Agricultural Handbook 60; U.S. Government printing office: Washington, DC, USA, 1954. [Google Scholar]
- Snyder, J.D.; Trofymow, J.A. A rapid accurate wet oxidation diffusion procedure for determining organic and inorganic carbon in pot and soil samples. Commun. Soil Sci. Plant Anal. 1984, 15, 587–597. [Google Scholar] [CrossRef]
- Weil, R.R.; Islam, K.R.; Stine, M.A.; Gruver, J.B.; Samson-Liebig, S.E. Estimating active carbon for soil quality assessment: A simplified method for laboratory and field use. Am. J. Altern. Agric. 2003, 18, 3–17. [Google Scholar]
- Camberdella, C.A.; Elliott, E.T. Particulate soil organic matter changes across a grassland cultivation sequence. Soil Sci. Soc. Am. J. 1992, 56, 777–783. [Google Scholar] [CrossRef]
- Walkley, A.; Black, I.A. An examination of the Degtjareff method for determining soil organic matter and a proposed modification of the chromic acid titration method. Soil Sci. 1934, 37, 29–38. [Google Scholar] [CrossRef]
- Chan, K.Y.; Bowman, A.; Oates, A. Oxidizable organic carbon fractions and soil quality changes in an oxicpaleustaff under different pasture leys. Soil Sci. 2001, 166, 61–67. [Google Scholar] [CrossRef]
- Bremner, J.M.; Mulvaney, C.S. Nitrogen-total. In Methods of Soil Analysis. Part 2. Chemical and Microbiological Properties; Page, A.L., Miller, R.H., Keeney, D.R., Eds.; Soil Science Society of America: Madison, WI, USA, 1982; pp. 595–624. [Google Scholar]
- Keeney, D.R.; Nelson, D.W. Nitrogen-inorganic forms. In Methods of Soil Analysis. Part 2: Chemical and Microbiological Properties; Page, A.L., Miller, R.H., Keeney, D.R., Eds.; Soil Science Society of America: Madison, WI, USA, 1982; pp. 643–698. [Google Scholar]
- Subbiah, B.V.; Asija, G.L. A rapid method for the estimation of available nitrogen in soils. Curr. Sci. 1956, 25, 259–260. [Google Scholar]
- Gong, W.; Yan, X.; Wang, J.; Hu, T.; Gong, Y. Long-term applications of chemical and organic fertilizers on plant-available nitrogen pools and nitrogen management index. Biol. Fertil. Soils 2011, 47, 767–775. [Google Scholar] [CrossRef]
- Duval, M.E.; Martinez, J.M.M.; Galantini, J. Assessing soil quality indices based on soil organic carbon fractions in different long-term wheat systems under semiarid conditions. Soil Use Manag. 2020, 36, 71–82. [Google Scholar] [CrossRef]
- Franzluebbers, A.J. Soil organic matter stratification ratio as an indicator of soil quality. Soil Tillage Res. 2002, 66, 95–106. [Google Scholar] [CrossRef]
- R Core Team. R Version 3.6.1: A Language and Environment for Statistical Computing. R Foundation for Statistical Computing, Vienna, Austria. 2019. Available online: https://www.R-project.org (accessed on 25 August 2021).
- Moharana, P.C.; Singh, R.S.; Singh, S.K.; Jena, R.K.; Naitam, R.K.; Verma, T.P.; Nogiya, M.; Meena, R.L.; Gupta, D.K.; Sunil, K.; et al. Assessment of soil quality monitoring indicators under long term rice cultivation in hot arid Ghaggar-flood plains of India. Arch. Agron. Soil Sci. 2018, 64, 2030–2044. [Google Scholar] [CrossRef]
- Singh, S.K.; Kumar, M.; Pandey, C.B.; Ghosh, A.; Mukhopadhyay, S.; Sarkar, D. Differences in soil properties between irrigation and cropping sequences in the Thar Desert of India. Arid Land Res. Manag. 2013, 27, 17–31. [Google Scholar] [CrossRef]
- Khan, M.A.; Moharana, P.C.; Singh, S.K. Integrated natural resources and environmental impact assessment for sustainable development of Ganganagar district, Rajasthan. In Research Report, Division of Natural Resources and Environment; Central Arid Zone Research Institute: Jodhpur, India, 2003. [Google Scholar]
- Anantha, K.C.; Majumder, S.P.; Badole, S.; Padhan, D.; Datta, A.; Mandal, B.; Sreenivas, C.H. Pools of organic carbon in soils under a long-term rice–rice system with different organic amendments in hot, subhumid India. Carbon Manag. 2020, 11, 331–339. [Google Scholar] [CrossRef]
- Post, W.M.; Kwon, K.C. Soil carbon sequestration and land-use change: Processes and potential. Glob. Chang. Biol. 2000, 6, 317–327. [Google Scholar] [CrossRef] [Green Version]
- Pandey, C.B.; Singh, G.B.; Singh, S.K.; Singh, R.K. Soil nitrogen and microbial biomass carbon dynamics in native forests and derived agricultural land uses in a humid tropical climate of India. Plant Soil 2010, 333, 453–467. [Google Scholar] [CrossRef]
- Kalambukattu, J.G.; Singh, R.; Patra, A.K.; Arunkumar, K. Soil carbon pools and carbon management index under different land use systems in the central Himalayan region. Acta Agric. Scand. B Soil Plant Sci. 2013, 63, 200–205. [Google Scholar] [CrossRef]
- Franzluebbers, A.J.; Arshad, M.A. Particulate organic carbon content and potential mineralization as affected by tillage and texture. Soil Sci. Soc. Am. J. 1997, 61, 1382–1386. [Google Scholar] [CrossRef]
- Six, J.; Elliot, E.T.; Paustian, K.; Doran, J.W. Aggregation and soil organic matter accumulation in cultivated and native grassland soils. Soil Sci. Soc. Am. J. 1998, 62, 1367–1377. [Google Scholar] [CrossRef] [Green Version]
- Jobbágy, E.G.; Jackson, R.B. The vertical distribution of soil organic carbon and its relation to climate and vegetation. Ecol. Appl. 2000, 10, 423–436. [Google Scholar] [CrossRef]
- Yu, P.; Han, K.; Li, Q.; Zhou, D. Soil organic carbon fractions are affected by different land uses in an agro-pastoral transitional zone in North eastern China. Ecol. Indic. 2017, 73, 331–337. [Google Scholar] [CrossRef]
- Lal, R. Soil carbon dynamics in cropland and range land. Environ Pollut. 2002, 116, 353–362. [Google Scholar] [CrossRef]
- Gelaw, A.M.; Singh, B.R.; Lal, R. Soil organic carbon and total nitrogen stocks under different land usesin a semi-arid watershed in Tigray, Northern Ethiopia. Agric. Ecosyst. Environ. 2014, 188, 256–263. [Google Scholar] [CrossRef]
- Girmay, G.; Singh, B.R.; Mitiku, H.; Borresen, T.; Lal, R. Carbon stocks in Ethiopian soils in relation to land use and soil management. Land Degrad. Dev. 2008, 19, 351–367. [Google Scholar] [CrossRef]
- Westerhof, R.; Vilela, L.; Ayarza, M.; Zech, W. Land use effects on labile N extracted with permanganate and the nitrogen management index in the Cerrado region of Brazil. Biol. Fertil. Soils 1998, 27, 353–357. [Google Scholar] [CrossRef]
Publisher’s Note: MDPI stays neutral with regard to jurisdictional claims in published maps and institutional affiliations. |
© 2022 by the authors. Licensee MDPI, Basel, Switzerland. This article is an open access article distributed under the terms and conditions of the Creative Commons Attribution (CC BY) license (https://creativecommons.org/licenses/by/4.0/).