1. Introduction
In the process of the development and transformation of human society, rural recession has become a global trend and a worldwide problem [
1]. The Chinese government has been focusing on agriculture, rural areas, and farmers for 15 consecutive years, highlighting them as the “priority among priorities”. The No. 1 Central Document of 2018 further proposed a strategy for rural revitalization. Ordered first, industrial prosperity is regarded as the foundation and momentum for rural revitalization. Specialized villages, as important space carriers for the prosperity of rural industries, are inlaid in vast agricultural areas like mosaics. Specialized villages are “dominated by one industry and supplemented by other industries” and have generated a good economic effect. This rural economic development model has evolved rapidly from a specific spot to the entire area, forming an agglomeration.
The development of specialized villages has played a promoting role in changing the marginalization of the rural economy [
2], improving the imbalance between urban and rural development [
3] and promoting the diversification of agricultural development [
4]. Exploring the evolutionary pattern of specialized villages and their clustered development is of great significance to guide the sustainable development of China’s rural economy. Studies on specialized villages have originated from notions of the “original industrialization” in the United Kingdom [
5,
6] and the company town in the United States [
7,
8,
9]. Later, the Oita Prefecture of Japan proposed the concept of “One Village One Product” (OVOP) [
10,
11], which was the embryonic form of Chinese studies on specialized villages. Several Asian countries have misled OVOP even though they have different names; however, in conceptual culture, it has the same concept as in Thailand, it is known as OTOP (One Tambon One Product), Taiwan uses the term “One Town One Product” while Cambodia and Japan are known as “One Village One Product” [
12,
13,
14]. As the country’s policy changes of the village, the development orientation slowly began to shift from urban development to rural areas [
15,
16]. Although Chinese studies on specialized villages started relatively late, they have developed rapidly, and new features not found in other countries have been introduced, providing fertile soil and theoretical testing grounds for academic research [
17]. The development of specialized villages in China has provided a good example for the revitalization of the world rural economy.
Although different countries have different names for this phenomenon, its essence is the same. In China, the concept of specialized villages (SVs) is also deepening with the change of practice. Now, the standard of the Ministry of Agriculture of the people’s Republic of China for specialized villages is generally agreed upon. We classified villages in China to be SVs if they meet the following requirements [
18]:
SVs had to be, first of all, villages, from an administrative point of view (the equivalent of communities).
For each SV, at least 50 percent of the entire village’s output was produced by one or just a few particular leading industries.
For each SV, a majority of farmers (generally speaking, more than 60% of the total number of farmers in the village) were employed by the leading industries or participated in the production of specialized products and corresponding business activities. These farmers who specialize in leading industries are called specialized households.
For each specialized household, revenue from the leading industries or products was the main source of household income, which should account for more than 70% of the household operating income.
The Ministry of Agriculture counted specialized villages according to this standard for the first time in 2008. The total number of SVs in China was 45,650 in 2008, which was only 7.10 percent of all administrative villages. Although the number is small, these specialized villages made a great contribution to the economy. In 2008, economic income from SVs was around US $219 billion, which was approximately 3.92 percent of China’s gross domestic product (GDP).
Over the past several years, China’s specialized villages have continued to develop from “a specific spot to the entire area”, following the development path of “specialized households—specialized villages—specialized villages agglomeration”. The phenomenon of the specialized villages agglomeration (SVA) has aroused the attention of academics, and some scholars have begun to pay more attention to this phenomenon [
19].
The research on specialized villages is first carried out around its influencing factors. Some scholars believe that geographical environmental factors are the basic conditions for the formation and development of specialized villages [
20]. For example, climate, soil, water quality, and water conservancy conditions are the main natural factors affecting the planting specialized villages. Mineral resources and traffic location factors provide convenient production conditions for industrial specialized villages. Natural landscape resources and convenient location conditions are the key elements for the development of tourism specialized villages.
The geographical environment provides a basic guarantee for the development of specialized villages, but not all villages with the same geographical environment can spontaneously form specialized villages. On the contrary, even if the adjacent villages have almost the same geographical environment, some villages have developed into specialized villages, while others have not. The difference lies in the differences in the endogenous development of different villages.
In particular, capable people with an innovative and adventurous spirit are the key to the development of specialized villages [
21]. The economic benefits brought on by the innovative behavior of capable people of a certain industry have a demonstration effect on other farmers in the village, which can quickly drive most farmers in the village to engage in a certain industry, and then form a specialized village.
Other scholars believe that the development of specialized villages cannot be separated from the role of external forces, especially local governments. Local governments play a very important role in promoting specialized villages. The government can directly play an important role in the formation and development of specialized villages in terms of specialized project selection, technical support, financial support, and other policies [
22].
The above leading factors jointly promote the formation, diffusion, and development of specialized villages under the action mechanisms of imitation innovation, division of labor and specialization, economies of scale, network connections, and so on.
The above research on specialized villages mainly focused on the development of a single specialized village. However, with the spillover effect of specialized villages, its development scale is not limited to the diffusion and evolution within the village, but gradually tends to the diffusion between villages.
How did specialized villages expand from one village to other villages? What is the connection between them? What is its evolution trend? Compared with the development of individual specialized villages, what are the competitive advantages of these specialized villages agglomeration? The in-depth thinking of the above questions will help the development of specialized villages. The phenomenon of specialized villages agglomeration has also attracted the attention of academic circles, and some scholars have begun to pay attention to this unique phenomenon. Qiao et al. [
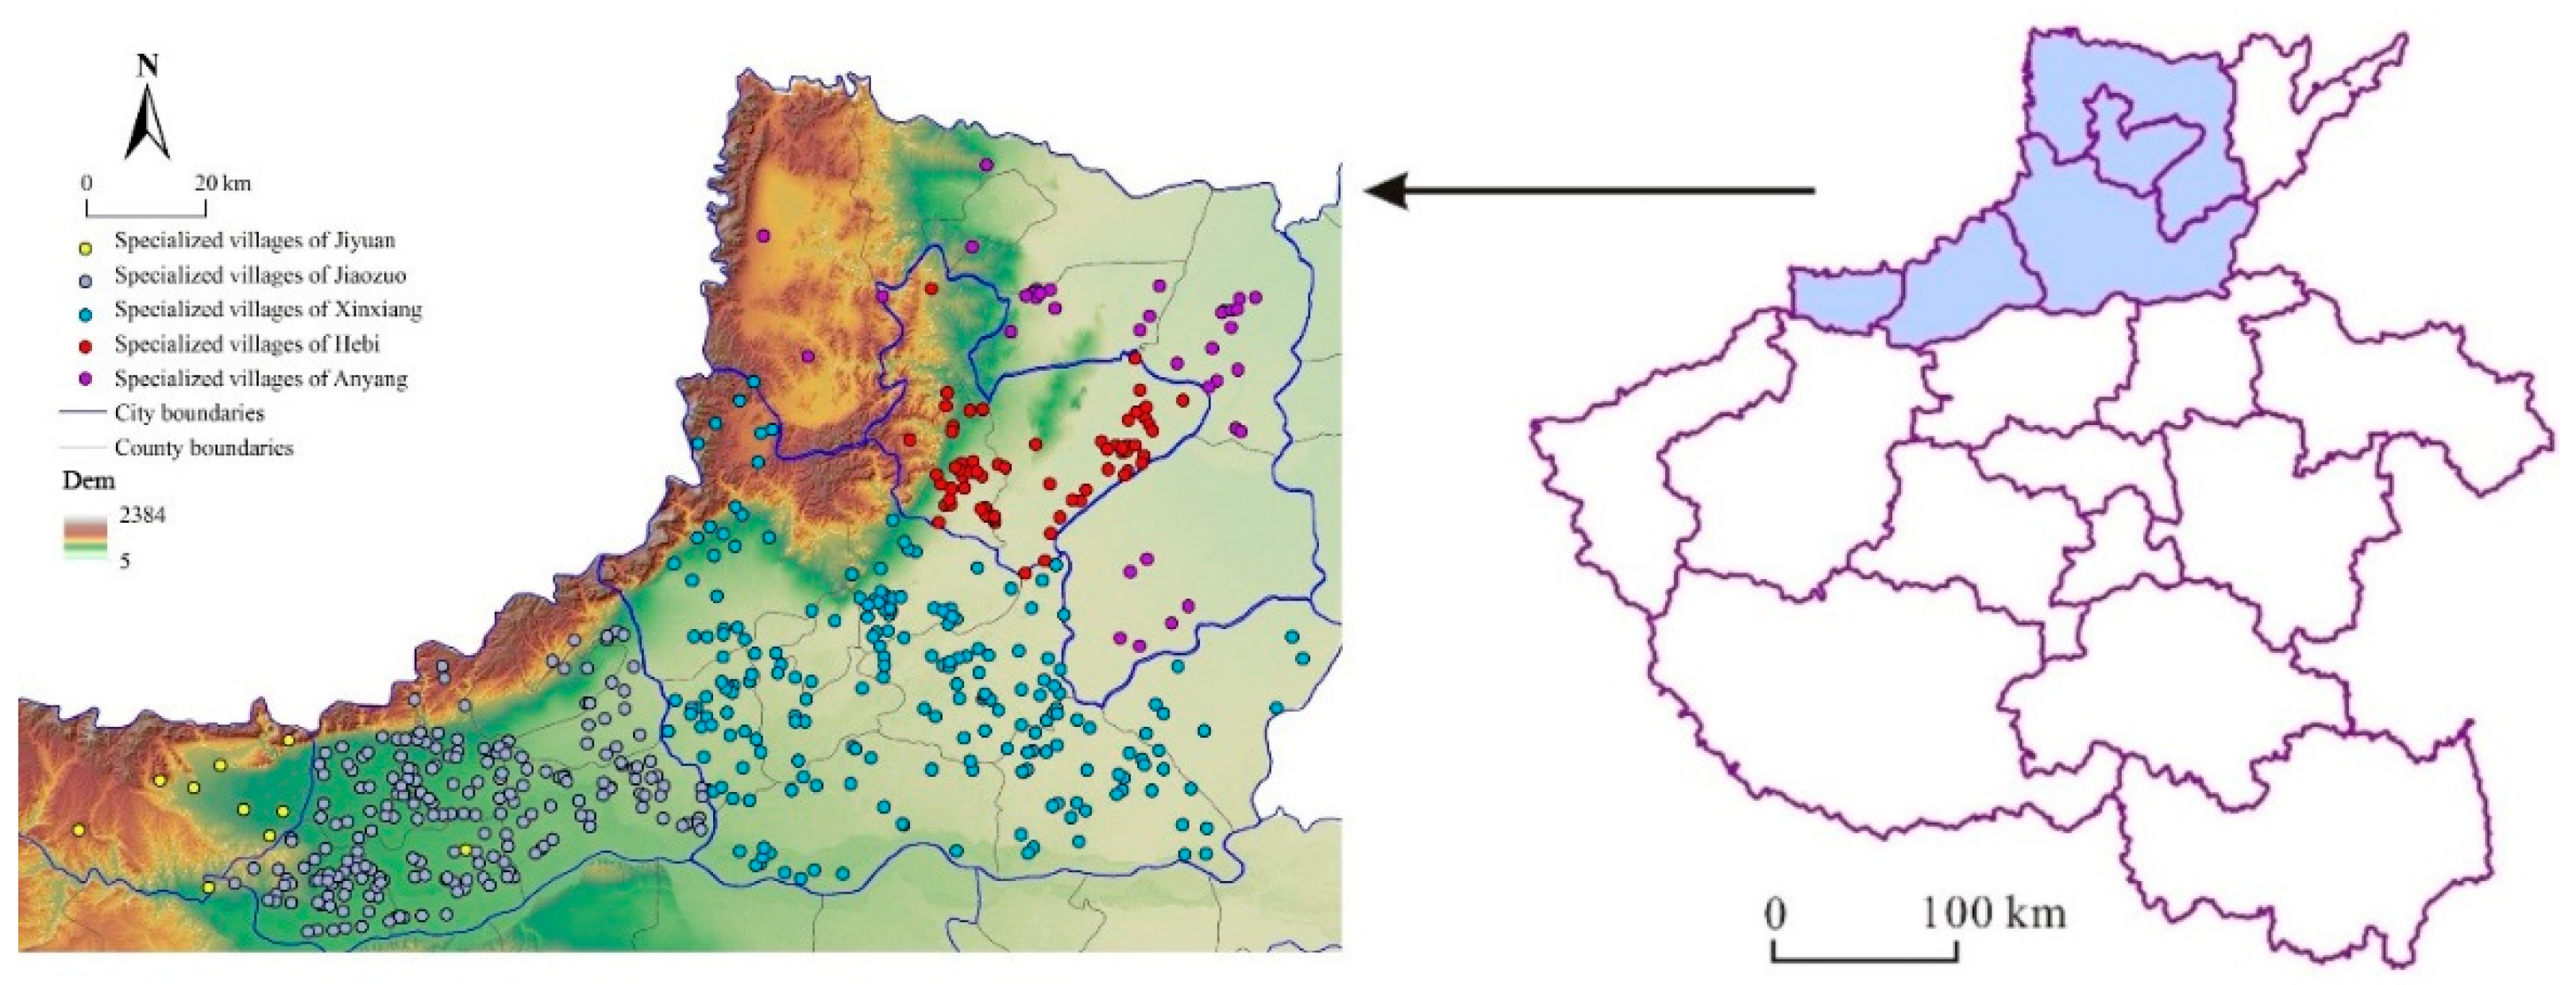
18] found through field research that specialized villages in Henan Province generally show a phenomenon of spatial agglomeration, mainly concentrated in the north of central Henan, and the degree of agglomeration is increasing. Further study of the spatial pattern of specialized villages agglomeration from different spatial scales finds that there is a scale effect.
China’s specialized villages also show an obvious trend of agglomeration in space, and the degree of agglomeration first increases and then decreases, that is, the speed of agglomeration shows phased characteristics [
23].
Of course, it is far from enough to explore the spatial pattern of specialized villages agglomeration without considering the factors and mechanisms behind this spatial pattern. The agglomeration mechanism of specialized villages is a complex systemic problem. This complex socioeconomic system includes farmers, enterprises, cooperatives, governments, and banks. Complex network relationships are based on geography, karma, and kinship among various activity subjects, the essence of which is a broad symbiotic network. By establishing a symbiotic relationship among the different activity subjects through material flow, information flow, and technology flow, a symbiotic network [
24] can be developed, thereby achieving sustainable development at a higher level [
25]. The evolution of the SVA is the result of this interaction among various flows in the symbiotic network.
As far as research methods are concerned, most of the current studies mainly have focused on spatial analysis [
26], and it has been difficult to quantify and analyze the inherent law of SVA. Expressing the operation process of the system organization by means of “flow”, system dynamics has been used widely in engineering, management, and other disciplines [
27,
28]. Whether or not the SVA effect can be brought into full play will be determined primarily by the interaction among these various “flows” in the system, and because its mechanism of action features dynamic complexity, the system dynamics method is applicable to study this problem.
In general, current studies on specialized villages and SVA focus mostly on single specialized villages rather than the agglomeration of specialized villages. Most of these studies on SVA highlight the characterization of spatial patterns but ignore exploring the evolution of agglomeration mechanism. A few studies on the agglomeration mechanism of specialized villages are based mainly on single-factor analysis, without systematically probing into the mechanism of multifactor interaction. In light of this, in this study, we regarded SVA as a symbiotic system and simulated the evolutionary process and mechanism of SVA from the perspective of system dynamics. We conducted prediction and policy simulation to provide reasonable guidance for the sustainable development of specialized villages.
3. Results
3.1. Causal Diagram of Factor Flow
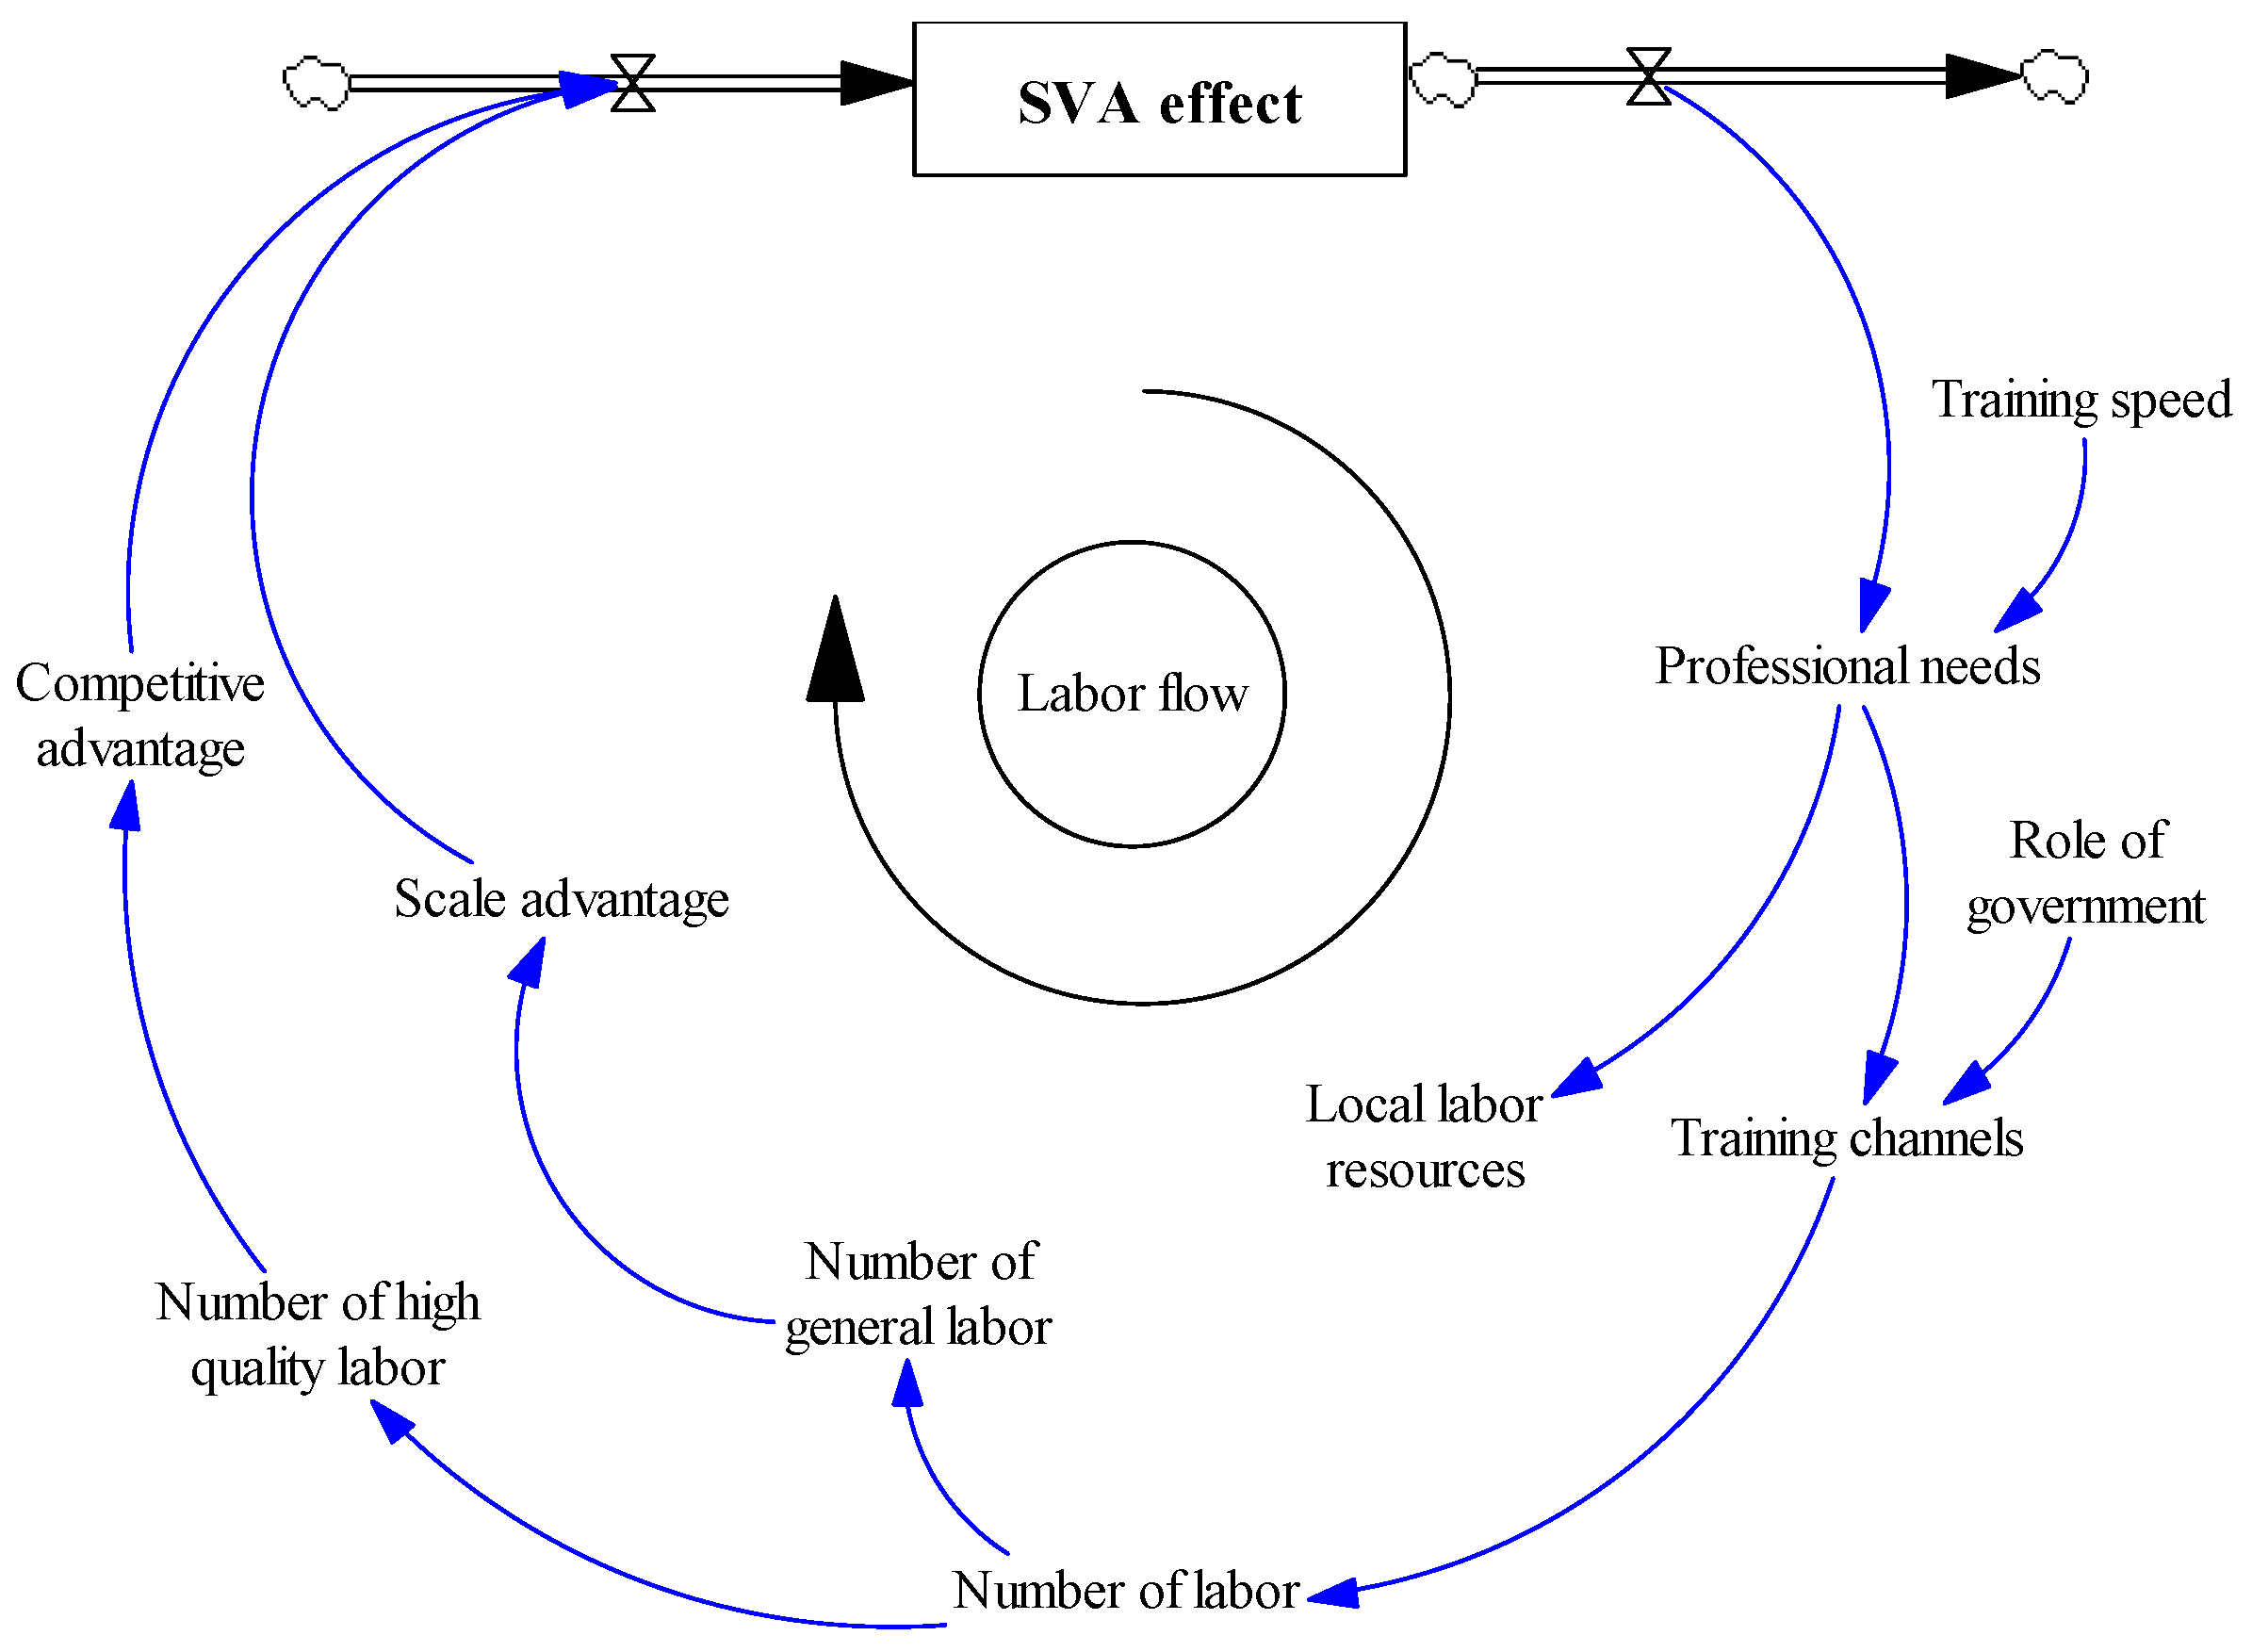
The causal diagram of factor flow, also known as the causal loop diagram (CLD), is an important tool for describing the feedback structure of a system. In the CLDs (
Figure 2,
Figure 3 and
Figure 4), the positive feedback is represented by a clockwise loop identifier, and the negative feedback is denoted by a counterclockwise loop identifier accordingly.
- (1)
Labor flow. Labor flow provides a basic guarantee for the development of specialized villages. The demand for professionals is limited by local labor resources. With the development of specialized projects, the demand for professionals is growing increasingly stronger, and a small number of labors may be flowing in, but most professionals need to be trained based on existing human resources. The amount of training needs will affect the training channels, and the government creates a favorable environment through direct or indirect promotion of technologies. Training directly affects the number and quality of labors. The number of ordinary professionals required by SVA highlights the scale advantage, and the strength in high-quality professionals can make specialized villages more competitive. The combined effect of scale advantage and competitive edge strengthens the agglomeration effect of specialized villages.
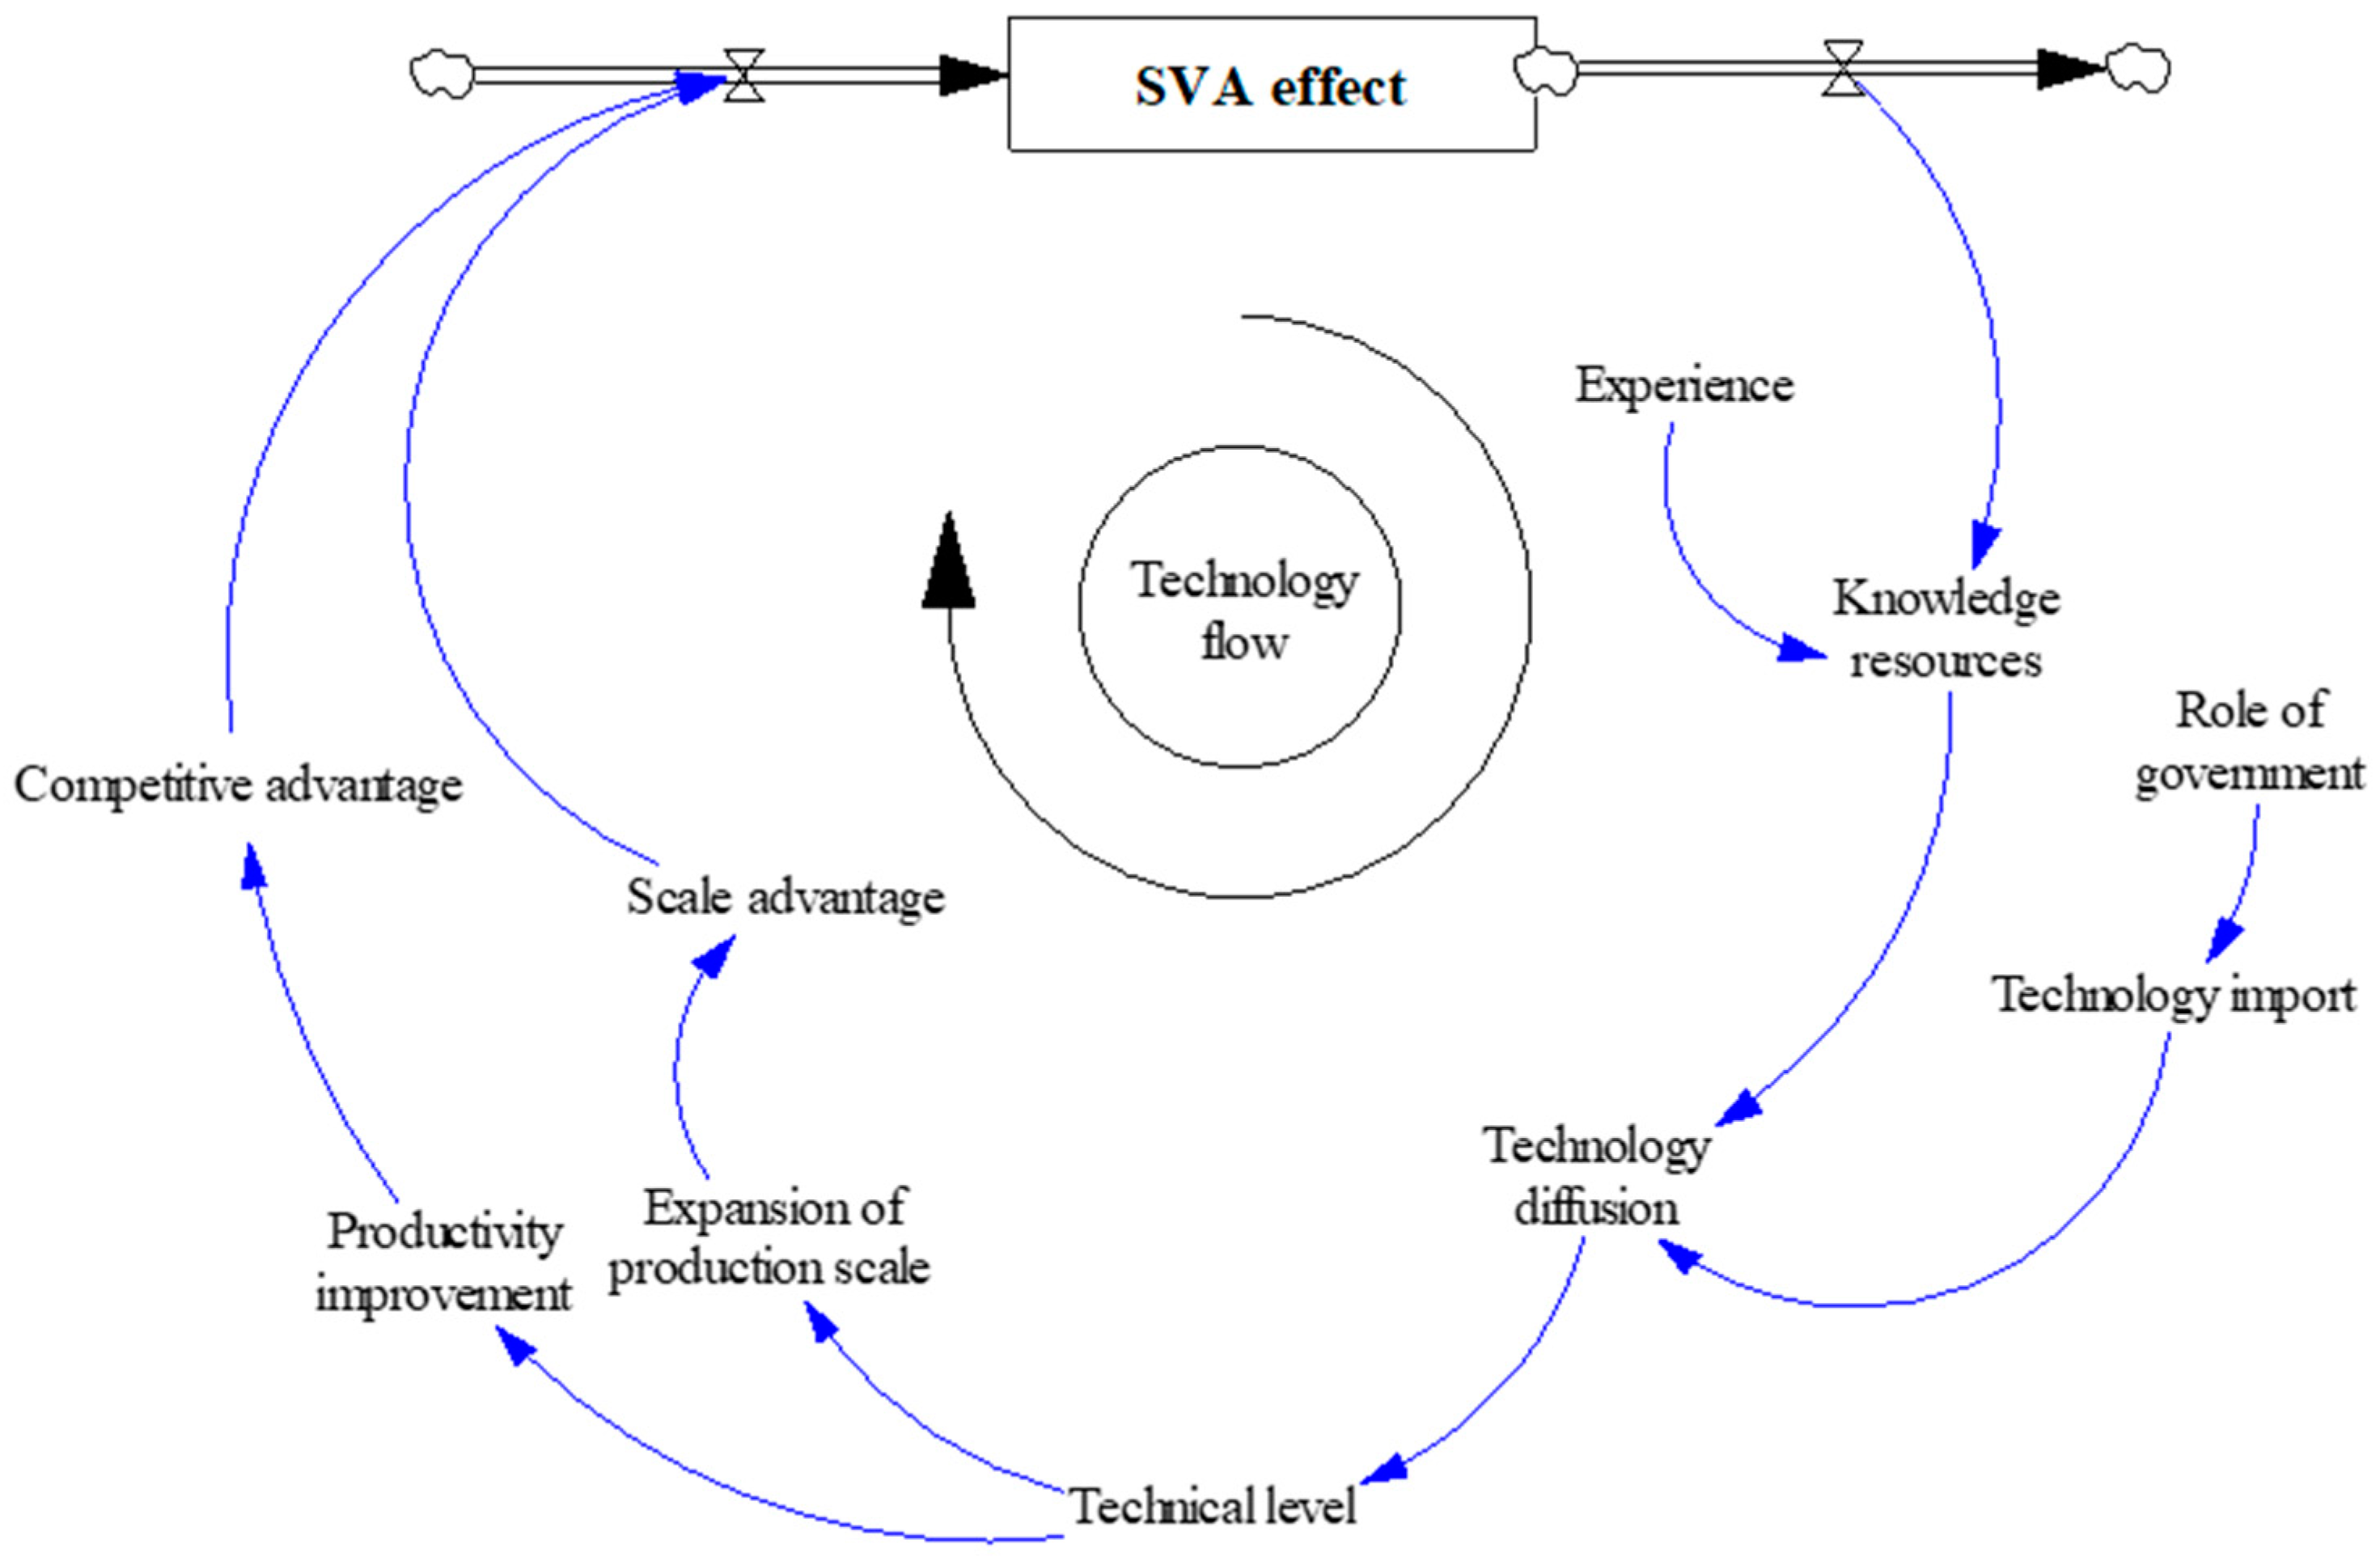
- (2)
Technology flow. Technology flow is a key factor for SVA. With the diffusion of these technological resources, the technological advantages of diffused sources gradually have disappeared. The pressure of market competition and the need for industrial upgrading have led specialized villages to seek external technologies. The intensity and degree of technology introduction cannot be separated from the role played by the government whose attitude, policies, and support for technology determine the feasibility of technology introduction. The diffusion of local technologies and the introduction of exogenous technologies jointly determine the local technological level. The improvement of the technological level expands the scale and improves the production efficiency of specialized projects, which will further achieve scale and competitive advantages and also improve the agglomeration effect of specialized villages.
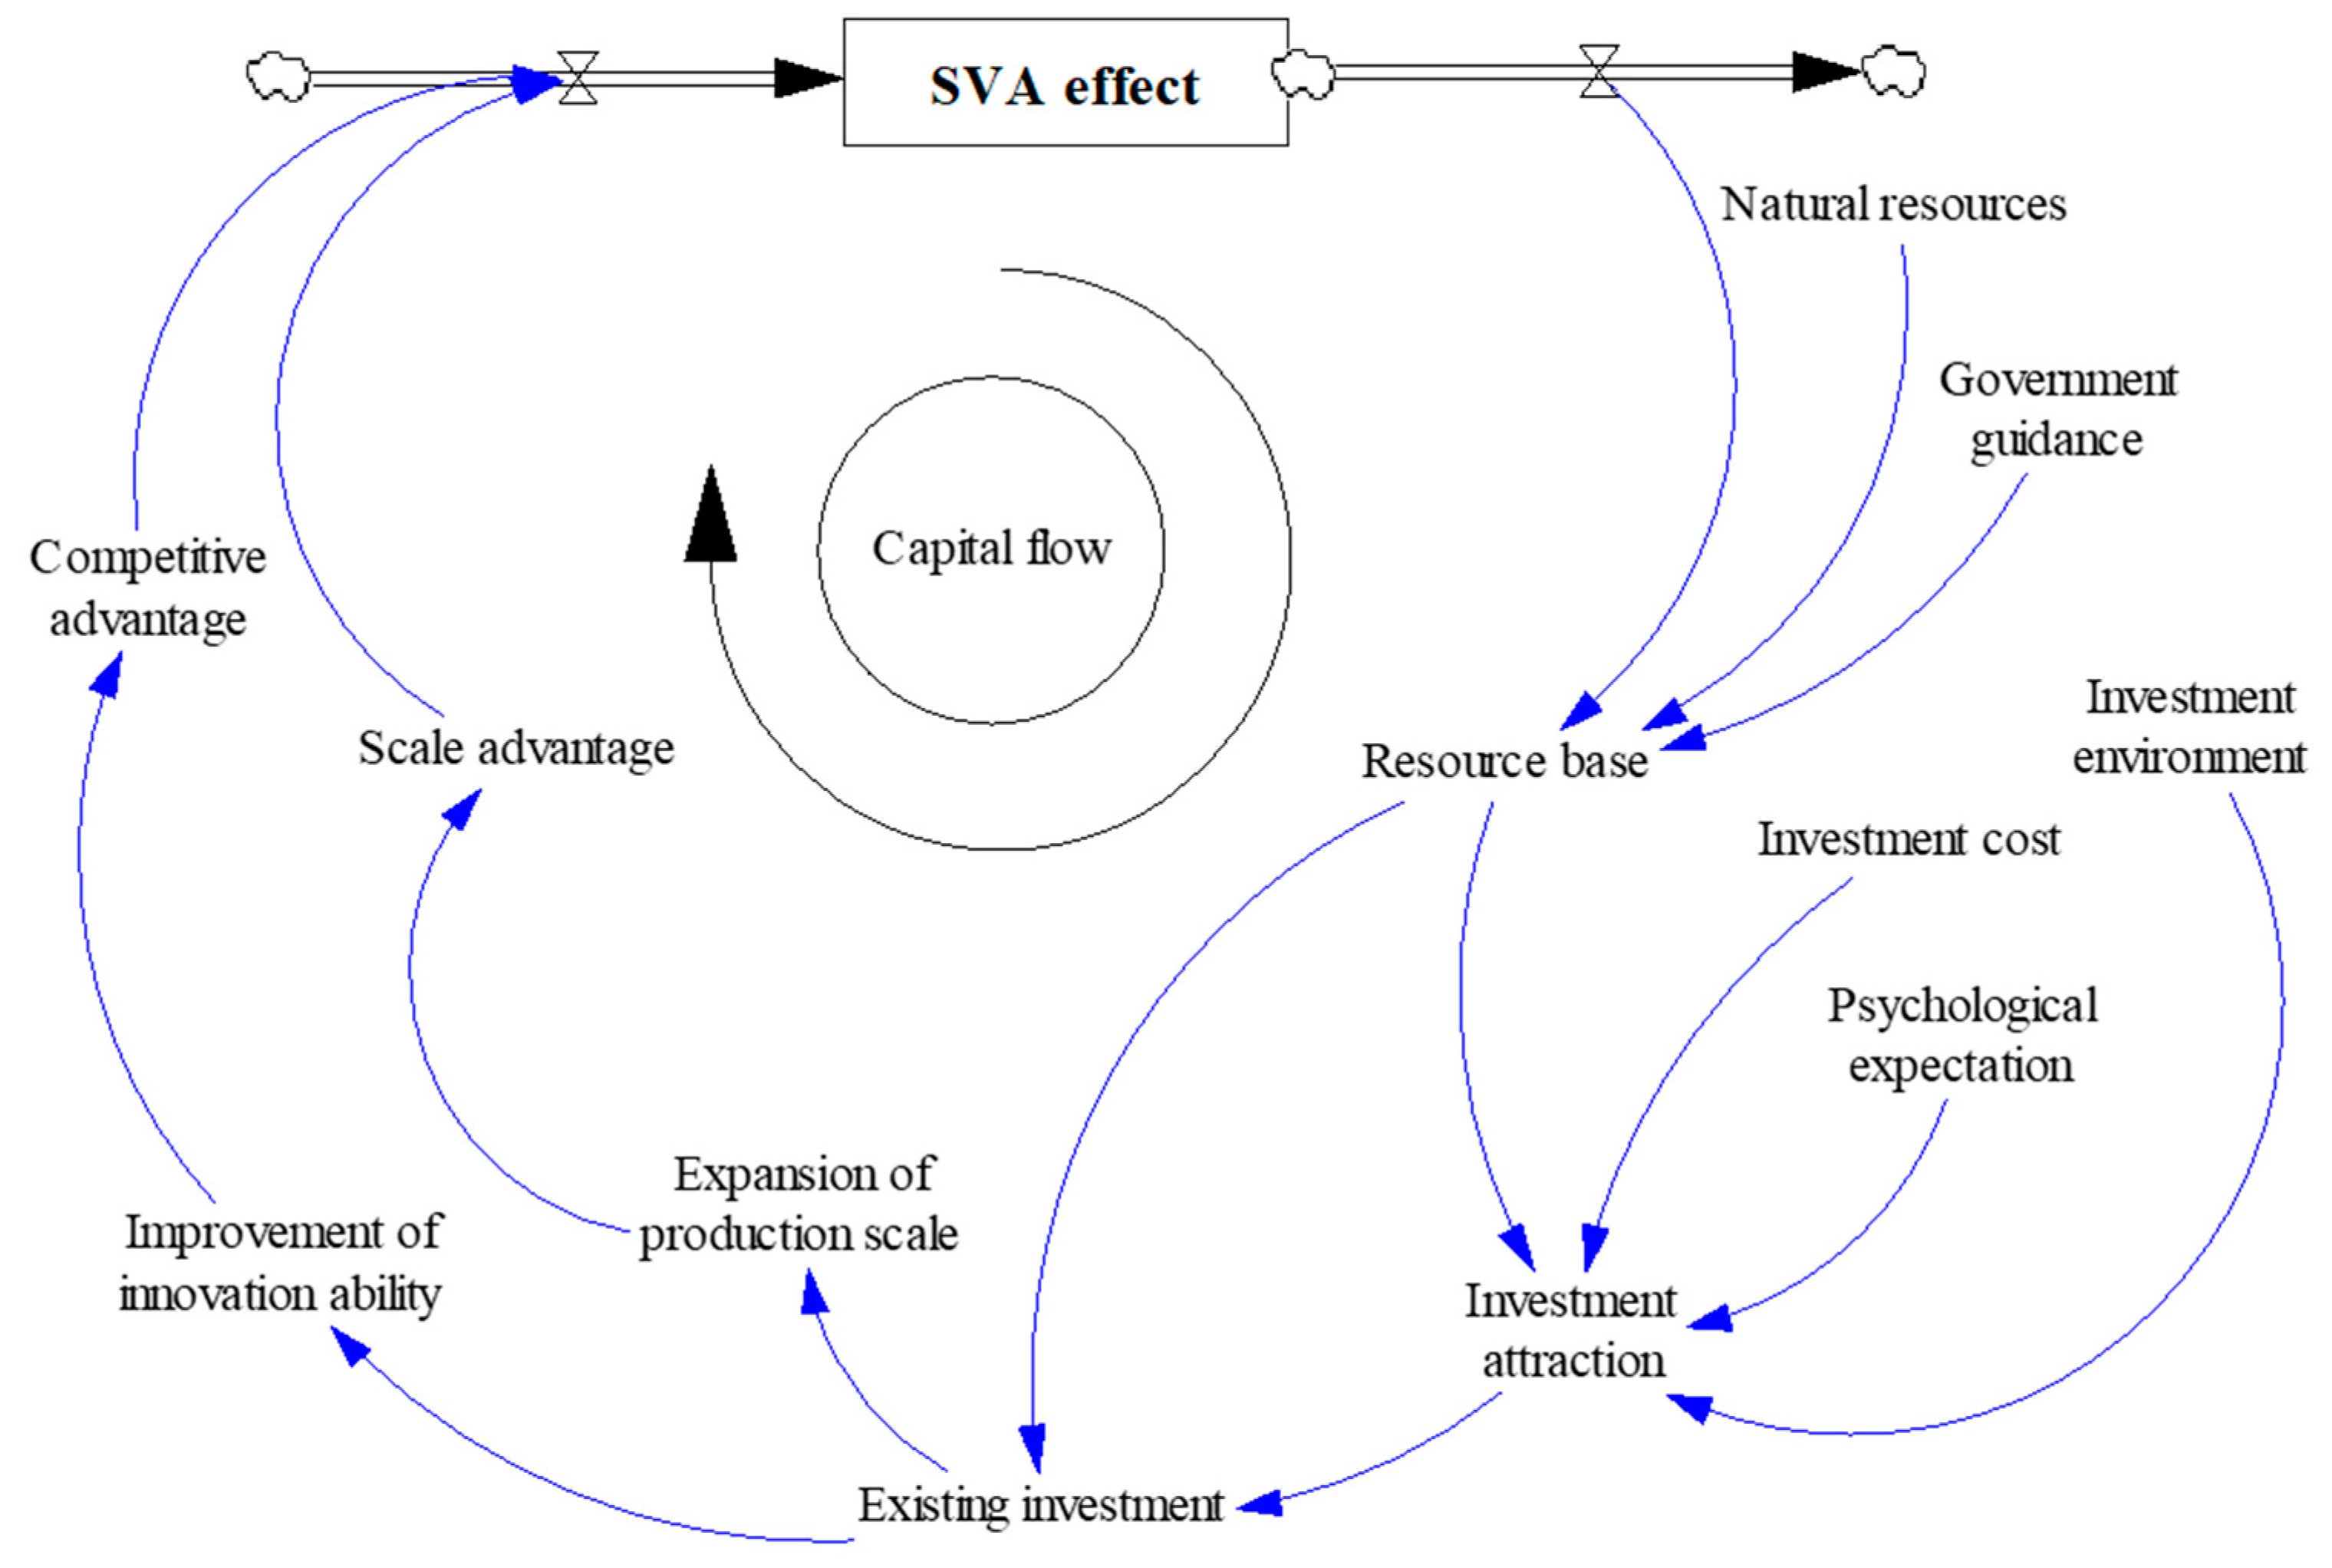
- (3)
Capital flow. Capital flow is fundamental to the formation of specialized villages. The role of the resource base for specialized projects is influenced by government guidance and the abundance of natural resources, and this resource base also affects the attractiveness of local investment, including both local and foreign capital investment. In addition to the resource base, the investment environment is another factor affecting the attractiveness of local investment. The expansion of current investments can expand the production scale to enhance the scale advantage, and it can also provide local specialized projects with funds to enhance innovation capabilities, thereby increasing the competitive edge.
3.2. System Dynamics Flow Diagram
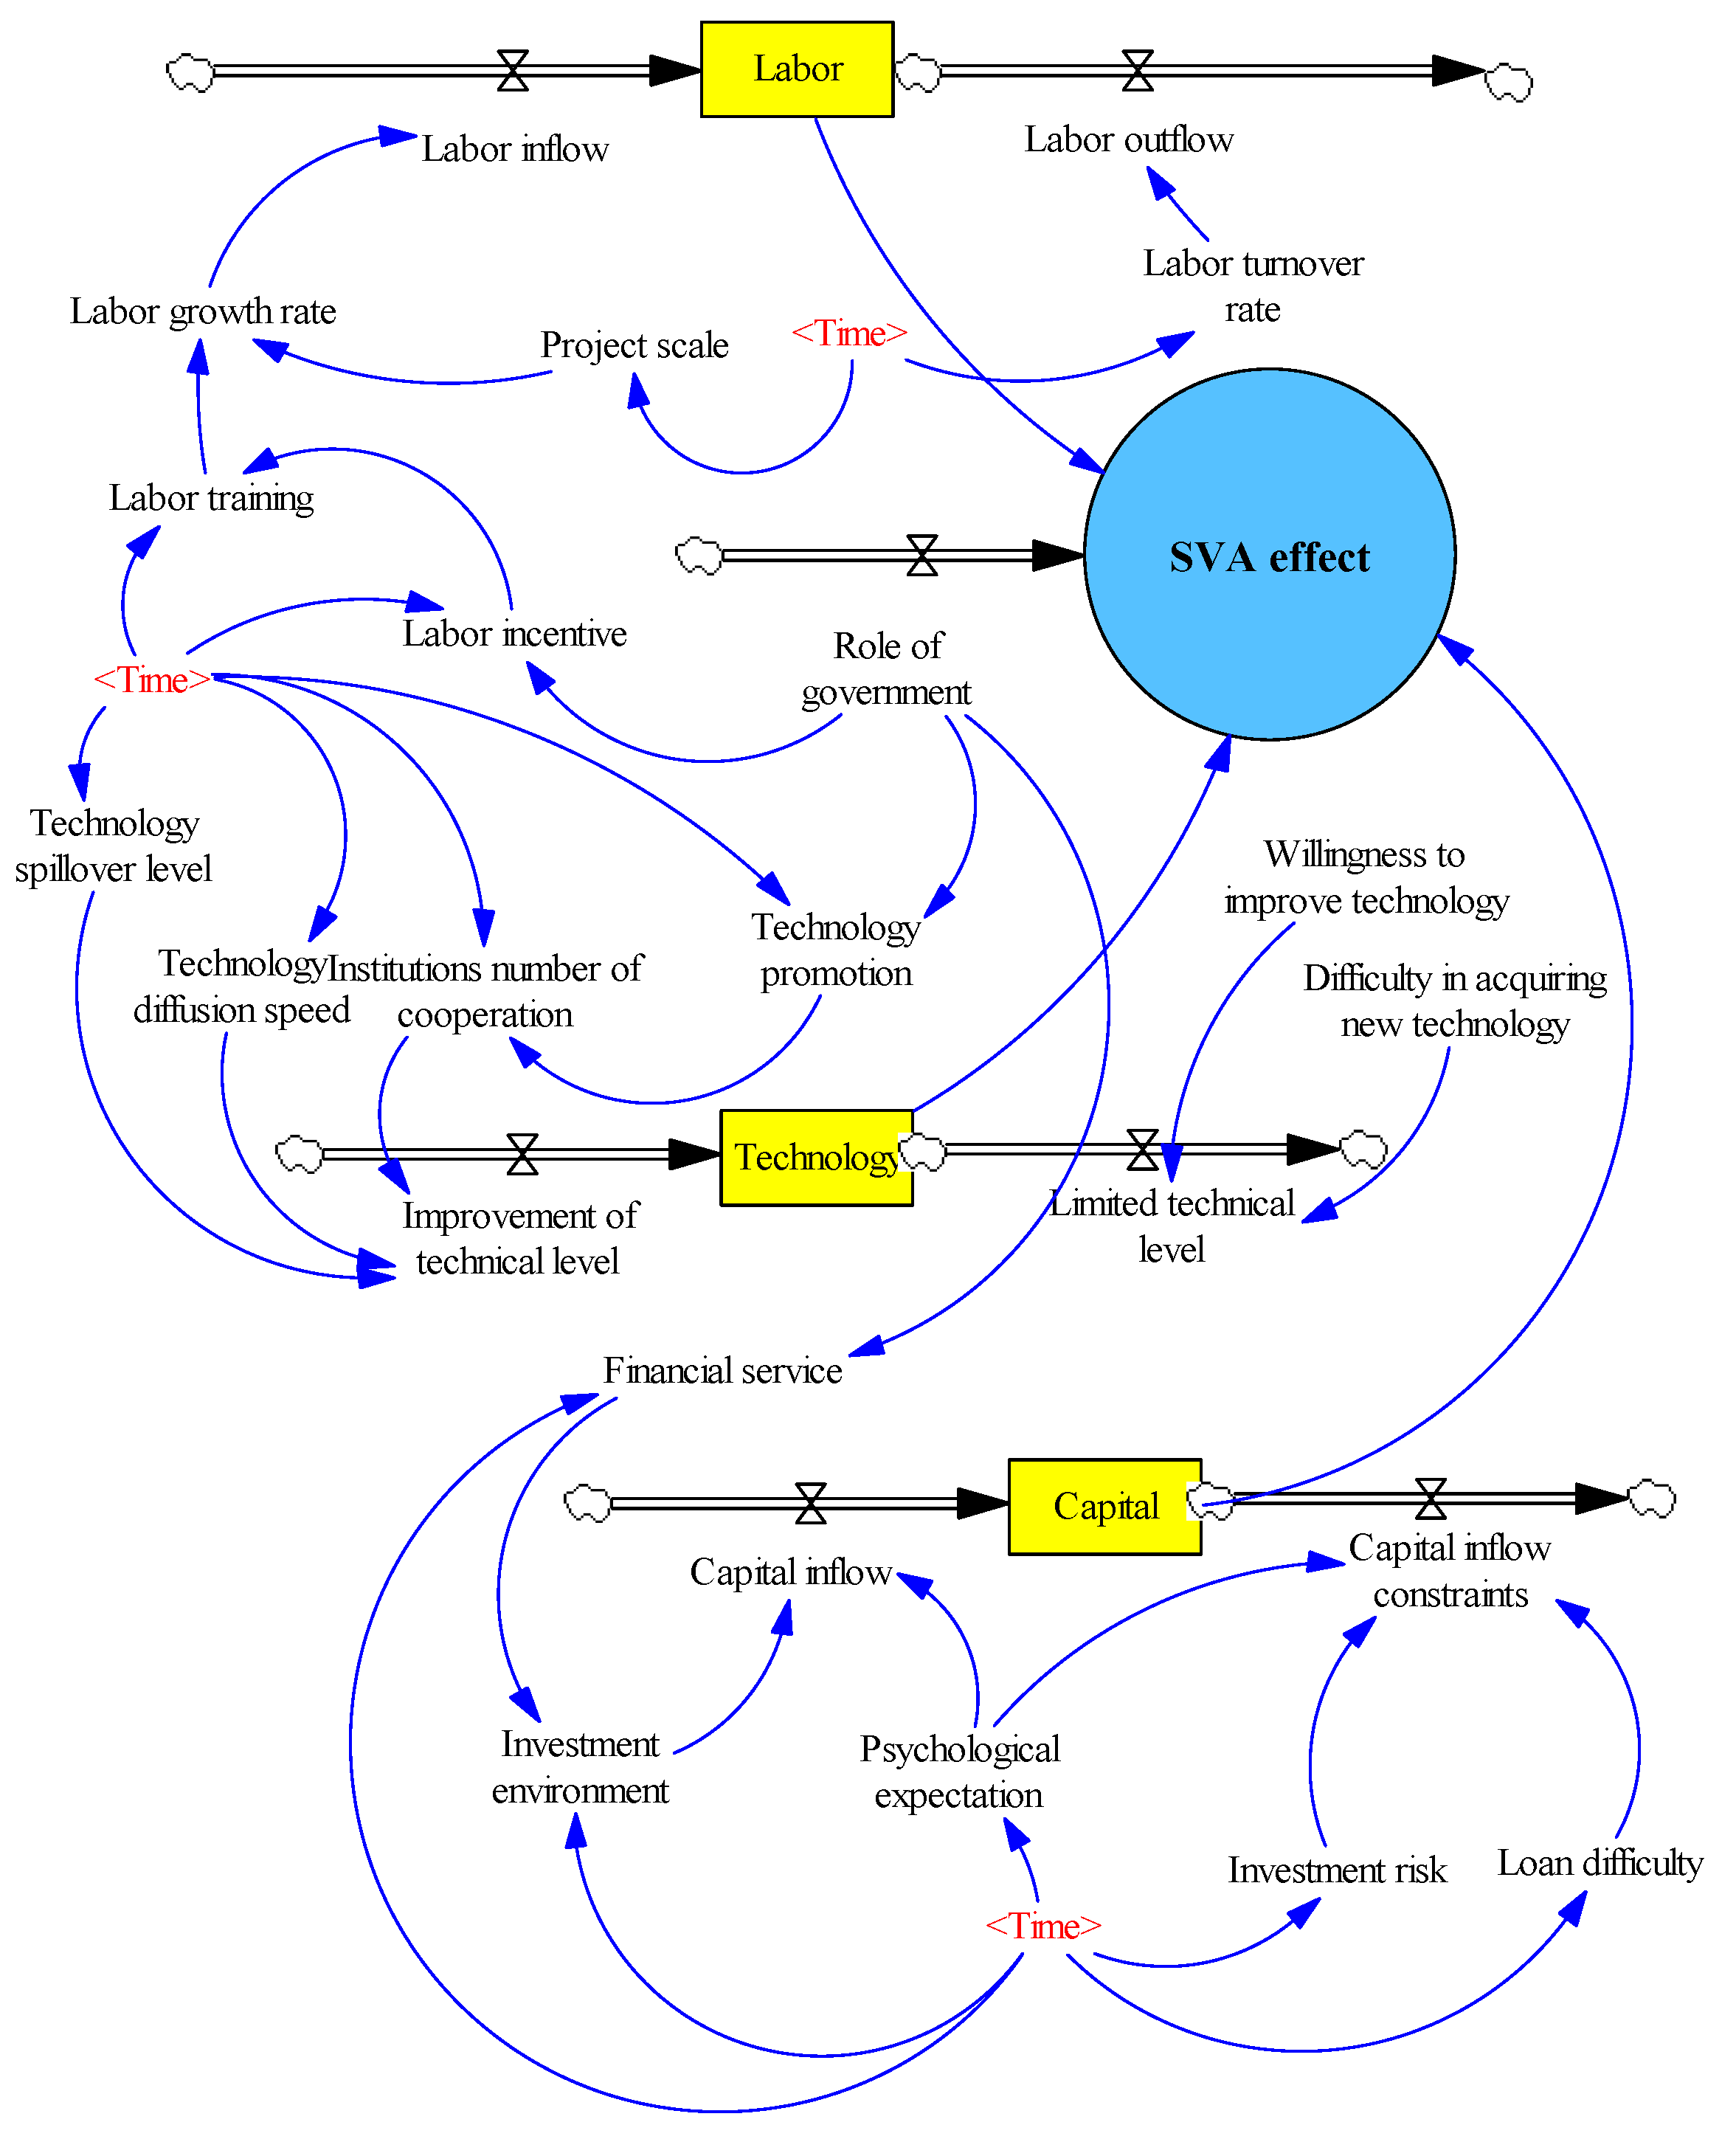
The CLD only qualitatively outlined the action mechanism of various factors in the SVA system during the agglomeration evolution, so further quantitative analysis was required. On the basis of the actual economic meaning of variables such as stock, flow, auxiliary variables, and hidden variables, the system dynamics flow diagram quantified the main variables in the CLD through the relationship diagram and equation model in the entire agglomeration system. As shown in
Figure 5, in the SVA system, labor, technology, and capital were the primary factors that directly affected the agglomeration effect. Hence, with labor, technology, and capital as the state variables (stock), the agglomeration effect was represented by the internal structures of the three variables and the correlation among the three. We further refined the relationship in the CLD. The change of the state variables in each module was affected by the two major flows: inflow and outflow. The other variables affected the flow as control variables and thereby had an impact on the state variables. Because the SVA system was dynamically evolved, most variables would change with time. Therefore, we set time as a hidden variable to characterize the change of variables in each module over time.
In the labor submodule, labor inflow and outflow jointly determined the state variables regarding labor. Labor inflow was affected by the labor growth rate, which was determined jointly by the need for the scale development of specialized projects and the training of labors. Labor outflow was affected primarily by the rate of labor increase (RLI). During this process, government influence as an exogenous variable played a certain role in the inflow and outflow of labors. All of the noted control variables were time-based dynamic variables.
In the technology submodule, rate of technology increase and rate of technology decrease were the rate variables that determined the state variables related to technologies. The level of technology spillover and the rate of technology diffusion directly affected the promotion of the technological level, and the cooperation of scientific research institutions also could increase the technological level. In the cooperation of scientific research institutions, the government also played a role of guidance and coordination. Conversely, the willingness of economic entities to upgrade technology was a limiting factor for technological upgrades. For farmers who were relatively conservative, their willingness to actively pursue technological upgrading usually was weak, which thereby hindered the ability to update the technological level.
In the capital submodule, capital inflow and capital inflow constraint were the two rate variables of capital, the state variable. The investment environment and mental anticipation were the two main factors affecting capital inflow, whereas investment risk and difficulty in applying for a loan were the principal factors restricting capital inflow. Likewise, the aforementioned control variables also were time-based dynamic variables.
3.3. Establishment of the System Dynamics Model
3.3.1. Functional Model of SVA
The system dynamics flow diagram of SVA intuitively reflects the structural relationship of various elements in the system, but the quantitative model of the internal quantitative relationship should be constructed by equations. According to the system structure shown in
Figure 5, the agglomeration effect of specialized villages was affected by three factors: labor, technology, and capital. We characterized the evolution of SVA according to a spiral development model jointly influenced by multiple variables. Based on Solow’s aggregate production function [
34], we measured the agglomeration effect of specialized villages by changes in the total output of regional specialized projects on the basis of incorporating the agglomeration conversion factor:
where
Q is the agglomeration effect of specialized villages;
μ is the agglomeration conversion factor;
A(
t) is the technical level at time
t;
K is the capital input;
L is the labor resource input;
α is the elasticity of capital output, that is, with the other factors remaining unchanged, for every 1% increase in capital, there will be an increase of
α in output; similarly,
β refers to the elasticity of labor output, which means that with the other factors remaining unchanged, for every 1% increase in capital, there will be an increase of
β in output.
On the basis of constructing a general model framework, we constructed three submodels (labor, technology, and capital) according to the structural relationship between the CLD and the system dynamics flow diagram.
3.3.2. Functional Model of Labor Module
For the labor submodule, the inventory of labors at time
t is based on the labor inventory
Lt−1 of the previous period (
t − 1) and is subject to the rate of labor increase (
RLI) and the rate of labor decrease (
RLD). Therefore, the state stock of labors was expressed as follows:
Labor flow was affected by the demand and supply of labor, and labor demand was affected mainly by specialization scale (
SS) and labor training (
LT). The factors that contributed to a decrease in the number of labors may have been affected by wage satisfaction (
WS). If the laborers were not quite satisfied with their current wages, they may have chosen to no longer engage in production activities of the specialized project. In addition, both the
RLI and
RLD were affected by government policy (
GP), and the control variables were dynamic variables that changed with time, so we had to add a hidden variable (time) to the model. The function model of
RLI and
RLD was represented by the iterative function
Dt, as follows:
3.3.3. Function Model of Technology Module
Affected by rate of technology increase (
RTI) and rate of technology decrease (
RTD), technology flow was expressed as follows:
RTI was affected mainly by technology spillover (
TS) and technology diffusion (
TD). In addition, the number of the cooperative research institution (
RI) also contributed to RTI, and
GP, as an exogenous variable, had an impact on the overall environment of the technological level. The willingness of economic entities to improve technology (hereinafter referred to as technology willingness,
TW), was a limiting factor for technological upgrading. Moreover, the difficulty to obtain new technologies (hereinafter referred to as obtain difficulty,
OD), is another limiting factor for technological upgrading. The control variables were dynamic variables that changed with time, so we added a hidden variable (time) to the model. The function expression is as follows:
3.3.4. Function Model of Capital Module
The two rate variables affecting capital flow are rate of capital increase (
RCI) and rate of capital decrease (
RCD) whose functions are expressed as follows:
Investment environment (
IE) and mental anticipation (
MA) were the two main factors that affected capital inflows, whereas investment risk (
IR) and difficulty of loan (
DL) were the primary factors restricting capital inflows. As an exogenous variable, GP influenced the overall environment of the technological level. Similarly, because all the noted control variables were time-based dynamic variables, we added a hidden variable (time) to the model. The function expression is as follows:
3.4. Parameters and Initial Conditions of the Models
We established the SVA effect functional model based on Solow’s production functional model, but some differences between the SVA and general industrial production activities persisted. In Solow’s model, one of the assumptions was that technological progress was Hicks-neutral, that is, the technical coefficient (capital-labor ratio) remained constant. In addition, returns to scale should be constant, that is,
α +
β = 1. For SVA, however, the previous theoretical analysis showed that technological progress was a cumulative quantity that changed with time, so technological progress was expressed as a function of time. In addition, because of the existence of the agglomeration effect, returns to scale were not stable and there was an increasing trend, so
α +
β > 1. On the basis of previous research results [
35,
36], we set the parameters in the model as follows:
μ = 1,
α = 0.6,
β = 0.7
In addition to the three parameters that should be assigned values, the initial states of the state variables (i.e., labor, technology, and capital) also should be set according to the actual situation. The initial state was the basis for variable iteration during system simulation. In reality, these three variables had different dimensions. As a result, the dimensional consistency test might fail in the system model test. Therefore, in system dynamics, these variables should be characterized by relative values.
In terms of horizontal variables, the dimensional differences among labor, technology, and capital increased the calculational complexity, so the variables output by the final model were represented by relative values. In this study, the initial value of technology A0 was set as 1, K0 was 100, and L0 was 100. A larger value meant a higher technological level, more laborers, or more abundant capital. Because the rate variables (e.g., RLI, RLD, RTI, RTD, RCI, and RCD) were all rates, we set the value range as [0, 1]. Some auxiliary variables were difficult to quantify directly with absolute values—for example, GP, IE, and IR, were all measured by the interval number method with degree values, and the corresponding range also was set to be [0, 1].
3.5. Model Verification
Before model simulation, the model should be tested first [
37]. We performed boundary suitability test, dimensional consistency test, structural evaluation test, and sensitivity test on the model. With their own emphasis, these four methods could comprehensively verify the validity and reliability of the model.
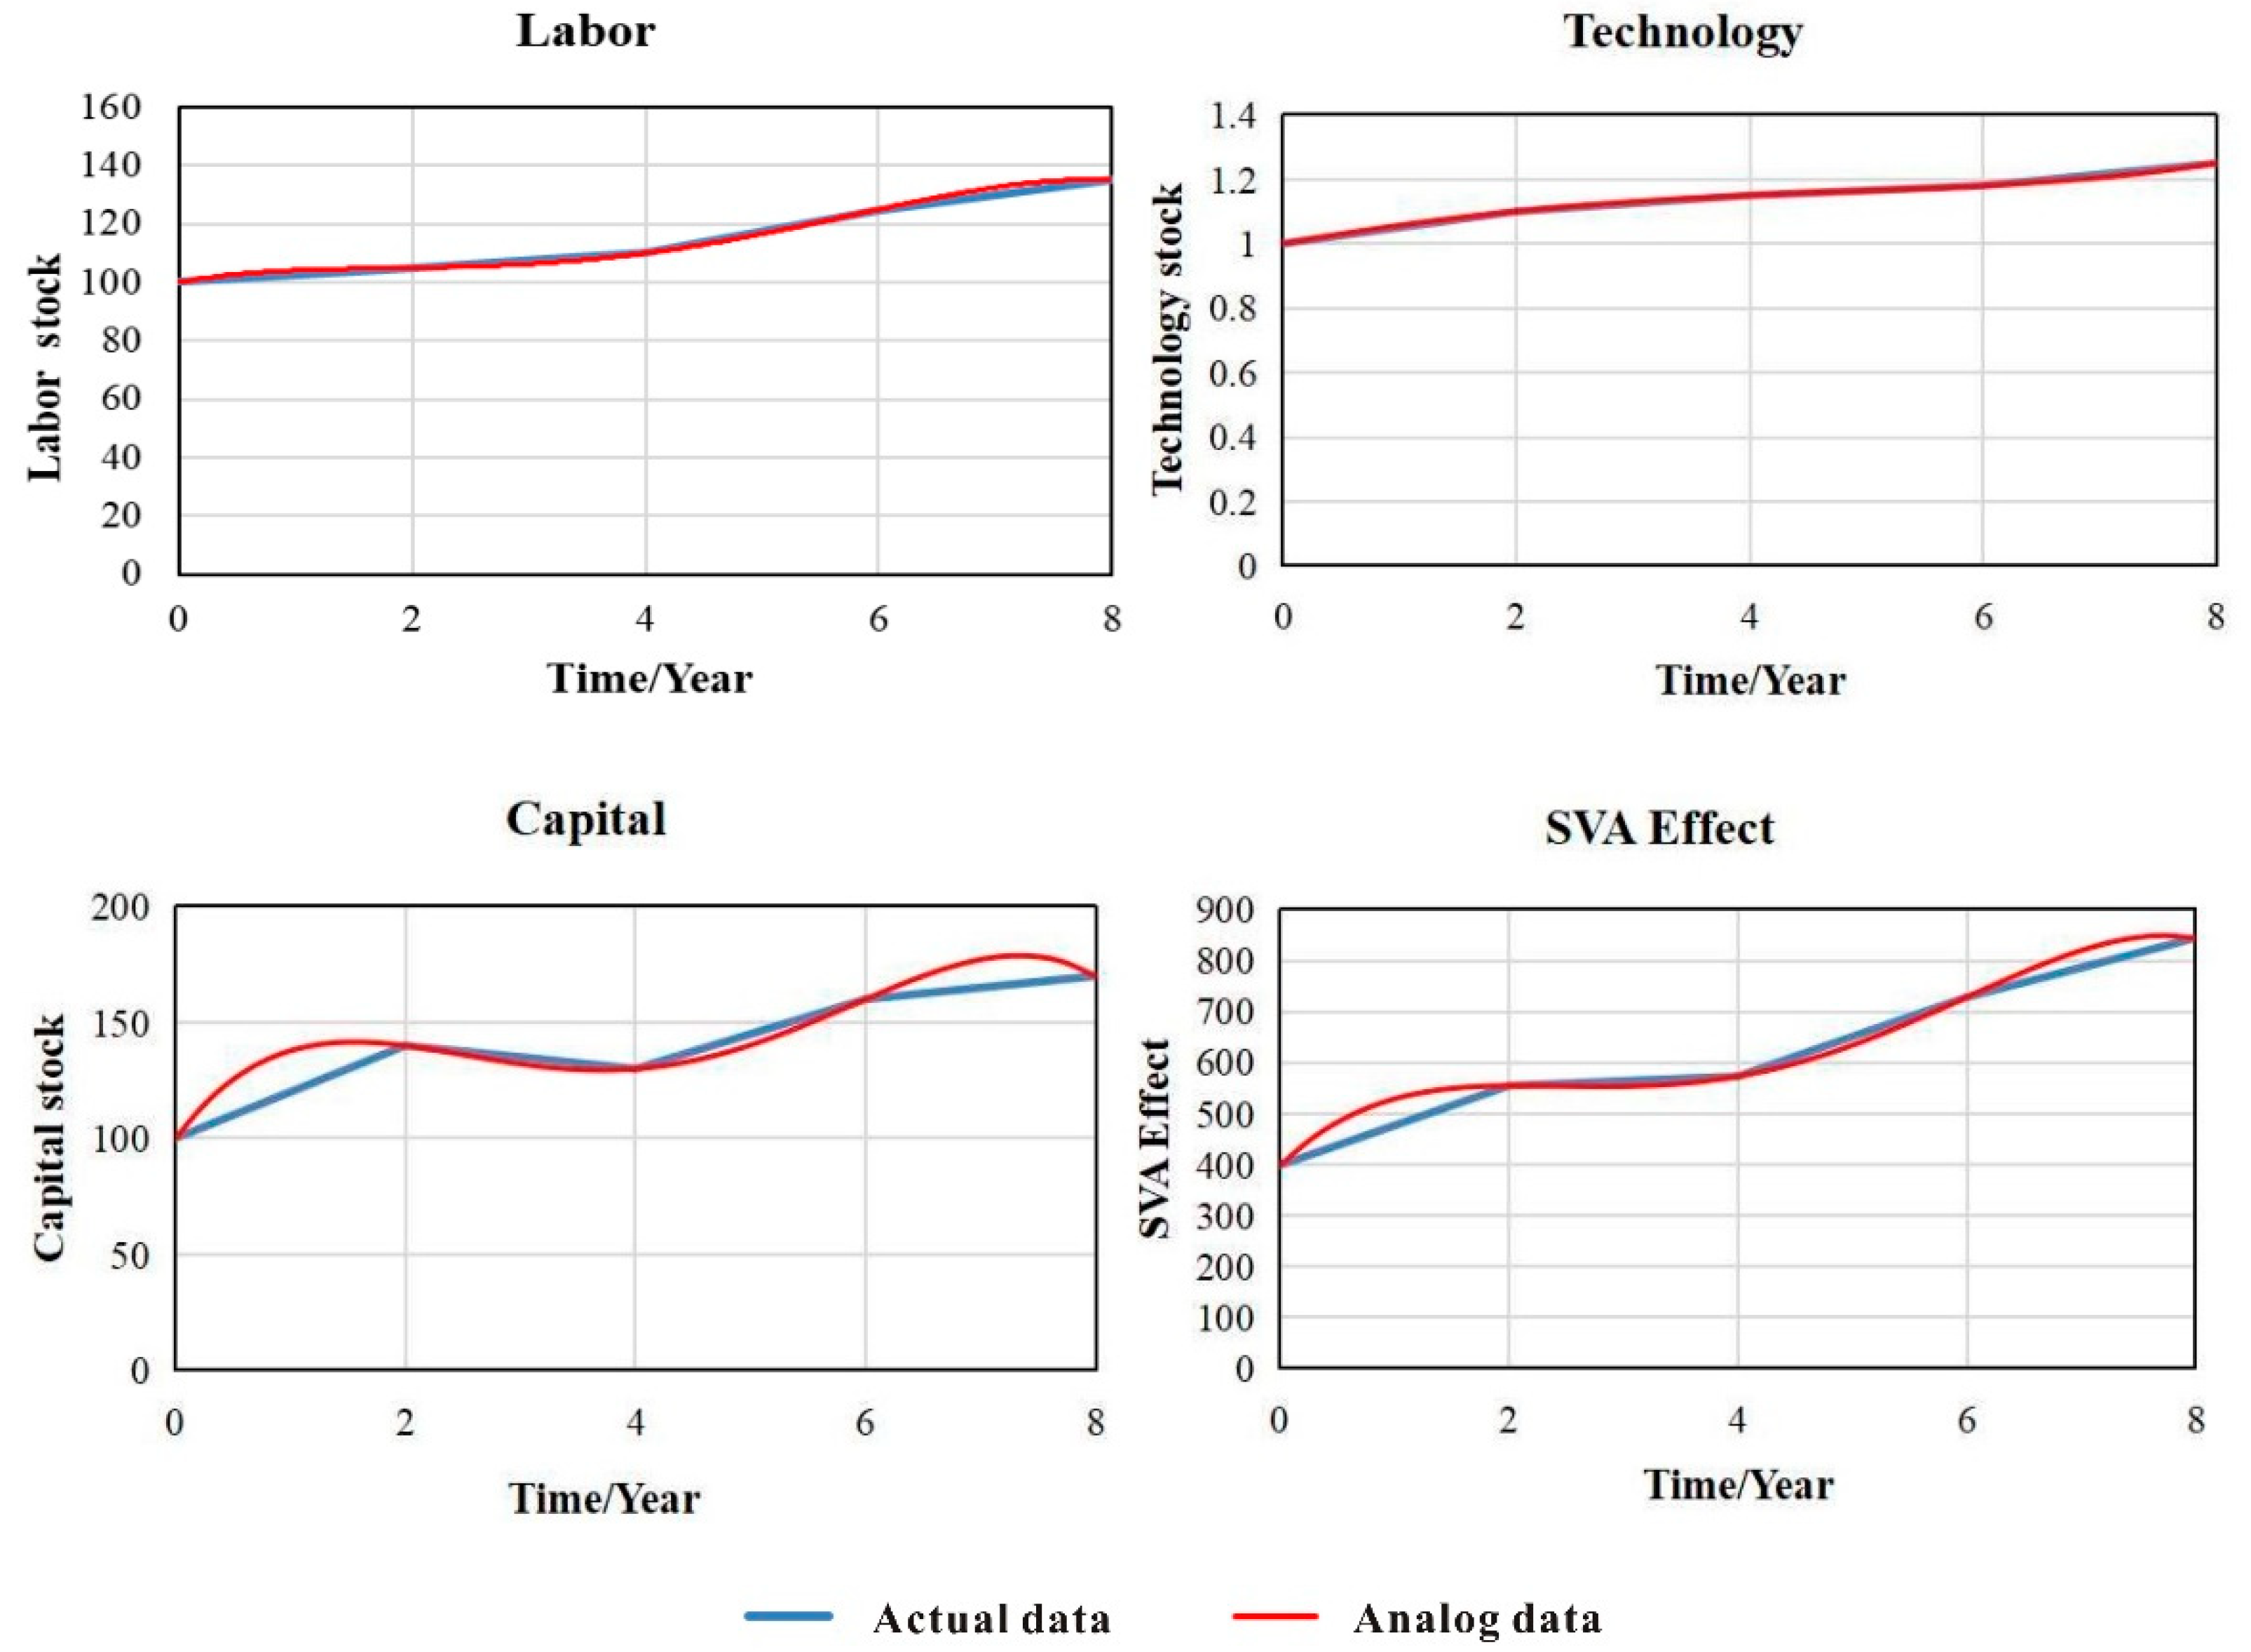
First, we conducted the boundary suitability test and dimensional consistency test on the model. On the basis of passing these two tests, we performed a structural evaluation test on the model. The actual data used in this study were from 2009 to 2016. We systematically simulated the data for these eight years, the results of which are shown in
Figure 6. The test results showed that the simulation curve of the evolution of SVA was in good agreement with the actual data and basically reflected the trend of historical data. The simulation curves of labor, technology, and capital in the
CLD remained basically consistent with relevant curves of the actual data. Thus, the results of these historical tests proved this model to be valid.
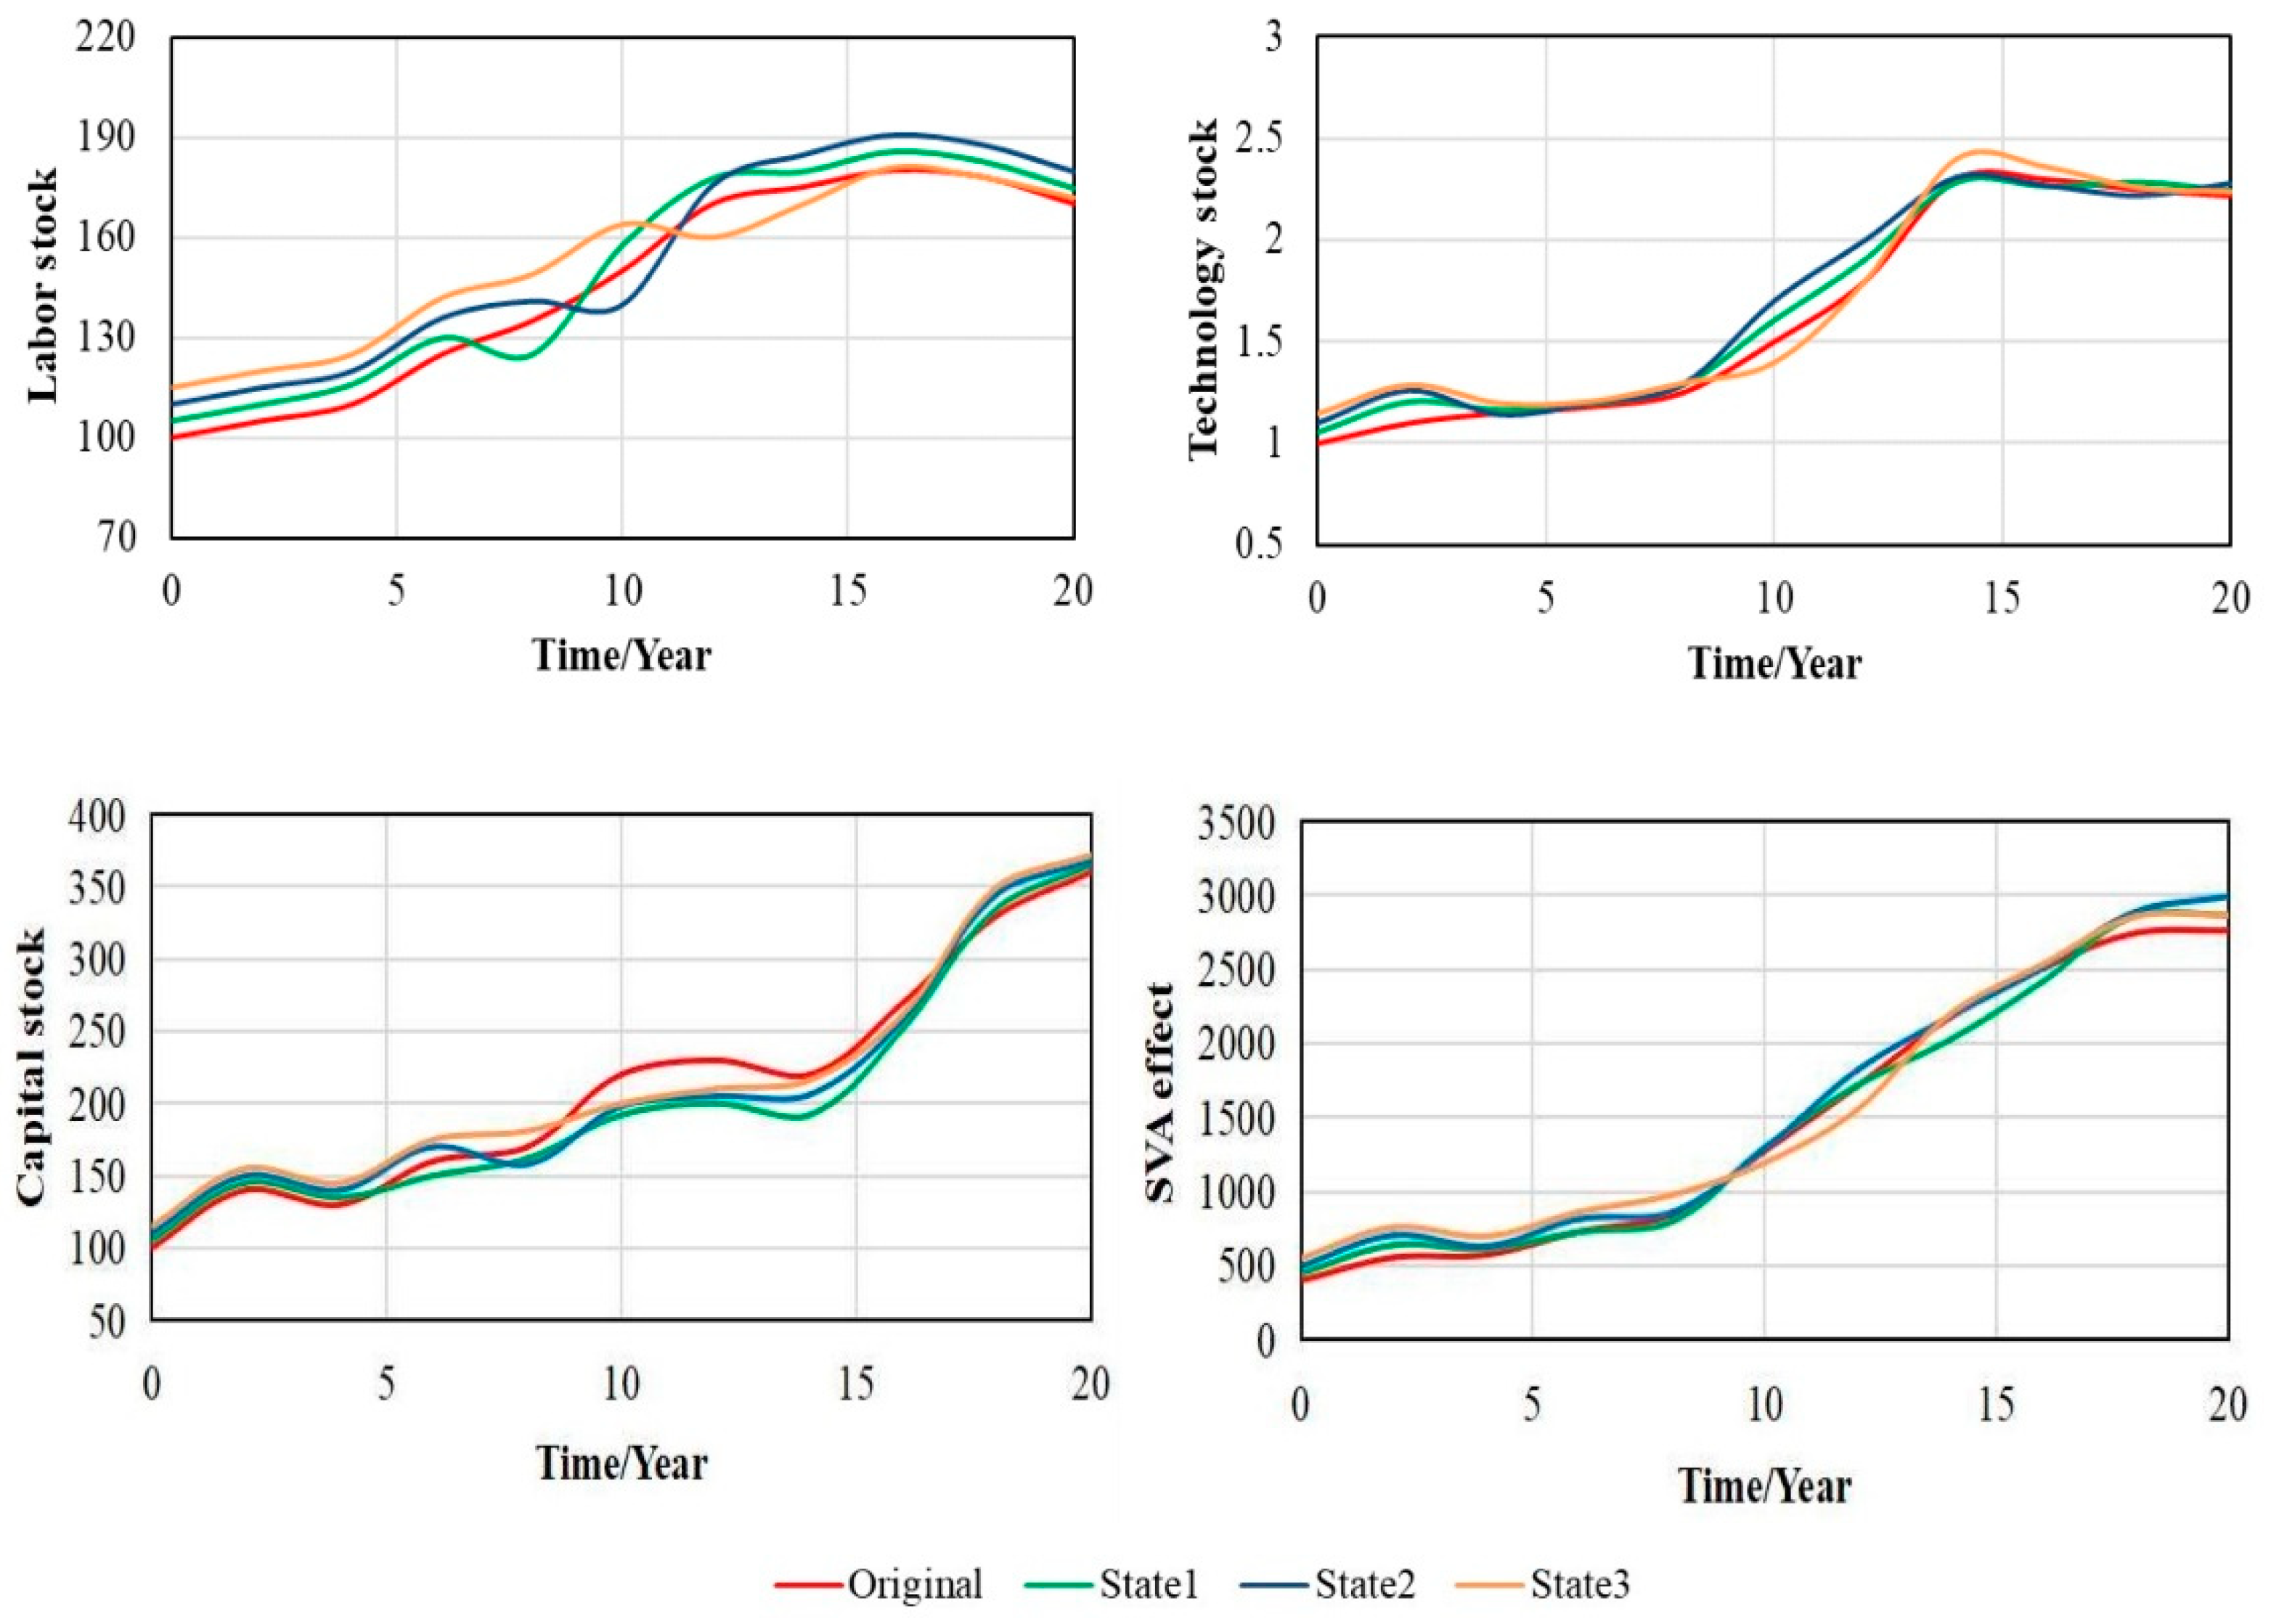
Second, the model should be tested for sensitivity. In this model, labor, technology, and capital were the three state variables that exerted the most direct impact on the SVA effect, so we performed a sensibility test on these three variables. With the composite simulation function of Vensim PLE, the three variables were increased by 5%, 10%, and 15%, respectively, to simulate the development and evolutionary trends of SVA.
Figure 7 shows the simulation results. We compared the simulated three scenarios with the initial states and found that no matter how the three variables were adjusted, their influence on the SVA effect remained basically consistent. This finding indicated that these three variables were the important variables affecting the SVA effect, and the influence was relatively stable. Hence, this model passed the sensitivity test.
Through the boundary suitability test, dimensional consistency test, structural evaluation test, and sensitivity test on the model, we found that the SVA model constructed in this study (i.e., a system dynamics model with proper boundaries, reasonable structure, and real validity) was applicable to simulate the evolutionary process and mechanism of SVA.
3.6. Simulation and Prediction
On the basis of these model tests, this model was effective and could be used to simulate the evolution of SVA. According to the previous simulations, to better observe the middle and long-term evolutionary trend of SVA, we extended the research period to 30 years and modified the time range of the model by setting the final time as 30.
Figure 8 shows the simulation and prediction results.
In general, the SVA effect was in an S-shaped, which we divided into three periods: the formation period (0–8 years), the growth period (9–20 years), and the maturation period (21–30 years). By further dividing the CLD according to this time frame, we further analyzed the role of the main factors in the evolution at different stages.
During the formation period (0–8th year), the agglomeration effect was at a low level (less than 1000). At this stage, capital made the largest contribution to the agglomeration effect and the slope of the capital curve constantly increased, which indicated that in the initial stage of the formation of SVA, the contribution made by capital to the formation of agglomeration constantly increased as well. The development of specialized projects in the initial stage relied on local advantageous resources, most of the personnel engaged in specialized projects were farmers, and the technologies used were mostly based on traditional experience. Thus, the labor pool and technology accumulation were insufficient, and their contribution to the agglomeration effect was quite small.
During the growth period (9th–20th years), the agglomeration effect rapidly surged (1000–3000). At this stage, the contribution of labor and technology to the agglomeration effect increased rapidly. At this stage, thanks to division of labor and specialization, specialized projects were primarily about horizontal-scale expansion based on simple imitation as well as vertical expansion toward innovation and industrial chain extension. Therefore, during this phase, the demand for professional labors forced the original professionals to improve their level of professionalism. In addition, because of the extension of specialized projects on the industrial chain during this period, a considerable number of enterprises became the economic activity subjects of the specialized villages agglomeration. Enterprises’ demand and cultivation of laborers played a critical role in increasing the total number of laborers in these specialized villages agglomeration. Likewise, because of the division of labor and specialization, the original technologies were far from meeting the development needs of specialized projects, and they sought external technical support, which enabled the specialized villages agglomeration to rapidly increase the technology accumulation in a short period of time.
In the maturation period (21st–30th years), the agglomeration effect was comparatively steady (3000–3500). At this stage, an increasing number of economic entities participated in the SVA system. There were not only farmers but also increasing numbers of affiliated companies. Moreover, even leading companies in the specialized project, professional associations, professional cooperative organizations, and financial institution intermediary platforms also participated in this system. The multiple synergies of numerous economic entities turned the system into a multilevel, co-evolving development model that was completely random and interactive. The joint effect of many joint forces also led to more balanced and stable development of this system. The contribution of labor inventory to the agglomeration effect gradually declined. The main reason may be that during this growth period, the labor inventory had reached its peak, the demand for labor was going through a structural adjustment, and demand for ordinary labor was approaching saturation, although demand for high-quality labor had not yet been met. At this stage, the contribution of technology and capital to the agglomeration effect probably still increased. The further deepened division of labor during the maturation period optimized many specialized villages and related industries in the direction of industrial structural adjustments and upgrades, and such transformation required the support of technology and capital.
4. Discussion and Conclusions
4.1. Discussion
At present, there are relatively few studies on the village level using system dynamics analysis [
38]. However, in fact, for the specialized villages agglomeration system, the system dynamics analysis method is more appropriate. The specialized villages agglomeration system, like other economic systems, is a self-organizing system. The characteristics of self-organization are the main driving force for its development and evolution, mainly reflected in the following aspects.
The openness of the specialized villages agglomeration system. The specialized villages agglomeration does not exist in isolation. It is an open system that constantly exchanges materials, energy, and information with the surrounding environment. On the one hand, its openness is reflected in the uncertainty of its spatial boundary. From the perspective of spatial scope, the physical boundary is fuzzy, uncertain, and constantly changing. On the other hand, there is no virtual “boundary” limit when it exchanges material, energy, and information with its surroundings. Although the specialized villages agglomeration system will be affected by distance in the exchange with the surrounding environment, which may produce a distance attenuation effect, there is no boundary like a fence. The openness makes the system a living system. Through continuous communication with the outside world, the system is full of vitality, which will also provide development power support for the development of the system.
The nonequilibrium of the specialized villages agglomeration system. The specialized villages agglomeration is an open system, so it is unbalanced. In the different stages of the development of specialized villages, there is inherent nonequilibrium to promote their evolution and development. At the initial stage of formation, due to the imbalance of resource endowment, agglomeration first occurred in some regions. This nonequilibrium will produce path dependence due to embeddedness and expectation, and then the degree of nonequilibrium will continue to increase. Due to the unbalanced development in the initial stage, the specialized projects in the agglomeration area have formed a certain scale, reached the level of specialized production, and occupied a favorable link in the specification chain. The nonequilibrium continues to intensify. It can be said that nonequilibrium is the normal condition of specialized villages agglomeration, and it is precisely because of this nonequilibrium that the development of the specialized villages agglomeration system can be energetic.
The non-linearity of the specialized villages agglomeration system. The interaction between state variables in the specialized villages agglomeration system is not simply linear superposition, but a nonlinear relationship. It is this nonlinear interaction that leads to unpredictable new situations, such as diseconomies of scale. Continuous scale expansion will not linearly bring about the improvement of economic benefits, but there may be a negative feedback effect at a certain critical value. Moreover, different from the contractual relationship of the complete market economy, most of the actors in the specialized villages agglomeration system are complex interpersonal networks based on kinship and geographical proximity, which leads to a more complex interaction rather than a simple linear relationship. The non-linearity makes its development a more unpredictable state, which may appear as bifurcation at some time. Sometimes it is necessary for the government to deal with problems that cannot be solved by this complex system itself.
Existing studies [
39,
40] have also put forward some policy recommendations and development strategies for the development of specialized villages in some countries, but these studies do not take into account the dynamics of the development of specialized villages. This study found that in the process of specialized villages agglomeration development, the influencing factors that play a major role in different stages are also different. Therefore, combined with the practice of the case area, it is suggested that the development strategy should be adopted at different development stages.
At the initial stage of the development, the impact of resource endowments is relatively large. The local government should choose projects with comparative advantages on the basis of local regional characteristics and advantages, and provide a good development environment. For individual farmers, capital is the biggest problem in the early stage of development. The government should strengthen institutional guarantee to help farmers solve this problem.
In the growth period, with the deepening of the division and the improvement of the degree of specialization, labor and technical elements have become important factors. The government needs to provide an institutional guarantee to match the human resources with the development of specialized villages. As for technical elements, the government should strengthen external relations and introduce advanced technology into the local.
In the mature period, the agglomeration effect has been more obvious. The specialization of individual specialized villages has gradually developed into a regional specialization. As a specialized whole, regions should participate in the division on a larger spatial scale. How to improve the local competitive advantage has become the key to the sustainable development of specialized villages agglomeration areas. On the one hand, we need to strengthen the deepening of the division, so that the specialized projects can play a functional agglomeration effect. On the other hand, it needs the institutional innovation of the government to stimulate the innovation of economic subjects, so that the regional economy can develop sustainably.
4.2. Conclusions
In this study, we analyzed the evolutionary mechanism of SVA from the perspective of system theory. We simulated and predicted the evolution of SVA at the foot of Taihang Mountains in Henan Province according to the process built by a general model of system dynamics. The following conclusions were obtained:
On the basis of a boundary suitability test, dimensional consistency test, structural evaluation test, and sensitivity test, we considered the model to be able to simulate the evolutionary process and to explore the evolutionary mechanism of SVA at the foot of Taihang Mountains in Henan Province.
The SVA effect was an “S-shaped” curve, which we divided into three periods: the formation period (0–8 years), the growth period (9–20 years), and the maturation period (21–30 years). The contribution of capital to the agglomeration effect was most significant in the formation period; during the growth period, the contribution of laborers and technologies to the agglomeration effect increased rapidly; in the maturation period, the contribution of labors to the agglomeration effect gradually declined, whereas the contribution of technology and capital to the agglomeration effect continued to rise.
Because of data availability, the time span of the existing data was not sufficiently long, so the time scale of the simulation was quite limited, and the evolution of SVA over a longer period of time could not be predicted. Further collection of long-term data for simulation and prediction could more fully describe the overall picture of the evolution of SVA. SVA might experience a variety of more complex situations after the maturation period, that is, SVA could go through spiral escalation by means of transformation and upgrades or it could decline or even disappear. In the future, it will be necessary to carry out continuous follow-up investigations on SVA to further enrich the research results.
Because this study focused on the general evolutionary pattern of SVA, we did not classify specialized villages into different types for separate analyses. The development and evolution of different types of specialized villages, however, follow distinct models. Hence, it is necessary to conduct targeted studies on different types of specialized villages separately, which will be the direction of our future studies.

