
Flood Hazard Index Application in Arid Catchments: Case of the Taguenit Wadi Watershed, Lakhssas, Morocco


 ,
,  ,
,  , ,
, ,  and
and 
Abstract
:1. Introduction
2. Materials and Methods
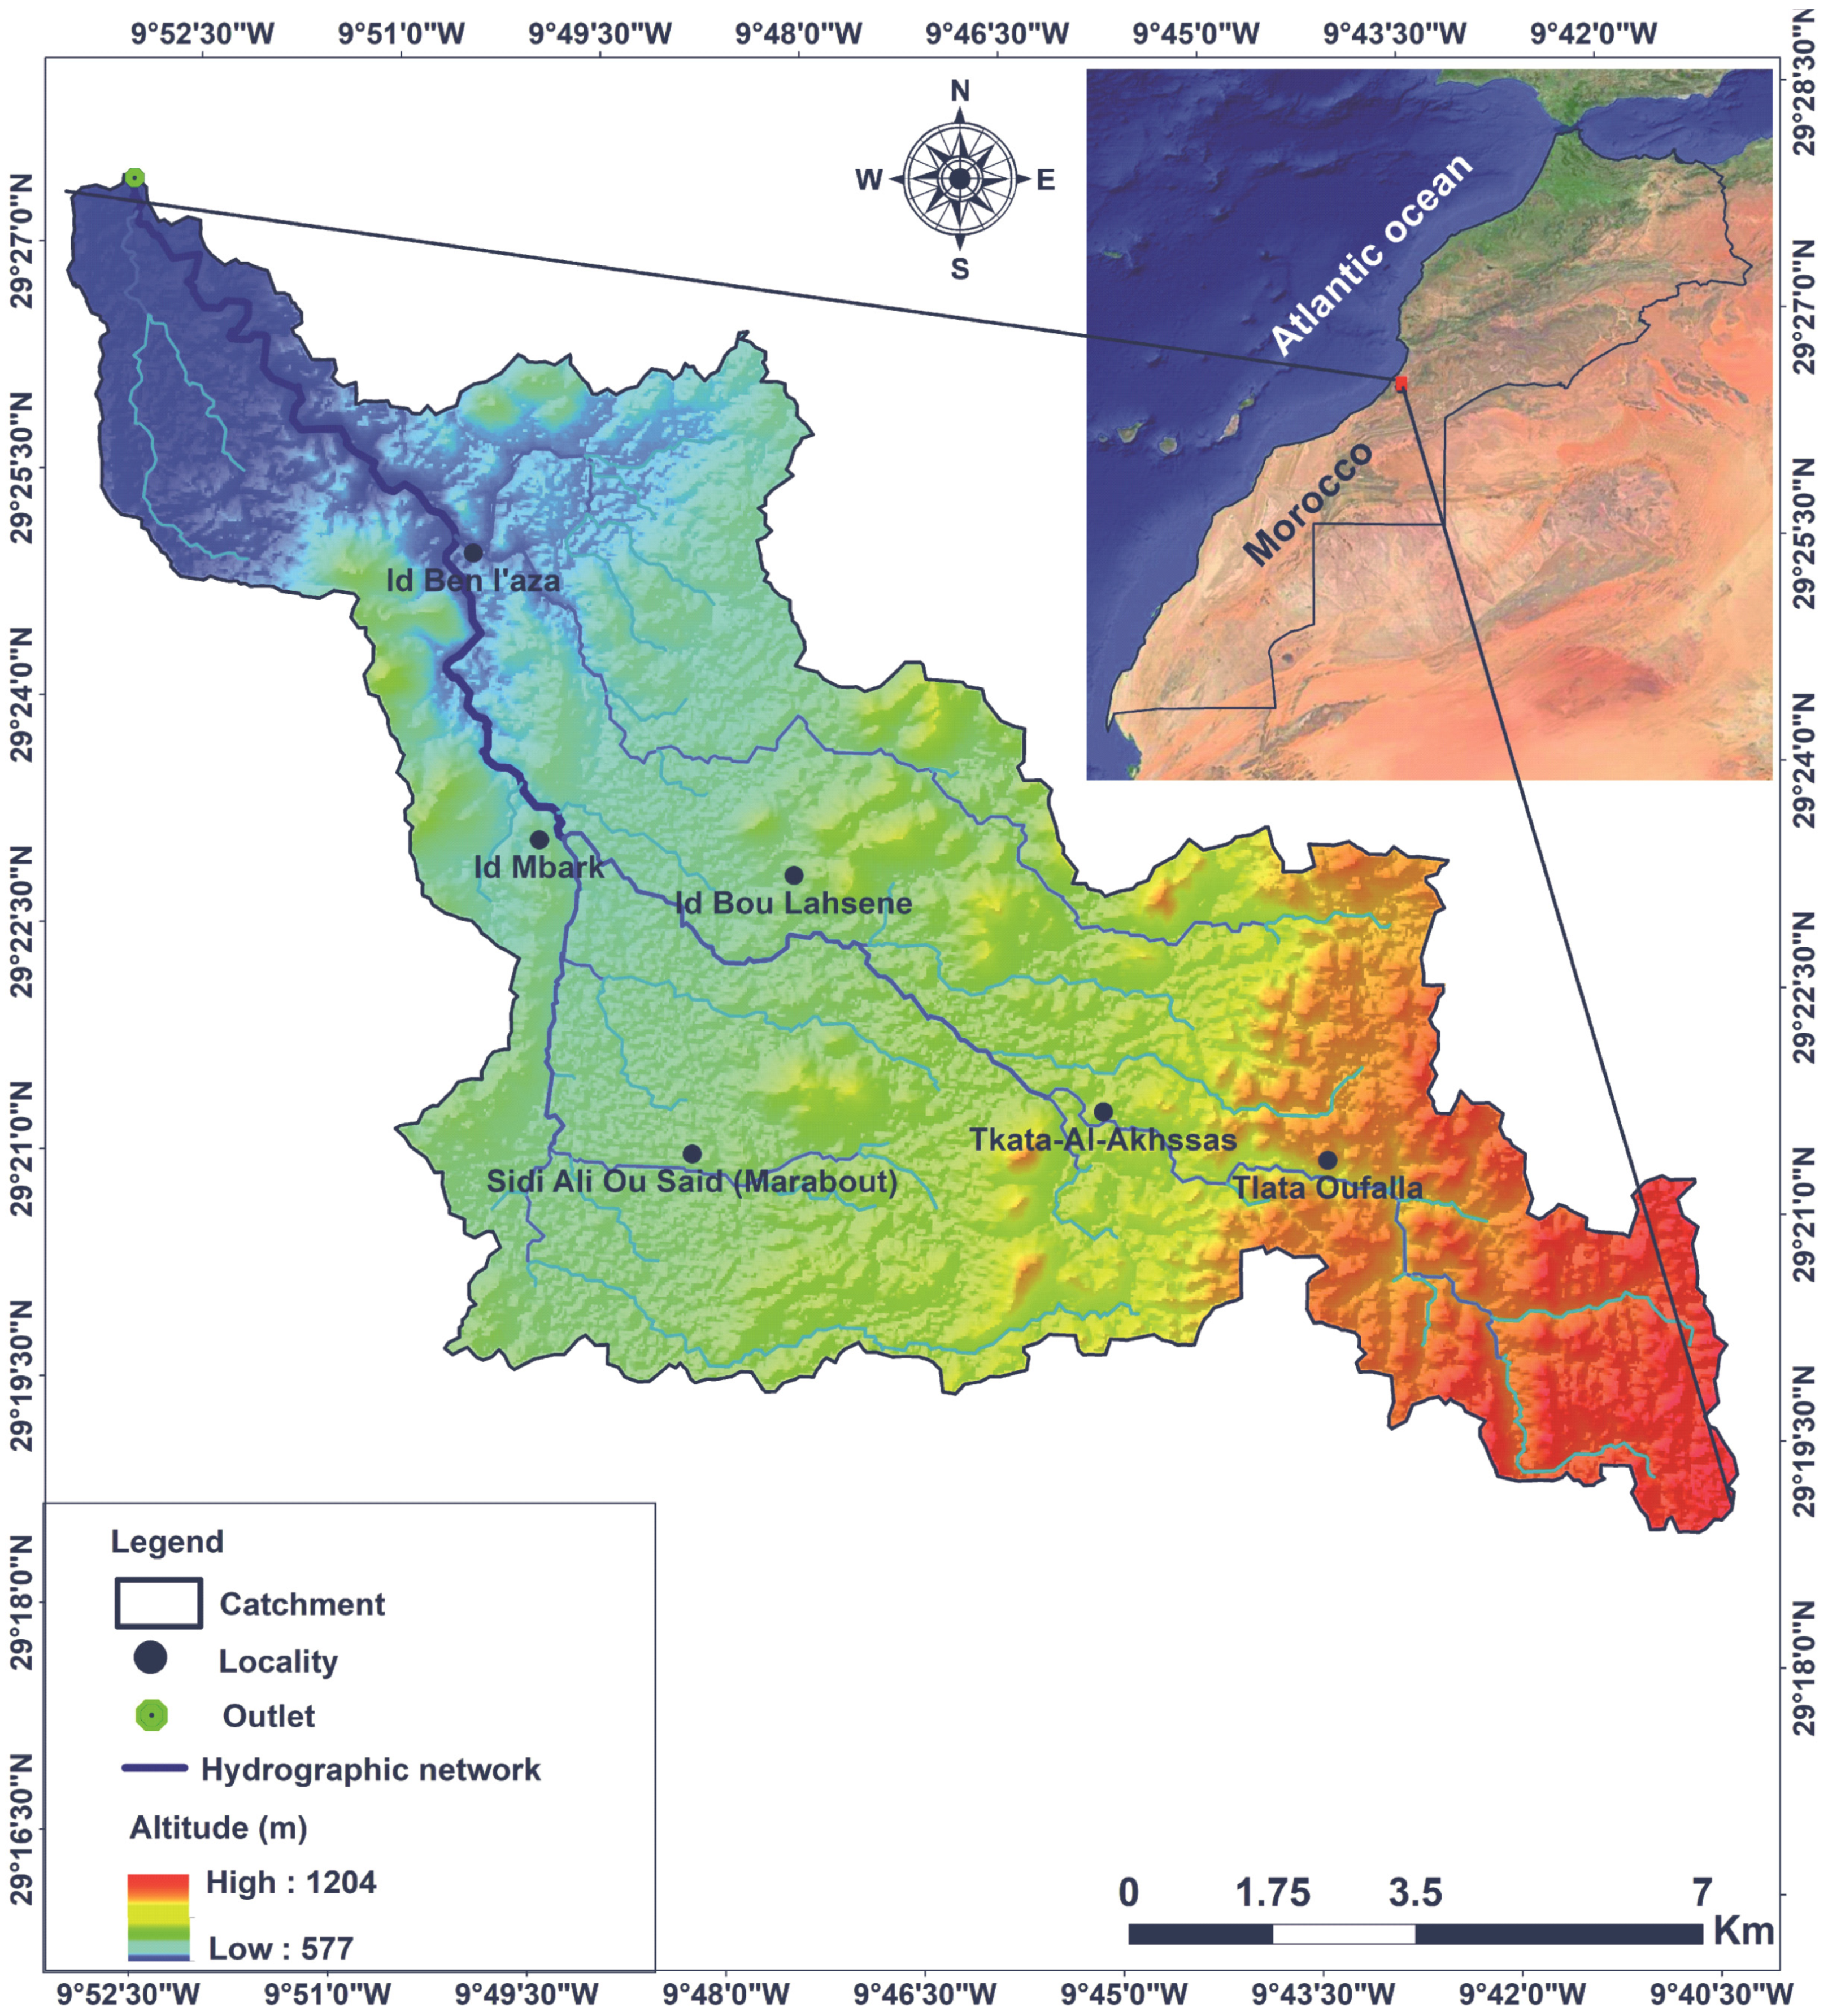
2.1. Geographical Setting of the Taguenit Wadi Catchment
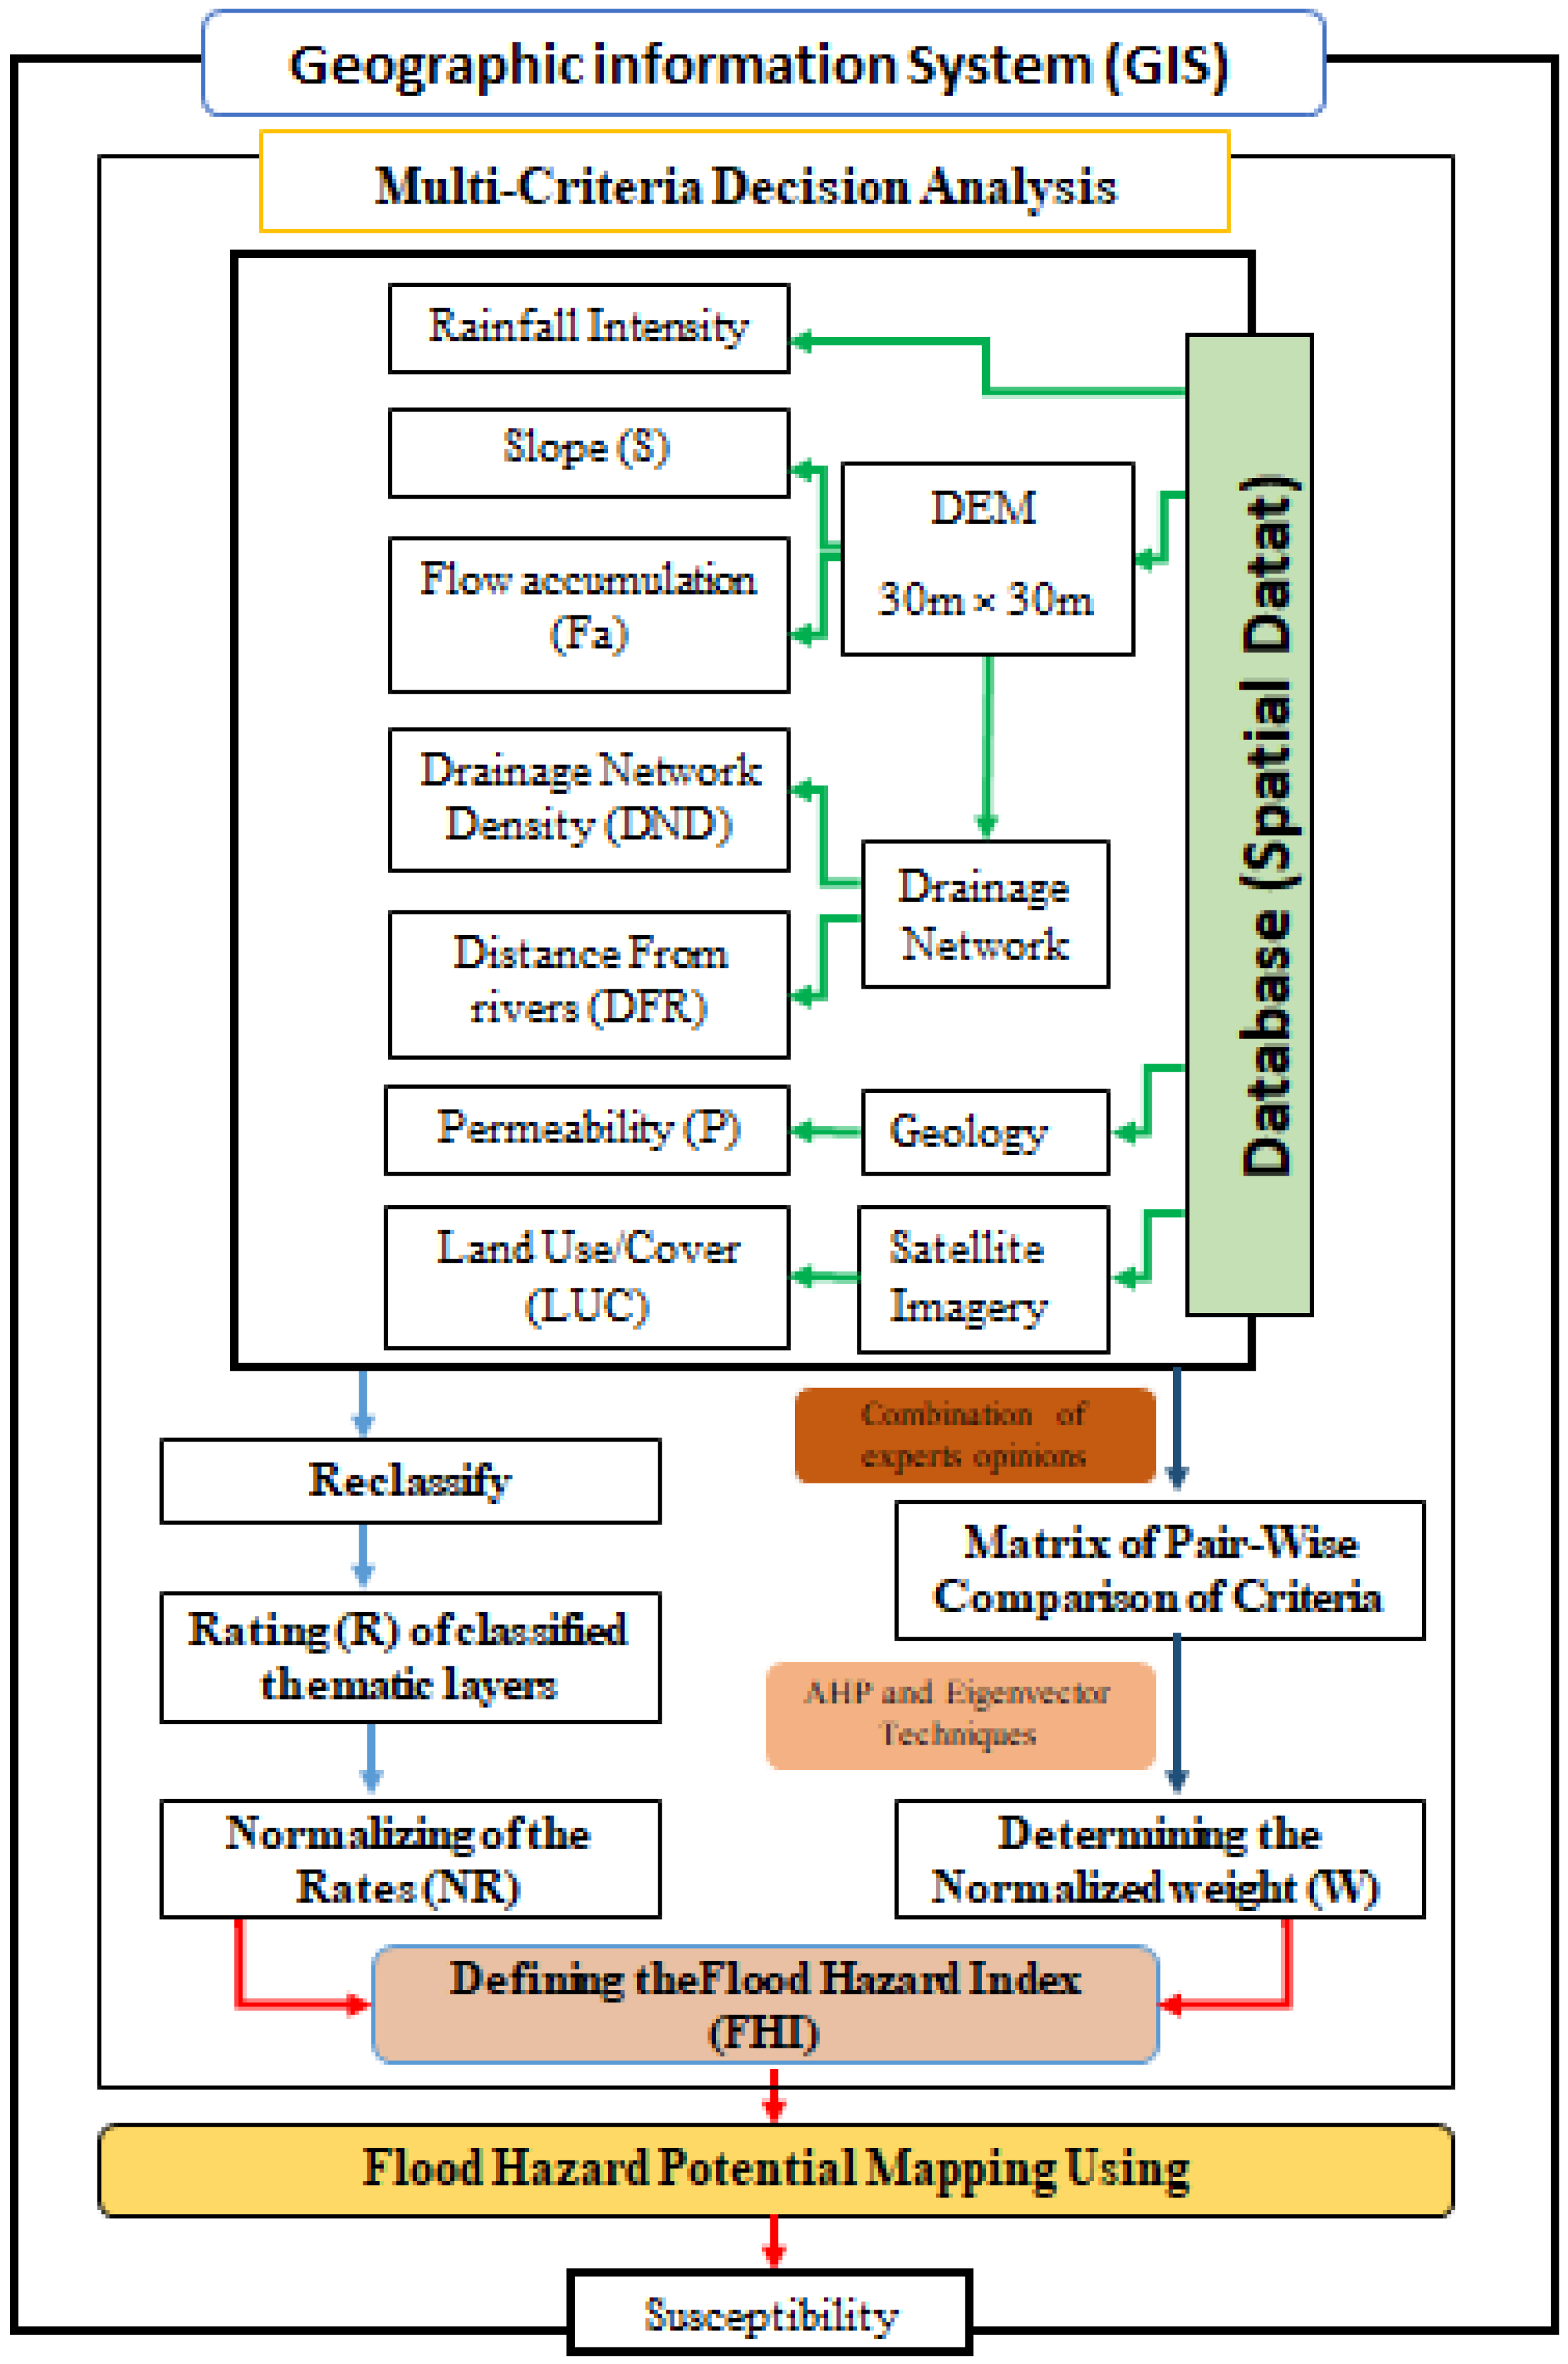
2.2. Flood Mapping Methodology
2.3. Flood Hazard Index (FHI) Factors
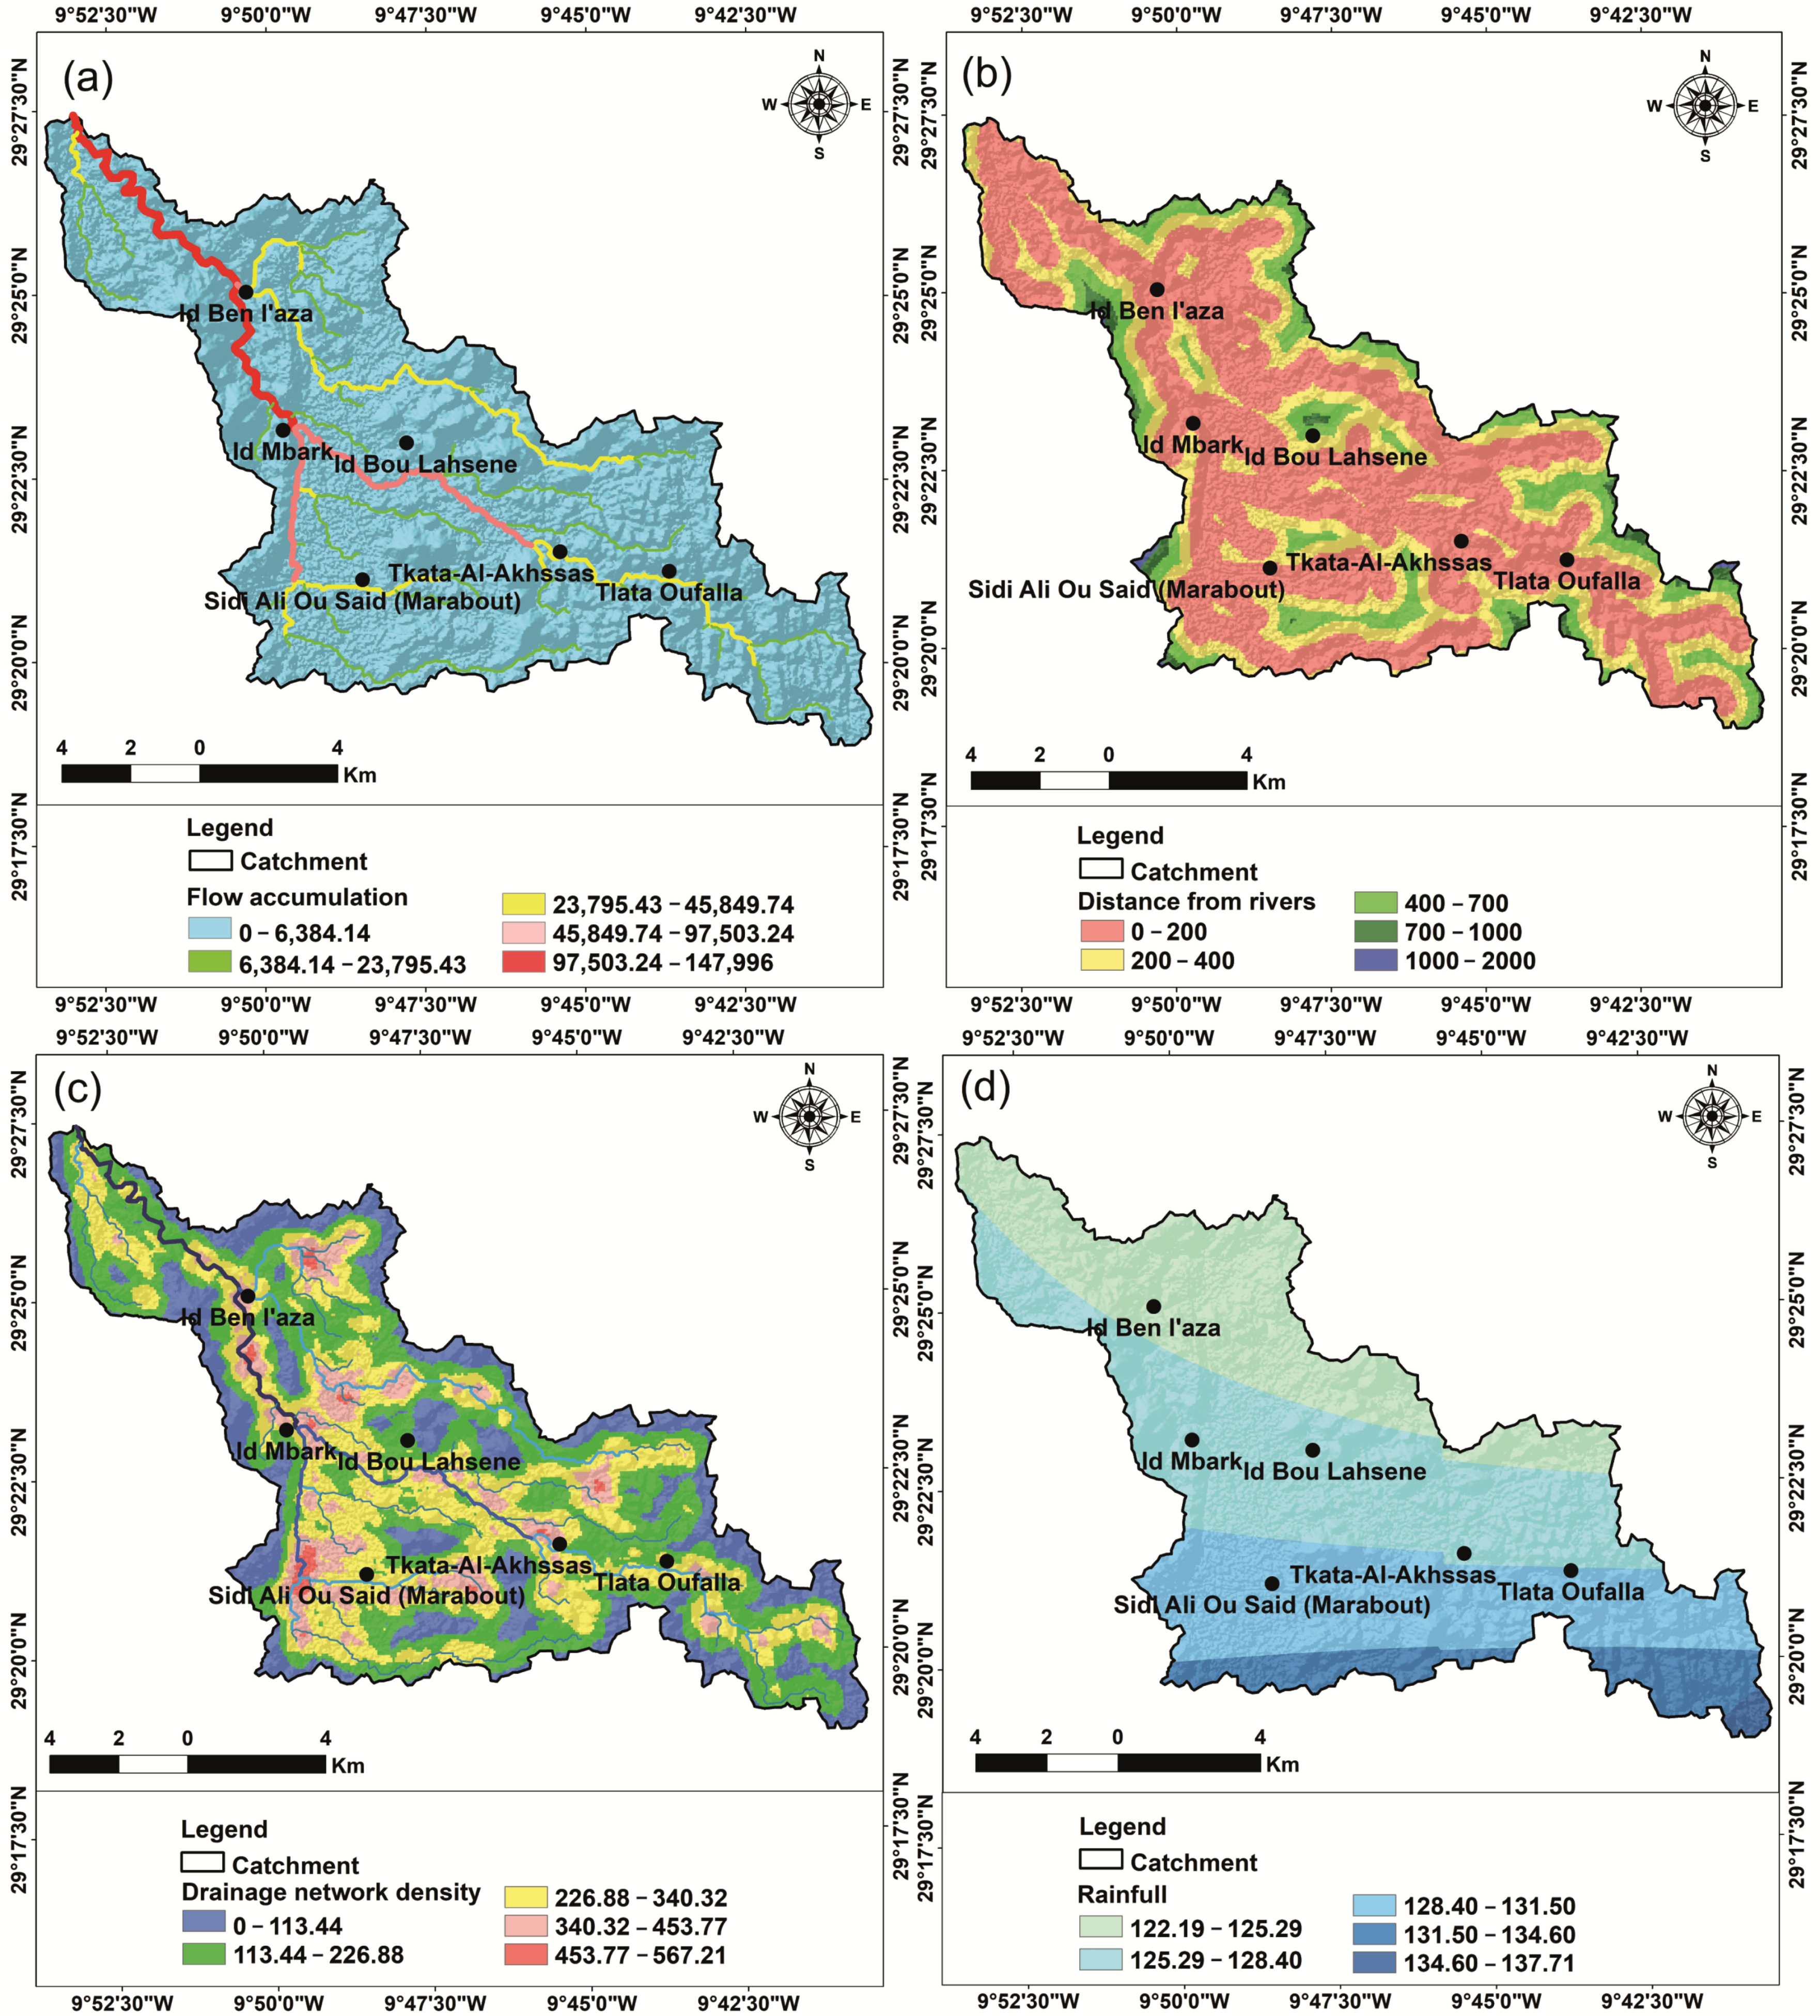
- Flow accumulation (Fa): Flow accumulation corresponds to the accumulated water flow to a specific cell drained from the cells located upstream. High values of the Fa factor indicate areas of higher concentrated water flow and, therefore, a higher risk of flooding [28,39]. In the study area, this factor varies in a range between 0 and 147.996, with the highest values coinciding with the water flow of the main tributaries of Taguenit Wadi (Table 1; Figure 5a).
- Distance from Rivers (DFR): The spatial distance of a region to the river system is a crucial factor in the delimitation of flood vulnerability zones. As the distance to the river system decreases, the degree of flood risks will increase [14,28,29]. Distances located below 200 m to the river system will correspond to areas of higher flood vulnerability. Otherwise, the areas located away from 400 m to the river system seem to present a lower or absent flood risk. The high flood vulnerability zones are mainly confined to the river networks (Table 1; Figure 5b).
- Drainage Network Density (DND): Drainage network density is proportional to the cumulative water volume from upstream to downstream in the river basin [40,41]. In the Taguenit Wadi catchment, DND values range from 0 to 5.67 m/km2, with the lower class concentrated in the catchment (Table 1; Figure 5c).
- Rainfall (R): For a given area, rainfall is the most important factor related to the occurrence of floods, it has a direct relationship with river flow, and a large amount of rainfall in a short time can generate flash floods in semi-arid regions [1,2]. The annual rainfall data (1980 to 2016) used in this study were collected from Regional Meteorological stations (Taghjijt, Adoudou, Assaka, and Sidi Ifni stations). Thus, a rainfall map was prepared from the annual mean rainfall by inverse distance weighted (IDW) interpolation in ArcGIS 10.4 [39,42]. The annual mean rainfall varies between 122.19 to 137.71 mm/year, with decreased values from the north to the south, and the highest rainfall values are recorded in the southern part of the basin (Table 1; Figure 5d).
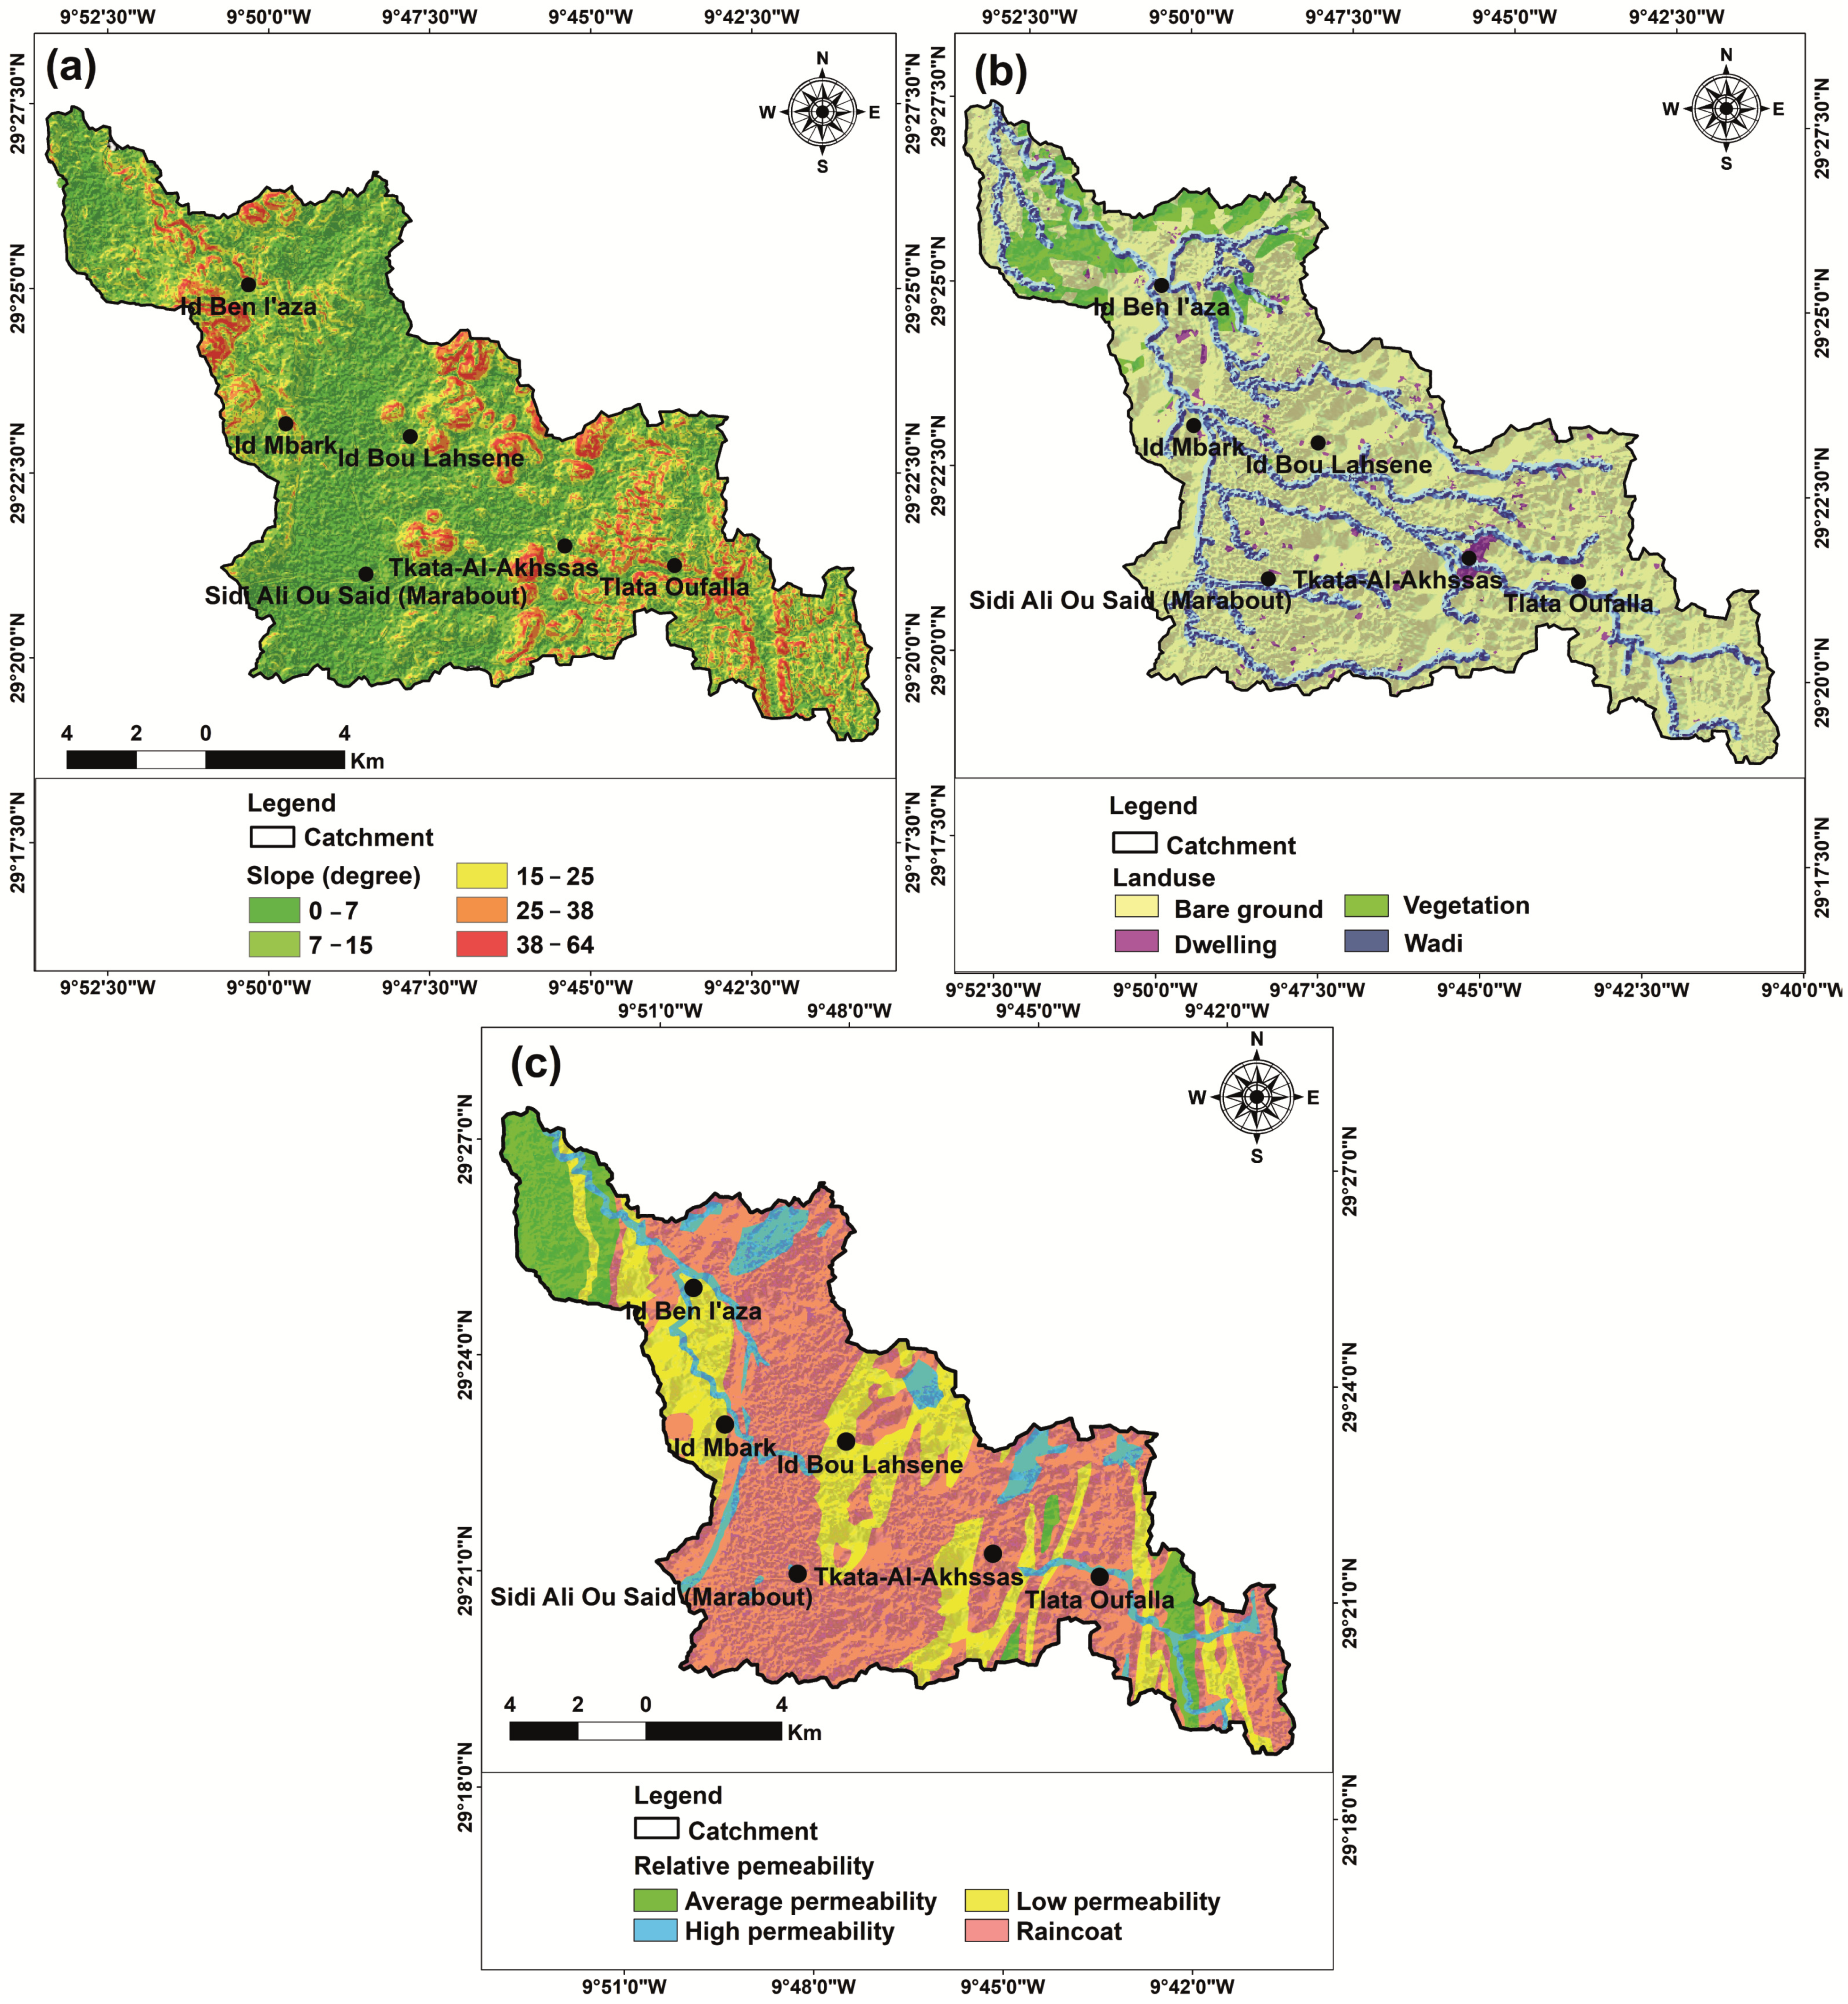
- Slope (S): The slope of the area influences surface runoff and water infiltration [39,43]. The slope classes vary between 0 and 64° (Table 1) and were defined according to the model applied by Demek [44]. The lower slope areas are concentrated downstream, while the higher slope areas are concentrated in the mountainous regions, located in the north of the basin (Figure 6a).
- Land use (LU): The type of land use determines the infiltration of rainwater into the soil and the resulting runoff [14,28]. Forests generally favor infiltration through the root system of trees and plants, whereas roads and buildings reduce infiltration of this water and increase surface runoff. In the Taguenit catchment area, the land use data have been reclassified into four classes displayed in Table 1. The village of Lakhssas, located in the center of the basin area and equipped with several infrastructures (e.g., roads, tracks, shops, and dwellings), amplifies the occurrence of floods downstream as it generally contains impermeable materials (Figure 6b).
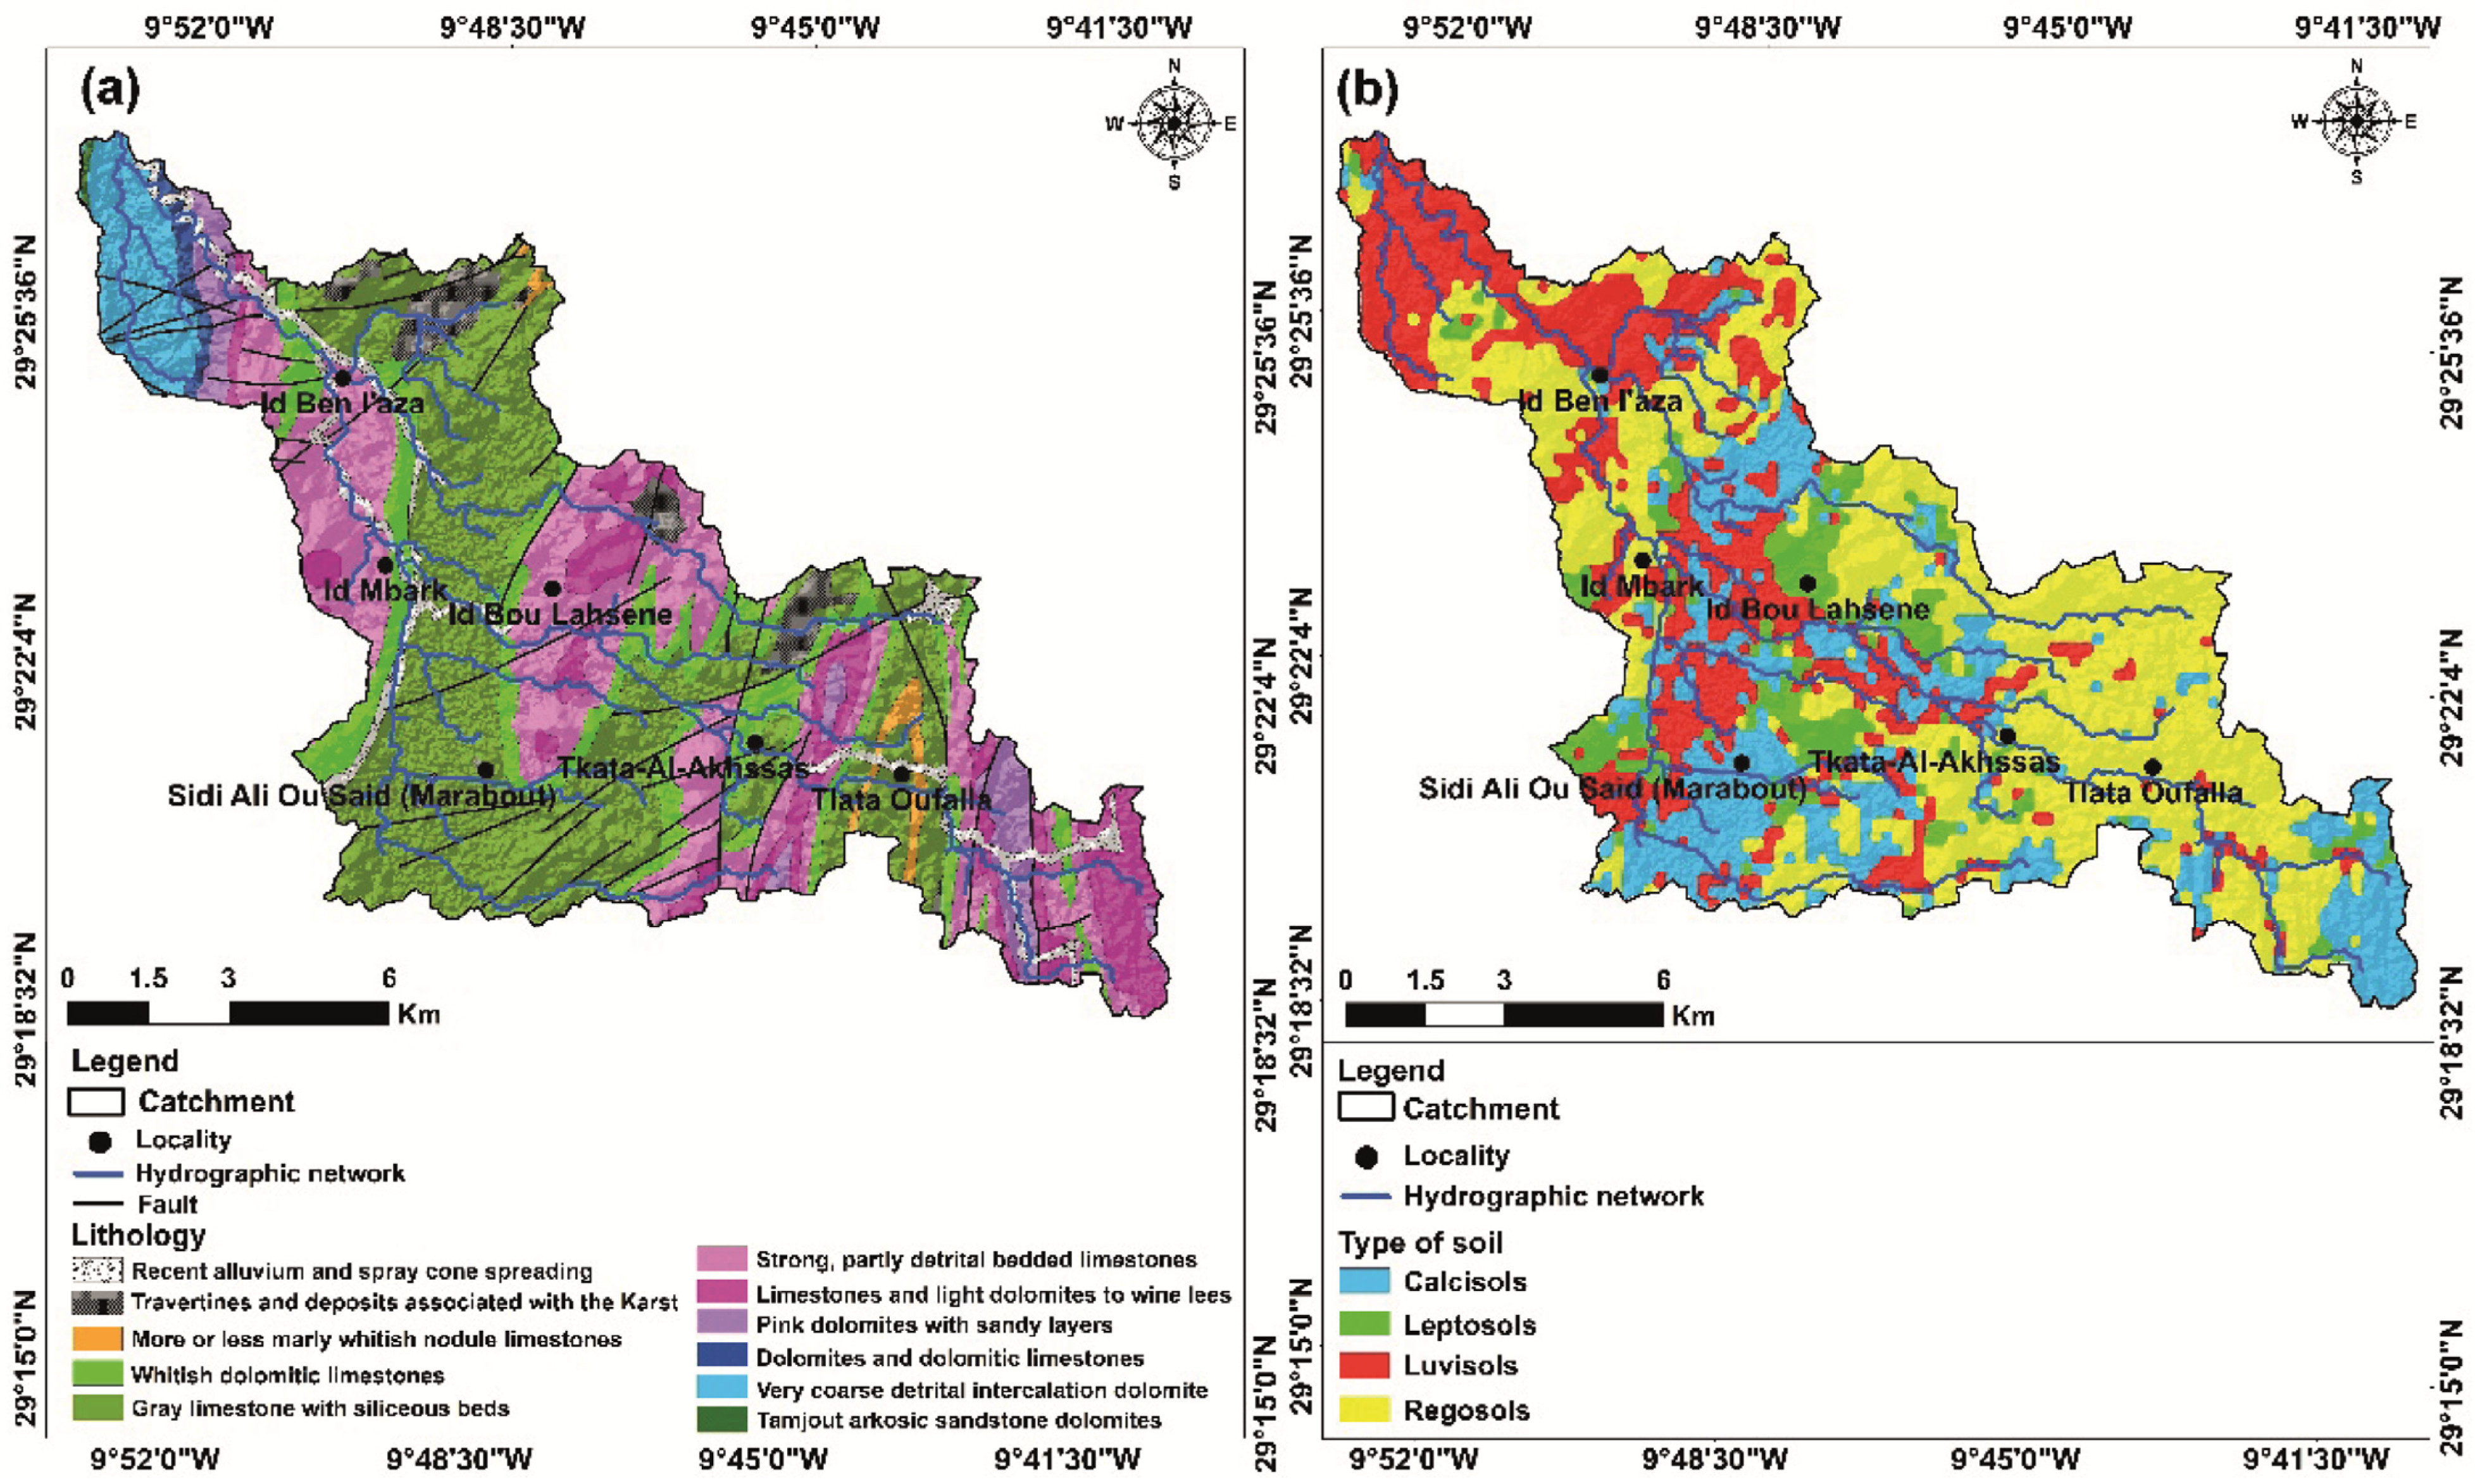
- Permeability (P): In the Taguenit Wadi catchment, the impermeable or poorly permeable rocks, such as crystalline rocks, promote surface runoff. This factor was reclassified into four classes, varying between 4 to 10, according to models established by Echogdali et al. [29] and Elkhrachy [41]. About 80% of the basin′s formations are impermeable or with a low permeability, which offers an environment conducive to a higher probability of strong floods development. Carbonate formations, with lower permeability and strongly favoring runoff, were assigned a weight of 10 (Table 1), while the lowest weight (class 2) was attributed to those with a high permeability corresponding to the Quaternary formations, which extend over 20% of the Taguenit Wadi catchment (Figure 6c).
2.4. Relative Weight of Factors
3. Results and Discussion
3.1. Flood Hazard Index (FHI) Analysis
3.2. Territorial Planning Implications of Flood Hazard Index (FHI)
4. Conclusions
Author Contributions
Funding
Institutional Review Board Statement
Informed Consent Statement
Data Availability Statement
Acknowledgments
Conflicts of Interest
References
- Abdulrazzak, M.; Elfeki, A.; Kamis, A.; Kassab, M.; Alamri, N.; Chaabani, A.; Noor, K. Flash flood risk assessment in urban arid environment: Case study of Taibah and Islamic universities’ campuses, Medina, Kingdom of Saudi Arabia. Geomat. Nat. Hazards Risk 2019, 10, 780–796. [Google Scholar] [CrossRef] [Green Version]
- Pinos, J.; Quesada-Román, A. Flood Risk-Related Research Trends in Latin America and the Caribbean. Water 2021, 14, 10. [Google Scholar] [CrossRef]
- El Alfy, M. Assessing the impact of arid area urbanization on flash floods using GIS, remote sensing, and HEC–HMS rainfall–runoff modeling. Hydrol. Res. 2016, 47, 1142–1160. [Google Scholar] [CrossRef] [Green Version]
- Bouramtane, T.; Yameogo, S.; Touzani, M.; Tiouiouine, A.; Ouardi, J.; Kacimi, I.; Valles, V.; Barbiero, L. Statistical approach of factors controlling drainage network patterns in arid areas. Application to the Eastern Anti Atlas (Morocco). J. Afr. Earth Sci. 2020, 162, 103707. [Google Scholar] [CrossRef]
- Tang, J.C.; Vongvisessomjai, S.; Sahasakmontri, K. Estimation of flood damage cost for Bangkok. Water Resour. Manag. 1992, 6, 47–56. [Google Scholar] [CrossRef]
- Lekuthai, A.; Vongvisessomjai, S. Intangible flood damage quantification. Water Resour. Manag. 2001, 15, 343–362. [Google Scholar] [CrossRef]
- Hallegatte, S.; Hourcade, J.C.; Dumas, P. Why Economic Dynamics Matter in Assessing Climate Change Damages: Illustration on Extreme Events. Ecol. Econ. 2007, 62, 330–340. [Google Scholar] [CrossRef] [Green Version]
- Echogdali, F.Z.; Kpan, R.B.; Ouchchen, M.; Id-Belqas, M.; Dadi, B.; Ikirri, M.; Abioui, M.; Boutaleb, S. Spatial Prediction of Flood Frequency Analysis in a Semi-Arid Zone: A Case Study from the Seyad Basin (Guelmim Region, Morocco). In Geospatial Technology for Landscape and Environmental Management: Sustainable Assessment and Planning; Rai, P.K., Mishra, V.N., Singh, P., Eds.; Springer: Singapore, 2022; pp. 49–71. [Google Scholar] [CrossRef]
- Benkirane, M.; Laftouhi, N.; El Mansouri, B.; Salik, I.; Snineh, M.; El Ghazali, F.E.; Kamal, S.; Zamrane, Z. An approach for flood assessment by numerical modeling of extreme hydrological events in the Zat watershed (High Atlas, Morocco). Urban Water J. 2020, 17, 381–389. [Google Scholar] [CrossRef]
- Heiß, L.; Bouchaou, L.; Tadoumant, S.; Reichert, B. Multi-tracer approach for assessing complex aquifer systems under arid climate: Case study of the River Tata catchment in the Moroccan Anti-Atlas Mountains. Appl. Geochem. 2020, 120, 104671. [Google Scholar] [CrossRef]
- El Alaoui El Fels, A.; Bachnou, A.; Alaa, N. Combination of GIS and mathematical modeling to predict floods in semiarid areas: Case of Rheraya watershed (Western High Atlas, Morocco). Arab. J. Geosci. 2017, 10, 554. [Google Scholar] [CrossRef]
- Echogdali, F.Z.; Boutaleb, S.; Jauregui, J.; Elmouden, A. Cartography of Flooding Hazard in Semi–Arid Climate: The Case of Tata Valley (South-East of Morocco). J. Geogr. Nat. Disast. 2018, 8, 214. [Google Scholar]
- Karmaoui, A.; Messouli, M.; Yacoubi Khebiza, M.; Ifaadassan, I. Environmental Vulnerability to Climate Change and Anthropogenic Impacts in Dryland, (Pilot Study: Middle Draa Valley, South Morocco). J. Earth Sci. Clim. Chang. 2014, 11, S11. [Google Scholar]
- Ikirri, M.; Faik, F.; Boutaleb, S.; Echogdali, F.Z.; Abioui, M.; Al-Ansari, N. Application of HEC–RAS/WMS and FHI models for the extreme hydrological events under climate change in the Ifni River arid watershed from Morocco. In Climate and Land Use Impacts on Natural and Artificial Systems: Mitigation and Adaptation; Nistor, M.M., Ed.; Elsevier: Amsterdam, The Netherlands, 2021; pp. 251–270. [Google Scholar] [CrossRef]
- Souissi, D.; Zouhri, L.; Hammami, S.; Msaddek, M.H.; Zghibi, A.; Dlala, M. GIS-based MCDM–AHP modeling for flood susceptibility mapping of arid areas, southeastern Tunisia. Geocarto Int. 2020, 35, 991–1017. [Google Scholar] [CrossRef]
- Lyu, H.M.; Zhou, W.H.; Shen, S.L.; Zhou, A.N. Inundation risk assessment of metro system using AHP and TFN-AHP in Shenzhen. Sustain. Cities Soc. 2020, 56, 102103. [Google Scholar] [CrossRef]
- Costache, R.; Tin, T.T.; Arabameri, A.; Crăciun, A.; Ajin, R.S.; Costache, I.; Islam, A.R.M.T.; Abba, S.I.; Sahana, M.; Avand, M.; et al. Flash-flood hazard using deep learning based on H2O R package and fuzzy-multicriteria decision-making analysis. J. Hydrol. 2022, 609, 127747. [Google Scholar] [CrossRef]
- Fenicia, F.; Kavetski, D.; Savenije, H.H.; Clark, M.P.; Schoups, G.; Pfister, L.; Freer, J. Catchment properties, function, and conceptual model representation: Is there a correspondence? Hydrol. Process. 2014, 28, 2451–2467. [Google Scholar] [CrossRef]
- Luu, C.; Von Meding, J.; Kanjanabootra, S. Assessing flood hazard using flood marks and analytic hierarchy process approach: A case study for the 2013 flood event in Quang Nam, Vietnam. Nat. Hazards 2018, 90, 1031–1050. [Google Scholar] [CrossRef]
- Costache, R.; Pham, Q.B.; Arabameri, A.; Diaconu, D.C.; Costache, I.; Crăciun, A.; Ciobotaru, N.; Pandey, M.; Arora, A.; Ali, S.A.; et al. Flash-flood propagation susceptibility estimation using weights of evidence and their novel ensembles with multicriteria decision making and machine learning. Geocarto Int. 2021, 1–33. [Google Scholar] [CrossRef]
- Siahkamari, S.; Haghizadeh, A.; Zeinivand, H.; Tahmasebipour, N.; Rahmati, O. Spatial prediction of flood-susceptible areas using frequency ratio and maximum entropy models. Geocarto Int. 2018, 33, 927–941. [Google Scholar] [CrossRef]
- Al-Abadi, A.M.; Shahid, S. A comparison between index of entropy and catastrophe theory methods for mapping groundwater potential in an arid region. Environ. Monit. Assess. 2015, 187, 576. [Google Scholar] [CrossRef] [PubMed] [Green Version]
- Mosavi, A.; Golshan, M.; Janizadeh, S.; Choubin, B.; Melesse, A.M.; Dineva, A.A. Ensemble models of GLM, FDA, MARS, and RF for flood and erosion susceptibility mapping: A priority assessment of sub-basins. Geocarto Int. 2020, 37, 2541–2560. [Google Scholar] [CrossRef]
- Al-Juaidi, A.E.M.; Nassar, A.M.; Al-Juaidi, O.E.M. Evaluation of flood susceptibility mapping using logistic regression and GIS conditioning factors. Arab. J. Geosci. 2018, 11, 765. [Google Scholar] [CrossRef]
- Hong, H.; Panahi, M.; Shirzadi, A.; Ma, T.; Liu, J.; Zhu, A.X.; Chen, W.; Kougias, I.; Kazakis, N. Flood susceptibility assessment in Hengfeng area coupling adaptive neuro-fuzzy inference system with genetic algorithm and differential evolution. Sci. Total Environ. 2018, 621, 1124–1141. [Google Scholar] [CrossRef]
- Wang, Y.; Fang, Z.; Hong, H.; Costache, R.; Tang, X. Flood susceptibility mapping by integrating frequency ratio and index of entropy with multilayer perceptron and classification and regression tree. J. Environ. Manag. 2021, 289, 112449. [Google Scholar] [CrossRef] [PubMed]
- Ghosh, A.; Kar, S.K. Application of analytical hierarchy process (AHP) for flood risk assessment: A case study in Malda district of West Bengal, India. Nat. Hazards 2018, 94, 349–368. [Google Scholar] [CrossRef]
- Kazakis, N.; Kougias, I.; Patsialis, T. Assessment of flood hazard areas at a regional scale using an index–based approach and Analytical Hierarchy Process: Application in Rhodope–Evros region, Greece. Sci. Total Environ. 2015, 538, 555–563. [Google Scholar] [CrossRef]
- Echogdali, F.Z.; Boutaleb, S.; Elmouden, A.; Ouchchen, M. Assessing Flood Hazard at River Basin Scale: Comparison between HECRAS–WMS and Flood Hazard Index (FHI) Methods Applied to El Maleh Basin, Morocco. J. Water Resour. Prot. 2018, 10, 957–977. [Google Scholar] [CrossRef] [Green Version]
- Kundzewicz, Z.W.; Kanae, S.; Seneviratne, S.I.; Handmer, J.; Nicholls, N.; Peduzzi, P.; Mechler, R.; Bouwer, L.M.; Arnell, N.; Mach, K.; et al. Flood risk and climate change: Global and regional perspectives. Hydrol. Sci. J. 2014, 59, 1–28. [Google Scholar] [CrossRef] [Green Version]
- Sipos, G.; Blanka, V.; Mezősi, G.; Kiss, T.; van Leeuwen, B. Effect of climate change on the hydrological character of River Maros, Hungary-Romania. J. Environ. Geogr. 2014, 7, 49–56. [Google Scholar] [CrossRef] [Green Version]
- Yamamoto, K.; Sayama, T. Impact of climate change on flood inundation in a tropical river basin in Indonesia. Prog. Earth Planet. Sci. 2021, 8, 5. [Google Scholar] [CrossRef]
- Gusarov, A.V.; Sharifullin, A.G.; Komissarov, M.A. Contemporary long-term trends in water discharge, suspended sediment load, and erosion intensity in river basins of the North Caucasus region, SW Russia. Hydrology 2021, 8, 28. [Google Scholar] [CrossRef]
- Dill, H.G.; Kaufhold, S.; Techmer, A.; Baritz, R.; Moussadek, R. A joint study in geomorphology, pedology and sedimentology of a Mesoeuropean landscape in the Meseta and Atlas Foreland (NW Morocco). A function of parent lithology, geodynamics and climate. J. Afr. Earth Sci. 2019, 158, 103531. [Google Scholar] [CrossRef]
- Sdzuy, K.; Geyer, G. The base of the Cambrian in Morocco. In The Atlas System of Morocco; Jacobshagen, V.H., Ed.; Springer: Berlin/Heidelberg, Germany, 1988; pp. 91–106. [Google Scholar] [CrossRef]
- Benssaou, M.; Hamoumi, N. Le graben de l’Anti–Atlas occidental (Maroc): Contrôle tectonique de la paléogéographie et des séquences au Cambrien inférieur. Comptes Rendus Geosci. 2003, 335, 297–305. [Google Scholar] [CrossRef]
- Soulaimani, A.; Bouabdelli, M. Le Plateau de Lakhssas (Anti–Atlas occidental, Maroc): Un graben fini–précambrien réactivé à l’hercynien. Ann. Soc. Géol. Nord. 2005, 2, 177–184. [Google Scholar]
- IUSS Working Group WRB. World Reference Base for Soil Resources 2014, update 2015. International soil classification system for naming soils and creating legends for soil maps. In World Soil Resources Reports; FAO: Rome, Italy, 2015; p. 182. [Google Scholar]
- Patrikaki, O.; Kazakis, N.; Kougias, I.; Patsialis, T.; Theodossiou, N.; Voudouris, K. Assessing flood hazard at river basin scale with an index–based approach: The case of Mouriki, Greece. Geosciences 2018, 8, 50. [Google Scholar] [CrossRef] [Green Version]
- Bennani, O.; Druon, E.; Leone, F.; Tramblay, Y.; Saidi, M.E.M. A spatial and integrated flood risk diagnosis: Relevance for disaster prevention at Ourika valley (High Atlas–Morocco). Disaster Prev. Manag. 2019, 28, 548–564. [Google Scholar] [CrossRef]
- Elkhrachy, I. Flash flood hazard mapping using satellite images and GIS tools: A case study of Najran City, Kingdom of Saudi Arabia (KSA). Egypt J. Remote Sens. Space Sci. 2015, 18, 261–278. [Google Scholar] [CrossRef] [Green Version]
- Yoo, C.; Cho, E.; Na, W.; Kang, M.; Lee, M. Change of rainfall–runoff processes in urban areas due to high–rise buildings. J. Hydrol. 2021, 597, 126155. [Google Scholar] [CrossRef]
- Aaron, C.; Venkatesh, M. Effect of Topographic Data, Geometric Configuration and Modeling Approach on Flood Inundation Mapping. J. Hydrol. 2009, 377, 131–142. [Google Scholar] [CrossRef]
- Demek, J. Manual of Detailed Geomorphological Mapping; Czechoslovak Academy of Sciences: Prague, Czech Republic, 1972. [Google Scholar]
- Saaty, T.L. How to make a decision: The analytic hierarchy process. Eur. J. Oper. Res. 1990, 48, 9–26. [Google Scholar] [CrossRef]
- Saaty, T.L. An exposition of the AHP in reply to the paper “remarks on the analytic hierarchy process”. Manag. Sci. 1990, 36, 259–268. [Google Scholar] [CrossRef]
- Saaty, T.L. A scaling method for priorities in hierarchical structures. J. Math. Psychol. 1977, 15, 234–281. [Google Scholar] [CrossRef]
- Saaty, T.L.; Vargas, L.G. (Eds.) The seven pillars of the analytic hierarchy process. In Models, Methods, Concepts & Applications of the Analytic Hierarchy Process; Springer: Boston, MA, USA, 2012; Volume 175, pp. 23–40. [Google Scholar] [CrossRef]
- Koks, E.E.; Jongman, B.; Husby, T.G.; Botzen, W.J. Combining hazard, exposure and social vulnerability to provide lessons for flood risk management. Environ. Sci. Policy 2015, 47, 42–52. [Google Scholar] [CrossRef]
- Hall, J.W.; Tarantola, S.; Bates, P.D.; Horritt, M.S. Distributed sensitivity analysis of flood inundation model calibration. J. Hydraul. Eng. 2005, 131, 117–126. [Google Scholar] [CrossRef]
- Moel, H.D.; Asselman, N.E.M.; Aerts, J.C.J.H. Uncertainty and sensitivity analysis of coastal flood damage estimates in the west of the Netherlands. Nat. Hazards Earth Syst. Sci. 2012, 12, 1045–1058. [Google Scholar] [CrossRef]
- Rahmati, O.; Zeinivand, H.; Besharat, M. Flood hazard zoning in Yasooj region, Iran, using GIS and multi-criteria decision analysis. Geomat. Nat. Hazards Risk 2016, 7, 1000–1017. [Google Scholar] [CrossRef] [Green Version]
- Sorooshian, S.; Nguyen, P.; Sellars, S.; Braithwaite, D.; Agha Kouchak, A.; Hsu, K. Satellite–based remote sensing estimation of precipitation for early warning systems. In Extreme Natural Hazards, Disaster Risks and Societal Implications; Ismail-Zadeh, A., Urrutia Fucugauchi, J., Kijko, A., Takeuchi, K., Zaliapin, I., Eds.; Cambridge University Press: Cambridge, UK, 2014; Volume 1, pp. 99–112. [Google Scholar]
- Cools, J.; Innocenti, D.; O’Brien, S. Lessons from flood early warning systems. Environ. Sci. Policy 2016, 58, 117–122. [Google Scholar] [CrossRef]
- Abbasi, N.A.; Xu, X.; Lucas-Borja, M.E.; Dang, W.; Liu, B. The use of check dams in watershed management projects: Examples from around the world. Sci. Total Environ. 2019, 676, 683–691. [Google Scholar] [CrossRef] [PubMed]
- Tarchiani, V.; Massazza, G.; Rosso, M.; Tiepolo, M.; Pezzoli, A.; Housseini Ibrahim, M.; Katiellou, G.L.; Tamagnone, P.; De Filippis, T.; Rocchi, L.; et al. Community and impact based early warning system for flood risk preparedness: The experience of the Sirba River in Niger. Sustainability 2020, 12, 1802. [Google Scholar] [CrossRef] [Green Version]
- Bracken, L.J.; Croke, J. The concept of hydrological connectivity and its contribution to understanding runoff-dominated geomorphic systems. Hydrol. Process. 2007, 21, 1749–1763. [Google Scholar] [CrossRef]
- Broadmeadow, S.; Nisbet, T.R. Opportunity Mapping for Woodland to Reduce Flooding in the Yorkshire and the Humber Region; Forest Research Monograph; Forest Research: Surrey, UK, 2010; Volume 1, 64p. [Google Scholar]
- Dixon, S.J.; Sear, D.A.; Odoni, N.A.; Sykes, T.; Lane, S.N. The effects of river restoration on catchment scale flood risk and flood hydrology. Earth Surf. Process. Landf. 2016, 41, 997–1008. [Google Scholar] [CrossRef]


| Factor (Units) | Class | Rating | Weight |
|---|---|---|---|
| Fa: Flow accumulation (Pixels) | 97,503–147,996 | 10 | 2.73 |
| 45,849–97,503 | 8 | ||
| 23,795–45,849 | 6 | ||
| 6384–23,795 | 4 | ||
| 0–6384 | 2 | ||
| DFR: Distance from rivers (m) | 0–33 | 10 | 2.54 |
| 33–133 | 8 | ||
| 133–377 | 6 | ||
| 377–632 | 4 | ||
| 632< | 2 | ||
| DND: Drainage network density (m/km2) | 4.53–5.67 | 10 | 1.43 |
| 3.40–4.53 | 8 | ||
| 2.26–3.40 | 6 | ||
| 1.13–2.26 | 4 | ||
| 0–1.13 | 2 | ||
| R: Rainfall (mm/year) | 134.60–137.71 | 10 | 0.71 |
| 131.50–134.60 | 8 | ||
| 128.40–131.50 | 6 | ||
| 125.29–128.40 | 4 | ||
| 122.19–125.29 | 2 | ||
| LU: Land use (Pixels) | Dwelling | 10 | 0.85 |
| Wadi | 8 | ||
| Bare ground | 6 | ||
| Vegetation | 2 | ||
| S: Slope (Degree) | 0–7 | 10 | 0.55 |
| 7–15 | 8 | ||
| 15–25 | 6 | ||
| 25–38 | 4 | ||
| 38–64 | 2 | ||
| P: Permeability (Pixels) | Impermeable | 10 | 0.40 |
| Low permeability | 8 | ||
| Average permeability | 6 | ||
| High permeability | 4 |
| Importance | Scale |
|---|---|
| Very important | 1 |
| Moderate | 1/2 |
| Less important | 1/3 |
| Moderately less important | 1/4 |
| Much less important | 1/5 |
| Factors | Flow Accumulation | Distance from Rivers | Drainage Network Density | Rainfall | Land Use | Slope | Permeability |
|---|---|---|---|---|---|---|---|
| Flow accumulation | 1 | 2 | 3 | 5 | 3 | 5 | 4 |
| Distance from rivers | 1/2 | 1 | 6 | 4 | 3 | 4 | 6 |
| Drainage network density | 1/3 | 1/6 | 1 | 3 | 2 | 3 | 3 |
| Rainfall | 1/5 | 1/4 | 1/3 | 1 | 2 | 2 | 2 |
| Land use | 1/3 | 1/3 | 1/2 | 1/2 | 1 | 3 | 2 |
| Slope | 1/5 | 1/4 | 1/3 | 1/2 | 1/3 | 1 | 3 |
| Permeability | 1/4 | 1/6 | 1/3 | 1/2 | 1/2 | 1/3 | 1 |
| n = 7 | λmax = 7.65 | RI = 1.32 | CR = 0.08 | ||||
| Factors | Flow Accumulation | Distance from Rivers | Drainage Network Density | Rainfall | Land Use | Slope | Permeability | Weight |
|---|---|---|---|---|---|---|---|---|
| Flow accumulation | 0.36 | 0.48 | 0.26 | 0.34 | 0.25 | 0.27 | 0.19 | 2.73 |
| Distance from rivers | 0.18 | 0.24 | 0.52 | 0.28 | 0.25 | 0.22 | 0.29 | 2.54 |
| Drainage network density | 0.12 | 0.04 | 0.09 | 0.21 | 0.17 | 0.16 | 0.14 | 1.43 |
| Rainfall | 0.07 | 0.06 | 0.03 | 0.07 | 0.17 | 0.11 | 0.10 | 0.71 |
| Land use | 0.12 | 0.08 | 0.04 | 0.03 | 0.08 | 0.16 | 0.10 | 0.85 |
| Slope | 0.07 | 0.06 | 0.03 | 0.03 | 0.03 | 0.05 | 0.14 | 0.55 |
| Permeability | 0.09 | 0.04 | 0.03 | 0.03 | 0.04 | 0.02 | 0.05 | 0.40 |
| n | 1 | 2 | 3 | 4 | 5 | 6 | 7 |
|---|---|---|---|---|---|---|---|
| RI | 0 | 0 | 0.58 | 0.9 | 1.12 | 1.24 | 1.32 |
| Degree of Flood Risk | Area (km2) | Percentage (%) |
|---|---|---|
| Very high | 10.57 | 8.04 |
| High | 27.13 | 20.63 |
| Medium | 41.34 | 31.47 |
| Low | 20.36 | 15.36 |
| Very Low | 32.16 | 24.50 |
Publisher’s Note: MDPI stays neutral with regard to jurisdictional claims in published maps and institutional affiliations. |
© 2022 by the authors. Licensee MDPI, Basel, Switzerland. This article is an open access article distributed under the terms and conditions of the Creative Commons Attribution (CC BY) license (https://creativecommons.org/licenses/by/4.0/).
Share and Cite
Ikirri, M.; Faik, F.; Echogdali, F.Z.; Antunes, I.M.H.R.; Abioui, M.; Abdelrahman, K.; Fnais, M.S.; Wanaim, A.; Id-Belqas, M.; Boutaleb, S.; et al. Flood Hazard Index Application in Arid Catchments: Case of the Taguenit Wadi Watershed, Lakhssas, Morocco. Land 2022, 11, 1178. https://doi.org/10.3390/land11081178
Ikirri M, Faik F, Echogdali FZ, Antunes IMHR, Abioui M, Abdelrahman K, Fnais MS, Wanaim A, Id-Belqas M, Boutaleb S, et al. Flood Hazard Index Application in Arid Catchments: Case of the Taguenit Wadi Watershed, Lakhssas, Morocco. Land. 2022; 11(8):1178. https://doi.org/10.3390/land11081178
Chicago/Turabian StyleIkirri, Mustapha, Farid Faik, Fatima Zahra Echogdali, Isabel Margarida Horta Ribeiro Antunes, Mohamed Abioui, Kamal Abdelrahman, Mohammed S. Fnais, Abderrahmane Wanaim, Mouna Id-Belqas, Said Boutaleb, and et al. 2022. "Flood Hazard Index Application in Arid Catchments: Case of the Taguenit Wadi Watershed, Lakhssas, Morocco" Land 11, no. 8: 1178. https://doi.org/10.3390/land11081178
APA StyleIkirri, M., Faik, F., Echogdali, F. Z., Antunes, I. M. H. R., Abioui, M., Abdelrahman, K., Fnais, M. S., Wanaim, A., Id-Belqas, M., Boutaleb, S., Sajinkumar, K. S., & Quesada-Román, A. (2022). Flood Hazard Index Application in Arid Catchments: Case of the Taguenit Wadi Watershed, Lakhssas, Morocco. Land, 11(8), 1178. https://doi.org/10.3390/land11081178