Abstract
Based on the general patterns of urban expansion and carbon emissions at home and abroad, the IPCC carbon emission coefficient estimation method and logistic equation are applied to verify the logistic curve relationship between urban expansion and carbon emissions and to quantitatively measure the upper limit of carbon emissions and the inflection point of carbon emission growth. The results show that (1) the corresponding cumulative carbon emission intensity of foreign (regional) urban expansion gradually decreases during the transition from the primary stage to the saturation stage; (2) urban expansion and carbon emissions in China are characterized by cyclical fluctuations during the 1978–2014 period, and the fluctuations of the two show significant decoupling or divergence after 2014; and (3) urban expansion and carbon emission in Jiangsu province during the 2002–2019 period shows a logistic curve hypothesis relationship, and the cumulative carbon emissions in the built-up areas of Southern Jiangsu, Central Jiangsu and Northern Jiangsu show an inflection point when they reach 3128.12 km2, 627.25 km2 and 973.9 km2, with the cumulative carbon emission caps of 197.238 × 10⁸ t, 14.487 × 10⁸ t and 29.289 × 10⁸ t, respectively.
1. Introduction
Global warming is a hot issue of academic concern, and carbon emission is one of the important factors causing global warming [1]. China, as the world’s top carbon-emitting country, is under great pressure to reduce emissions [2]. In recent years, the level of land urbanization in China has increased rapidly, and the built-up area has increased from 7438 km2 in 1981 to 60,721 km2 in 2020, with an average annual growth rate of 5.4%. The rapid urban expansion has brought about a large amount of energy consumption and carbon emissions [3], which is not conducive to the long-term sustainable development of cities. In the Paris Agreement, China committed to reach peak carbon by 2030 and carbon neutrality by 2060 [4]. In order to achieve this goal, a quantitative analysis of the relationship between urban expansion and carbon emissions is needed.
There are two main views on the relationship between urban expansion and carbon emissions: First, urban expansion (urbanization) has a liner relationship with carbon emissions, i.e., urban expansion has both positive and negative effects on carbon emissions. On the one hand, urban expansion brings drastic land use changes, and carbon emissions caused by land use changes are second only to fossil fuel combustion [5,6]. At the same time, urban expansion is accompanied by a larger population size and industrial restructuring, and a significant increase in energy demand leads to an increase in carbon emissions [7]. On the other hand, urban expansion has a negative effect on carbon emissions, and urbanization helps to promote the reduction in carbon emissions [8,9,10]. Second, urban expansion (urbanization) has a nonlinear relationship with carbon emissions, i.e., urban expansion dose not just have a single positive or negative effect on carbon emissions. More scholars believe that there is an inverted U-shaped relationship between urban expansion and carbon emissions [11,12,13,14,15], in which carbon emissions increase at the level of urbanization in the early stage of urban expansion. When urbanization reaches a certain level, carbon emissions reduce due to the effect of technological progress and the scale of talent.
Studies on the relationship between urban expansion and carbon emissions have achieved fruitful results which provide references for this study, but most of its hypotheses are based on the positive relationship characteristic of urban expansion and carbon emissions with increasing contradictions. Even if some studies have analyzed the nonlinear relationship between urban expansion and carbon emissions, they have generally relied on the traditional decoupling analysis model (Tapio decoupling model) and EKC curves [16,17]. Moreover, no studies have been conducted to quantify the upper limit of carbon emissions and the inflection point of carbon emission growth during urban expansion.
In view of this, this paper attempts to propose and test a new hypothesis: the logistic curve relationship between urban expansion and carbon emissions and to quantitatively measure the upper limit of carbon emissions and the inflection point of carbon emissions growth. The paper is organized as follows: first, the general rule of urban expansion and carbon emission is grasped and the special reality of China is analyzed; second, based on domestic and foreign experience and theoretical analysis, the reasons for the diminishing impact of urban expansion on carbon emission are answered and the research hypothesis is refined; then, the hypothesis is tested and the application value of the empirical research is pointed out; finally, the conclusions are summarized to provide a scientific basis and direct reference for policy formulation.
2. The General Law of Urban Expansion and Carbon Emissions
2.1. International (Regional) Patterns of Urban Expansion and Carbon Emissions
International experience shows [18,19] that in the primary stage of urban expansion, the industrial structure of a country or region is dominated by the primary industry, and the demand for energy use is not significant, which has no significant impact on carbon emissions. In the development stage of urban expansion, the proportion of primary industry continues to decline, the secondary industry becomes the dominant industry, and the demand for energy increases dramatically, leading to a rapid increase in carbon emissions. After the urban expansion reaches a certain stage (saturation stage), the rapid development of the tertiary industry, which is mainly technology-intensive and knowledge-intensive, promotes the adjustment of energy structure and technological progress, which leads to the reduction in carbon emission. That is, the impact of urban expansion on carbon emissions is not significant in the early stage, gradually increasing the impact, and the impact on carbon emissions reaches a stable state when urban expansion develops to the saturation stage. Carbon emissions in the United States, Japan and the United Kingdom all show an increase followed by a decrease (as shown in Figure 1, data from the Global Carbon Project), similar to the logistic curve (“S” curve) hypothesis proposed by biologist Verhulst in 1938: during the transition from the primary to the saturation stage of urban expansion stage, the impact on carbon emissions is shown to diminish.
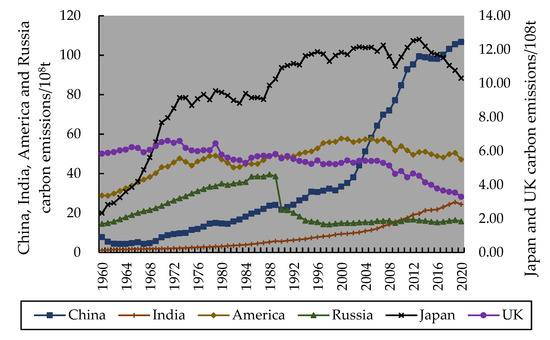
Figure 1.
Carbon dioxide emissions in various regions of the world from 1960 to 2020.
2.2. Patterns of Domestic (Regional) Urban Expansion and Carbon Emissions
Carbon emissions are closely related to urban expansion, especially when urban expansion is at a rapid growth stage; the development of secondary industries consumes a lot of energy and leads to a rapid increase in carbon emissions, as shown in Figure 2 (data from the Global Carbon Project, China Urban Construction Statistical Yearbook), and the two trends change almost simultaneously. It is important to note that the rate of change in carbon emissions and the rate of change in urban built-up area are chosen as the measurement indicators to grasp the change pattern of both for two reasons: first, the rate of change is bidirectional, which makes it easier to grasp the pattern of both; second, the urban built-up area is used instead of urban construction land, which takes into account the cumulative effect of urban construction and provides a scientific basis and direct reference for future land use policy formulation.
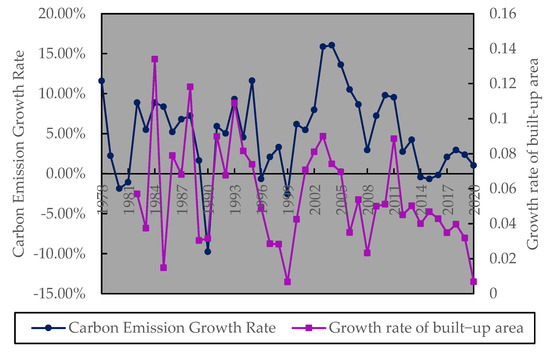
Figure 2.
The regularity between urban expansion and carbon emission from 1978 to 2020.
Figure 2 and existing studies [20,21] show that the general pattern of urban expansion and carbon emission growth in China is as follows.
First, macro judgment. China’s urban expansion and carbon emission growth are characterized by cyclical fluctuations, especially, the fluctuation cycle between 1978 and 2014 is basically the same, i.e., carbon emission growth and urban expansion are basically at the same pace. This indicates that during the rapid development stage of urban expansion, urban expansion is one of the important factors affecting carbon emissions.
Second, indirect analysis. From Figure 3, it can be seen that the carbon emission intensity of China’s urban built-up areas has the development trend of gradually decreasing. After reaching a small peak in 2011, the carbon emission intensity of China’s urban built-up areas gradually decreased from 212.79 × 10³ t/km2 in 2011 to 175.69 × 10³ t/km2 in 2020, with an average annual decline rate of 1.9%. This indicates that after a certain stage of urban built-up area expansion, fossil-energy-driven economic development will be replaced by clean energy, and the impact on carbon emissions will gradually diminish.
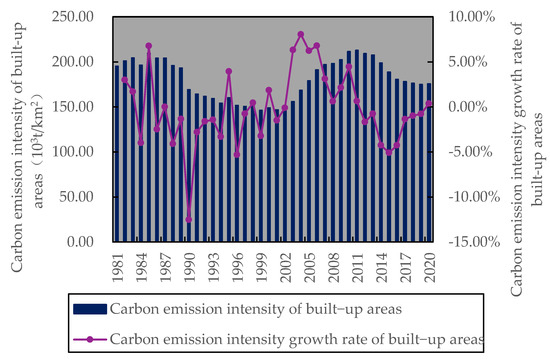
Figure 3.
Carbon emission intensity and growth rate of built-up areas from 1981 to 2020.
Third, regular discovery. The fluctuating cycles of urban expansion and carbon emission growth after 2014 are not identical, and there is a significant decoupling between them. That is, urban expansion gradually grows in fluctuation and carbon emission gradually decreases in fluctuation. This indicates that the influence of urban expansion on carbon emissions gradually decreases after a certain stage of development, and when the degree of such influence decreases to 0, an inflection point appears in the growth of carbon emissions in China, and the whole process is basically consistent with the trend of logistic curve changes. The following paper refines the research hypothesis on the basis of theoretical analysis, then verifies the hypothesis and points out its realistic guiding significance and finally summarizes the research conclusions.
3. Theoretical Analysis and Hypothesis Refinement
3.1. Theoretical Analysis
The above analysis shows that carbon emission growth has special characteristics in urban expansion stages (primary stage, development stage and saturation stage). Along with the increase in urbanization level, the impact of urban built-up area expansion on carbon emission will gradually diminish, and its theoretical reasons can be explained in the following three aspects (Figure 4):
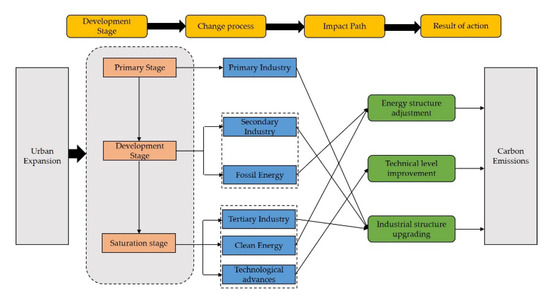
Figure 4.
Urban expansion and carbon emission impact mechanism.
First, energy structure adjustment. The adjustment of energy structure has a braking effect on carbon emissions [22,23]. In the primary stage of urban expansion, the industrial structure is dominated by the primary industry, and the demand for energy use is not significant, which does not have a significant impact on carbon emissions. In the development stage of urban expansion, fossil fuels with high carbon emission coefficients account for a high proportion of the energy consumption structure, and the energy consumption of large amounts of fossil fuels directly leads to a rapid increase in carbon emissions. Along with the rapid development of cities, the energy consumption structure dominated by fossil energy will accelerate to the energy consumption structure dominated by renewable energy. That is, in the saturation stage of urban expansion, the proportion of clean energy gradually rises, prompting a reduction in carbon emissions.
Second, technology level improvement. Along with the transition from the primary stage to the saturation stage of urban expansion, the technological progress effect has an important impact on carbon emissions [24,25]. On the one hand, technological progress brings advanced emission reduction technologies, and technological innovation improves the efficiency of energy elements’ utilization, which in turn has a positive emission reduction effect on carbon emissions. On the other hand, technological progress has increased the use of clean energy, and the rise in the share of clean energy in energy consumption has replaced a large amount of energy consumption of fossil fuels. Therefore, technological progress has contributed to the effective control of carbon emissions by increasing the efficiency of energy use and the proportion of clean energy.
Third, industrial structure upgrading. In the process of urban expansion, the industrial structure is continuously adjusted, and the center of gravity of the industrial structure is transferred from the primary industry to the secondary and tertiary industries one by one [26,27]. In the primary stage of urban expansion, the industrial structure is dominated by the primary industry, and the impact of less energy demand on carbon emissions is not yet significant. In the development stage of urban expansion, the industrial structure is dominated by the secondary industry, and the energy consumption brought by the development of the secondary industry is the largest in this stage, especially the energy consumption of fossil fuels accounts for a great proportion, which directly leads to the rapid increase in carbon emissions. When the urban expansion transitioned to the saturation stage, the development of cities began to focus on the adjustment of industrial structure, and the tertiary industry was developed rapidly. The development of the tertiary sector focuses on the use of clean energy and reduces the use of CO2-intensive elements, which in turn leads to a reduction in carbon emissions.
3.2. Hypothesis Refinement
The above realistic analysis and theoretical expectation show that there is a similar logistic curve relationship (slightly elongated “S” shape) between carbon emission growth during the whole process of urban expansion, as shown in Figure 5. The hypothesis to be verified is that carbon emission increases and then decreases throughout the urban expansion process (i.e., the relationship between urban expansion and carbon emission is logistic).
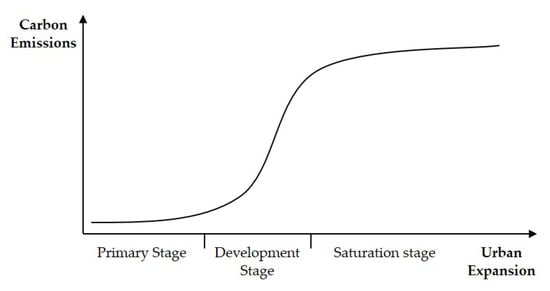
Figure 5.
Logistic curve of urban expansion and carbon emission.
Based on the above analysis, it can be inferred that there is a positive correlation between urban expansion and carbon emissions, and the impact of urban expansion on carbon emissions gradually weakens after a certain stage of urban expansion. Therefore, we need to grasp the growth law of carbon emissions with urban expansion and propose corresponding measures for the growth law of carbon emissions in different urban expansion stages, so as to achieve the “double carbon” target and sustainable development of cities as scheduled.
4. Empirical Studies
4.1. Research Methodology
4.1.1. IPCC Carbon Emissions Factor Estimation Method
The sources of carbon emissions are complex and diverse. People’s living and production all produce corresponding carbon emissions, and energy consumption of fossil fuels is the main form of carbon emissions [28], and considering the limitation of data acquisition, this study mainly considers the carbon emissions of the following fossil fuels: raw coal, coke, crude oil, gasoline, kerosene, diesel, fuel oil and liquefied petroleum gas, respectively. The specific estimation method refers to existing studies [29,30], and its estimation equation is as follows:
where is the total carbon emission, is the consumption of energy type i (consumption after conversion to standard coal) and is the CO2 emission factor of energy type i; the corresponding conversion factor and carbon emission factor are different for different energy types (see Table 1 for details).

Table 1.
Conversion coefficient of standard coal and carbon emission coefficient of various energy sources.
4.1.2. Logistic Equation
The logistic curve was proposed by Dutch biologist Verhulst in 1938, the growth process of the curve is divided into three stages, characterized by a slow increase in the first stage, a rapid increase in the second stage and a gradual slowdown in the third stage of growth until it stabilizes, which can reflect the general rule of occurrence, development and maturity of things, so it is also known as the growth curve [31]. The expression of the logistic equation is as follows:
where: is the variable to be measured; is the time series; is the upper limit of the variable to be measured; is the growth rate; and is the integration constant. For both sides of the Equation (2), find the reciprocal, shift the terms and take the logarithm to obtain Equation (3):
let = , = , = , , we obtain Equation (4):
after the deformation and simplification process, the standard expression of the logistic curve is further derived as follows:
After obtaining the standard expression of the logistic curve, the second-order derivative of it has the corresponding model significance. The first-order derivative is to find the slope of the function at each point, and the second-order derivative is to find the law of increase or decrease in the slope at each point, as shown in Figure 6:
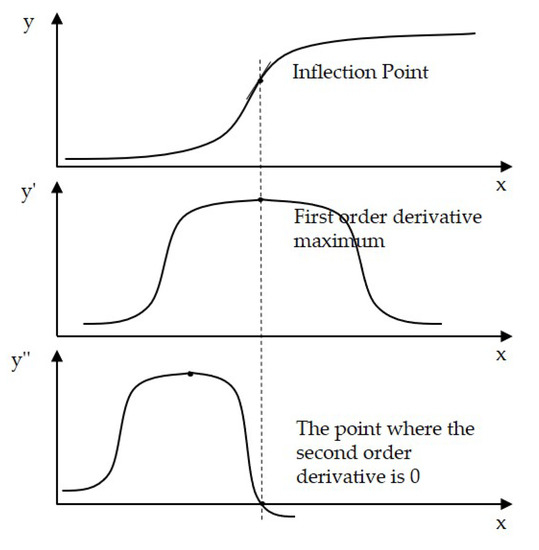
Figure 6.
Significance of the second-order derivative of the logistic equation.
From Figure 6, it can be seen that after finding the second order derivative of the logistic equation, the inflection point of the growth of the logistic curve can be obtained by making the second order derivative 0. The specific expressions for the first order derivative and second order derivative of the logistic equation are as follows:
There are two methods for fitting logistic curves in SPSS software, which are nonlinear regression and curve estimation. Li, X. et al. [32] used curve estimation to validate the logistic curve relationship between economic growth and urban expansion in Shanghai, Nanjing, Wuxi and Xuzhou. The logistic curves of each of the four cities fit well, but the selection of parameter K in the model is based on the judgment of the historical trend, and the upper limit of city size determined by it may be somewhat different from the actual value under the condition of meeting the highest significance of the model estimation for multiple trials. It can be seen that the goodness of the curve estimation depends largely on the estimation of the parameter K, but it is often difficult to estimate the value of K correctly. Unlike it, this paper uses nonlinear regression to fit the logistic curve, which has the advantage that the initial values of parameters K, b and c are easier to determine, and even if the initial values are taken inaccurately, they only affect the number of steps and time of iterations and do not affect the final results. In addition, the parameter K is the result of the iteration based on the logistic model (5), and the carbon emission cap determined by it is more consistent with the actual situation, which can provide a scientific basis for the policy formulation.
4.2. Data Source
In this paper, Jiangsu Province is chosen as the study area mainly based on the following considerations: First, horizontally, the situation in Jiangsu Province is very similar to the national situation, and the real situation in Southern Jiangsu, Central Jiangsu and Northern Jiangsu can be said to be a condensation of the regional differences in the country, so the study of Jiangsu’s situation has reference significance for the whole country. Second, vertically, Suzhou (economically developed), Nanjing (famous ancient capital), Wuxi (ecological limit) and Xuzhou (development growth) are representative of the country and even the world, and an in-depth analysis of the law of carbon emission growth in typical cities is of reference significance to other regions. Third, in terms of research feasibility, the research team of the author has conducted a long-time investigation and research in the region and has accumulated rich basic information and experience, which can provide important data support for the study.
In this paper, the built-up area (x) and cumulative carbon emissions (y) measured by energy consumption data of industrial enterprises during the 2002–2019 period are selected as the measures of urban expansion and carbon emissions, mainly based on the following two considerations: First, in China, the trend of industrial heavy duty in the process of urban expansion is an important feature that distinguishes China from Western cities in terms of carbon emissions [31], and the total carbon emissions from industrial development account for 85% of the total carbon emissions in China [33]. In view of this, this paper argues that the process of urban expansion in China is also the process of industrial development within a certain period of time, i.e., the impact of urban expansion on carbon emissions is mainly realized through the path of industrial development. Second, the research period of this paper is 2002–2019, and it can be seen from Figure 7 that the pace of built-up area expansion and industrial development in Jiangsu Province from 2002 to 2019 is basically the same (urban expansion and industrial development change simultaneously), so this paper measures the cumulative carbon emissions generated by the urban expansion process (industrial development) based on the energy consumption data of industrial enterprises as the index data of carbon emissions. The basic data of Jiangsu province, Southern Jiangsu, central Jiangsu Northern Jiangsu and 13 prefecture-level cities are shown in Tables S1 and S2.
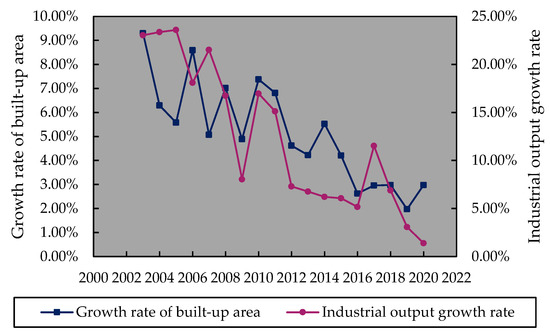
Figure 7.
Trends in the expansion of built-up areas and industrial development in Jiangsu from 2002 to 2020.
4.3. Hypothesis Validation—Validation from Jiangsu Province
By using SPSS26.0 software, a nonlinear regression analysis was conducted for Jiangsu province, Southern Jiangsu, Central Jiangsu, Northern Jiangsu and 13 prefecture-level cities, respectively. The upper-limit K (the initial value of parameter K) was determined based on the historical data (as shown in Tables S2 and S3) of Jiangsu province, Southern Jiangsu, Central Jiangsu, Northern Jiangsu and 13 prefecture-level cities, and the initial values of parameters b and c were obtained by substituting the two sets of historical data into Equation (5). The initial values of parameters K, b and c are set in the SPPS26.0 software, and the standard values of each parameter in the logistic equation and the R2 values can be obtained by substituting into Equation (5), as shown in Table 2 It should be noted that in the actual data processing, the unit of built-up area is 108 m2 and the unit of cumulative carbon emission is 108 t.
Table 2.
Logistic equation parameters of Jiangsu Province, Southern Jiangsu, Central Jiangsu, Northern Jiangsu and 13 prefecture level cities.
According to Table 2, the logistic equations of Jiangsu Province, Southern Jiangsu, Central Jiangsu, Northern Jiangsu and 13 prefecture-level cities can be obtained as shown in Table 3:
Table 3.
Logistic equation of Jiangsu Province, Southern Jiangsu, Central Jiangsu, Northern Jiangsu and 13 prefecture level cities.
In Table 2, from the respective R2 values, the best logistic curve fit was found in Northern Jiangsu, followed by Jiangsu and Yangzhou, Taizhou and Suqian, Southern Jiangsu, Nanjing and Yancheng, Central Jiangsu, Changzhou, Zhenjiang, Xuzhou, Nantong and Suzhou, Lianyungang, Wuxi and Huai’an. From the overall R2 values, it can be seen that the logistic curves of Jiangsu, Southern Jiangsu, Central Jiangsu, Northern Jiangsu and 13 prefecture-level cities are well-fitted and the logistic equations are significant. Therefore, it can be verified that there is a logistic curve relationship between urban expansion and cumulative carbon emissions in Jiangsu province, Southern Jiangsu, Central Jiangsu, Northern Jiangsu and 13 prefecture-level cities.
By substituting the built-up area data in Table S1 into the logistic equations in Table 3, the logistic fitting curves for Jiangsu Province, Southern Jiangsu, Central Jiangsu, Northern Jiangsu and 13 prefecture-level cities were calculated by excel software, as shown in Figure 8.
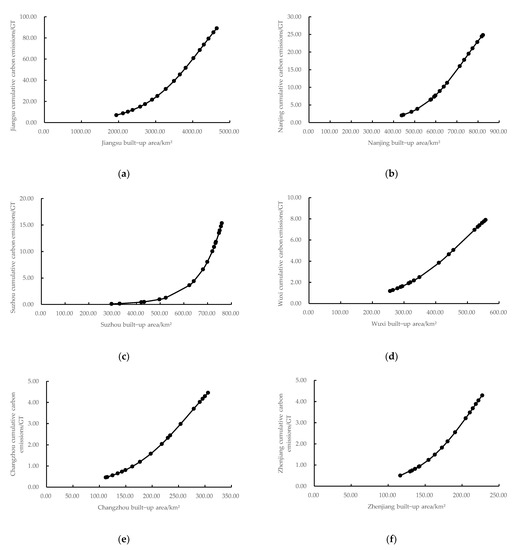
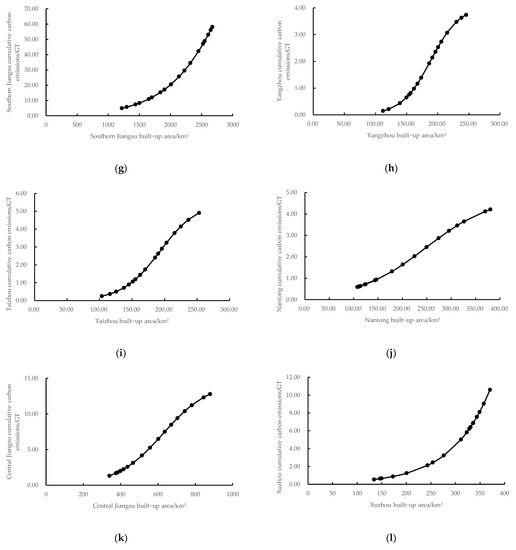
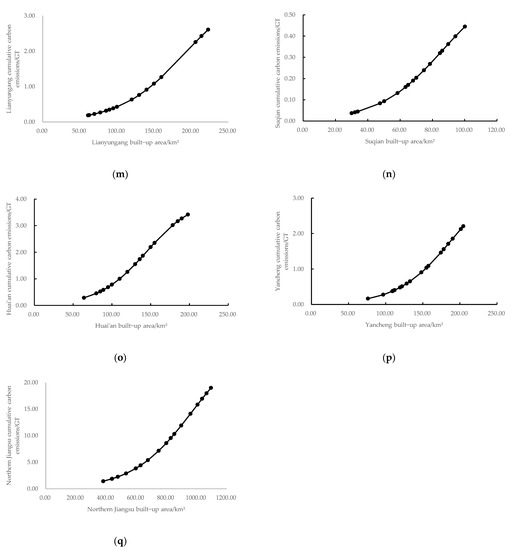
Figure 8.
(a–q) are the logistic curves of Jiangsu Province, Southern Jiangsu, Central Jiangsu, Northern Jiangsu and 13 prefecture-level cities (GT stands for 100 million tons).
4.4. Relevance of the Model
First, predicted total carbon emission. According to the logistic equations of Jiangsu Province, South Jiangsu, Central Jiangsu, North Jiangsu and 13 prefecture-level cities (see Table 3), it can be intuitively seen that the upper limits of their total carbon emissions in the near future are 142.703 × 10⁸ t, 197.238 × 10⁸ t, 14.487 × 10⁸ t, 29.289 × 10⁸ t, 35.759 × 10⁸ t, 18,075.303 × 108 t, 12.014 × 10⁸ t, 6.909 × 10⁸ t, 7.293 × 10⁸ t, 4.075 × 10⁸ t, 5.546 × 10⁸ t, 4.860 × 10⁸ t, 4403.807 × 108 t, 3.896 × 10⁸ t, 0.668 × 10⁸ t, 4.04 × 10⁸ t and 3.869 × 10⁸ t. In order of the upper-limit value, they are: Suzhou, Xuzhou, Nanjing, Wuxi, Zhenjiang, Changzhou, Taizhou, Nantong, Yangzhou, Huai’an, Lianyungang, Yancheng and Suqian. Among them, the upper limit of total carbon emissions in Suzhou and Xuzhou is much larger than other prefecture-level cities. As typical industrial and resource-based cities in Jiangsu Province, Suzhou and Xuzhou are urbanized with a large amount of fossil fuel energy consumption behind them. If the current energy structure and development model are not improved, it will take a great effort to achieve the “carbon peak” target in 2030.
Second, grasp the inflection point of total carbon emission growth. According to the logistic equations (see Table 3) of Jiangsu province, Southern Jiangsu, Central Jiangsu, Northern Jiangsu and 13 prefecture-level cities, the second derivatives were sought and shown uniformly using the common equation [Equation (8)], and the corresponding coefficients (A, B, C) for each city in the equation are shown in Table S3. Let the left side of the equation equal 0, the inflection point of the logistic curve can be obtained, at which point the x values are 42.4766, 31.2812, 6.2725, 9.7390, 7.3530, 13.6395, 4.8918, 2.7019, 2.1375, 1.8891, 1.9321, 2.4862, 8.4204, 1.9197, 0.8640, 1.4463 and 1.8979.This indicates that the built-up areas of Jiangsu Province, South, Central and North Jiangsu Province and 13 prefecture-level cities reach 4247.66 km2, 3128.12 km2, 627.25 km2, 973.9 km2, 735.3 km2, 1363.95 km2, 489.18 km2, 270.19 km2, 213.75 km2, 188.91 km2, 193.21 km2, 248.62 km2, 842.04 km2, 191.97 km2, 86.4 km2, 144.63 km2 and 189.79 km2. The total carbon emission shows accelerated growth with the expansion of built-up area; after reaching the inflection point value, the total carbon emission shows decelerated growth with the expansion of built-up area. Among them, the total carbon emission growth in Suzhou, Xuzhou and Southern Jiangsu does not reach the inflection point value in the sample study period. According to the built-up area corresponding to the inflection point value, the time corresponding to the inflection point value can be obtained by making a scatter plot and adding a trend line (the horizontal coordinate is the time and the vertical coordinate is the built-up area). The inflection points of total carbon emission growth are Yangzhou (2012), Nantong and Huai’an (2013), Taizhou (2014), Nanjing and Wuxi (2015), Changzhou, Lianyungang, Suqian and Northern Jiangsu (2016) and Zhenjiang and Yancheng (2017), in order of their appearance. In addition, Suzhou, Xuzhou and Southern Jiangsu did not reach the inflection point during the sample study period of this paper.
Third, reveal the law of total carbon emission growth. According to the inflection point of the logistic curve, the total carbon emission of Yangzhou is in the period of rapid growth from 2002 to 2012, and in the period of deceleration from 2013 to 2019, and finally tends to stop; the total carbon emission of Central Jiangsu, Nantong and Huai’an is in the period of rapid growth from 2002 to 2013, and in the period of deceleration from 2014 to 2019, with little growth recently. The total carbon emission of Taizhou is in the period of rapid growth from 2002 to 2014, and in the period of deceleration from 2015 to 2019, with little growth recently. The total carbon emission of Nanjing and Wuxi is in the period of rapid growth from 2002 to 2015, and in the period of deceleration from 2016 to 2019, with room for growth recently. The total carbon emission of Jiangsu, Changzhou, Lianyungang, Suqian and Northern Jiangsu is in the period of rapid growth from 2002 to 2016, and in the period of deceleration from 2017 to 2019, with room for growth recently. The total carbon emission of Zhenjiang and Yancheng is in the period of rapid growth from 2002 to 2017, and in the period of deceleration from 2018 to 2019, with room for growth recently.
5. Conclusions and Discussion
Based on the general characteristics of urban expansion and carbon emissions and the special reality of China, this paper proposes a new research hypothesis (logistic curve) of urban expansion and carbon emissions based on domestic and foreign experience and theoretical analysis and selects Jiangsu province for empirical analysis and hypothesis verification. The findings of the study are as follows:
First, the theoretical analysis shows that carbon emissions in the process of rapid urbanization transition from the primary stage of industrialization to the advanced or postindustrial stage, which shows that the strong dependence on urban expansion changes to weak dependence, that is, the dependence on urban construction land demand gradually decreases, and this process is similar to the logistic equation (“S” curve) hypothesis proposed by biologists: urban space gradually grows in fluctuation, carbon emissions gradually decrease in fluctuation, and when the degree of dependence between them decreases to 0, urban carbon emissions have an inflection point, and the whole process is basically in line with the trend of logistic curve changes.
Second, the stage comparison shows that urban expansion and carbon emissions in China have cyclical fluctuation characteristics during the 1978–2014 period, and after 2014 there is a clear decoupling or divergence. From the historical lineage of carbon emissions growth and urban expansion and general experience, it can be seen that the strong impact of built-up area expansion on carbon emissions changes to a weak impact during the transition from the primary stage to the development stage to the saturation stage, i.e., the impact on carbon emissions gradually decreases. This leads to the hypothesis that there is a logistic curve (“S” curve) between the growth of carbon emissions and the process of urban expansion.
Third, the empirical verification found that the built-up areas of Jiangsu, Southern Jiangsu, Central Jiangsu, Northern Jiangsu and 13 prefecture-level cities reached 4247.66 km2, 3128.12 km2, 627.25 km2, 973.9 km2, 735.3 km2, 1363.95 km2, 489.18 km2, 270.19 km2, 213.75 km2, 188.91 km2, 193.21 km2, 248.62 km2, 842.04 km2, 191.97 km2, 86.4 km2, 144.63 km2 and 189.79 km2. The cumulative carbon emissions showed an inflection point, which verified the research hypothesis. Furthermore, it was found that Yangzhou reached the inflection point at the earliest in 2012, followed by Central Jiangsu, Nantong and Huai’an in 2013, Taizhou in 2014, Jiangsu, Nanjing and Wuxi in 2015, Changzhou, Lianyungang, Suqian and Northern Jiangsu in 2016 and Zhenjiang and Yancheng in 2017; Suzhou, Xuzhou and Southern Jiangsu did not reach the inflection point in the sample study period of this paper.
Fourth, the quantitative regulation proposal suggests that, based on the results of the logistic curve (“S” curve) hypothesis validation, the proposed upper limits of the quantitative regulation of carbon emissions in Jiangsu, Southern Jiangsu, Central Jiangsu, Northern Jiangsu and 13 prefecture-level cities are 142.703 × 10⁸ t, 197.238 × 10⁸ t, 14.487 × 10⁸ t, 29.289 × 10⁸ t, 35.759 × 10⁸ t, 18,075.303 × 108 t, 12.014 × 10⁸ t, 6.909 × 10⁸ t, 7.293 × 10⁸ t, 4.075 × 10⁸ t, 5.546 × 10⁸ t, 4.860 × 10⁸ t, 4403.807 × 108 t, 3.896 × 10⁸ t, 0.668 × 10⁸ t, 4.04 × 10⁸ t and 3.869 × 10⁸ t.
Many scholars have discussed the nonlinear relationship between urban expansion and carbon emissions (inverted U-shaped relationship), but no quantitative analysis has been conducted on the pattens of carbon emissions growth (cumulative carbon emission cap and carbon emission growth inflection point) during the urban expansion process. Based on the nonlinear relationship between urban expansion and carbon emissions, this paper verifies the logistic curve relationship between urban expansion and carbon emissions, which provides a new perspective and quantitative empirical method for predicting total carbon emissions, grasping the inflection point of total carbon emissions growth and revealing the law of total carbon emissions growth, and it also provides quantitative reference and scientific basis for relevant regions and departments to formulate policies. This study also has some limitations. In this paper, when verifying the logistic curve hypothesis of urban expansion and carbon emissions, the influence of urban–rural integration is not considered in the selection of indicators of urban expansion (built-up area) due to the restriction of data acquisition. In addition, this paper measures carbon emissions based on energy consumption data of industrial enterprises under the premise that urban expansion is synchronized with industrial development. In the case that urban expansion is not synchronized with industrial development, the carbon emissions caused by other pathways during urban expansion need to be measured comprehensively. The next step is to combine more comprehensive data on urban expansion and carbon emissions and analyze the quantitative relationship between urban expansion and carbon emissions from a system perspective (considering cities as a system) to provide a more scientific basis for addressing climate change.
Supplementary Materials
The following supporting information can be downloaded at: https://www.mdpi.com/article/10.3390/land11071066/s1, Table S1: Built up area of Jiangsu Province, Southern Jiangsu, Central Jiangsu, Northern Jiangsu and 13 prefecture level cities (km2);Table S2: Cumulative carbon emissions of Jiangsu, Southern Jiangsu, Central Jiangsu, Northern Jiangsu and 13 prefecture level cities (104t); Table S3: Coefficients of quadratic derivative equation of Logistic equation in Jiangsu, Southern Jiangsu, Central Jiangsu, Northern Jiangsu and 13 prefecture level cities .
Author Contributions
Conceptualization, X.L. and Y.L.; methodology, X.Z.; software, X.Z.; Validation, X.Z.; formal analysis, X.Z.; resources, X.L.; data curation, X.Z.; writing—original draft preparation, X.Z.; writing—review and editing, X.L. and X.Z.; supervision, X.L. and Y.L.; project administration, X.L. and Y.L.; funding acquisition, X.L. and Y.L. All authors have read and agreed to the published version of the manuscript.
Funding
This research was funded by the National Natural Science Foundation of China (Grant No. 71704177, 71874192), Excellent Youth Fund for Social Sciences of Jiangsu Province (Grant No. 19GLA006) and Fundamental Research Funds for Central Universities (Grant No.2019ZDPY-RH02, 2020ZDPY0219, 2022-11362).
Institutional Review Board Statement
Not applicable.
Informed Consent Statement
Informed consent was obtained from all subjects involved in the study.
Data Availability Statement
The data presented in this study are available on request from the first author.
Conflicts of Interest
The authors declare no conflict of interest.
References
- Cai, B.; Cao, L.; Lei, Y.; Wang, C.; Zhang, L.; Zhu, J.; Li, M.; Du, M.; Lv, C.; Jiang, H.; et al. Carbon dioxide emission pathways under China’s carbon neutrality target. China Popul. Resour. Environ. 2021, 31, 7–14. [Google Scholar]
- Liu, Y.; Li, Y.; Wang, W. Challenges, opportunities and actions for China to achieve the “double carbon” target. China Popul. Resour. Environ. 2021, 31, 1–5. [Google Scholar]
- Wang, Z.; Pu, C. Construction and empirical evidence of carbon emission accounting system for urbanization in China. Stat. Decis. 2022, 38, 57–61. [Google Scholar]
- Huan, H.; Yi, M.; Cao, J.; Zou, Y.; Huang, X. Spatial and temporal variation of implied carbon emissions from regional trade and its impact effect on the Yangtze River Economic Belt. Econ. Geogr. 2021, 41, 49–57. [Google Scholar]
- Zhou, J.; Wang, Y.; Liu, X.; Shi, X.; Cai, C. Research on spatial and temporal differences of carbon emissions and carbon compensation in Chinese provinces based on land use changes. Scientia Geogr. Sin. 2019, 39, 1955–1961. [Google Scholar]
- Yuan, S.; Tang, Y. Spatial differentiation of land use carbon emissions in the Yangtze River Economic Zone from a low-carbon perspective. Econ. Geogr. 2019, 39, 190–198. [Google Scholar]
- Zhou, L. Study on the impact of urban construction land expansion on carbon emission based on VAR model: A case study of Nanchang city. Acta Agric. Jiangxi 2021, 33, 126–132. [Google Scholar]
- Wei, B.R.; Yagita, H.; Inaba, A. Urbanization Impact on Energy Demand and CDE Emission in China. J. Chonging Univ. 2003, 87, 46–50. [Google Scholar]
- Kahn, M.E. Urban Growth and Climate Change; California Center for Population Research: Los Angeles, CA, USA, 2008. [Google Scholar]
- Lu, Z. Research on the impact of Urbanization on carbon emission in China. Forum Sci. Technol. China 2011, 134–140. [Google Scholar] [CrossRef]
- Guo, J.; Liu, C.; Liu, Y. Urbanization, great Urbanization and Carbon Emissions: An empirical study based on transnational data. Urban Probl. 2013, 2–10. [Google Scholar] [CrossRef]
- Dong, X.; Yuan, G. China’s Greenhouse Gas emissions’ dynamic effects in the process of its urbanization: A perspective from shocks decomposition under long-term constraints. Energy Procedia 2011, 5, 1600–1665. [Google Scholar]
- Zhu, H.; You, W.; Zeng, Z. Urbanization and CO2 emissions: A semi-parametric panel data analysis. Econ. Lett. 2012, 117, 848–850. [Google Scholar] [CrossRef]
- Wang, Y.; Zhang, X.; Kubota, J. A semi-parametric panel data analysis on the urbanization-carbon emissions nexus for OECD countries. Renew. Sustain. Energy Rev. 2015, 48, 704–709. [Google Scholar] [CrossRef]
- Xu, B.; Lin, B. How industrialization and urbanization process impacts on CO2 emissions in China: Evidence from nonparametric addictive regression models. Energy Econ. 2015, 48, 188–202. [Google Scholar] [CrossRef]
- Liu, F.; Lv, N. Analysis of the drivers of carbon emissions from construction land and the contribution of decoupling effect. Ecol. Econ. 2022, 38, 35–40, 79. [Google Scholar]
- Yuan, K.; Gan, C.; Yang, H.; Liu, Y.; Chen, Y.; Zhu, Q. EKC verification and characteristic decomposition of construction land expansion and carbon emission growth: A case study of Wuhan city. China Land Sci. 2019, 33, 56–64. [Google Scholar]
- Sinqin, Z.; Niu, D.; Li, M.; Zhen, H.; Yang, X. Carbon dioxide emissions, urbanization level, and industrial structure: Empirical evidence from North China. Environ. Sci. Pollut. Res. Int. 2022, 29, 34528–34545. [Google Scholar] [CrossRef]
- Pang, Q.; Zhou, W.; Zhao, T.; Zhang, L. Impact of Urbanization and Industrial Structure on Carbon Emissions: Evidence from Huaihe River Eco-Economic Zone. Land 2021, 10, 1130–1140. [Google Scholar] [CrossRef]
- Zhang, S.; Chen, Y. Correlation effect of urban construction land expansion and energy consumption carbon emission. Res. Soil Water Conserv. 2017, 24, 244–249. [Google Scholar]
- Song, X.; Yi, H.; Ye, X.; Xiao, H. Decoupling analysis of energy carbon emission and urban expansion in China from 2001 to 2010. J. Guangzhou Univ. (Nat. Sci. Ed.) 2016, 15, 83–88. [Google Scholar]
- Zhang, X.; Huang, X.; Zhang, D.; Geng, C.; Tian, L.; Fan, Y.; Chen, W. Study on the transformation path and policies of energy economy under the carbon neutrality target. Manag. World 2022, 38, 35–66. [Google Scholar]
- Wan, Y. Green economic development, clean energy consumption and carbon dioxide emissions. Ecol. Econ. 2022, 38, 40–46. [Google Scholar]
- Ma, H.; Zhang, G. A study on the impact of biased technological progress on carbon emission efficiency—The Yangtze River Economic Belt as an example. Soft Sci. 2021, 35, 100–106. [Google Scholar]
- Shao, S.; Fan, M.; Yang, L. Economic restructuring, green technological progress and low-carbon transformational development in China-an empirical examination based on the perspective of overall technological frontier and spatial spillover effects. Manag. World 2022, 38, 46–69. [Google Scholar]
- Wang, J.; Zhang, Y.; Li, M.; Lin, C.; Du, X. Study on industrial structure adjustment and carbon emission reduction potential of resource-based cities in Shandong Province. China Min. Mag. 2022, 31, 58–68. [Google Scholar]
- Liu, Z.; Xu, J.; Zhang, C. Science and technology innovation, industrial structure upgrading and carbon emission efficiency—PVAR analysis based on inter-provincial panel data. J. Nat. Resour. 2022, 37, 508–520. [Google Scholar]
- Su, W.; Sun, R. Carbon emission driving factors of urbanization in typical urban agglomerations in China. Acta Ecol. Sin. 2018, 38, 1975–1983. [Google Scholar]
- Yang, Z.; Li, Z. Dynamic characteristic of carbon emission measurement and driving factors in central China. Ecol. Econ. 2022, 38, 13–20. [Google Scholar]
- Xu, G.; Cai, Z.; Feng, S. Research on the spatial and temporal differences of carbon emissions and influencing factors based on two-stage LMDI model—Jiangsu Province as an example. Soft Sci. 2021, 35, 107–113. [Google Scholar]
- Du, Q.; Chen, Q.; Yang, R. Carbon emission prediction of Chinese provinces based on logistic model. Resour. Environ. Yangtze Basin 2013, 22, 143–151. [Google Scholar]
- Li, X.; Qu, F.; Chen, Y.; Mou, S. Logistic curve hypothesis of economic development and urban expansion and its validation—An examination of typical cities in East China. J. Nat. Resour. 2012, 27, 713–722. [Google Scholar]
- Lin, X.; Bian, Y.; Wang, D. Spatial and temporal evolution characteristics and influencing factors of industrial carbon emission efficiency in Beijing-Tianjin-Hebei Urban Agglomeration. Econ. Geogr. 2021, 41, 187–195. [Google Scholar]
Publisher’s Note: MDPI stays neutral with regard to jurisdictional claims in published maps and institutional affiliations. |
© 2022 by the authors. Licensee MDPI, Basel, Switzerland. This article is an open access article distributed under the terms and conditions of the Creative Commons Attribution (CC BY) license (https://creativecommons.org/licenses/by/4.0/).