
Spatial and Temporal Changes of Urban Built-Up Area in the Yellow River Basin from Nighttime Light Data

 , ,
, ,
Abstract
:1. Introduction
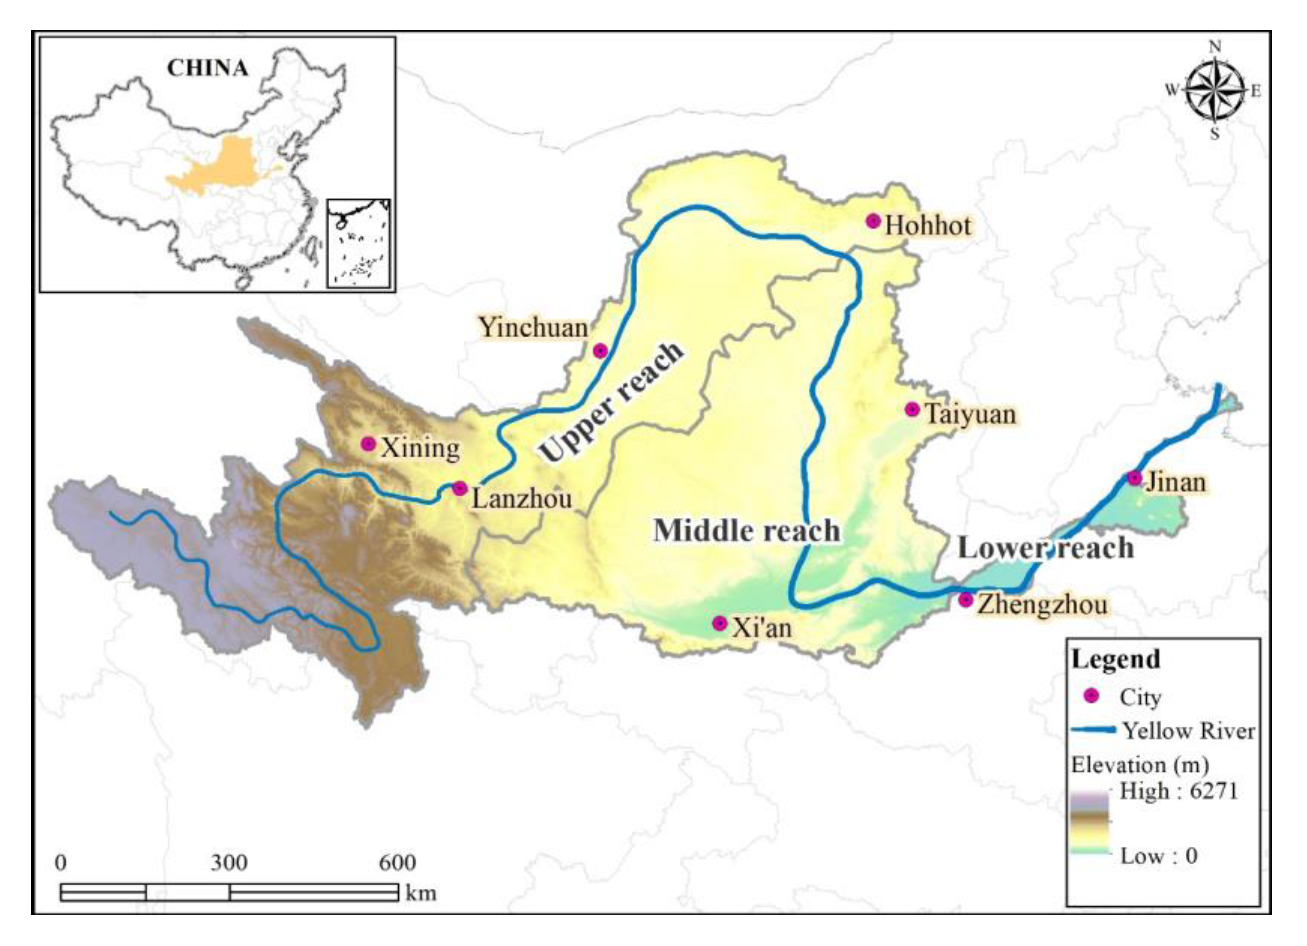
2. Study Area
3. Data Sources and Methods
3.1. NPP/VIIRS NTL Remote Sensing Images
3.2. Basic Data
3.2.1. The Validation Data of Land Use
3.2.2. Socioeconomic Statistics
3.3. Research Methodology
3.3.1. Light Threshold Extraction Using OTSU Thresholding Technique
3.3.2. Quadrant Analysis
3.3.3. Analysis of Urban Spatial Expansion
4. Result
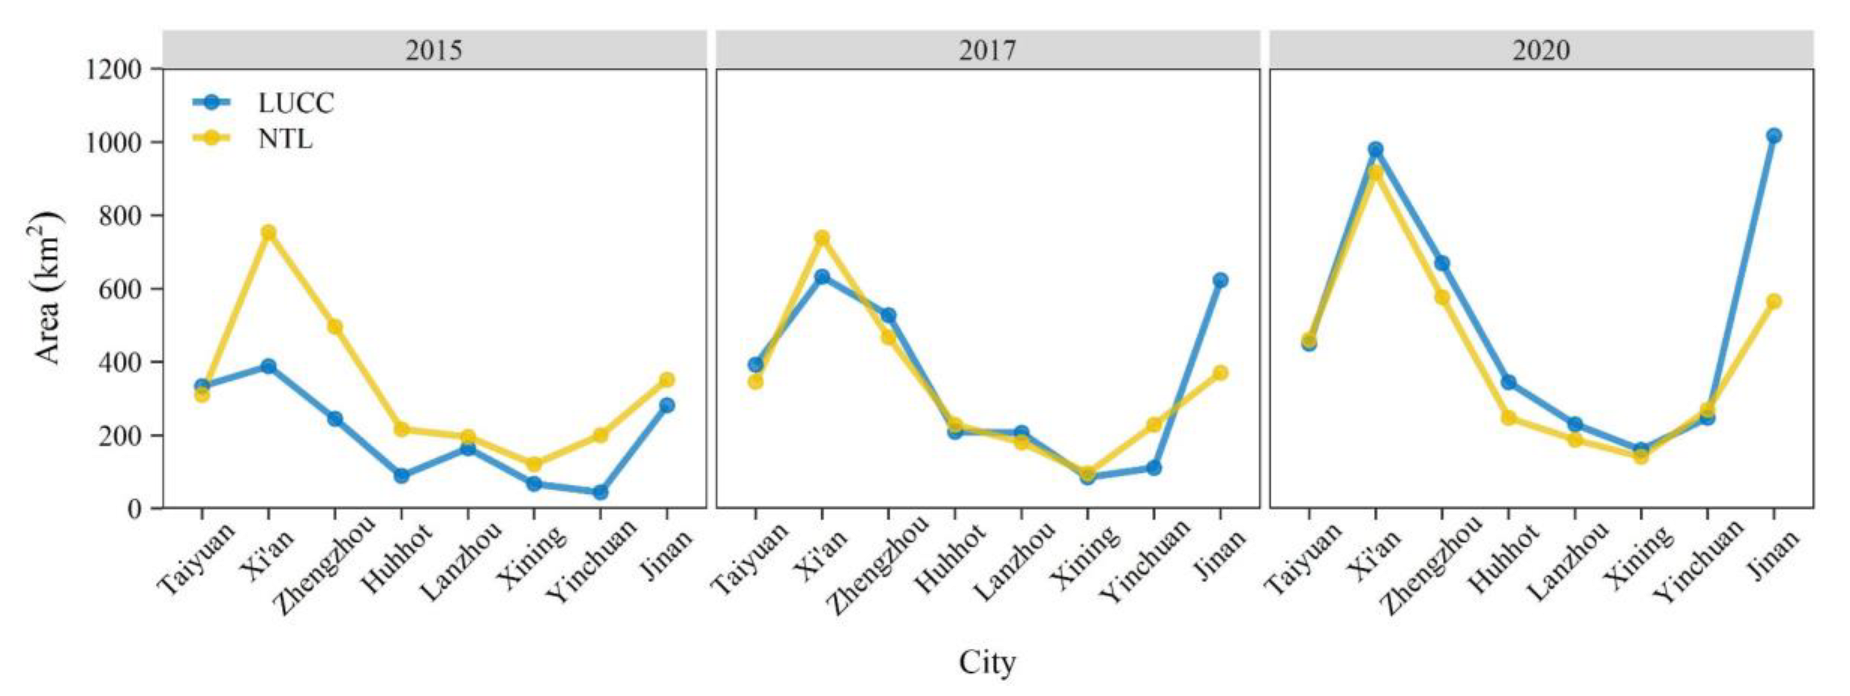
4.1. Evaluation of the Accuracy of Urban Built-Up Area Extraction
4.2. Temporal Characteristics of Urban Built-Up Area Expansion in the Yellow River Basin
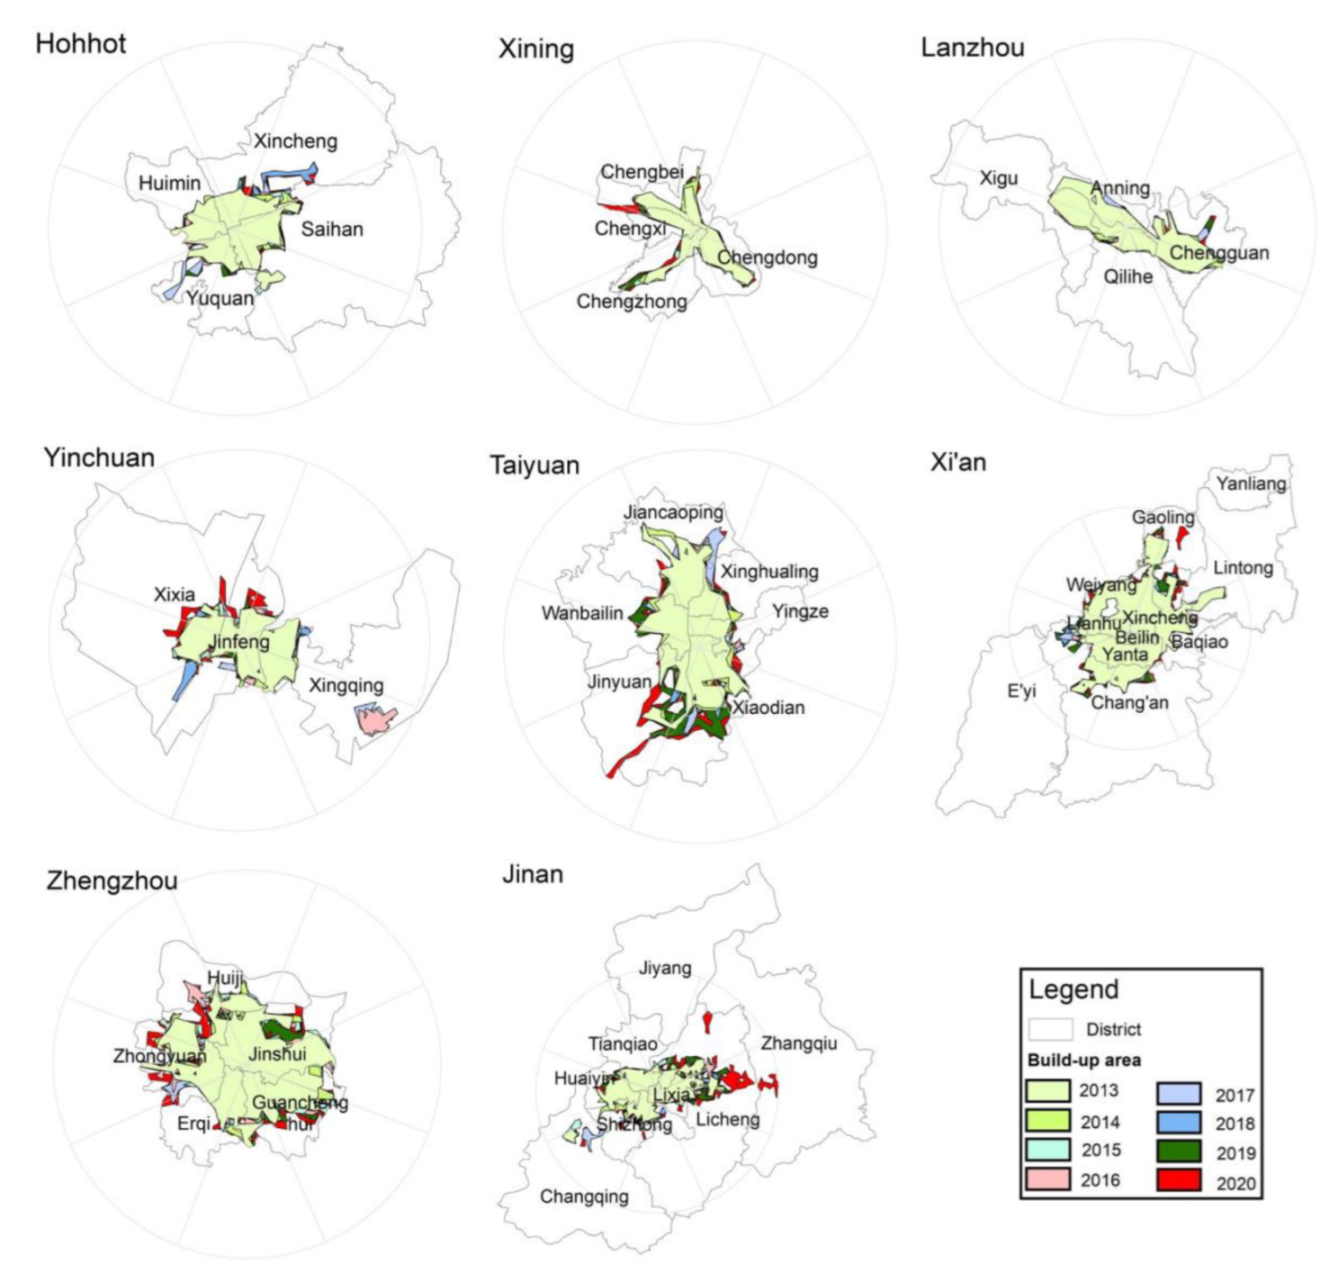
4.3. Spatial Expansion Characteristics of Urban Built-Up Areas
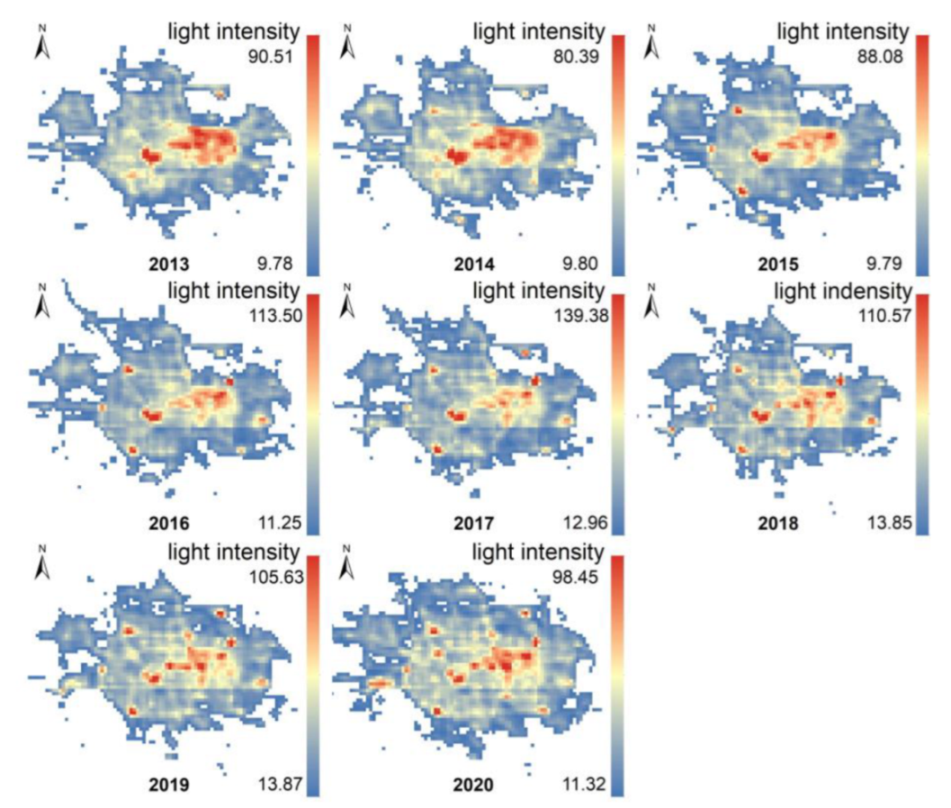
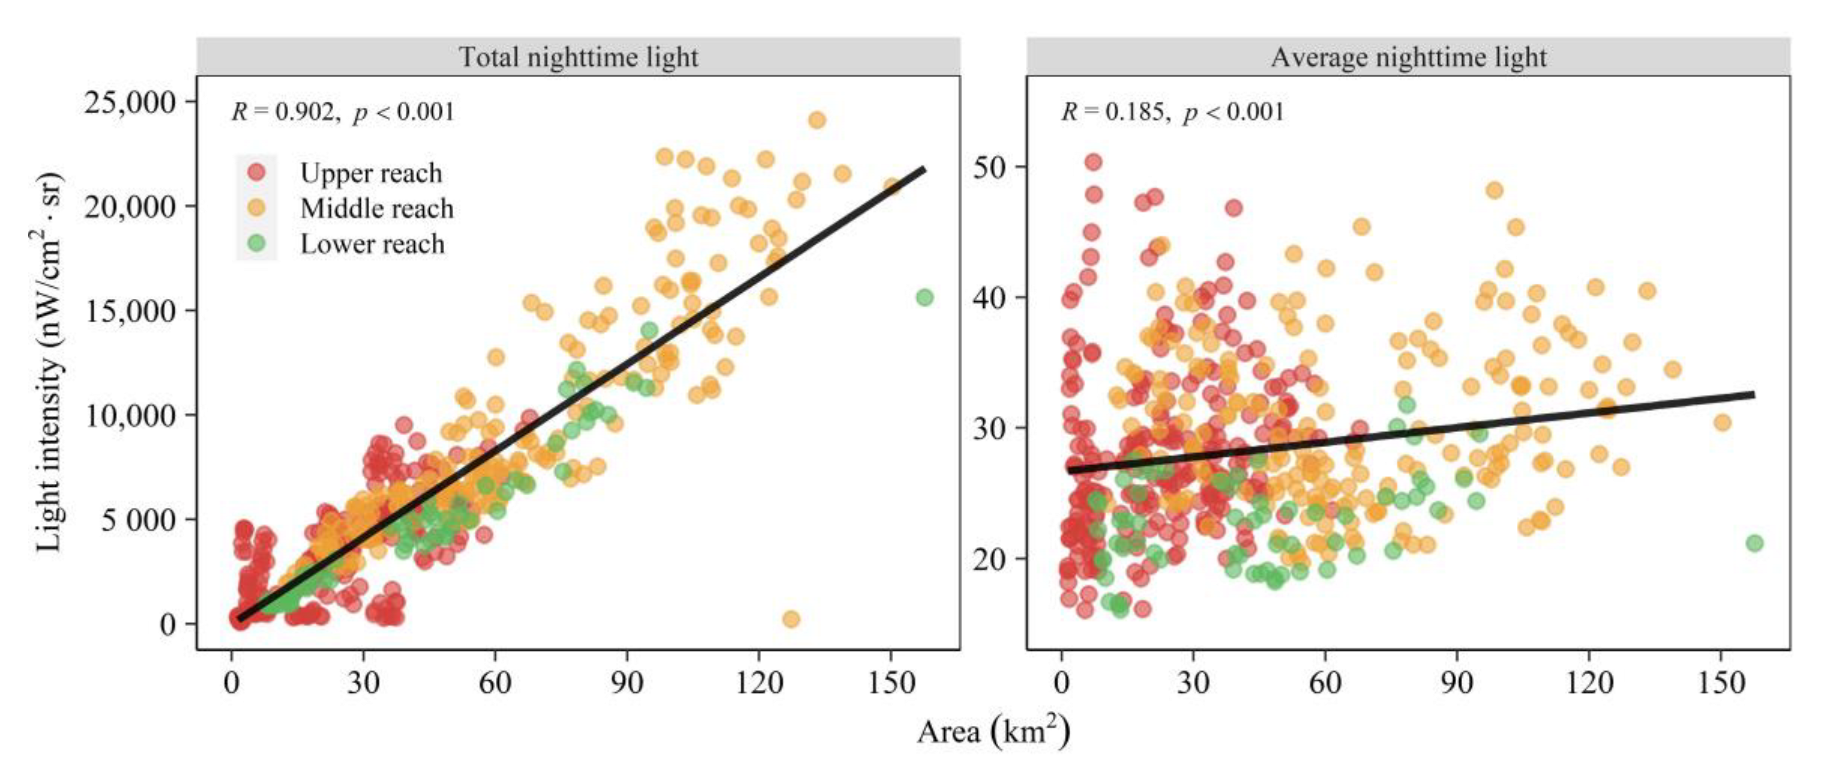
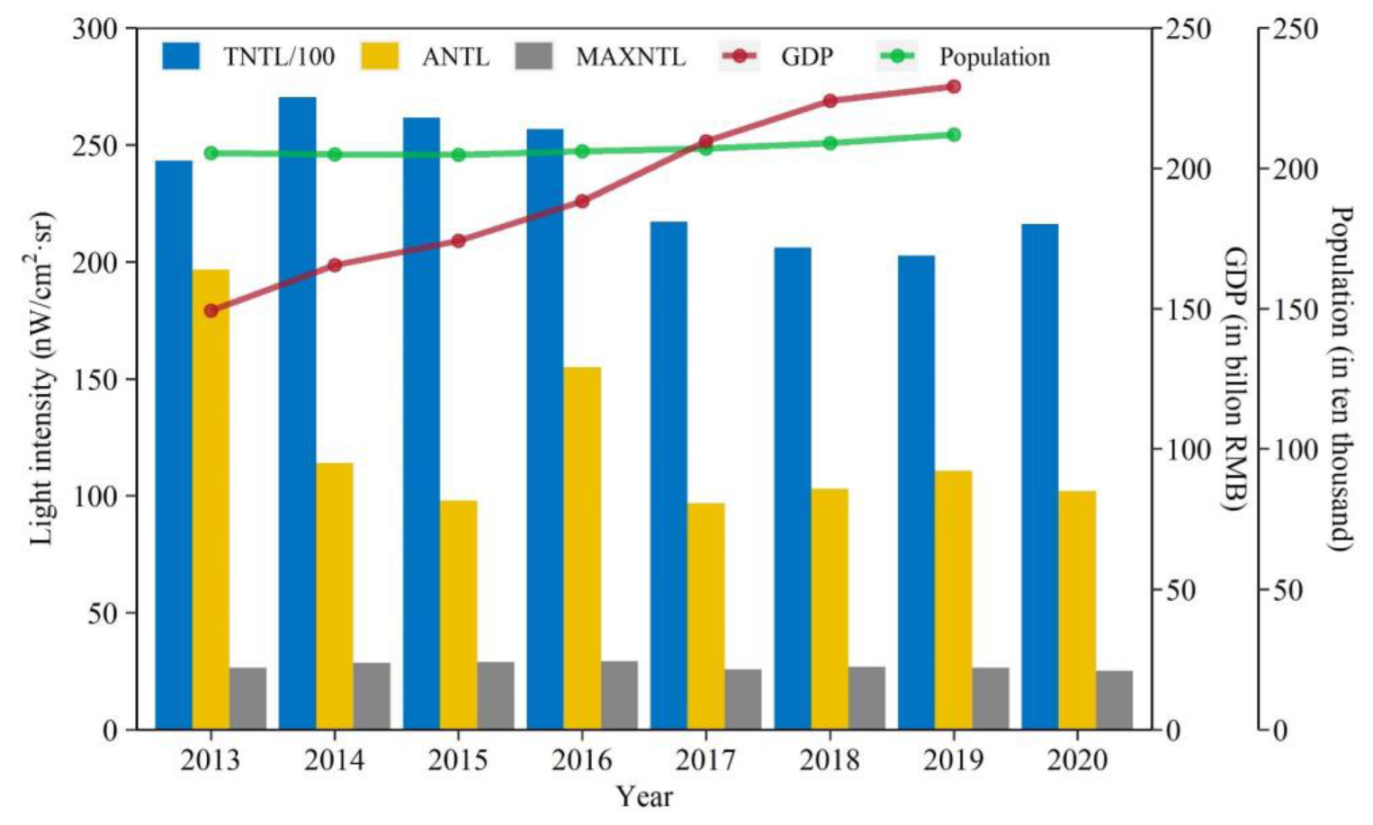
4.4. Light Intensity Changes in Urban Built-Up Area Expansion
4.5. Correlation between Urban Light Intensity and Human Activities
5. Discussion
5.1. Correlation between NTL and Human Activities in Urban Expansion
5.2. Natural Factor Constraints in the Urban Expansion of the Yellow River Basin
6. Conclusions
- (1)
- The Yellow River Basin’s NTL data can objectively depict the spatial and temporal dynamics of urban expansion in the basin. From 2013 to 2020, the built-up area of each province’s capital city in the Yellow River Basin steadily rose from upstream to downstream, with an increasing tendency over time. The cities in the upstream, middle, and downstream exhibit imbalanced urban development, with the upstream cities having a smaller urban expansion area, expansion rate, and intensity than the middle and downstream cities. The natural geographical factors surrounding cities have a spatial influence on the urban expansion process, and each city’s expansion has distinct spatial differentiation characteristics.
- (2)
- During the urbanization process, more developed middle and downstream cities have a significant positive correlation between light intensity, GDP, and population. The relationship between light intensity and GDP and population is weaker in upstream cities. During the development of cities in the Yellow River Basin’s middle and lower reaches, their built-up areas shaped a well-developed commercial economic structure and a high degree of coordination with the spatial pattern of human flow distribution, and light data can well demonstrate GDP and population development changes. The cities in the upper Yellow River Basin are constrained by their natural geographical environment; their urban development is slower than that of the cities in the middle and lower reaches, and the commercial structure within the cities must be adjusted to promote urban economic development and to accommodate population growth caused by urban development.
Author Contributions
Funding
Institutional Review Board Statement
Informed Consent Statement
Data Availability Statement
Conflicts of Interest
References
- Wei, H.J.; Xue, D.; Huang, J.C.; Liu, M.X.; Li, L. Identification of coupling relationship between ecosystem services and urbanization for supporting ecological management: A case study on areas along the Yellow River of Henan province. Remote Sens. 2022, 14, 2277. [Google Scholar] [CrossRef]
- Zhang, X.L.; Kong, Y.S.; Ding, X.H. How High-quality urbanization affects utilization efficiency of agricultural water resources in the Yellow River Basin under double control action? Sustainability 2020, 12, 2869. [Google Scholar] [CrossRef] [Green Version]
- Lyu, R.F.; Zhang, J.M.; Xu, M.Q.; Li, J.J. Impacts of urbanization on ecosystem services and their temporal relations: A case study in Northern Ningxia, China. Land Use Policy 2018, 77, 163–173. [Google Scholar] [CrossRef]
- Qiao, R.; Li, H.M.; Han, H. Spatio-Temporal coupling coordination analysis between urbanization and water resource carrying capacity of the provinces in the Yellow River Basin, China. Water 2021, 13, 376. [Google Scholar] [CrossRef]
- Xing, L.; Xue, M.G.; Hu, M.S. Dynamic simulation and assessment of the coupling coordination degree of the economy-resource-environment system: Case of Wuhan City in China. J. Environ. Manag. 2019, 230, 474–487. [Google Scholar] [CrossRef]
- Shi, L.P.; Cai, Z.Y.; Ding, X.H.; Di, R.; Xiao, Q.Q. What factors affect the level of green urbanization in the Yellow River Basin in the context of new-type urbanization? Sustainability 2020, 12, 2488. [Google Scholar] [CrossRef] [Green Version]
- Du, X.; Meng, Y.; Fang, C.; Li, C. Spatio-temporal characteristics of coupling coordination development between urbanization and Shandong Peninsula urban agglomeration. Acta Ecol. Sin. 2020, 40, 5546–5559. (In Chinese) [Google Scholar]
- Yue, W.Z.; Gao, J.B.; Yang, X.C. Estimation of gross domestic product using multi-sensor remote sensing data: A case study in Zhejiang province, East China. Remote Sens. 2014, 6, 7260–7275. [Google Scholar] [CrossRef] [Green Version]
- Zheng, Q.M.; Weng, Q.H.; Wang, K. Characterizing urban land changes of 30 global megacities using nighttime light time series stacks. ISPRS J. Photogramm. Remote Sens. 2021, 173, 10–23. [Google Scholar] [CrossRef]
- Levin, N.; Kyba, C.C.M.; Zhang, Q.L.; de Miguel, A.S.; Roman, M.O.; Li, X.; Portnov, B.A.; Molthan, A.L.; Jechow, A.; Miller, S.D.; et al. Remote sensing of night lights: A review and an outlook for the future. Remote Sens. Environ. 2020, 237, 111443–111476. [Google Scholar] [CrossRef]
- Hu, X.F.; Qian, Y.G.; Pickett, T.A.S.; Zhou, W.Q. Urban mapping needs up-to-date approaches to provide diverse perspectives of current urbanization: A novel attempt to map urban areas with nighttime light data. Landsc. Urban Plan. 2020, 195, 103079–103095. [Google Scholar] [CrossRef]
- Shi, K.F.; Huang, C.; Yu, B.L.; Yin, B.; Huang, Y.X.; Wu, J.P. Evaluation of NPP-VIIRS night-time light composite data for extracting built-up urban areas. Remote Sens. Lett. 2014, 5, 358–366. [Google Scholar] [CrossRef]
- Milesi, C.; Elvidge, C.D.; Nemani, R.R.; Running, S.W. Assessing the impact of urban land development on net primary productivity in the southeastern United States. Remote Sens. Environ. 2003, 86, 401–410. [Google Scholar] [CrossRef]
- Zhou, Y.; Li, C.G.; Zheng, W.S.; Rong, Y.F.; Liu, W. Identification of urban shrinkage using NPP-VIIRS nighttime light data at the county level in China. Cities 2021, 118, 103373–103383. [Google Scholar] [CrossRef]
- Su, Y.X.; Chen, X.Z.; Wang, C.Y.; Zhang, H.G.; Liao, J.S.; Ye, Y.Y.; Wang, C.J. A new method for extracting built-up urban areas using DMSP-OLS nighttime stable lights: A case study in the Pearl River Delta, southern China. GISci. Remote Sens. 2015, 52, 218–238. [Google Scholar] [CrossRef]
- Shi, K.F.; Yu, B.L.; Hu, Y.J.; Huang, C.; Chen, Y.; Huang, Y.X.; Chen, Z.Q.; Wu, J.P. 2015 Modeling and mapping total freight traffic in China using NPP-VIIRS nighttime light composite data. GISci. Remote Sens. 2015, 52, 274–289. [Google Scholar] [CrossRef]
- Xu, H.M.; Hu, S.G. Chinese city size evolution under perspective of nighttime light remote sensing. Geomat. Inform. Sci. Wuhan Univ. 2021, 46, 40–49. (In Chinese) [Google Scholar]
- Hu, Y.F.; Zhao, G.H.; Zhang, Q.L. Spatial distribution of population data based on nighttime light and LUC data in the SichuanChongqing region. J. Geo-Inf. Sci. 2018, 20, 68–78. (In Chinese) [Google Scholar]
- Henderson, J.V.; Storeygard, A.; Weil, D.N. Measuring economic growth from outer space. Am. Econ. Rev. 2012, 102, 994–1028. [Google Scholar] [CrossRef] [Green Version]
- Feng, Z.; Peng, J.; Wu, J.S. Using DMSP/OLS nighttime light data and K–means method to identify urban–rural fringe of megacities. Habitat Int. 2020, 103, 10227–10238. [Google Scholar] [CrossRef]
- Liu, Q.P.; Yang, Y.C.; Fu, D.X.; Li, H.Y.; Tian, H.Z. Urban spatial expansion based on DMSP_OLS nighttime light data in China in 1992-2010. Sci. Geogr. Sin. 2014, 34, 129–136. (In Chinese) [Google Scholar]
- Chen, Z.Q.; Yu, B.L.; Song, W.; Liu, H.X.; Wu, Q.S.; Shi, K.F.; Wu, J.P. A new approach for detecting urban centers and their spatial structure with nighttime light remote sensing. IEEE Trans. Geosci. Remote Sens. 2017, 55, 6305–6319. [Google Scholar] [CrossRef]
- Yu, B.L.; Tang, M.; Wu, Q.S.; Yang, C.S.; Deng, S.Q.; Shi, K.F.; Chen, P.; Wu, J.P.; Chen, Z.Q. Urban Built-Up Area Extraction From Log- Transformed NPP-VIIRS Nighttime Light Composite Data. IEEE Geosci. Remote Sens. Lett. 2018, 15, 1279–1283. [Google Scholar] [CrossRef]
- Peng, J.; Hu, Y.N.; Liu, Y.X.; Ma, J.; Zhao, S.Q. A new approach for urban-rural fringe identification: Integrating impervious surface area and spatial continuous wavelet transform. Landsc. Urban Plan. 2018, 175, 72–79. [Google Scholar] [CrossRef]
- Ma, T. Multi-level relationships between satellite-derived nighttime lighting signals and social media–derived human population dynamics. Remote Sens. 2018, 10, 1128. [Google Scholar] [CrossRef] [Green Version]
- Zhao, M.; Cheng, W.M.; Zhou, C.H.; Li, M.C.; Wang, N.; Liu, Q.Y. GDP spatialization and economic differences in south China based on NPP-VIIRS nighttime light imagery. Remote Sens. 2017, 9, 673. [Google Scholar] [CrossRef] [Green Version]
- Li, K.N.; Chen, Y.H.; Li, Y. The random forest-based method of fine-resolution population spatialization by using the international space station nighttime photography and social sensing data. Remote Sens. 2018, 10, 1650. [Google Scholar] [CrossRef] [Green Version]
- Li, Y.L.; Cheng, G.; Yang, J.; Yuan, D.F. Refined spatial simulation of regional economy based on nighttime lighting data from remote sensing: A case study of Henan province. Areal Res. Dev. 2020, 39, 41–47. (In Chinese) [Google Scholar]
- Liang, H.D.; Guo, Z.Y.; Wu, J.P.; Chen, Z.Q. GDP spatialization in Ningbo city based on NPP/VIIRS night-time light and auxiliary data using random forest regression. Adv. Space Res. 2020, 65, 481–493. [Google Scholar] [CrossRef]
- Mellander, C.; Lobo, J.; Stolarick, K.; Matheson, Z. Night-time light data: A good proxy measure for economic activity? PLoS ONE 2015, 10, 139779–139797. [Google Scholar] [CrossRef] [Green Version]
- Gorelick, N.; Hancher, M.; Dixon, M.; Ilyushchenko, S.; Thau, D.; Moore, R. Google Earth Engine: Planetary-scale geospatial analysis for everyone. Remote Sens. Environ. 2017, 202, 18–27. [Google Scholar] [CrossRef]
- Goldblatt, R.; You, W.; Hanson, G.; Khandelwal, A. Detecting the boundaries of urban areas in India: A dataset for pixel-based image classification in Google Earth Engine. Remote Sens. 2016, 8, 634. [Google Scholar] [CrossRef] [Green Version]
- Kumar, L.; Mutanga, O. Google Earth Engine applications since inception: Usage, trends, and potential. Remote Sens. 2018, 10, 1509. [Google Scholar] [CrossRef] [Green Version]
- Gong, P.; Chen, B.; Li, X.C.; Liu, H.; Wang, J.; Bai, Y.Q.; Chen, J.M.; Chen, X.; Fang, L.; Feng, S.L.; et al. Mapping essential urban land use categories in China (EULUC-China): Preliminary results for 2018. Sci. Bull. 2020, 65, 182–187. [Google Scholar] [CrossRef] [Green Version]
- Chen, J.; Liao, A.P.; Chen, J.; Peng, S.; Chen, L.J.; Zhang, H.W. 30-meter global land cover data product- GlobeLand30. Geomat. World 2017, 24, 1–8. [Google Scholar]
- Otsu, N.A. Threshold selection method from gray-level histograms. IEEE Trans. Syst. Man Cybern. 2007, 9, 62–66. [Google Scholar] [CrossRef] [Green Version]
- Bennett, M.M.; Smith, C.L. Advances in using multitemporal night-time lights satellite imagery to detect, estimate, and monitor socioeconomic dynamics. Remote Sens. Environ. 2017, 192, 176–197. [Google Scholar] [CrossRef]
- Shi, K.F.; Yu, B.L.; Huang, Y.X.; Hu, Y.J.; Yin, B.; Chen, Z.Q.; Chen, L.J.; Wu, J.P. Evaluating the ability of NPP-VIIRS nighttime light data to estimate the gross domestic product and the electric power consumption of China at multiple scales: A comparison with DMSP-OLS data. Remote Sens. 2014, 6, 1705–1724. [Google Scholar] [CrossRef] [Green Version]
- Li, F.; Zhang, X.B.; Gu, S.B.; Qian, A. Capability assessment of DMSP-OLS and NPP-VIRS nighttime light data estimating statistical indicators: A case of county-level GDP, population and energy consumption in Beijing-Tianjin-Hebei region. Bull. Surv. Mapp. 2020, 9, 89–93. (In Chinese) [Google Scholar]
- He, C.Y.; Shi, P.J.; Li, J.G.; Chen, J.; Pan, Y.Z.; Li, J. Reconstruction of Chinese mainland city spatial process in 1990s based on DMSP/OLS night lighting data and statistics. Chin. Sci. Bull. 2006, 51, 856–861. (In Chinese) [Google Scholar]
- Ye, Q.; Zhao, Y.; Tan, C.; Ma, M.Y.; Chen, N. Research on commercial spatial structure and spatial service capability of provincial capital cities along the Yellow River in the new period. J. Nat. Resour. 2021, 36, 103–113. (In Chinese) [Google Scholar] [CrossRef]
- Berliant, M.; Weiss, A. Measuring economic growth from outer space: A comment. MPRA Pap. 2013, 102, 994–1028. [Google Scholar]
- Yang, M.; Wang, S.X.; Zhou, Y.; Wang, L.T. Review on applications of DMSP/OLS night-time emissions data. Remote Sens. Technol. Appl. 2011, 26, 45–51. (In Chinese) [Google Scholar]
- Xu, K.N.; Chen, F.L.; Liu, X.Y. The Truth of china economic growth: Evidence from global night-time light data. Econ. Res. J. 2015, 9, 17–29. (In Chinese) [Google Scholar]
- Zhou, Y.; Xie, B.P.; Zhao, H.Y.; Chen, Y.; Pei, T.T.; Liu, S.Q. Study on Spatial-temporal Pattern and Dynamic Evolution of City Scale at County Level in China Based on Night-time Light Data. Resour. Environ. Yangtze Basin 2019, 28, 250–261. (In Chinese) [Google Scholar]
- Wen, T.Z.; Qiang, W.; Liu, X.J. Exploring the geography of urban comprehensive development in mainland Chinese cities. Land Use Policy 2022, 115, 106004–106013. [Google Scholar] [CrossRef]


| City | DEM (m) | Slop (°) | District | |
|---|---|---|---|---|
| Upper reach | Xining | 2237.72 | 10.10 | Chengbei, Chengxi, Chengdong, Chengzhong |
| Yinchuan | 1517.42 | 10.46 | Xixia, Jinfeng, Xingqing | |
| Lanzhou | 1069.55 | 4.44 | Xigu, Anning, Chengguan, Qilihe | |
| Hohhot | 1035.55 | 3.83 | Xincheng, Huimin, Yuquan, Saihan | |
| Middle reach | Taiyuan | 783.78 | 6.32 | Jiancaoping, Wanbailin, Jinyuan, Xiaodian, Xinghualing, Yingze |
| Xi’an | 378.60 | 5.54 | Weiyang, Lianhu, Yanta, Beilin, Baqiao, Xincheng, Chang’an, E’yi, Lintong, Yanliang, Gaoling | |
| Zhengzhou | 83.54 | 4.40 | Huiji, Jinshui, Zhongyuan, Guancheng Hui, Erqi | |
| Lower reach | Jinan | 68.22 | 8.16 | Lixia, Tianqiao, Huiyin, Shizhong, Licheng, Changqing, Jiyang, Zhangqiu |
| Time | Upper Reach | Middle Reach | Lower Reach | ||||||
|---|---|---|---|---|---|---|---|---|---|
| Xining | Lanzhou | Yinchuan | Hohhot | Taiyuan | Xi’an | Zhengzhou | Jinan | ||
| AREA (km2) | 2013 | 115.31 | 195.05 | 201.02 | 217.28 | 312.38 | 786.96 | 442.89 | 310.81 |
| 2020 | 141.17 | 187.66 | 269.22 | 246.70 | 457.38 | 883.71 | 568.11 | 513.47 | |
| Expansion rate V (km2/year) | 2013–2020 | 3.69 | −1.06 | 9.74 | 4.20 | 20.72 | 13.82 | 17.89 | 28.95 |
| Expansion intensity N(%) | 2013–2020 | 3.20 | −0.54 | 4.85 | 1.93 | 6.63 | 1.76 | 4.04 | 9.31 |
| Correlation Coefficient (R) | GDP | Population | |||
|---|---|---|---|---|---|
| City | |||||
| Upper reach | Hohhot | ANTL | 0.1659 | 0.8927 | |
| TNTL | 0.1296 | 0.9003 | |||
| Xining | ANTL | 0.9736 | 0.8765 | ||
| TNTL | 0.5761 | 0.4578 | |||
| Lanzhou | ANTL | −0.4196 | −0.5191 | ||
| TNTL | −0.8389 | −0.8771 | |||
| Yinchuan | ANTL | 0.6753 | 0.5534 | ||
| TNTL | 0.7528 | 0.6310 | |||
| Middle reach | Taiyuan | ANTL | 0.8716 | 0.6607 | |
| TNTL | 0.8270 | 0.8402 | |||
| Xi’an | ANTL | 0.8610 | 0.8833 | ||
| TNTL | 0.7263 | 0.7367 | |||
| Zhengzhou | ANTL | 0.9163 | 0.9269 | ||
| TNTL | 0.8919 | 0.8012 | |||
| Lower reach | Jinan | ANTL | 0.9358 | 0.8887 | |
| TNTL | 0.9588 | 0.9307 | |||
Publisher’s Note: MDPI stays neutral with regard to jurisdictional claims in published maps and institutional affiliations. |
© 2022 by the authors. Licensee MDPI, Basel, Switzerland. This article is an open access article distributed under the terms and conditions of the Creative Commons Attribution (CC BY) license (https://creativecommons.org/licenses/by/4.0/).
Share and Cite
Wang, J.; Qiu, S.; Du, J.; Meng, S.; Wang, C.; Teng, F.; Liu, Y. Spatial and Temporal Changes of Urban Built-Up Area in the Yellow River Basin from Nighttime Light Data. Land 2022, 11, 1067. https://doi.org/10.3390/land11071067
Wang J, Qiu S, Du J, Meng S, Wang C, Teng F, Liu Y. Spatial and Temporal Changes of Urban Built-Up Area in the Yellow River Basin from Nighttime Light Data. Land. 2022; 11(7):1067. https://doi.org/10.3390/land11071067
Chicago/Turabian StyleWang, Jingxu, Shike Qiu, Jun Du, Shengwang Meng, Chao Wang, Fei Teng, and Yangyang Liu. 2022. "Spatial and Temporal Changes of Urban Built-Up Area in the Yellow River Basin from Nighttime Light Data" Land 11, no. 7: 1067. https://doi.org/10.3390/land11071067
APA StyleWang, J., Qiu, S., Du, J., Meng, S., Wang, C., Teng, F., & Liu, Y. (2022). Spatial and Temporal Changes of Urban Built-Up Area in the Yellow River Basin from Nighttime Light Data. Land, 11(7), 1067. https://doi.org/10.3390/land11071067