Abstract
In Gansu Province, China, Wuwei City is an ecologically fragile migration area at the intersection of the Loess Plateau, the Qinghai-Tibet Plateau, and the Mongolia-New Plateau. Using the Triangular Fuzzy TOPSIS method and the obstacle factor diagnostic model, the implementation performance and follow-up support issues of the Ecological Resettlement Project were analyzed from the perspective of the eco-migrant and the public value theory. In contrast to traditional performance appraisal methods, Triangular Fuzzy TOPSIS breaks through the ambiguity of complex environments and subjective information and effectively quantifies the fuzziness of evaluator language variables to improve the validity. The overall performance of the Ecological Resettlement Project in Wuwei is good; the average closeness degree of process is higher than outcome. Migrants rated the fairness of the project as the highest, followed by support, economic outcome, and satisfaction. Gulang County’s performance in the Ecological Resettlement Project is the best, followed by Tianzhu County and Liangzhou District. Project obstacles were mostly related to the outcome dimension, especially the ecological restoration and management, the return to poverty risk, and industrial development on the resettlement site. The main obstacle to the process dimension is migrant satisfaction with government subsidies. Research results provide case study support and experience inspiration for migrant relocation models and their long-term livelihood improvement in the context of rural revitalization.
1. Introduction
Ecological migration is an important survival strategy in anti-crisis management as it relieves population pressure, conserves the environment, and promotes natural restoration in ecologically vulnerable areas [1]. It is a complex system project centered on public interest. The project has been implemented in China for more than forty years and it aims to protect the environment as well as alleviate poverty. Approximately 10 million people in ecologically fragile areas of southwest and northwest China will be forced to migrate by 2050 [2]. Within the current context of rapid urbanization and rural social structure under rapid change, the quantitative ecological and economic performance of the Ecological Resettlement Project (ERP), the objective assessment of the goal’s achievement, subject responsiveness, and satisfaction with the implementation process are the key factors that will determine the viability of subsequent migrations, available experience, and optimization processes. The Qilian Mountains area, as an important area of ecological construction of the Silk Road economic belt, is a barrier to the ecological security of the Qinghai-Tibet Plateau and the Hexi Corridor in China. Since the rigorous improvement of environmental conditions in the Qilian Mountains and the establishment of a national park system in 2017, the northern piedmonts have been a typical example of national ecological civilization construction and green development. This area has a long history of immigration, including the Three West immigration, engineering immigration, ecological migration, poor relocation, and ethnic migration as well as other types of relocation. In the recent major national ecological construction projects, ERP has also been referred to as the first, and even the only, choice for green and high-quality development in carrying out ecological protection and long-term governance in the Qilian Mountains. Normally, immigrants in this area come from the mountainous regions to the northern desert area where the social ecosystem of the settlement area is fragile and the subsequent livelihood problems of immigrants are obvious. There are “space deprivation” problems in water resources, production conditions, and infrastructure construction. In Gansu Province, China, at the northern foothills of the Qilian Mountains, Wuwei city is located at the intersection of the Loess Plateau, the Qinghai-Tibet Plateau, and the Mongolia-Xinjiang Plateau. There are three types of geomorphology: the Qilian Mountains, the corridor oasis plains, and the Tengger Desert. The ecosystem is sensitive and fragile. Wuwei City has been engaged in ERP for nearly 30 years with the intention of restoring ecology and providing a long-term protection mechanism. It is a typical area with the most urgent ecological migration, the largest relocation scale, a diverse range of resettlement types, significant engineering advantages, as well as the most significant practical problems. So, did the migrants in the area live up to the expectations of the project? What are the processes and outcomes of the implementation? Does the realization of moving out, becoming stable, and becoming wealthy come true? How does one judge the public value, implementation performance, and sustainability of the project? Consequently, these problems have become the focus of current local government and academic research.
Yang et al., believe that the evaluation of ecological engineering benefits must be based on the “triple bottom line”, that is, the development of economic wealth, social welfare, and ecological balance in concert [3]. The primary problems are determining who will evaluate, what to evaluate, and when to evaluate. As of now, the performance of ecological engineering in China is largely evaluated by superior institutions and scholars. However, neither has delved deeply into the field of engineering construction. Therefore, it is very easy to ignore a project’s internal problems if it relies solely on external performance indicators. In contrast, prior studies have exclusively investigated ecological effects or participant behavior, which are both characterized by obvious instrumentalism characteristics since they pursue the highest degree of efficiency within government performance management. This instrumental orientation ignores the most fundamental public value basis for performance legality [4], resulting in a lack of discussion on the rationality of the policy implementation process and its public benefit. In a bid to restore ecosystem for primary purposes, providing a safe and high-quality living space to the public for auxiliary goals, ERP involved two processes of space transfer and reconstruction [5]. Numerous stakeholders, such as migrants, herders, residents in the surrounding area, governments, markets, companies, etc., have big differences in terms of interest claims. The research introduced the Public Value Theory, from the process-outcome dimensions and the eco-migrant perspective (who are the direct participants and core stakeholders for the project, having clear, objective, and comprehensive thinking), to address the question of “what to evaluate, how to evaluate, who will evaluate” in order to overcome the deficiencies of previous engineering project evaluation studies that focus on results without considering the implementation process or on the government level without considering other stakeholders.
As the latest development of the four paradigms change in public administration, the Public Value Theory has revered the bad trend of serious damage to the public since the new public management. It is widely used in the performance evaluation of domestic public affairs governance, community and poverty governance, government administration, public service, and land management [6]. In 1995, Moore developed this concept as a reflection of collective preferences and expectations that focuses on equity, efficiency, democracy, and sustainability [7]. Its ambiguous connotation has become clearer with its application and evolution by Kelly et al. [8], Horner and Hazel [9], Hu [10], He [11], Bao et al. [12], and Wang [13]. With word meaning analysis, Wang and Zhang divided public value into result-oriented and consensus-oriented values [14]. Result-oriented refers to the value created by the government through its services, laws, and rules, whereas consensus-oriented refers to the agreement of the public with power, obligations, and standards. The paradigm weakens the standard of “efficiency comes first”, but further stresses the constitution, creation, and delivery of public value in the process and outcome dimensions. Breaking away from public value for government performance evaluation is not advisable [15]. The creation and integration of multiple values is the new approach for adapting social changes and public governance [16], taking a comprehensive look at the project implementation process and production outcomes as well as balancing Instrumental and Value Rationality [4]. In conclusion, the Public Value Theory provides a fresh perspective for ecological engineering evaluation and ecological policy system construction which can reflect the “efficiency” of public management, the “fairness” of engineering policy, the respect for cooperative production entities, and the “durability” of policy effects [17,18]. In addition, it can assist in clarifying the problem and the crux of proposing the targeted adaptation strategies.
The evaluation of efficiency, fairness, and sustainability of ERP by migrants is often interfered with by external environments, group preferences, and psychological activities. Evaluators are unable to judge the degree of hesitation and the uncertainty of the ecological engineering’s public value attribute because of the complexity of the evaluation object and system, the vagueness of stakeholders’ thinking, and the difficulty of quantifying language variables. Language variables are more precise for the expression of uncertain information and the fuzziness of multi-attribute decision making; how to convert it to computational math language is a difficult point. Likewise, TOPSIS, an ideal solution based on precise numerical values, has the flaw that it cannot handle fuzzy evaluation as it is difficult to reflect an evaluator’s degree of preference comprehensively and accurately. Consequently, in 1975 Zadeh proposed a basic algorithm and sorting principle for language variables to solve the above problems [19]. In 1986, Atanassov proposed intuitive Fuzzy Sets to express adjectives frequently used in human natural language and the degree of membership, non-membership, and hesitation of various fuzzy or uncertain problems encountered in life [20]. Later, Xu proposed Triangular Fuzzy Linguistic variables and their algorithms [21]. Wang and Chen applied the intuitionistic triangle of fuzzy language variables to rank the risk of ship oil spill accident situation evolution [22]. In order to answer these questions (How did the implementation performance of ERP rank in the northern foothills of the Qilian Mountains? What was the score? Where does it rank on the rating scale? What are the main obstacles?), this study was developed a performance evaluation framework and an indicator system based on the Public Value Theory. Using the transform scale, the language variables of evaluators were converted into Triangular Fuzzy numbers. An evaluation of the effectiveness, performance, and stability of ERP by Triangular Fuzzy TOPSIS was carried out clarifying group differences and space distribution and identifying the limiting factors and types of resistance. The relevant results will provide the cases and experiences for the welfare guarantee mechanism of ERP in mountainous, oases, and desert regions, as well as provide suggestions for establishing the optimal control mechanism and the long-term mechanism for follow-up migration relocation in the context of rural revitalization. The marginal contribution of this study changes the perspective concerning the concept, type, mode, and adaptation theory of ecological migration at an early stage and the cultural reconstruction, welfare security, and sustainable livelihood of immigrants at the current stage, with a focus on the panoramic engineering performance evaluation of the processes and the outcomes of migration. The paper provides a comprehensive interpretation of the concept, connotation, category, composition, transmission, transformation, and internal logic of the theory of public value and develops a performance evaluation framework and index system based on the theory that is in accordance with the project content and the reality of immigration. A number of new ideas are presented in this paper concerning the implicit value of process, the explicit output of outcome, and the relationship between the two. In the evaluation method, it circumvents the defects of traditional TOPSIS and expands the application scenarios of the improved TOPSIS mode. The field of engineering performance evaluation has seen a reorganization, innovation, and new interpretation of existing data, information, and knowledge, resulting in certain information increments. The specific research ideas are shown in Figure 1.
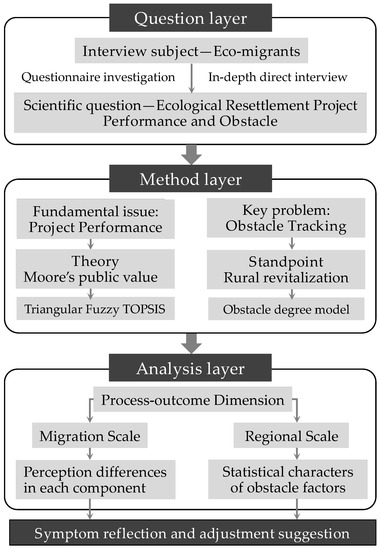
Figure 1.
The analysis flow chart.
2. Materials and Methods
Wuwei City, an important hub on the ancient Silk Road and commercial distribution center in Hexi, is at the northern foot of the Qilian Mountains (E 101°49′–104°16′, N 36°29′–39°27′), boasting superior location, convenient transportation, abundant cultural tourism resources, and well-developed agriculture industry (Figure 2). With a total area of 3.32 × 10⁴ km2, the area is located at an elevation of 3854 m from north to south. There are three geographic zones, the Alpine and Dank Qilian Mountains in the south, the warm and arid oasis irrigation region in the middle, and the desert sandy area with fragile ecology in the north. So, it is divided into two major climate types: the alpine subarid zone in the Qilian Mountains and the cold temperate arid zone in Hexi. The Yellow River Basin (Datong River, Jinqiang River) and the Shiyang River Basin (Xiying River, Nanying River, Zamu River, Huangyang River, Dajing River, Gulang River) are the two major river systems in the territory. Most local residents rely on the Shiyang River Basin, which generates annual runoff amounts of 1144 million cubic meters. Currently, Wuwei city governs the following municipalities: Tianzhu, Gulang, Liangzhou District, and Minqin. By 2020, there will be 22, 47.32, 174.23, and 11.14 people per square kilometer, respectively. In the 11th five-year plan period, Wuwei formulated a plan for implementing four demonstration zones of sand industry, ten major industries, and two new sand zone energy projects. It has become a national demonstration area for the development of sand industry, desert prevention, ecological restoration, water-saving practices, and high-efficiency agriculture. As of 2017, the implementation plan for the pilot area of Wuwei city within the Qilian Mountains National Park system clearly classified 3.337 × 10⁵ hm2 of land into the park, delineating a red line for ecological protection of 1.031 × 10⁶ hm2. Tianzhu and Gulang County are both included in the Qilian Mountains’ glacier and water conservation ecological function zone. Wuwei City faces the following challenges: a severe population imbalance, a fragile ecological and structural water shortage, and a sharp conflict between the people and the land. Thus, ERP has become the first, and even the only, option for green and high-quality development in many areas.
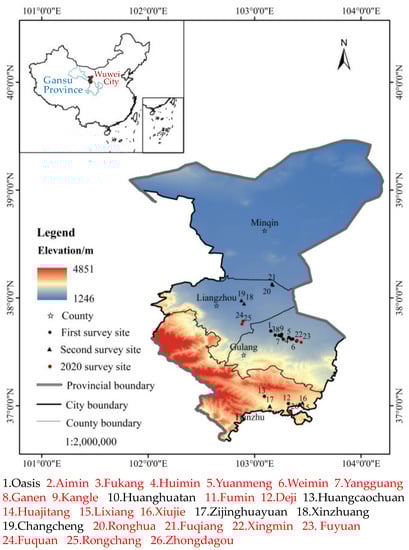
Figure 2.
Administrative division map and survey points of Wuwei City. The names of the villages shown in red are the full 2020 survey sites.
The eco-migration of China began in the 1980s (Figure 3). The most representative are the Three West construction and Diao zhuang migration in Ningxia, Gansu, and Guizhou provinces. In the exploration period, the primary objective of migration was poverty alleviation, with environmental protection as a secondary objective. In the 1990s, combining with the project of returning farmland to forest, grazing to grassland, and poverty alleviation-related relocation, the government began removing residents from Xinjiang, Yunnan, Inner Mongolia, Guangxi, and Guangdong provinces, which are mountainous or sandy areas of fragile ecology. Ecological problems such as soil erosion, grassland degradation, desertification, and a sharp decline in biodiversity were exacerbated during this period of time when the Yellow River ceased to flow and the Yangtze River and northeast China experienced severe floods, sandstorms, and other natural disasters. ERP was launched by the State Council’s White Paper on Poverty Alleviation and Development in Rural China in 2001. Furthermore, the government has begun to set up special ERP and subsidies, as well as continuing to execute the program in the form of conversion of farmland to forests and relocation to other areas for poverty alleviation. Following 2010, the EMP has entered the stage of comprehensive treatment and overall planning. The migration has been integrated with the projects of poverty alleviation and relocation and has gradually been incorporated into the process of urbanization in China. Chinese ERP, in short, is part of an engineering migration, which is optional and voluntary, and has the characteristics of a “mandatory, compensatory, time-bound, large-scale, destructive, risky, radical, and policy of migrants’ adaptation to the new environment”. Presently, the EMP of China consists mainly of a combination of state guidance and local declarations. State relocation quotas and financial support are provided to all localities, and provinces assign tasks to localities. The disadvantage is a lack of specific ecological migration laws and regulations.
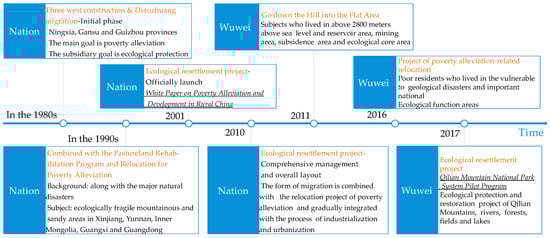
Figure 3.
Ecological Resettlement Project timeline.
A the end of 2010, the central government proposed the “Two screens and three belts” strategic pattern in the national main functional area planning. Wuwei City serves as an ecological barrier between the Qinghai-Tibet Plateau, which protects the water resources in the south and prevents desertification in the north. A solution to the problem of unreasonable population distribution, ecological degradation, and becoming rich is ecological migration. In 2011, Wuwei City launched an ERP named “Go down the Hill to the Flat Area”. Farmers and herds who lived in “One High” (2800 m above sea level) and “Four Districts” (reservoir area, mining area, subduction area, ecological core area) were relocated to the Flat Area or the town. At the end of 2016, this project had invested CNY 4.942 billion in total, relocating 84,300 poor agro-pastoralists. In 2016, the project of poverty alleviation-related relocation removed Qilian Mountains residents who are vulnerable to geological disasters to resettlement sites such as Huanghuatan, Nanyangshan, and Dengmaying Lake. In 2017, the State Council’s Pilot Program for the Qilian Mountains National Park System stated residents in key protected areas should move gradually. ERP, one of the 139 construction projects of “The Ecological Conservation and Restoration of Mountains-Rivers-Forests-Farmlands-Lakes-Grasslands in the Qilian Mountains”, rehabilitated 6900 families and 26,754 people from the Qilian Mountains Nature Reserve in Gulang and Tianzhu County, as well as from the desert areas in Northern Minqin County from 2017 to 2019. Wuwei City has relocated 44,200 households and 170,200 people since the 12th five-year plan, as well as built 93 relocation areas, such as Lake Dengmaying in Liangzhou District and Huanghuatan in Gulang County. With the planting of trees and grass in the desert area around the settlement area and the removal of houses, returning farmland, prohibiting grazing, and ecological restoration of the removal area, the ecological impact is remarkable. Desertification in the northern sand-blown region was reversed and the fragile ecosystem in the Qilian Mountains was evidently restored.
2.1. Questionnaire Design and Sample Analysis
A four-stage survey on the eco-migrants was conducted in Wuwei City during 2019–2022. As a first step, a questionnaire survey was conducted among rural cadres and residents of relocation areas and resettlement villages in Tianzhu and Gulang County to understand the intention, livelihood, project impact, and evaluation of eco-migrants and non-migrants. During a second stage, 55 migrants in Tianzhu County and Liangzhou District were randomly selected to participate in a pre-investigation of the non-economic incentive questionnaire. As the third stage, 18 villages in Dengmaying Lake in Liangzhou District, Nanyang Mountain in Tianzhu County, and Huanghuatan resettlement sites in Gulang County were selected to conduct the formal household surveys after completing the questionnaire and training 12 investigators. A total of 131 non-economic incentive questionnaires were collected, Liangzhou District, Tianzhu, and Gulang County accounting for 20.61%, 33.59%, and 45.80%, respectively. It consists of four parts: the basic status of households, government non-economic incentives, types of migrant culture, and pay willingness to ecological compensation. The characteristics of the surveyed households are shown in Table 1. During the fourth stage, in January and March 2022, in-depth interviews were conducted with 12 resettlement immigrants and 4 returning immigrants in Gulang County to evaluate their satisfaction, efficiency, and policy needs.

Table 1.
Characteristics of surveyed households.
2.2. Framework and Index
A performance concept derived from enterprise management refers to the degree and effectiveness of an activity in achieving its predetermined objectives. This concept is predominantly used to supervise enterprises, evaluate the functionality of government departments, and manage projects. By quantitatively analyzing the behavior process and results of the aforementioned subjects over a time period, the acceptance degree of the measures and projects can be clarified for each subject, along with the social benefits, economic efficiency, potential impact, and degree of target realization. There are various ways to appraise performance, including KPI, MBO, BSI, 360° Feedback, Wall scoring, BSC, benchmarking management, graph rating scale, and BARS. In the field of ecological engineering performance evaluation, a series of results-oriented “ecology–economy–society” benefit evaluation methods, systemic structure-oriented transaction cost measurement methods, and benefit-oriented “cost-effectiveness” analysis methods have been developed [6]. As noted, the methods above mainly focus on results without considering the implementation process, on enterprises and governments without considering its effects, and on superior oversight and third-party evaluation by scholars without reflecting the public interest. An official set of guidelines for evaluating the effectiveness of projects were produced, including “Farmland Returning to Forest Project Monitoring (GB/T23233-2009)”, “Technical Specification of ecological benefit evaluation of Forestry Ecological Engineering (DB11/T1099-2014)”, “Ecological benefit evaluation specification of shelterbelt system (LY/T2093-2013)”, and “Technical specification of economic and ecological benefit evaluation of grassland construction (NY/T3461-2019)”. These guidelines are primarily geared toward evaluating the ecological benefits. It is more common to select indicators that can be measured or monitored, such as cost, schedule, quality, and short-term results, whereas the evaluation criteria of social and economic benefits are rarely included or are not sufficiently considered.
To overcome the deficiencies noted above, this study proposes a multi-stakeholder evaluation method based on the Public Value Theory for evaluating the performance of ERP. Taking public value into account when evaluating the impacts of eco-construction policies, Fan et al., comprehensively expanded the methods and the scope of evaluation of eco-engineering [17]. Afterward, Nie examined the composition, creation, and transmission of public value in eco-construction projects and proposed an evaluation system framework based on the policy process (fair value, democratic value, efficiency value, sustainable value, economic value) and the ecological results of projects [23]. It was used to evaluate the validity, rationality, and performance of ecological projects, such as the prohibition of grazing, returning farmland to forests, small watershed management, three north shelter forests, and natural forest protection [24,25,26,27]. The framework is constructed by referencing Nie’s [23] “process-outcome” evaluation system and combining it with engineering objectives, policy attributes, and carrying entity characteristics of ERP in the northern foothills of the Qilian Mountains (Figure 4). It consists of three modules: objective–subject–outcome three-dimensional cube, process dimension effect evaluation, and explicit–implicit value transformation. Performance, process dimension implicit value, and outcome dimension explicit value are the core concepts. Performance refers to the degree and effectiveness of engineering implementation based on its predetermined goals, which is judged by the evaluators based on their perception of the output of public value in the process and the effect of the outcome dimension. A non-materialized long-term organizational element, individual feel, or externality spillover effect such as fairness, democracy, and satisfaction in the implementation process of a project is considered implicit value. Conversely, explicit value exists within expectation and has the characteristics of quantification and easy analysis. As far as ecological engineering is concerned, it manifests in three areas: ecology, society, and economy. The indices of fairness, democracy, support, satisfaction, effectiveness, and sustainability are selected to represent the composition and generation of public value. The value here pertains to the side impact of the project, which is an implicit value. As the project progresses, the implicit value of the process dimension can gradually translate into the explicit output of the outcome dimension. An Ecological Resettlement Project is a complex project involving many stakeholders. Depending on its relevance and effect, it can be divided into three categories: core stakeholders, potential stakeholders, and edge stakeholders. This framework allows for a direct and reasonable response to the goal dimension (whether the desired goal has been achieved and the degree of achievement) from the perspective of relocation immigrants who are the core stakeholders (the Z axis).
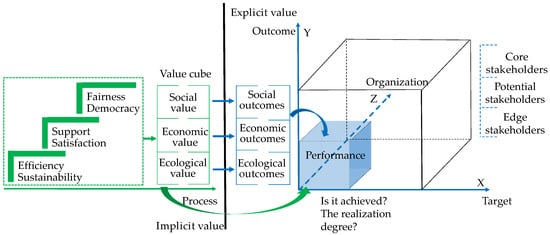
Figure 4.
Framework for evaluating performance.
In process dimension, the fairness of project implementation is measured in terms of “whether there is an unfair distribution of housing or land”. Migration listening and adoption can be used to measure migrant participation in government-led immigration projects (Table 2). Participant support and cooperation are essential elements of the success of ERP, as demonstrated by their relocation intentions and compromised behavior choices. Conflict as a realistic manifestation of resistance also serves as a negative interpretation of support. Generally, project satisfaction can be divided into three categories: satisfaction with compensation amounts, recognition for the work done by the government, and actual praise. The publicity and efficiency will be judged by the level of understanding of the migrants towards the project contents, as well as whether or not there was a hasty process in the mobilization of the government to relocate. Migration perception of project benefits related to ecological, economic, and social outcomes can be considered as outcome dimension. The economic benefits of migration can be measured in the expenditure balance of migrant families, income satisfaction, and the risk of returning to poverty, as well as the long-term growth of support industries. Generally, the social benefits tend to be shaped by an understanding of living among migrants, including their intention for environmental preservation, social integration, future expectations, and park conformity. Averaged over all the variables, fairness of eco-migrants to the project (0.916) and ecological restoration (3.953) placed highest, followed by degree of support of migrants to the project (made some concessions and compromises). With regard to social benefits, migrants had the lowest score (0.535) in their pessimistic outlook, due to the “lack of land to plant” as well as the lack of industrial support and employment opportunities.
Table 2.
Index system to evaluate the performance of Ecological Resettlement Project.
2.3. Methods Selection
2.3.1. The Method of Performance Evaluation: Triangular Fuzzy TOPSIS
The Technique for Order Preference by Similarity to Ideal Solution (TOPSIS) is a management decision method proposed by C.L. Hwang and K. Yoon (1981) for multidimensional vector comparison and ranking [28]. In addition to being intuitive, straightforward, and having low information distortion, this method is widely used in systems engineering decision making, policy performance evaluation, scheme optimization, and risk ranking. Since TOPSIS uses Euclidean distance to determine the quality of each object, this can only reflect the position relation and cannot reflect series changes in object data or receive fuzzy evaluations. The scholars improved TOPSIS through gray correlation analysis, covariance Matrix [29], correlation Matrix [30], grey relational projection method [31], cloud model and distance entropy [32], rough set, and vague set.
Based on Zadeh’s fuzzy logic, Atanassov (1986) proposed intuitionistic Fuzzy Sets. To solve the problem of the conversion and standardization of attribute values of linguistic variables in uncertain environments, he introduced the concept of the non-membership and hesitancy degree based on the membership degree of traditional Fuzzy Sets. The purpose of this is to reflect comprehensively and objectively the evaluator’s emotional tendency of support, hesitation, and opposition, and even the property of things. Chen and Hwang (1992) proposed the Fuzzy TOPSIS method which combined the Fuzzy Set theory with TOPSIS [33]. This novel method solved the problems of imprecise language expression and difficult to measure subjective information via using Triangular Fuzzy Numbers (Figure 5 and Equation (1)) to describe the semantic values of each index. Fuzzy TOPSIS combines the normalized formula of the Triangular Fuzzy Number decision matrix with the distance, optimal solution, and access degree of TOPSIS. Its aim is to obtain the closeness degree of each scheme/sample to the ideal solution and to provide the support for the final performance evaluation and orderly management, scheme ranking, and optimization. The Fuzzy TOPSIS method combines subjective judgment with objective calculation so that the optimal selection and ranking can be made more rational and the decision results more reliable.
where X is the set of real numbers, A is an intuitionistic fuzzy number on X. and associated with each element x in X a real number in the interval [0, 1] is defined as Equations (2) and (3). and are respectively the membership function and non-membership function of X to intuitionistic fuzzy set A (representing the degree that the evaluator considers not to belong to A). In addition, a, b and c are the real numbers, 0 ≤ ≤ 1, 0 ≤ ≤ 1, 0 ≤ ≤ 1. is the degree of hesitation of the evaluator to A; is the degree of ambiguity of the evaluator to A.
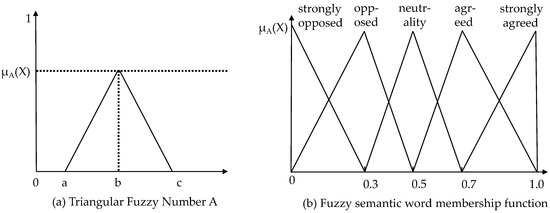
Figure 5.
Triangular Fuzzy Number and its fuzzy semantic word membership function. The following Equations correspond to figure (a). Table 3 explains figure (b).
The specific steps of Triangular Fuzzy TOPSIS are as follows:
Step 1: determine the fuzzy evaluation set of indicators.
A total of 35 scholars actively engaged for many years in ecological monitoring, environmental governance, policy evaluation, social–ecological system coupling model, and ERP research on the Qilian Mountains–Hexi corridor area were screened. They were asked to evaluate the importance and influence of 21 indicators from “not at all important” to “very important”. Finally, 31 effective questionnaires were returned. Among the surveyed scholars, physical geography accounted for 45.16%, followed by human geography (35.48%), and agricultural–forestry economic management (19.36%). Their research interests include forest and grass vegetation restoration, water and soil resource utilization and ecological process, socio-ecological system and ecological policy performance evaluation, livelihood, and support mechanism of eco-migration, etc. About 38.71% of the scholars have presided over projects related to the Qilian Mountains region and ecological migration funded by the National Natural Science Foundation of China. Therefore, 31 scholars are very representative. To determine the weight of the index set, first convert the index importance rating of 31 scholars into the corresponding Triangular Fuzzy Number Ak = (ak, bk, ck) (Table 3 and Figure 5b), and then calculate the aggregation fuzzy rating of each standard in each index xijk = (aijk, bijk, cijk) according to Formula (4). Find the corresponding aggregation fuzzy weights wijk = (wjk1, wjk2, wjk3) according to Table 3. Since the evaluation matrix of the evaluator is expressed in the form of fuzzy language variables, considering the uncertainty and subjectivity of each index, it is divided into two categories of three-level standard and five-level standard. Referring to Hsieh et al. [34] and Jia et al. [35], semantic variables of different grades were defuzzified and converted into Triangular Fuzzy Numbers.
Table 3.
Semantic variables of index and Triangular Fuzzy Number.
Step 2: construct the weighted standardized intuitionistic triangular fuzzy evaluation matrix.
Based on the Triangular Fuzzy Numbers of each evaluator and each index, the fuzzy evaluation matrix A = (aij)n×m was constructed. The matrix A was transformed into normalized matrix B = (bij)n×m by using Formula (5). The weighted normalized decision matrix R = (rij)n×m was constructed by using Formula (6).
Step 3: determine the positive ideal value and negative ideal value of each indicator via Equations (7) and (8).
Step 4: calculate the distance of ri+ and ri− between the index value of each sample and the fuzzy positive or negative ideal solutions according to Equations (9) and (10).
where rij = (a1, a2, a3), rj+ = (b1, b2, b3), rj− = (c1, c2, c3), rij and rj+, rj− are Triangular Fuzzy Numbers.
Step 5: calculate the closeness coefficient Ci (represents that the closeness with the total eco-migrants to the optimal solution is larger and explains the object to be evaluated is better) according to the Equation (11). Referring to the performance evaluation results of the previous research fruit, we divided Ci into four levels and defined the values (0.80, 1.00) as excellent, (0.60, 0.80) as well, (0.30, 0.60) as medium, and (0, 0.30) as poor.
2.3.2. The Method of Obstacle Tracking
For determining further the obstacle factors that affect the performance evaluation of ERP in Wuwei City, the obstacle degree model (Equation (12)) is used to compute the factor contribution degree (the degree of influence of a single factor on the overall goal, namely its weight), the index deviation degree (an indicator’s distance from the implementation goal of ERP, i.e., the difference between its standardized value and 100%), and the obstacle degree (a single indicator’s impact on ERP performance). It has been extensively used to track key factors and to understand the underlying dynamics of land use change, water resource poverty, and environmental structure. Diagnostic results can be used to alter the planning and policy system for local development.
where Mi is the obstacle degree for a single indicator, (1 − ) represents the index deviation, and Wi is the weight, which is calculated by the entropy weight method.
3. Results
3.1. Triangular Fuzzy TOPSIS Results for Performance Evaluation of EMP
3.1.1. The Score and Distribution of Performance Value on the Migration Scale
As illustrated in Figure 6, the average closeness of process dimension for EMP is 0.6966, which is higher than the result value (0.668). Closeness of overall performance was 0.682. About 70.23% of the eco-migrant performance value is between (0.6, 0.8). On the eco-migrant process value, 61.07% are between (0.6, 0.8) and only 18.32% are greater than 0.8. About 59.54% of the eco-migrant outcome value is between (0.6, 0.8) and only 13.74% is greater than 0.8. Results indicated that EMP performed well in terms of both process and outcome.
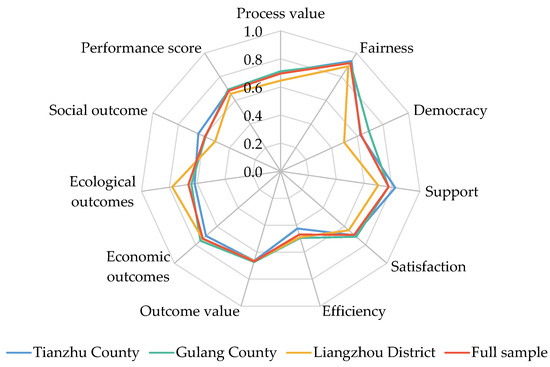
Figure 6.
The evaluation results of the FUZZY-TOPSIS.
Fairness and efficiency are the two basic values of government public service performance evaluation [36], which have the highest and lowest performances in the ERP process dimension. The average closeness is 0.916 and 0.470 (Figure 6). The frequency distribution shows 91.60% and 57.25% of eco-migrants’ fairness and support are higher than 0.8, while only 8.40% and 3.82% are below 0.3 (Figure 7). Fairness, as a public service internal attribute, is the first value orientation and judgment standard of public administration that covers three dimensions: opportunity (opportunity), distribution (distribution), and result (to be entitled to equal services, quality, and results) [36]. The ERP in Wuwei is divided into two stages: the ecological migration of the “12th five-year plan” Go down the Hill into the Flat Area and the “13th five-year plan” Poverty Alleviation Relocation Project. Villagers are free to choose the type of housing and the size of the house, but the settlement location should be drawn by lot. Housing distribution in the 12th five-year plan period is based on self-funding by the masses, unified national subsidies of CNY 45,000 RMB (Gulang County), as well as loans with low-interest rates. During the 13th five-year plan period, the area of the per capita housing cannot exceed 25 m2, the households must raise CNY 10,000, and the rest is subsidized by the government. On land distribution, Tianzhu County allocates 0.1 ha of land per capita, Gulang County 0.117 ha, and Liangzhou District 0.133 ha. Migrants are able to apply for the purchase of a breeding greenhouse or a greenhouse (CNY 20,000 for the masses, CNY 20,000 for the government). In view of the geographical limitations, the newly divided arable land that is acquired by migrants is generally sandy or saline–alkali with a small area, remote from home, and lacking irrigation resources. So, 91.6% of migrants reported that there was no unfair distribution of housing and land during the relocation process. However, 8.4% of the migrants think it is unfair, which is mainly manifested in different policy periods and the vast differences in policy benefits between registered poor households and the simultaneous relocation of non-poor households. The migrants who moved early generally produced the opinion of “move first rather than move later”. Non-poor households find it disconcerting that poor households enjoy the CNY 10,000 RMB house purchase ban, while they must purchase at market prices. To sum up, although the migrants in Wuwei City are subject to staged and hierarchical differences in the beginning of the fair distribution of public services, the process of distribution is fair that effectively guarantees the rights of survival and development of migrants.
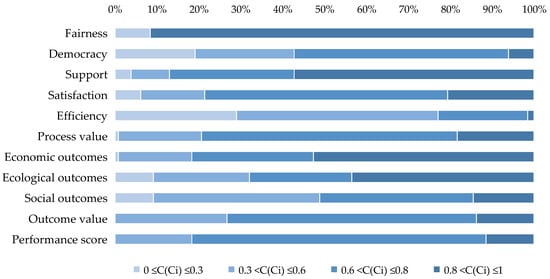
Figure 7.
Distribution of performance value of ERP in different intervals. Note: Ci indicates the average closeness of each component; C indicates the average closeness of performance value of ERP.
Mankiw (2006) contends that efficiency is the greatest benefit society can obtain from scarce resources, which can be measured by the subjective feelings of individuals [37]. Farell (1957) divided efficiency into two aspects: producer’s technical efficiency at the input–output level and consumer’s allocative efficiency at the supply–demand level [36]. Technical efficiency can reflect the relationships of input–output by the core subject’s understanding of project planning, implementation, quality evaluation, and content, while configuration efficiency utilizes the residents’ satisfaction for government public service to measure the achievement degree of the organization’s supply goals as well as the matching of output with goals. A total of 14.8% of the migrants know more about Wuwei ERP’s contents, whereas 42.5% of them are unclear. ERP encompass two transformation processes in spatial terms, the first being the process of space transfer (movements) to end absolute poverty, the second being the process of spatial reconstruction (constructions) to overcome the contradiction of relative poverty [5]. Regarding the convergence and transition of these two processes, 27.7% of migrants believe that the government does not emphasize speed and lower quality when promoting ERP. According to 44.9% of migrants in Tianzhu County, relocation occurred before the land was ready. It results in a sharp increase in the living costs of migrants and a reduction in their income sources after moving down, with the risk of returning to poverty high. In terms of allocative efficiency, i.e., satisfaction of migrants, 20.61% are higher than 0.8, 58.02% are rated between 0.6 and 0.8, and 6.11% are below 0.3. Among them, 84.73% of eco-migrants are satisfied with the compensation amount provided by the government, while 15.73% oppose the scheme, with Tianzhu migrants being the most vocal opponents. As the difference between expected utility and actual feeling, migrant satisfaction is also reflected in their recognition of government work and specific behaviors. The survey indicates that 41.6% of migrants believe the local government has done a lot to support the long-term development of migrants. In terms of specific behaviors, 34.4% of migrants are willing to praise the work of local government to media, relatives, and friends.
Support and democracy rank second and third on the process dimension. The average closeness is 0.776 and 0.628, respectively (Figure 6). On the frequency distribution, 57.25% and 6.11% of migrants’ support and democratic degree, respectively, are higher than 0.8 (Figure 7), 29.77% and 51.15% of migrants’ satisfaction and democratic degree, respectively, are between (0.6,0.8). In terms of support, compared with the difficult situation in mountainous areas, such as extensive planting and low harvest, food dependent on weather, difficulties in draught, travel, schooling, medical treatment, employment, and income increase, 67.94% of migrants are willing to move to resettlement villages, among which 37.4% are “very willing”. A total of 80.15% of the migrants believe that migrants and the government work together cooperatively to deal with the movement affairs, not often conflicting. Approximately 71.76% of the migrants think they sometimes consider issues from the standpoint of the local government and make some compromises to meet those requirements. According to the theory of public value and William N. Dunn’s public policy evaluation standard, the extensive participation opinion adoption of multiple subjects has become an integral part of public policy procedure justice that cannot be ignored. As the most direct stakeholders, relocation villagers should be involved in the decision-making process, implementation, and follow-up of the project. About 51.15% of the migrants believe that local government pays more attention to the cooperative relationship with the migrants, as well as listening to migrants’ opinions, which are mainly manifested in the follow-up industry development and infrastructure improvement in the resettlement area. A total of 19.08% of the migrants report they have hardly been involved in the formulation and implementation of the project planning or the solicitation and negotiation of compensation standards, even when they offer suggestions (such as increasing housing purchase subsidies, farming loans, public toilets, and school bus configuration, etc.); who would listen, let alone accept? The subjective evaluation of project performance is a comprehensive psychological study that is affected by the absolute amount of the project outcomes, the relative benefit level, and the perception of non-economic incentive factors (belonging, ownership, security, attention, development opportunity). A deficiency of policy democracy will impede the realization of its value goal and the output of public value, create the illusion that migrants are marginalized, and lower the satisfaction and support of migrants and other stakeholders.
On the dimension of outcome, the average closeness degree of economic value, ecological benefit, and social benefit of ERP is 0.733, 0.662, and 0.592, respectively (Figure 6). About 52.62%, 43.51%, and 14.50%, respectively, of the migrants scored the above factors above 0.8; 0.76%, 9.16%, and 9.16%, respectively, of the migrants rated the above elements below 0.3 (Figure 7). The social benefit score is low and concentrated between (0.3, 0.8). Since most local migrants move from the mountainous areas to the flat area, the traditional rural living space is rapidly transformed into the urban characteristic living space, which has led to transform their livelihoods (from traditional animal husbandry to crop farming, from rainfed agriculture to precision irrigation, from seasonal single work to a year-round choice of working outside) and increase living cost. A total of 20.61% of migrants think the cost of adjusting to the new production and lifestyle is very high. The reality of “no land to farm” and “insufficient employment opportunities” forced the migrants into non-agricultural industries. The traditional core or backbone family structure had been transformed into two pairs of symbiotic main axes as economic demands and sources of livelihood (grandfather and grandson become the main axis of living after migration, while young and middle-aged couples become the main axis of livelihood overseas) [38]. Moreover, the original social network structure of migrants has been impacted by the flower resettlement; 55.73% of migrants rate it as difficult to integrate into the current social and cultural atmosphere. They are experiencing a difficult adjusting dilemma of anxiety and unease. A total of 30.53% of migrants believed their prospects for the next five years were likely to improve. Although there are certain economic risks (such as re-poverty, loan difficulties, living expenses) in the process of rural reconstruction and capital reunion [37], the collective economic development of a village, such as facility agriculture, sand industry planting, professional cooperatives, industrial base construction, photovoltaic poverty alleviation, large-scale cattle and sheep breeding farms, shops, etc., provided guarantees and development space for migrants’ employment and stable income.
3.1.2. The Score and Distribution of Performance Value on the Regional Scale
Geographically, the ERP comprehensive performance of Gulang County is the highest (0.692) and Liangzhou District is the lowest (0.657). A total of 75% of Gulang migrants and 70.37% of Liangzhou migrants have a comprehensive performance value that is between (0.6, 0.8); greater than 0.8 only accounts for 11.67% and 3.7%, respectively (Figure 8). Performance scores were rated as follows: Gulang County > Tianzhu County > Liangzhou District in the process dimension and Gulang County > Liangzhou District > Tianzhu County in the outcome dimension. The Tianzhu migrants rated the project most highly for fairness, support, and social results, while the Gulang migrants rated the project most highly for democracy, satisfaction, efficiency, and economic outcome. Overall, Wuwei City’s three places perform well. Fairness and satisfaction of ERP are rated highly, followed by ecological outcome. The migrants are only able to choose relatively flat and arid desert areas for resettlement due to geographical limitations. Most resettlement villages are close to desert areas. The most prominent environmental problems in move-in areas are sparse vegetation and little surface runoff, sandstorms, land desertification or salinization, and water shortage. By preventing and controlling sandstorms, planting trees, and building reservoirs, the frequency of sandstorms and the water shortage problem has decreased to some extent. Hence, 68.70% and 55.73% of the migrants think ERP has helped restore the Qilian Mountains and control the Tengger Desert. A total of 56.49% of the resettlers believe that the results of local desertification control have met their expectations. The publicizing of ERP has increased migrant awareness of ecological preservation, and 34.8% are willing to pay some costs for local desertification control, with an average of CNY 418.
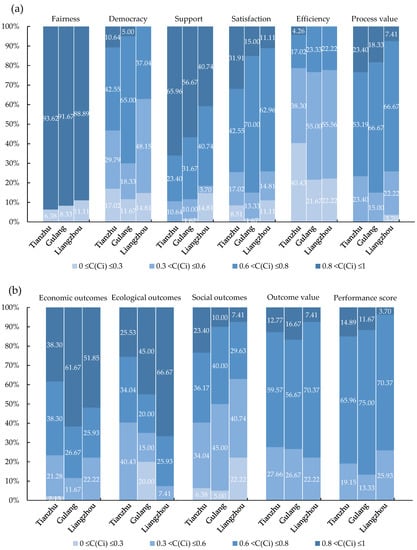
Figure 8.
Distribution of performance value of ERP in different spaces. (a) indicate that the distribution of average closeness of five sub-components in process dimension. (b) indicate that the distribution of average closeness of outcome dimension. Note: Ci indicates the average closeness of each component; C indicates the average closeness of performance value of ERP.
3.2. Diagnosis of Obstacle Factors for ERP
Key challenges to ERP performance include the willingness to pay for the ecological protection of migrants, the risk of returning to poverty, and the expected effect of desertification control. China is a traditional agricultural country with a thrifty simple ecological view and a value of harmony between man and nature. A wave of opening up and marketization reform attracted farmers with wealth, whose traditional ecological outlook were transformed into a development view based on economic interests. The extensive use of pesticides and fertilizers is one example. Rural areas must urgently reconstruct their ecological value systems. The willingness to pay for ecological protection (H3) of migrants, as a concrete embodiment of their ecological values transformation, has become the biggest obstacle with an average obstacle degree of 23.245%, a skewness of 0.054, and a kurtosis of −1.800 (Table 4). Under the background of rural revitalization, ecological revitalization is its important support and an ecological livable standard is the key. A good ecological livable standard provides the basis for a clean and tidy living environment, helps to improve residents’ comfort level and environmental identity, and plays a certain role in scientifically planning village layout, improving rural land space utilization efficiency, and promoting industrial agglomeration, rural tourism, and regional employment. Accordingly, the achievement degree of desertification control (G3) and the ecological efficiency of the relocation project (G2) become significant obstacles to the realization of the “two mountains theory”, to the unification of rural wealth and environmental beauty, and to improve the overall quality of the project.
Table 4.
Statistical characters of obstacle amounts against the performance of ERP.
The second obstacle is the risk of returning to poverty (F3). Its average obstacle degree is 11.999%, skewness is 0.747, and kurtosis is −0.778 (Table 4). Approximately 96.9% of Wuwei migrants face multiple livelihood risks, including high living expenses, insecure income, and the potential return to poverty [38]. Weak rural collective economy, narrow channels for increasing incomes, and insufficient hematopoietic function of industry make it difficult to stimulate the endogenous motivation of the poorer population and form an interactive and integrated pattern of boosting incomes through industry. Forcing people to leave the land and to work long-term outside the home will cause a vicious cycle of “population outflow, old aging-fading of family bonds, disintegration of acquaintance society, disintegration of mutual assistance system, rural decay, permanent hollowing out, village extinction, collapse of regional location” [39]. In order to prevent migrants from falling into the “trap of behavioral and spiritual poverty” by employing the weapons of the weak, and to avoid the repetition of the poverty cycle in resettlement districts, it is necessary to clarify the causes and environment in which migrants return to poverty. This has become a critical issue to consolidate the achievements of poverty alleviation and effectively link the “post-poverty alleviation era” with rural revitalization, as well as a major challenge to the effective performance of projects.
It is worth noting that the key obstacles to the Wuwei ERP performance are mainly concentrated in the outcome dimension, especially in the restoration and governance of the resettlement site’s ecology. The important obstacle in the process dimension is only migrant satisfaction of government subsidy (D1). Its average obstacle degree is 5.757%, skewness is 1.119, and kurtosis is 0.891 (Table 5). At the regional level, the top five factors of counties were consistent with the migrant diagnosis, as was the degree of obstacles (Table 5). The obstacle degree of Tianzhu County (60.664) was higher than Gulang County (60.573) and Liangzhou District (60.397). This indicates that the ERP implementation in the northern piedmont of the Qilian Mountains has the homogeneous and universal effect on the livelihood mode, living space, and rights’ perception of migrants. The migrants’ evaluation of ERP performance is similar. The migrants’ willingness to pay for ecological protection (H3), the risk of returning to poverty (F3), the effect of desertification control and the realization degree of expected goals (G2 and G3), and the industrial supporting and development are the obstacle factors.
Table 5.
The top five obstacle factors and degree in space.
4. Discussion
4.1. Innovations and Characteristics
As opposed to an evaluation based on static points, this study takes a comprehensive look at the entire process of resettlement and the process of reconstruction after resettlement, taking into account two dimensions: the process and the outcomes. The innovations of this study are as follows: (1) By utilizing the public value theory, the performance evaluation framework and index system are built for ERP in the process–outcome dimension. The framework clarifies the relationships between evaluation objects, engineering goals, and implementation results, demonstrating the logic of public value generation and explicit–implicit transformation. Providing a comprehensive analysis of ecological engineering performance, this framework combines the process and outcome dimensions to test the achievement degree of engineering objectives, which is useful in identifying problems and targeted regulations. (2) Triangular Fuzzy TOPSIS breaks through the traditional performance evaluation method that is bound by either/or in complex environment and subjective information. It has the advantages of being free from the interference of reference sequence selection, intuitive geometric meaning, less computation, and little information distortion. This method effectively quantifies the fuzziness of evaluator language variables and enhances the reliability of the evaluation results. (3) Combined with the rural revitalization to discuss the realistic performance, value logic and impact consequences of key obstacles in ERP performance evaluation from ecological revitalization and industrial revitalization.
4.2. Deficiencies and Prospects
As an important paradigm of public administration that integrates public service efficiency with equity and sustainability under the guidance of people’s wellbeing, public value evaluation has become a new perspective of ecological engineering performance evaluation and optimal management. While academics have evaluated and demonstrated the performance of various ecological projects in different regions by many methods, there remains a lack of deep analyses of other project types, stakeholders, age groups, cultural groups, livelihood modes, risk preferences, and obstacle factors. Future work may be able to use the “grid-group” cultural theory of Mary Douglas [40] to divide ecological migrants into four categories—hierarchy, egalitarianism, individualism, and fatalism—and to compare the similarities and differences among those cultural types as they relate to the evaluation of the public value of projects by screening the impact factor with the big load of correlation and coefficient as the index, via analytic hierarchy and ordered weighted average to calculate the criteria weights and order weight. A simulation of key factors and an evaluation of ecological engineering performance under multiple scenarios will be conducted, followed by the mitigation of obstacles to ecological engineering performance under different decision preferences and the projection of project performance under different development orientations. The final point is to propose the differentiation of policy schemes for local engineering optimization and regulation.
At present, sustainable development has become a leading target of scientific research and policy agenda [41]. A sustainability assessment is an effective way to judge the long-term viability of a development project. This process is comprehensive and participatory in nature and it requires multiple actors, including external evaluators and internal participants (farmers, technicians, community representatives, and other stakeholders) [41]. The evaluation process must rely on years of continuous statistical analysis, professional monitoring, implementation data, and cognitive assessment of multiple subjects. The concepts of project performance evaluation and sustainable development evaluation are not equivalent; there are differences regarding concept connotation, dimension design and analysis emphasis, data demand, and support, etc. From the perspective of quantitative statistics and research content, Zhang et al., based on three common operating processes of standard formulation, weight distribution, and ranking verification, conducted the longitudinal and horizontal comparisons of the application status of 23 multi-criteria decision models (including DEMATEL, Regime, VIKOR, WASPAS, WLC, and TOPSIS) in the evaluation of rural spatial sustainability [42]. James et al., introduced the models of agricultural production systems, the CERES-Wheat and CERES-Maize crop models, the development of global livestock models and others, and summarized the history of agricultural system modeling and the experience and lessons of system development [43]. These sustainable development and agricultural systems and methods of model development can serve as references for the ecological engineering of comprehensive performance evaluation to broaden the analysis of the performance evaluation of dimensions. Several difficulties are resolved by these findings, such as the mixed qualitative and quantitative results, the fusion calculation of multidimensional data (questionnaire data and statistical data, spatial data, and integrated index), and multi-standard classification accounting from the perspective of multi-subject synthesis. The MESMIS framework described by López-Ridaura et al., can be used as a reference in the future, and attributes such as productivity, stability, flexibility, adaptability, fairness, and self-reliance can be incorporated into the performance evaluation framework and the indicator system. The Hellwig Method [44], the Dow Jones Index, the multidimensional gray evaluation model, and other methods are used to assess the overall performance of the project.
4.3. Reflection
As opposed to their twins (fairness and democracy, which are the most important aspects of measuring policies in the theory of public value), deprivation is a phenomenon of unfair distribution of resources, rights, and opportunities, and even a manifestation of psychological disparity. Studies on fair and democratic ERP based on the quantity and quality of resource allocation and compensation amounts satisfaction to explore the issue of a fair and impartial distribution. These studies failed to address the spatial deprivation issues in the resettlement process, such as land use efficiency, community support facilities and public service provision, livelihood capacity and policy welfare, as well as the relative deprivation perception as compared with other groups. In terms of spatial value, production, and distribution justice, spatial deprivation represents the negative feedback of social equity at the process level and the characteristics of invisible deprivation at the outcome level. According to Hu et al. [5], there is a phenomenon of spatial deprivation during the process of resettlement village reconstruction, but the overall level of deprivation is low. The lack of pricing for rural space resources causes the value-added income generated by space resources to be disproportionately captured by investors, which results in “rent dissipation” of space resources, a new “hidden deprivation” after “elite capture” [45]. Deprivation of this type is the result of poor soil quality in migrant areas, making it necessary for migrants to work in non-agricultural industries. The above research results also verify that the distribution fairness of ERP had high performance, but the social outcome was low.
4.4. Suggestion
To realize a synchronous and fair development of regional social space in the context of rural revitalization, it is essential to propose a suitable compensation and development strategy from the land, ability, industry, and concept. First, improve the newly divided land, standardize the land transfer procedures, and enhance the vocational training of laborers, the human families’ capital reserves, and the livelihood transformation capabilities. The “hidden deprivation” of the economic income of general migrant families caused by “rent dissipation” and “elite capture” of space resources should reduce. Second, clarify the correspondence and undertaking degree between government-supported resources and migration needs, actively expand the channels for migration to increase income, improve the rural micro-credit policies, lead rural industry revitalization with the development concept of “two mountains”, develop from “one production” agriculture to secondary and tertiary industries, and expand the market area and operation chain of follow-up industries. Change the “mobile” way of living of migrants into the “livable” ideal of life. High altitude, less pests and diseases in sandy soil, and high temperatures allow us to develop special income and to develop the sand industry, special mushrooms (Morchella and Auricularia), and pasture cultivation. Third, change the traditional concept of relying on the government and realize the intergenerational transmission of the struggle spirit. Based on the concept of diversified and integrated development, coordinate and match the people–land, business types, and urban–rural in order to improve the branding, e-commerce, and organization of regional industries.
5. Conclusions
Mark Moore’s Public Value Theory, representing the fourth paradigm change in public administration, weakens the criterion of “efficiency first” and emphasizes the composition, creation, and transmission of public value in the process and outcome dimensions, which helps researchers to identify the problems, pinpoint the crux, and suggest targeted adjustment strategies. With the Triangular Fuzzy TOPSIS method of evaluating the performance of the Wuwei’s ERP as well as the diagnosis of obstacle factors, we expand the dimension and method of traditional performance evaluation of ecological engineering. This research is helpful to explore the long-term governance mechanisms of the Qilian Mountains, to sum up the experiences of migration and reliable model, and to reveal the key obstacles, resistance types, and promotion potentials in the migration engineering practice. These findings can be used as a case study to support the overall revitalization of resettlement villages and the optimization of human–land systems under the concept of shared welfare and sustainable development in alpine, oasis, and desert areas. Overall, Wuwei ERP has a good performance, the average closeness degree of process is higher than outcome, and Gulang County is higher than Tianzhu County and Liangzhou District. Migrants rated the fairness of the project as the highest, followed by support, economic outcome, and satisfaction. Key obstacles mainly revolve around the outcome dimension, especially the restoration and management of ecology, the risk of returning to poverty, and industrial development in resettlement sites. Its core lies in the vulnerability of spatial resources, coupled with the lack of institutional norms in the utilization process that leads to a convergence of “hidden deprivation” phenomena and adverse at the outcome level. In rural revitalization, it is important to regulate migration and development as best as possible by standardizing land transfer procedures, improving the livelihood ability of migrants, reducing the hidden deprivation of spatial resources, and by engaging in sand industry and characteristic planting to achieve diversified industrial integration and sustainability. The conclusion in the arid areas in northwest China is consistent with objective reality. Accordingly, it is consistent with the results of the livelihood risks of eco-migrants in Wuwei found in Wang et al. [38]; specifically, the risk of returning to poverty and the lack of follow-up industries pose the greatest challenges and key obstacles. An improvement in eco-migrants’ ecological awareness has a positive impact on their behavior intentions regarding the environment [46], which is conducive to realizing and maintaining the ecological benefit of the ERP. Individual members of the immigrant family can form a similar perspective of economic interests and attitude toward life as a result of the relocation. Although the selected sample is small, it is sufficient to support the conclusion. An evaluation of migrants who are living in the Heihe and Shule River basins, which lie at the foot of the Qilian Mountains, can verify the accuracy and universality of this conclusion.
Author Contributions
Conceptualization, Y.W.; methodology, Y.W.; formal analysis, Y.W.; investigation, Y.W.; resources, Y.W.; data curation, Y.W.; writing—original draft preparation, Y.W.; writing—review and editing, Y.W. and L.Z.; supervision, L.Z. and Y.W.; project administration, L.Z.; funding acquisition, L.Z. All authors have read and agreed to the published version of the manuscript.
Funding
This study was financially supported by the Strategic Priority Research Program of the Chinese Academy of Sciences [XDA20020401]; The Second Tibetan Plateau Scientific Expedition and Research Program (STEP) [2019QZKK0404]; Gansu Province social science planning general project [2021YB156].
Institutional Review Board Statement
Not applicable.
Informed Consent Statement
Not applicable.
Data Availability Statement
The data presented in this study are available on requested from the author.
Acknowledgments
Thanks to Yang Liu and Junhao Li for assisting us in literature data collection.
Conflicts of Interest
The authors declare that they have no known competing financial interests or personal relationships that could have appeared to influence the work reported in this paper.
References
- Chen, S.D.; Kong, F.B. On development and prospects of farmers’ sustainable livelihoods research based on ecological. J. Poyang Lake 2016, 5, 59–71, 127. [Google Scholar]
- Zhao, X.; Garber, P.A.; Li, M. Alleviating human poverty: A successful model promoting wildlife conservation in China. Conserv. Sci. Pract. 2021, 3, e511. [Google Scholar] [CrossRef]
- Yang, L.; Wang, J.L.; Wang, K. Establishment and verification the Benefit cube of forestry ecological engineering benefit: A case analysis based on Beijing-Hebei cooperation afforestation project. J. Agrotech. Econ. 2016, 5, 92–101. [Google Scholar] [CrossRef]
- Xu, W.; Zhao, W. Performance evaluation of rural land consolidation based on public value: Cases of Hubei, Hunan and Hebei Province. Areal Res. Dev. 2020, 39, 163–168. [Google Scholar]
- Hu, X.W.; Liu, X.P.; Huang, Y.; Huang, L.; Dong, M. Measurement of spatial deprivation of eco-migrant villages and its impact factors in Ningxia. Acta Geogr. Sci. 2020, 75, 2224–2240. [Google Scholar]
- Wang, Y.; Zhou, L.H.; Yang, G.J.; Guo, R.; Xia, C.Z.; Liu, Y. Performance and Obstacle Tracking to Natural Forest Resource Protection Project: A Rangers’ Case of Qilian Mountain, China. Int. J. Environ. Res. Public Health 2020, 17, 5672. [Google Scholar] [CrossRef]
- Moore, M.H. Creating Public Value: Strategic Management in Government; Harvard University Press: Cambridge, MA, USA, 1995. [Google Scholar]
- Kelly, G.; Mulgan, G.; Muers, S. Creating Public Value: An Analytical Framework for Public Service Reform; Cabinet Office Strategy Unit: London, UK, 2002. [Google Scholar]
- Horrner, L.; Hazel, L. Adding Public Value; The Work Foundation: London, UK, 2005. [Google Scholar]
- Hu, M.Z. On Public Value. J. Beijing Norm. Univ. 2008, 1, 99–104. [Google Scholar]
- He, Y.L. “Public Value Management”: A New Paradigm of Public Administration. Cass J. Political Sci. 2009, 6, 62–68. [Google Scholar]
- Bao, G.X.; Wen, H.; Wang, X.J. The Construction of Government Performance Management Discipline System Based on Public Value. Chin. Public Adm. 2012, 5, 98–104. [Google Scholar]
- Wang, X.J. Loss of government performance and its measurement:Theoretical framework under the public value management paradigm. Adm. Trib. 2017, 24, 88–93. [Google Scholar]
- Wang, X.J.; Zhang, H. Research Approaches and Cutting-edge Questions of Public Value. J. Public Manag. 2013, 10, 126–136, 144. [Google Scholar]
- Jiao, K.Y.; Wu, Y.Q. Construction and operation of performance evaluation system for rural special poverty alleviation policies: An empirical study based on public values. Rural. Econ. 2014, 9, 16–20. [Google Scholar]
- Zhang, L.; Chen, Y. Digital Government Performance Evaluation Based on Public Values: A Theoretical Review and Conceptual Framework. E-government 2021, 7, 57–71. [Google Scholar]
- Fan, S.Y.; Chen, Y.L.; Xu, J. Performance evaluation and comparison of ecological construction policies based on public value. J. Public Manag. 2013, 10, 110–116, 142–143. [Google Scholar]
- Bao, G.X.; Wang, X.J. Public Value—Based Government Performance Governance: Origin, Structure and Research Questions. Chin. Public Adm. 2012, 9, 89–97, 126–127. [Google Scholar]
- Zadeh, L.A. The concept of linguistic variable and its application to approximate reasoning. Inf. Sci. 1975, 8, 199–249. [Google Scholar] [CrossRef]
- Atanasso, K. Intuitionistic Fuzzy Sets. Fuzzy Sets Syst. 1986, 20, 87–96. [Google Scholar] [CrossRef]
- Xu, Z.S. The Least Variance Priority Method (LVM) for fuzzy complementary judgement matrix. Syst. Eng. Theory Pract. 2001, 10, 93–96, 130. [Google Scholar]
- Wang, H.Y.; Chen, G. Risk prioritization of ship oil spill accident in terms of situation evolution. Navig. China 2019, 42, 89–94. [Google Scholar]
- Nie, Y. Public value analysis and the building of performance evaluation system of ecological construction project. J. Hebei Univ. 2016, 41, 135–140. [Google Scholar]
- Fan, S.Y.; Chen, Y.L.; Yang, J.D. Public value performance and internal structure of ecological construction projects: Taking Chicheng County of Hebei Province as an example. J. UESTC 2014, 16, 1–7, 21. [Google Scholar]
- Nie, Y.; Liu, Q. Public Value Analysis and Performance Evaluation of Ecological Governance Policy from the Perspective of Public Value: A Case Study of Wulan County of Qinghai. Henan Soc. Sci. 2018, 26, 40–44. [Google Scholar]
- Nie, Y.; Fan, S.Y.; Zhong, Y. An empirical study on the performance of the ecological construction project in Weng Niu Te Banner, Inner Mongolia: On the construction of an evaluation system for ecological construction in Mongolian Populated Areas. Qinghai Soc. Sci. 2021, 4, 116–126. [Google Scholar]
- Ding, J.; Liu, Y.; Fan, S.Y. Performance evaluation of a water environment control project in Erhai Basin, Yunnan Province, based on public values. J. Hydroecology 2020, 41, 1–7. [Google Scholar]
- Hwang, C.L.; Yoon, K. Multiple Attribute Decision Making: Methods and Applications a State-Of-The-Art Survey; Springer: Berlin/Heidelberg, Germany, 1981. [Google Scholar]
- Peng, M.Y.; Li, Z.W.; Yang, A.W.; Xi, Z.F.; Fang, C.Z. An ICA-TOPSIS based air combat threat assessment. J. Detect. Control. 2021, 43, 113–121. [Google Scholar]
- Zhu, W.D.; Du, C.Y.; Wu, Y. A decision making method of Topsis based on the correlation matrix. Math. Pract. Theory 2014, 44, 33–38. [Google Scholar]
- Tang, R.; Tian, J.J.; Ma, Y.X. Quantitative evaluation of high quality eletric power based on improved Topsis grey relational projection method. J. Shaanxi Univ. Technol. 2021, 37, 25–30. [Google Scholar]
- Han, Q.S.; Yu, M.J.; Gao, Y.Y.; Song, S.; Chen, S.Y. TOPSIS Method Based on Cloud Model and Distance Entropy in Evaluating the Air Multi-target Threat. Fire Control. Command. Control. 2019, 44, 136–141. [Google Scholar]
- Chen, S.J.; Hwang, C.L. Fuzzy Multiple Attribute Decision Making Methods; Springer: Berlin, Germany, 1992; pp. 289–486. [Google Scholar]
- Hsieh, T.Y.; Lu, S.T.; Tzeng, G.H. Fuzzy MCDM approach for planning and design tenders selection in public office buildings. Int. J. Proj. Manag. 2004, 22, 573–584. [Google Scholar] [CrossRef]
- Jia, F.; Zhang, H.; You, J.X.; Wang, Y. The matching between the resilience and vulnerability of the Cross-border E-commerce supply chain based on Fuzzy AHP and Fuzzy TOPSIS methods. Supply Chain. Manag. 2020, 1, 33–52. [Google Scholar]
- Guan, Y.B. Research on Performance Evaluation and Improvement of Government Public Services Oriented by People’s Livelihood; Southwestern University of Finance and Economics Press: Chengdu, China, 2020. [Google Scholar]
- Mankiw, G. Principles of Economics; Peking University Press: Beijing, China, 2006. [Google Scholar]
- Wang, Y.; Liu, Y.; Zhou, L.H. The livelihood risk and strategic choice of the ecological migrants at the northern foot of Qilian Mountains: A case study of Wuwei city. J. Nat. Resour. 2022, 37, 521–537. [Google Scholar]
- Shen, Q.P. Early Warning Mechanisms for Returning to Poverty in Ethnic Areas of the Northeast Frontier in the Post Poverty Alleviation Era. J. Beifang Univ. Natl. 2020, 6, 41–48. [Google Scholar]
- Douglas, M. Cultural Bias; Royal Anthropological Institute of Great Britain and Ireland: London, UK, 1978. [Google Scholar]
- López-Ridaura, S.; Masera, O.; Astier, M. Evaluating the sustainability of complex socio-environmental systems. The MESMIS framework. Ecol. Indic. 2002, 2, 135–148. [Google Scholar] [CrossRef]
- Yuan, Z.; Wen, B.; He, C.; Zhou, J.; Zhou, Z.; Xu, F. Application of Multi-Criteria Decision-Making Analysis to Rural Spatial Sustainability Evaluation: A Systematic Review. Int. J. Environ. Res. Public Health 2022, 19, 6572. [Google Scholar] [CrossRef] [PubMed]
- Jones, J.W.; Antle, J.M.; Basso, B.; Boote, K.J.; Conant, R.T.; Foster, I.; Godfray, H.C.J.; Herrero, M.; Howitt, R.E.; Janssen, S.; et al. Brief history of agricultural systems modeling. Agric. Syst. 2017, 155, 240–254. [Google Scholar] [CrossRef] [PubMed]
- Ogryzek, M.; Rząsa, K.; Źróbek, R. Change in the Level of Agricultural Development in the Context of Public Institutions’ Activities—A Case Study of the NASC Activities in Poland. Land 2021, 10, 187. [Google Scholar] [CrossRef]
- Tang, L.; Dong, X.D. Rural Revitalization and Institutional Innovation of Spatial Resources Utilization: How to Weaken the “Hidden Deprivation” of Space in the “Tertiary Industrialization”. Explor. Free Views 2019, 12, 113–123, 159–160. [Google Scholar]
- Dong, M.; Zhao, J.Y.; Gao, Y.H.; Ou, Y.W. Does ecological awareness affect ecological behavior? Evidence from Ningxia. J. Arid. Land Resour. Environ. 2019, 33, 50–56. [Google Scholar]
Publisher’s Note: MDPI stays neutral with regard to jurisdictional claims in published maps and institutional affiliations. |
© 2022 by the authors. Licensee MDPI, Basel, Switzerland. This article is an open access article distributed under the terms and conditions of the Creative Commons Attribution (CC BY) license (https://creativecommons.org/licenses/by/4.0/).