Abstract
The low profitability of agricultural products in a globalized market context is causing the abandonment of less profitable agroforestry systems in Spain. This fact is implicated in a change in land use, increasing the forest area, which could alter the carbon stock in the soil. Thus, the objective of this study was to determine if the abandonment of rural areas and the change in land use has an impact on the soil organic carbon stock in agroforestry systems in southwestern Spain. Through historical aerial photographs and current satellite images, sites were identified where samples of abandoned agricultural soils in the 1950s were collected. They were compared with soil samples from adjacent locations whose agricultural activities continue to this day. After more than 60 years, the abandonment of agricultural activity is associated with a 54% increase in C concentration and 34.8% in soil organic carbon in the upper 30 cm of soil profiles. Therefore, the abandonment of agricultural land has influenced the carbon stock of this territory, becoming a carbon sink.
1. Introduction
Rural regions are facing great challenges [1]. Agricultural intensification in a globalized context hinders the sustainability of regions with less productive soils [2]. A direct consequence of this is migration from rural areas to cities and the subsequent rural depopulation [3,4]. For example, Spain had a considerable loss of rural population between the years 1960 and 1975. Such loss has increased since the last economic crisis of 2008 to this date [5,6,7]. Sixty-one percent (4000) of the municipalities of Spain have no more than 1001 inhabitants. Among these, 1286 municipalities (358 more than in the year 2000) have less than 100 registered inhabitants, which puts them at maximum risk of demographic extinction [7]. Apart from an aging population and a loss of services, this rural depopulation involves the abandonment of marginal agricultural lands and the loss of knowledge associated with the activities of the rural environment, i.e., husbandry, agriculture and/or forestry [8,9,10]. In Spain, an estimated 12 million hectares of rural land have been abandoned [11,12].
After the end of the agro-livestock activities, the abandoned agrosystems begin to be colonized by natural vegetation [13]. In the absence of new disturbances, forest mass can appear by natural regeneration [14,15]. Specifically, the forest area of Spain has increased 31% in the 1990–2010 period, with a forest increase rate of 48,000 ha y−1 [16]. In areas with a greater slope, Mediterranean climate conditions and a historically high anthropic pressure, the traditional agricultural systems are practiced in terraces [17,18].
The soil, as a fundamental component of the ecosystem, plays a key role in the functions of provisioning and regulation of ecosystem services [19,20]. The soil is the substrate in which the vegetation and crops settles, it provides it with the necessary nutrients for the production of biomass and recycles these nutrients after the incorporation of the necromass [21]. However, in addition, it participates in the carbon cycle in a dynamic way, regulating the concentration of atmospheric CO2 [22,23]. The importance of the role that soils play in the carbon cycle has gained research interest in different world summits [24]. Increasing the stocks of SOC (soil organic carbon) is considered one of the most economical and effective ways of balancing atmospheric CO2 concentrations [25]. Accurate estimations of regional SOC stocks and their variability are necessary for understanding the carbon cycle and global climate change as well as improving carbon management strategies in terrestrial ecosystems [26]. The SOC constitutes approximately two-thirds of the carbon sequestered in terrestrial ecosystems [27,28,29]. The organic matter accumulated in the surface horizons of the soil (epipedons) contain 1200–1500 Pg C (1 Pg = 1015 g), mainly in the form of biostable humified substances [28,30].
There are many factors and processes that determine the direction and rate of change in SOC content when vegetation and soil are disturbed. Several studies have found that the conversion of forests to agricultural land leads to an annual global loss around 16 Pg C [31]. On the contrary, due to the transformation of agricultural lands into perennial systems, several investigations have inferred that the terrestrial ecosystems of the northern hemisphere were storing carbon in the soil at a rate of 1–2 Pg C year−1 during the 1990s of the last century [32].
The intensification of agricultural soil management that took place in Europe during the second half of the 20th century has resulted in a considerable decrease of the content of carbon in soil [33,34,35]. Edaphic carbon is important in the soil as it affects many properties of soils, including their ability to retain water and nutrients, to provide structure promoting efficient drainage and aeration, and to minimize loss of topsoil via erosion [36]. Agronomists consider soils with less than 1.7% organic matter to be in pre-desertification stage [37]. However, the current abandonment of agricultural lands and their transformation or naturalization into forest areas could be changing this reality since forest soils are characterized for having higher content of organic matter than agricultural soils [28]. Moreover, grasslands generally reach higher SOC levels than croplands due to plant shoots and roots and contributions of animal C inputs to soils [38,39], with notable exceptions for agricultural classes with high plant residues, such as the irrigated corn. Two effects cause this result: the contribution of necromass increases the entry of C into the soil and the vegetal cover of the soil reduces the mineralization of C [40]. These behaviors are highly variable and also depend on the climatic, geological, and orographic conditions of the studied area.
The aim of this study was to determine if the changes in land use caused by the abandonment of agricultural lands in the last 60 years are associated with changes in the carbon concentration and the amount of total carbon in the soil. A territory not studied in southwestern Spain is taken as a model for the growing depopulation of rural areas in Spain and the growing transformation from a traditional low-productivity agricultural system to forest systems.
2. Materials and Methods
2.1. Study Area
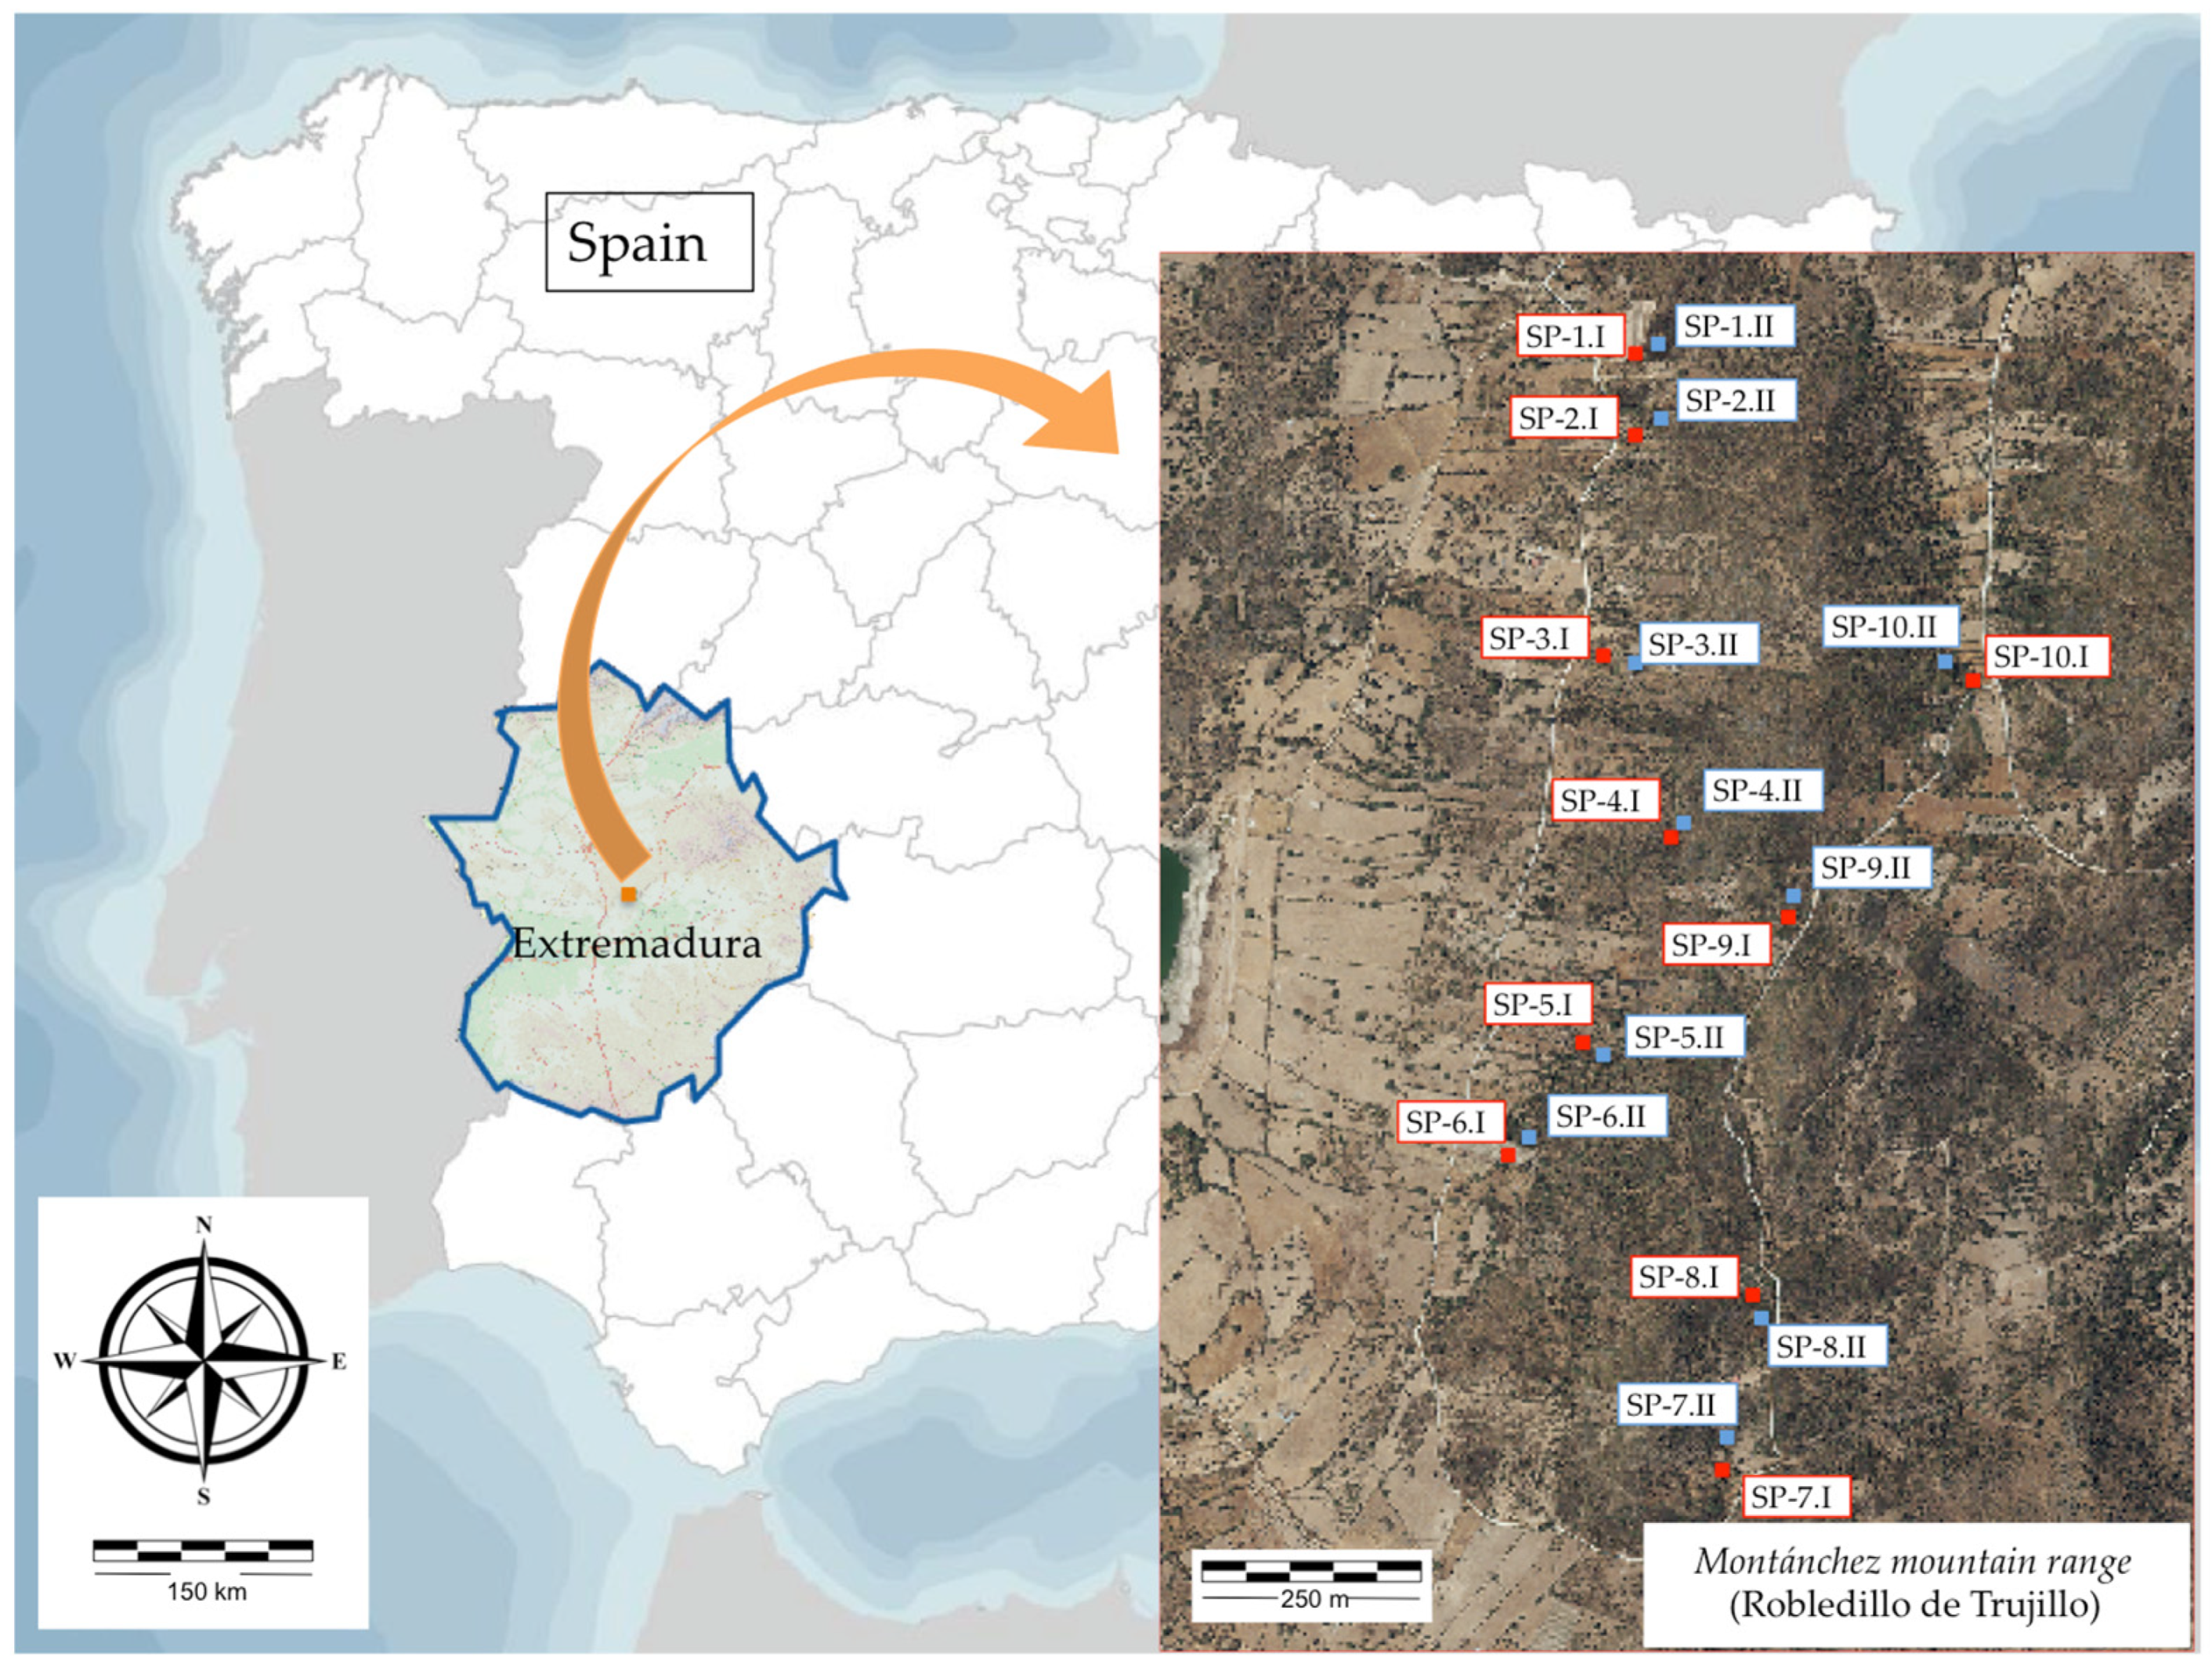
This study was located in the Montánchez mountain range, located in the south of the province of Caceres, in the municipality of Robledillo de Trujillo (2000 inhabitants in 1950; 360 in 2020 [41], Extremadura, Spain. (39°16′10.43′′ N–5°58′49.34′′ W) (Figure 1).
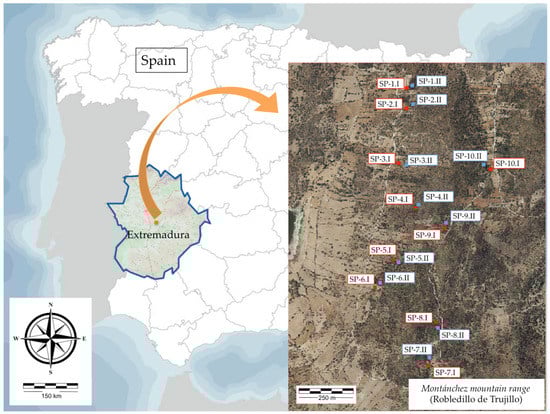
Figure 1.
Study area and sampling points (SP). I: location considered permanent cultivated soil (CS); II: location considered abandoned agricultural soil (AS). Satellite image SIGPAC (2020). (Source: images gathered from IDEE and own source).
The climate of the study area is Mediterranean, with an average annual temperature of 16 °C, and an average annual rainfall of 517 mm. Its bioclimatic description situates it in the meso-Mediterranean level. Its underlying geological material emerged in the Late Paleozoic and is characterized by metamorphic granite outcrops and massifs [42]. Its acidic and shallow soils are classified as Cambisol dystric (CM-dy) [43].
The above climate and soil characteristics support natural vegetation of meso-Mediterranean Portuguese–Extremaduran oak populations constituted by a dense forest structure of Quercus pyrenaica, although it is frequently mixed with holm oaks (Quercus ilex subsp. ballota) in ecotone areas, cork oaks (Quercus suber), and quejigos (Quercus faginea subsp. broteroi). The shrub layer is mainly composed of Daphne gnidium, Phillyrea angustifolia, Cistus ladanifer, Cytisus striatus, Cytisus multiflorus, and Ruscus aculeatus [44]. The main massif of the area is 784 m high, with steep slopes [42], causing the dwellers of this region to build terraces in the hillsides for traditional agricultural use with plow (Figure 2E). The most frequent crops are olives and grapes, although their current exploitation is very marginal, making it difficult to choose suitable locations for sampling.
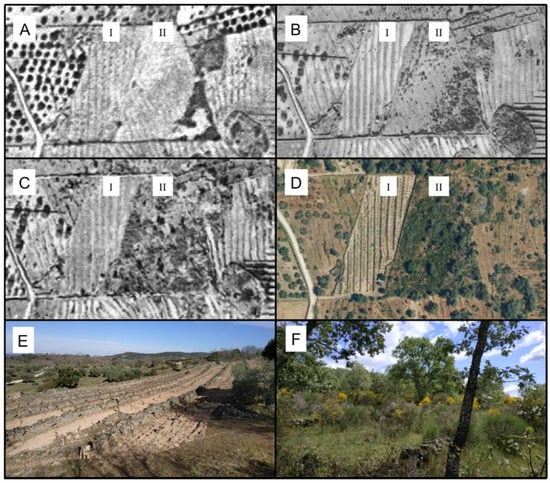
Figure 2.
As an example, evolution of the soils of the two sampling points; I: location considered permanent cultivated soil (CS); II: location considered abandoned agricultural soil (AS). (A) Aerial picture (1956). (B) Interministry orthophoto (1976). (C) Orthophoto SIG Oleícola (1998). (D) Satellite image SIGPAC (2016). (E) Current picture of point 1.I (2020). (F) Current picture of point 1.II (2020). (Source: images gathered from IDEE and own source).
2.2. Sampling Design
Twenty sampling points were selected in terraces, based on the use of the soil in the last 60 years, following two fundamental analyzed situations:
The discrimination was carried out by consulting cartographic sources, through the viewfinder incorporated on the website of the Spatial Data Institute of the Spanish Ministry of Development [42]. The sources consulted were: American flight Series A 1945–1946, American flight Series B 1956–1957, interministry orthophoto 1973–1986, national orthophoto 1980–1986, SIG Oleícola 1998, SIG PAC 2002, and current satellite image (Figure 2).
From each sampling point, a single sample was analyzed at three different depths: 0–10 cm, 10–20 cm, and 20–30 cm (n = 60). The aim was to determine the variations in the amount of carbon at different depths of the soil profile. To reduce the errors caused by the heterogeneity of the soil, each sample aggregated from three soil cores separated from each other by 5 m (triangle-shape).
The method followed to collect the soil samples is known as the “known volume cylinder method” [45]. By this method, a metal cylinder of known volume (10 cm deep and 10 cm in diameter) is pierced into the soil, and, without compressing, the volumetric sample of soil is extracted unchanged.
Once in the laboratory, after drying and weighing, the samples were then filtered by sieving (2 mm pore size) to separate the thick fraction of stones and gravels (>2 mm) from soil fraction (<2 mm). Soil texture (0–30 cm) was analyzed using the Bouyoucos method [46].
2.3. Carbon Content in Soil
This soil has no limestone or other rock-C components, so it is assumed that the measured carbon in soil is equivalent to the amount of organic carbon in it, the total carbon content in soil, expressed as g m−2, is obtained by applying the following formula [47]:
where C is the carbon concentration of fine soil fraction (mg 100 mg−1). The organic carbon concentration in soil was determined using the method of Walkley and Black (1934) [48], by dichromate oxidation [49]. Da is the apparent density of soil (g cm−3). For its calculation, the dry weight of the samples were divided by its volume. G is the horizon thickness (cm) and V is the percentage of horizon volume occupied by stones and gravels. It was estimated by quantifying the volume of water evacuated in a pipe when submerging the stones and gravel.
SOC = 100C × Da × G × (100 − V)/100
This method underestimates around 30% of the real organic carbon content. In the work published in 1934, Walkley and Black, propose a factor of 1.3 to express the results in percentage of organic carbon or carbon concentration. Later work confirms this mean value [28,50,51].
2.4. Statistical Analyses
The distribution and heteroscedasticity of the data were tested by applying the Shapiro–Wilk test and the Breusch–Pagan test, respectively. All variables analyzed present normal distribution (Shapiro–Wilk test, p > 0.05) except SOC (Shapiro–Wilk test, p < 0.05). Thus, to compare the apparent density (Da), the percentage of stone volume (%V), and the carbon concentration between horizons, the parametric Student’s t-test was performed. In the case of SOC, it was analyzed using the non-parametric Mann–Whitney U-test. To compare the carbon concentration between the abandoned and cultivated soils, the Student’s t-test of paired samples was performed. Moreover, to compare the SOC between abandoned and cultivated soils, the Wilcoxon test was performed. In addition, the ANOVA test and the Student’s t-test were performed to compare the carbon concentration values throughout the profile in each land use. Moreover, Student’s t-test for paired samples was performed to compare values per horizon between cultivated and abandoned soils. Similarly, the Kruskal–Wallis test and the Mann–Whitney U-test were performed to compare the SOC values throughout the profile in each land use. Moreover, the Wilcoxon test for paired samples was performed to compare values per horizon between cultivated and abandoned soils.
All the analyses were carried out using the IBM SPSS Statistics v. 22 software.
3. Results
Table 1 shows the parameter values required for the SOC calculation. Stoniness increases as depth increases, but the differences are not significant (p > 0.05). The Da does not vary between the horizons analyzed. The carbon concentration depends on the depth of the soil profile, finding significant differences (p < 0.05) between the most superficial part and the rest. The average values found, regardless of land use, in the upper 10 cm (H1) correspond to 3.23 ± 1.34 mg C 100 mg−1, which decreases to 1.25 ± 0.26 mg C 100 mg−1 on the H3 (20–30 cm) (p < 0.05). The same is true when analyzing the SOC going from 22.27 ± 7.67 Mg C ha−1 to 9.38 ± 1.67 Mg C ha−1 (p < 0.05). When the thickness of the horizon considered is extended to 30 cm (TH), the land studied has a carbon concentration of 1.97 ± 1.09 mg C 100 mg−1 and a SOC of 43.89 ± 11.41 Mg C ha−1. Half of the carbon in the edaphic profile analyzed is found in the upper 10 cm.

Table 1.
%V (stone volume percentage), Da (apparent density, g cm−3), C concentration (mg C 100 mg−1), and SOC (soil organic carbon, Mg C ha−1) for the three analyzed horizons as average of both land uses (cultivated and abandoned) (H1: 0–10 cm; H2: 10–20 cm; H3: 20–30 cm) and for the entire profile (TH: 0–30 cm). Comparison between horizons; a, b: different letters indicate significant differences (Student’s t-test and Mann–Whitney U-test, p < 0.05).
In the studied land, the increase in C concentration after abandonment was above 54%, going from 1.54 ± 0.76 mg C 100 mg−1 in cultivated soils (CS) to 2.38 ± 1.59 mg C 100 mg−1 in abandoned soils (AS) (Figure 3).
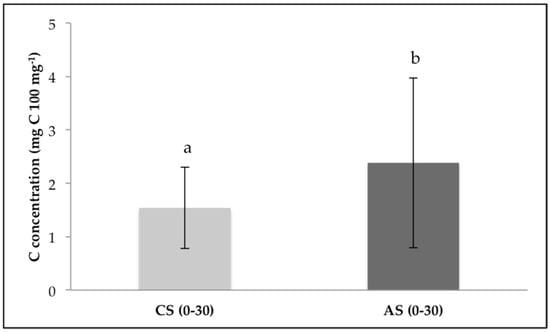
Figure 3.
Comparison between the values of C concentration (mg C 100 mg−1) in the first 30 cm of cultivated soils (CS) and abandoned soils (AS); a, b: different letters indicate significant differences (Student’s t-test of paired samples, p < 0.05).
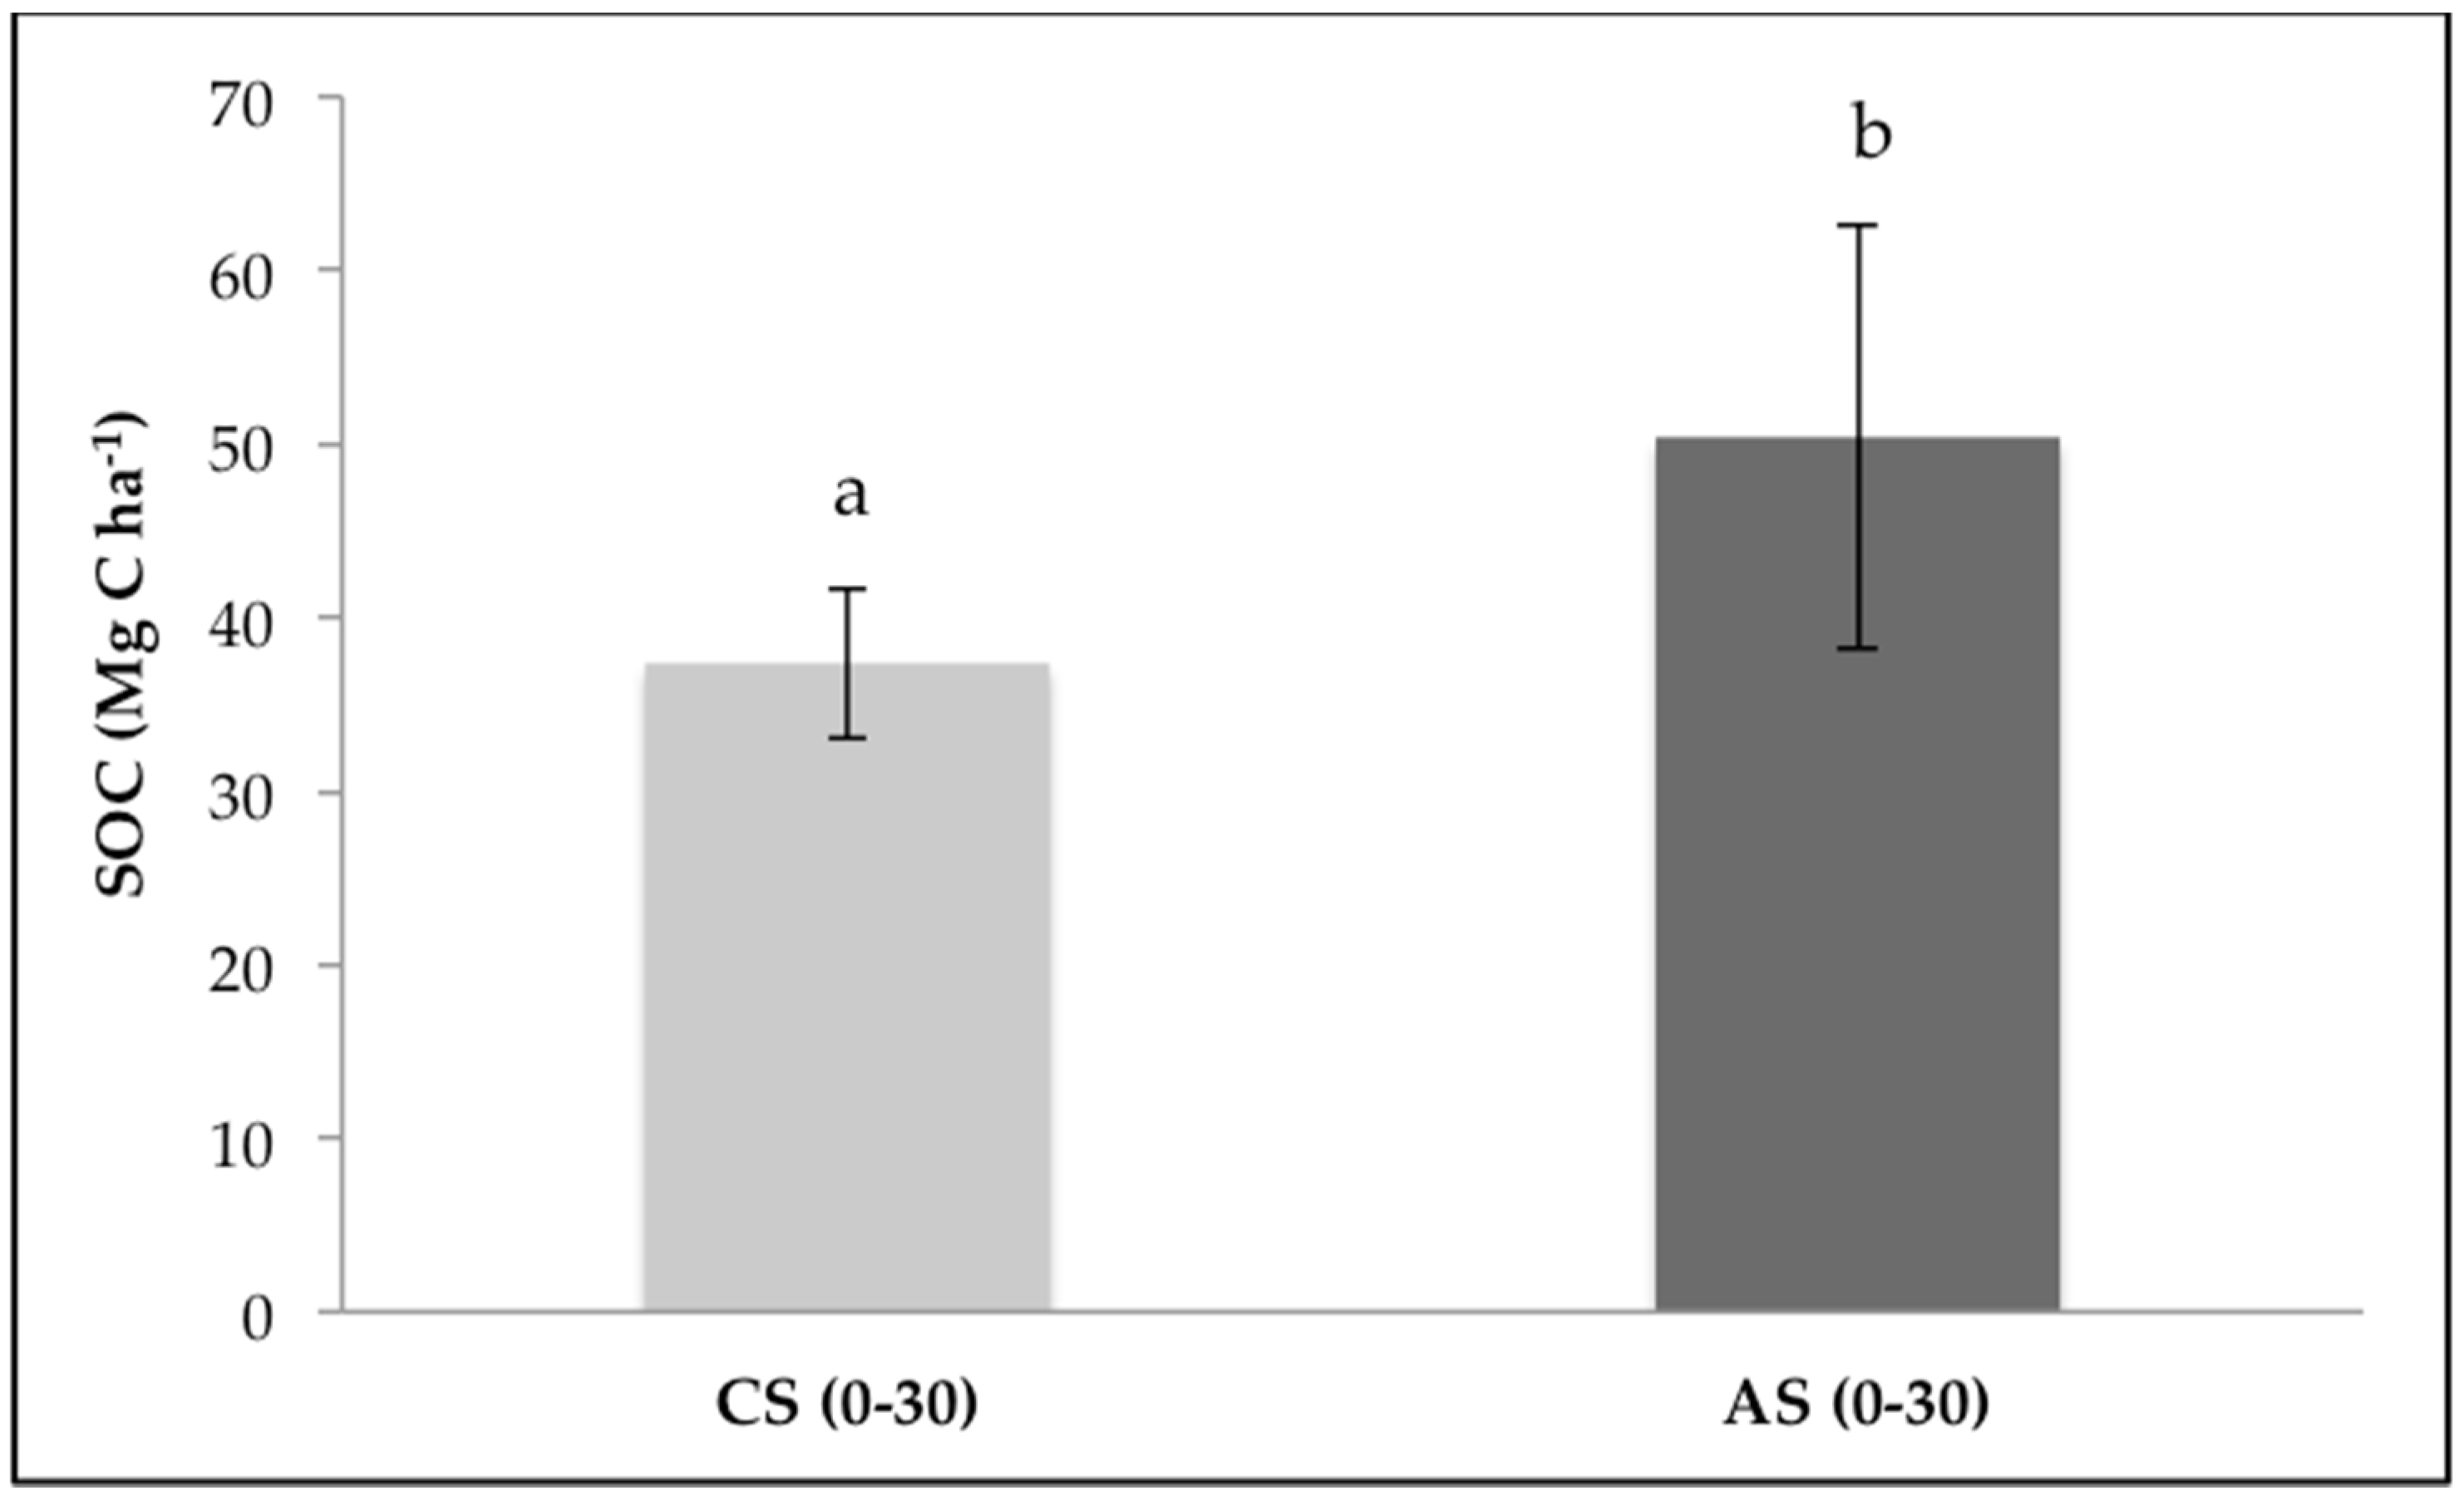
The SOC values range from 37.38 ± 4.32 Mg C ha−1 to 50.4 ± 12.25 Mg C ha−1 for cultivated and abandoned soils, respectively (Figure 4). Therefore, in the upper 30 cm, C stocks in abandoned soils is 34.8% higher than in soils that are still cultivated.
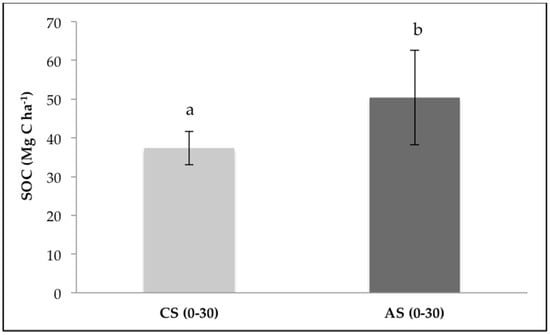
Figure 4.
Comparison of the values of total soil organic carbon (SOC) (Mg C ha−1) in the first 30 cm between cultivated soils (CS) and abandoned soils (AS); a, b: different letters indicate significant differences (Wilcoxon’s test, p < 0.05).
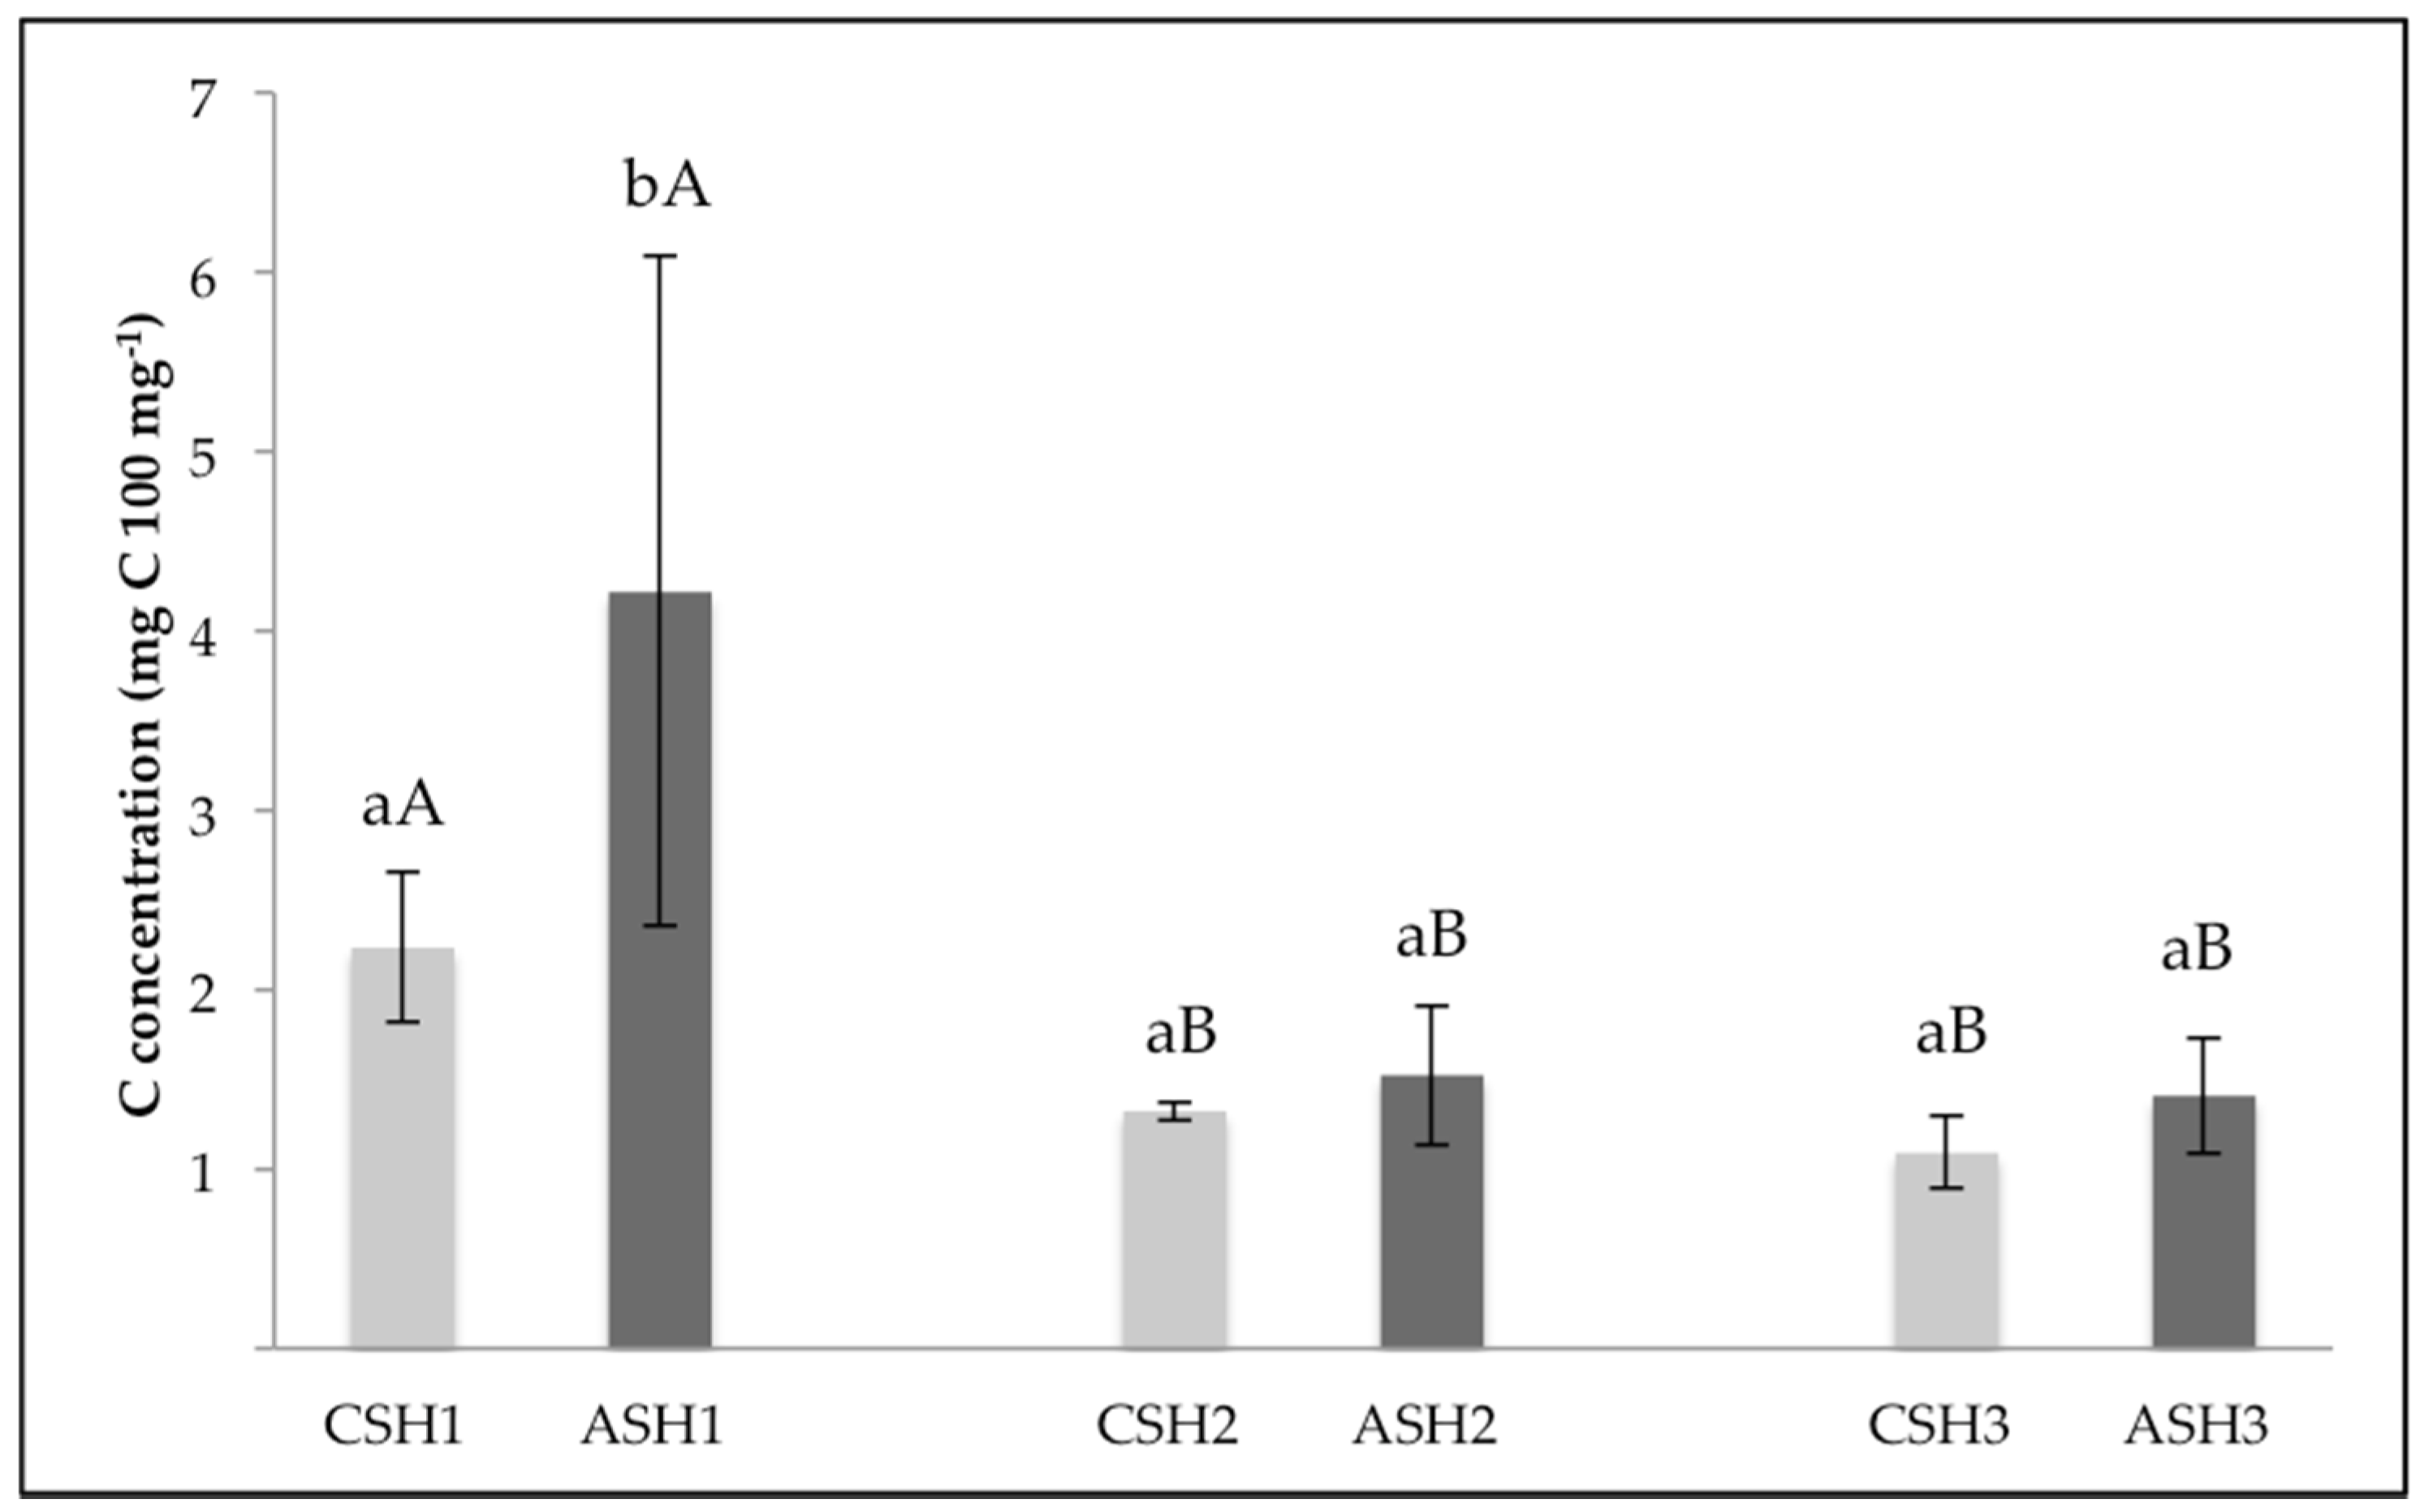
It is important to highlight that, in all horizons, both C concentration and SOC were higher in AS than in CS, although such differences were only significant in the most superficial horizon (H1) (Figure 5 and Figure 6). Furthermore, there was also a progressive and significant decrease of C concentration along the profile in both land uses, from 2.23 ± 0.42 mg C 100 mg−1 to 1.09 ± 0.20 mg C 100 mg−1 in CS (p > 0.05), and 4.2 ± 1.87 mg C 100 mg−1 to 1.41 ± 0.33 mg C 100 mg−1 in AS (p < 0.05) (Figure 5). The SOC showed the same behavior, with significant differences (p < 0.05) between the upper 10 cm and the rest of the profile (Figure 6).
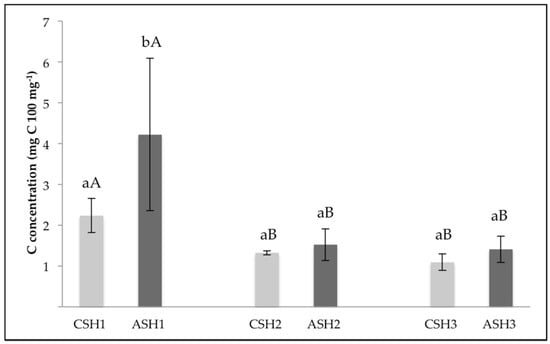
Figure 5.
Values of C concentration (mg C 100 mg−1) in each horizon (H1: 0–10 cm; H2: 10–20 cm; H3: 20–30 cm) of cultivated soils (CS) and abandoned soils (AS). Different small letters indicate significant differences between the same horizon of different land use (Student’s t-test for paired samples, p < 0.05). Different capital letters indicate significant differences between different horizons with the same land use (ANOVA test, p < 0.05).
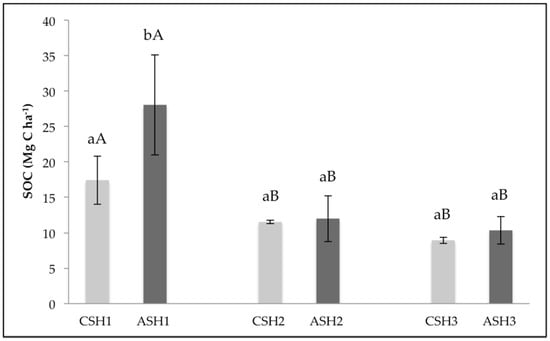
Figure 6.
Values of SOC (Mg C ha−1) in each horizon (H1: 0–10 cm; H2: 10–20 cm; H3: 20–30 cm) of cultivated soils (CS) and abandoned soils (AS). Different small letters indicate significant differences between the same horizon of different land use (Wilcoxon’s test, p < 0.05). Different capital letters indicate significant differences between different horizons with the same land use. (Kruskal–Wallis test and the Mann–Whitney U-test, p < 0.05).
Analysis of the soil texture reveals that cultivated and abandoned soils have the same characteristics (Table 2). There are no significant differences in the percentages of sand, silt, and clay between the two land uses. Both land uses maintain a loamy sand texture.
Table 2.
Soil texture values expressed as percentage. CS: cultivated soils; AS: abandoned soils. Comparison between land uses; different letters indicate significant differences (Mann–Whitney U-test, p < 0.05).
4. Discussion
In Mediterranean agroforestry systems with low productivity, high slope, and limited accessibility, the agricultural exploitation of the territory is limited, which leads to its abandonment [52]. Once the agricultural activity is abandoned, a series of ecological changes take place in the farmland [53], both in the biodiversity and nutrient dynamics, including the soil carbon content [54,55].
SOC is the main component of soil organic matter (SOM) and it is essential for the stabilization of the soil structure, as well as for the retention and release of plant nutrients, and it allows the infiltration and storage of water in the soil [56,57]. Therefore, it is fundamental for guaranteeing soil health, fertility and food production. The loss of SOC indicates a certain degree of soil degradation [58].
The optimal conditions for plant growth is in the range of 1–3 mg C 100 mg−1 [59]. The values obtained in our study were within this range and would allow the growth of crops. However, 50% of the soil profiles analyzed in Spain have a C concentration of less than 1 mg C 100 mg−1 [60], indicating that the soils in Spain are at risk for desertification. In Europe, 16% of the cultivated land is vulnerable to desertification [61], with the sustainability of agricultural systems being at a serious risk in the long term [62]. In view of these data presented here, the area analyzed in the present study is not in this situation.
The SOC values are in line with those reported by other authors. Rodríguez et al. [55] estimated the values of SOC in Spain at 56 Mg C ha−1 in the first 30 cm, although these amounts are unequally distributed over the country. Thus, in Extremadura, where our study was conducted, these authors estimated an amount of 42.3 Mg C ha−1 [60,63], which is similar to that reported in our study.
Forest soils are characterized for having greater amounts of soil organic matter (SOM) than agricultural soils. Moreover, the intensification of agricultural soil management in Europe during the second half of the 20th century has resulted in a considerable decrease of SOM content [33]. In soils of Catalonia, under a Mediterranean climate, an average of 5.7 mg C 100 mg−1 was found in mature forest soils, compared to 1.03 mg C 100 mg−1 and 1.5 mg C 100 mg−1 found in cultivated and abandoned agricultural soils [62]. Even with the possible sampling error due to the limited number of sampling points, significant differences between land uses are observed. In the studied land, the abandoned soils (2.38 ± 1.59 mg C 100 mg−1) present a carbon concentration 54% higher than the soils that continue to be cultivated (1.54 ± 0.76 mg C 100 mg−1) (Figure 3).
It should be noted that the choice of sampling points was difficult since there were few paired plots (CS-AS) that were all cultivated 60 years ago and that have followed a different use trajectory until today. Therefore, it must be taken into account that 60 years ago all the plots were cultivated areas, so that the differences found may be due to the change of use. The absence of differences in texture, and especially in clays, between CS and AS ensures that there is no systematic bias as to why the soils were abandoned, and that CS and AS are the same soil type.
These differences may be due to the carbon contribution from the decomposition of vegetation associated with current land use [57,64,65]. In the study area, the vegetation grown in the abandoned soils is currently forest vegetation. Forest recolonization by prior-to-cultivation Q. pyrenaica has been in ongoing progress for decades, reaching an advanced stage in its succession trajectory. At present, we find a mixed Quercus forest (Q. pyrenaica, Q. ilex and Q. suber) with a shrub layer associated and mixed with feral individuals from abandoned crops (Vitis vinifera, Ficus carica and Olea europaea).
The effect of the abandonment of agricultural land on soil C stock has been studied in a wide variety of environments, from tropical areas to northern territories, but there are no data in the study area. In tropical areas, soil carbon can accumulate at a rate of 1.30 Mg C ha−1 yr−1 during the first 20 years [66]. In central Yakutia (Russia), the SOC in cultivated lands is almost half of that in forest lands. However, after abandoning these crops, the SOC recovery increases 30% in 20 years with respect to lands that continue to be cultivated [67]. In Germany, a study analyzed the carbon reservoirs in abandoned agricultural land, finding the highest carbon content in the secondary forest soil (206 Mg C ha−1), followed by old forest soil (157 Mg C ha−1) and cultivated soil (151 Mg C ha−1), which shows the potential of abandoned agricultural lands in soil carbon fixation [68]. In the current study, the amount of SOC of the AS 34.8% higher than in cultivated soils, in the first 30 cm. Results presented here do not support the idea that Mediterranean soils have a low recovery of the carbon lost as a result of the intensive agricultural activity that has been carried out [34,63,65,69].
It is important to highlight that, in all horizons, both C concentration and SOC were higher in AS than in CS, although such differences were only significant in the most superficial horizon (H1) (Figure 5 and Figure 6) due to an entry of organic matter from the decomposition of the plant necromass in the upper horizon. The lack of significant differences at depths below 10 cm seem to indicate that the stabilization of the carbon in lower horizons is slow, as already demonstrated by other authors [57,65,70]. Furthermore, there was also a progressive and significant decrease of C concentration along the profile in both land uses (Figure 5). The AS, i.e., those with a plant coverage, had a greater and more stable C concentration at greater depth compared to CS. The SOC showed the same behavior, with significant differences between the first 10 cm and the rest of the profile (Figure 6).
Knowing the reference C concentration and SOC values of terrestrial ecosystems, in general, and Mediterranean agrosystems, in particular, it is possible to determine the changes that can be expected after a change of use with the one studied [71]. The capacity of carbon reservoir recovery of agricultural and degraded soils of the world is estimated at 2100 billion tons per year, with 400–1200 billion tons per year corresponding to agricultural soils, if ecological or conservation agricultural practices were applied and agricultural lands were converted to pasture lands or forest lands [72]. This potential must be studied in each case, preserving the use of fertile agricultural land for food production.
5. Conclusions
The abandonment of low-profitability agricultural lands could lead to a change in some edaphic variables, such as the carbon content. In mid-mountain areas of southwestern Spain, with terraced cultivation systems and 60 years after the cessation of agricultural activity, the cultivated areas have been transformed into agroforestry systems having 54% higher concentration of C and 34.8% more total organic carbon. Therefore, the natural reforestation of cropland abandoned by rural depopulation is presented as a socioecological process that could favor carbon fixation in the soil.
Author Contributions
Conceptualization, J.C.A.; methodology, J.C.A. and N.C.; software, J.C.A.; validation, J.C.A., J.A.M. and N.C.; formal analysis, J.C.A. and J.A.M.; investigation, J.C.A. and J.A.M.; resources, J.C.A. and N.C.; data curation, N.C.; writing—original draft preparation, J.C.A. and J.A.M.; writing—review and editing, N.C.; supervision, J.C.A. and N.C.; project administration, N.C.; funding acquisition, N.C. All authors have read and agreed to the published version of the manuscript.
Funding
This research was supported by Consejería de Economía, Ciencias y Agenda Digital de la Junta de Extremadura (GR-21086) and the European Regional Development Funds.
Institutional Review Board Statement
Not applicable.
Informed Consent Statement
Not applicable.
Conflicts of Interest
The authors declare no conflict of interest. The funders had no role in the design of the study; in the collection, analyses, or interpretation of data; in the writing of the manuscript, or in the decision to publish the results.
References
- Li, H.; Song, W. Cropland Abandonment and Influencing Factors in Chongqing, China. Land 2021, 10, 1206. [Google Scholar] [CrossRef]
- Jiménez, R.M. Globarruralización: Cómo el medio rural se ve afectado por la globalización y las TIC. GeoGraphos 2014, 5, 283–311. [Google Scholar] [CrossRef] [Green Version]
- Camarero, L.; Sampedro, R. Despoblación y ruralidad transnacional: Crisis y arraigo rural en Castilla y León. Econ. Agrar. Recur. Nat. 2019, 19, 59–82. [Google Scholar] [CrossRef] [Green Version]
- Chen, G.; Li, X.; Liu, X.; Chen, Y.; Liang, X.; Leng, J.; Xu, X.; Liao, W.; Qiu, Y.; Wu, Q.; et al. Global projections of future urban land expansion under shared socioeconomic pathways. Nat. Commun. 2020, 11, 537. [Google Scholar] [CrossRef] [PubMed] [Green Version]
- Roquer, S.; Blay, J. Del Éxodo Rural a La Inmigración Extranjera: El Papel de la Población Extranjera en la Recuperación Demográfica de las Zonas Rurales Españolas (1996–2006). X Coloquio Internacional de Neocrítica: Diez Años de Cambios en el Mundo, en la Geografía y en las Ciencias Sociales, 1999–2008. Actas del X Coloquio Internacional de Geocrítica, Universidad de Barcelona, 26–30 de Mayo de 2008. Available online: http://www.ub.edu/geocrit/-xcol/65.htm (accessed on 10 November 2020).
- Atance, I.; García, A.; Martínez, M.; Pujol, R.; Urruela, J. La Población Rural en España: Un Enfoque a Escala Municipal. Econ. Agrar. Recur. Nat. 2010, 10, 35–37. [Google Scholar] [CrossRef] [Green Version]
- CES (Consejo Económico y Social). Informe 01/2018: El Medio Rural y su Vertebración Social y Territorial. In Consejo Económico y Social, 1st ed.; Lerko Print S. A.: Madrid, Spain, 2018. [Google Scholar]
- Stockdale, A.; Findaly, A.; Short, D. The repopulation of Rural Scotland: Opportunity and threa. J. Rural. Stud. 2000, 16, 243–257. [Google Scholar] [CrossRef]
- OECD (Organisation for Economic Co-Operation and Development). The New Rural Paradigm: Policies and Governance; OECD Publishing: Paris, France, 2006; Available online: https://www.oecd.org/cfe/regional-policy/thenewruralparadigmpoliciesandgovernance.htm (accessed on 8 October 2020).
- Queiroz, C.; Beilin, R.; Folke, C.; Lindborg, R. Farmland abandonment: Threat or opportunity for biodiversity conservation? A global review. Front. Ecol. Environ. 2014, 12, 288–296. [Google Scholar] [CrossRef]
- Cañadas, E.M. Estudio de Tierras Agrícolas Abandonadas en Ambiente Mediterráneo Semiárido: Vegetación, Suelos y Distribución Espacial. Bases Para La Gestión. Master’s Thesis, Departamento de Botánica, Facultad de Ciencias, Universidad de Granada, Granada, Spain, 2008. Available online: https://dialnet.unirioja.es/servlet/tesis?codigo=71502 (accessed on 14 March 2022).
- Rey Benayas, J.M.; Martins, A.; Nicolau, J.M.; Schulz, J.J. Abandonment of agricultural land: An overview of drivers and consequences. CAB Rev. Perspect. Agric. Vet. Sci. Nutr. Nat. Resour. 2007, 2, 1–14. [Google Scholar] [CrossRef] [Green Version]
- Zaragozí, B.; Rabasa, A.; Rodríguez-Sala, J.J.; Navarro, J.T.; Belda, A.; Ramón, A. Modelling farmland abandonment: A study combining GIS and data mining techniques. Agric. Ecosyst. Environ. 2012, 155, 124–132. [Google Scholar] [CrossRef]
- Orjuela, J.A.; Ramírez, B.L.; Andrade, H.J. Potencial de almacenamiento de carbono en áreas de regeneración natural de paisajes ganaderos de la Amazonia colombiana. Rev. Fac. De Cienc. Agropecu. 2010, 2, 60–72. [Google Scholar]
- Prévosto, B.; Dambrine, E.; Coquillard, P.; Robert, A. Broom (Cytisus scoparius) Colonization after Grazing Abandonment in the French Massif Central: Impact on Vegetation Composition and Resource Availability. Acta Oecologica 2006, 30, 258–268. [Google Scholar] [CrossRef]
- MTE (Ministerio de Transición Ecológica). Anuario de Estadística Agraria; Secretaría General Técnica: Madrid, Spain, 2017; Available online: https://www.miteco.gob.es/es/estadistica/temas/publicaciones/anuario-de-estadistica/2017/default.aspx?parte=2&capitulo=12&grupo=1 (accessed on 12 December 2019).
- Beguería, S. Changes in Land Cover and Shallow Landslide Activity: A Case Study in the Spanish Pyrenees. Geomorphology 2006, 74, 196–206. [Google Scholar] [CrossRef] [Green Version]
- Kolouri, M.; Giourga, C. Land Abandonment and Slope Gradient as Key Factors of Soil Erosion in Mediterranean Terraced Lands. Catena 2007, 69, 274–281. [Google Scholar] [CrossRef]
- Adhikari, K.; Hartemink, A.E. Linking soils to ecosystem services. A global review. Geoderma 2016, 262, 101–111. [Google Scholar] [CrossRef]
- Robinson, D.A.; Emmett, B.A.; Reynolds, B.; Rowe, E.C.; Spurgeon, D.; Keith, A.M.; Lebron, I.; Hockley, N. Soil Natural Capital and Ecosystem Service Delivery in a World of Global Soil Change; Hester, R.E., Harrison, R.M., Eds.; Soils and Food Security; Issues in Environmental Science and Technology Series; Royal Society od Chemistry: London, UK, 2012; pp. 41–68. [Google Scholar]
- Barrios, E. Soil biota, ecosystem services and land productivity. Ecol. Econ. 2007, 64, 269–285. [Google Scholar] [CrossRef]
- Gifford, R.M. The Global Carbon Cycle: A Viewpoint on the Missing Sink. Funct. Plant Biol. 1994, 21, 1–15. [Google Scholar] [CrossRef]
- Van Groenigen, K.; Osenberg, C.; Hungate, B. Increased soil emissions of potent greenhouse gases under increased atmospheric CO2. Nature 2011, 475, 214–216. [Google Scholar] [CrossRef] [PubMed]
- Pan, G.; Xu, X.; Smith, P.; Pan, W.; Lal, R. An increase in topsoil SOC stock of China’s croplands between 1985 and 2006 revealed by soil monitoring. Agric. Ecosyst. Environ. 2010, 136, 133–138. [Google Scholar] [CrossRef]
- Wang, S.; Xu, L.; Zhuang, O.; He, N. Investigating the spatio-temporal variability of soil organic carbon stocks in different ecosystems of China. Sci. Total Environ. 2021, 758, 143644. [Google Scholar] [CrossRef] [PubMed]
- IPCC (Intergovernmental Panel of Climate Change). Mitigation of Climate Change. Contribution of Working Group I to the Fourth Assessment Reporto of the IPCC. 2007. Available online: http://www.ipcc.ch/pub/reports.htm (accessed on 12 December 2020).
- Houghton, R.A. Revised estimates of the annual net flux of carbon to the atmosphere from changes in land use and land management 1850–2000. Tellus B 2003, 55, 378–390. [Google Scholar] [CrossRef] [Green Version]
- Bravo, F.; Alloza, J.A.; Marys, S.; Bravo-Oviedo, A.; Broto, M.; Cámara, A.; Canga, E.; Delgado, J.A.; Díaz, L.; Fernández, M.J.; et al. El Papel de los Bosques Españoles en la Mitigación del Cambio Climático, 1st ed.; Fundación Gas Natural; Department de Producción Vegetal y Recursos Forestales, Universidad de Valladolid: Valladolid, Spain, 2007; p. 332. [Google Scholar]
- Pardos, J.A. Forest Ecosystems and Carbon Sequestration in the Face of Global Warming; Instituto Nacional de Investigación y Tecnología Agraria y Alimentaria: Madrid, Spain, 2017; p. 253.
- Batjes, N.H. Harmonized soil property values for broad-scale modelling with estimates of global soil carbon stocks. Geoderma 2016, 269, 61–68. [Google Scholar] [CrossRef]
- Post, W.M.; Kwon, K.C. Soil carbon sequestration and land-use change. Glob. Chang. Biol. 2000, 6, 317–327. [Google Scholar] [CrossRef] [Green Version]
- Fan, S.; Gloor, M.; Mahlman, J.; Pacala, S.; Sarmiento, J.; Takahashi, T.; Tans, P.A. Large Terrestrial Carbon Sink in North America Implied by Atmospheric and Oceanic Carbon Dioxide Data and Models. Science 1998, 282, 442–446. [Google Scholar] [CrossRef] [PubMed]
- Maljean, J.F.; Amlinger, F.; Bannick, C.G.; Favoino, E.; Feix, I.; Leifert, I.; Marmo, L.; Morris, R.; Pallière, C.; Robert, M.; et al. Land Use Practices in Europe. In Reports of the Technical Working Groups Established under the Thematic Strategy for Soil Protection; Camp, V., Ed.; Office for Official Publications of the European Communities: Luxembourg, 2004; p. 872. [Google Scholar]
- Lal, R. Sequestering carbon in soils of arid ecosystems. Land Degrad. Dev. 2009, 20, 441–454. [Google Scholar] [CrossRef]
- Lal, R.; Negassa, W.; Lorenz, K. Carbon sequestration in soil. Environ. Sustain. 2015, 15, 79–86. [Google Scholar] [CrossRef]
- Oldfield, E.E.; Bradford, M.A.; Wood, S.A. Global meta-analysis of the relationship between soil organic matter and crop yields. Soil 2019, 5, 15–32. [Google Scholar] [CrossRef] [Green Version]
- Montanarella, L. Towards a Thematic Strategy for Soil Protection; Communication from the Commission to the Council, the European Parliament, the Economic and Social Committee and the Committee of the Regions: Brussels, Belgium, 2002. [Google Scholar]
- Mokany, K.; Raison, R.J.; Prokushkin, A.S. Critical analysis of root: Shoot ratios in terrestrial biomes. Glob. Chang. Biol. 2006, 12, 84–96. [Google Scholar] [CrossRef]
- Frank, A.B.; Liebig, M.A.; Tanaka, D.L. Management effects on soil CO2 efflux in northern semiarid grassland and cropland. Soil Tillage Res. 2006, 89, 78–85. [Google Scholar] [CrossRef]
- Morais, T.G.; Teixeira, R.F.; Domingos, T. Detailed global modelling of soil organic carbon in cropland, grassland and forest soils. PLoS ONE 2019, 14, e0222604. [Google Scholar] [CrossRef] [Green Version]
- INE (Instituto Nacional de Estadística). Available online: https://www.ine.es/nomen2/inicio_r.do.2021 (accessed on 9 November 2021).
- IDEE (Infraestructura de Datos Espaciales de España). Portal de Acceso a la Información Geográfica de España. Ministerio de fomento del gobierno de España. 2019. Available online: https://www.idee.es/es (accessed on 8 December 2020).
- IUSS Working Group WRB. World Reference Base for Soil Resources. In World Soil Resources Reports; FAO: Rome, Italy, 2007; p. 103. [Google Scholar]
- PFE (Plan Forestal de Extremaura). Análisis y Estudio del Paisaje Vegetal y su Dinámica en la Región de Extremadura. Dirección General Medio Ambiente. Junta de Extemadura; 2010; p.128. Available online: https://asfoex.es/marco-legal/legislacion/89-documentacion-plan-forestal-extremadura (accessed on 13 December 2019).
- Macdiken, K.G. A Guide to Monitoring Carbon Storage in Forestry and Agroforestry Projects; Winrock International Institute for Agricultural Development: Arlington, VA, USA, 1997. [Google Scholar]
- Bouyoucos, G.J. Hydrometer method improved for making particle size analysis of soils. Agron. J. 1962, 54, 464–465. [Google Scholar] [CrossRef]
- Rovira, P.; Romanyà, J.; Rubio, A.; Roca, N.; Alloza, R.; Vallejo, R. Estimación del carbono orgánico en los suelos peninsulares españoles. In El Papel de Los Bosques Españoles en la Mitigación del Cambio Climático, 1st ed.; Bravo, F., Ed.; Fundación Gas Natural: Barcelona, Spain, 2007; pp. 197–222. [Google Scholar]
- Walkley, A.J.; Black, I.A. Estimation of soil organic carbon by the chromic acid titration method. Soil Sci. 1934, 37, 29–38. [Google Scholar] [CrossRef]
- Nelson, D.W.; Sommers, L.E. Total carbon, organic carbon, and organic matter. In Methods of Soil Analysis. Part 2. Chemical and Microbiological Properties, 2nd ed.; Page, A.L., Ed.; Agronomy Series No. 9; American Society of Agronomy and Soil Science Society of America: Madison, WI, USA, 1996. [Google Scholar]
- Sato, J.H.; Figueiredo, C.C.; Marchão, R.L.; Madari, B.E.; Benedito, L.E.C.; Busato, J.G.; Souza, D.M. Methods of soil organic carbon determination in Brazilian savannah soils. Soils Plant Nutr. 2014, 71, 302–308. [Google Scholar] [CrossRef] [Green Version]
- Mercedes, E.; Hernan, S.R.; Pablo, B.; Hernán, E. Comparison of methods to determine organic carbon in soil. Soil Sci. 2014, 32, 13–19. [Google Scholar]
- Sarría, F.A.; Martínez, C.; Belmonte, F.; Fernández, M.A. Principales causas del abandono de cultivos en la Región de Murcia. In Abandono de Cultivos en la Región de Murcia. Consecuencias Ecogeomorfológicas; Romero, A., Ed.; Servicio de Publicaciones de la Universidad de Murcia: Murcia, Spain, 2016; pp. 203–226. [Google Scholar]
- Corbelle-Rico, E.; Crecente-Maseda, R.; Santé, I. Multi-scale assessment and spatial modelling of agricultural land abandonment in a European peripheral region: Galicia (Spain), 1956–2004. Land Use Policy 2012, 29, 493–501. [Google Scholar] [CrossRef]
- Tasser, E.; Walde, J.; Tappeiner, U.; Teutsch, A.; Noggler, W. Land Use Changes and Natural Reforestation in the Eastern Central Alps. Agric. Ecosyst. Environ. 2007, 118, 115–129. [Google Scholar] [CrossRef]
- Li, J.; Li, M.; Dong, L.; Wang, K.; Liu, Y.; Hai, X.; Deng, L. Plant productivity and microbial composition drive soil carbon and nitrogen sequestrations following cropland abandonment. Sci. Total Environ. 2020, 744, 140802. [Google Scholar] [CrossRef] [PubMed]
- Podmanicky, L.; Balázs, K.; Belényesi, M.; Centeri, C.; Kristóf, D.; Kohlheb, N. Modelling soil quality changes in Europe. An impact assessment of land use change on soil quality in Europe. Ecol. Indic. 2011, 11, 4–15. [Google Scholar] [CrossRef]
- Van Hall, R.L.; Cammeraat, E.; Keesstra, S.D.; Zorn, M. Impact of secondary vegetation succession on soil quality in a humid Mediterranean landscape. Catena 2017, 149, 836–843. [Google Scholar] [CrossRef]
- FAO (Food and Agriculture Organization of the United Nations). The World State of Agriculture and Food; FAO: Roma, Italy, 2009; pp. 122–137. [Google Scholar]
- Loveland, P.; Webb, J. Is there a critical level of organic matter in the agricultural soils of temperate regions: A review. Soil Tillage Res. 2003, 70, 1–18. [Google Scholar] [CrossRef]
- Rodríguez, J.A.; Álvaro-Fuentes, J.; Gonzalo, J.; Gil, C.; Ramos-Miras, J.J.; Grau, J.M.; Boluda, R. Assessment of the soil organic carbon stock in Spain. Geoderma 2016, 264, 117–125. [Google Scholar] [CrossRef] [Green Version]
- ESYRCE (Encuesta sobre Superficies y Rendimientos de Cultivos). Resultados Autonómicos y Nacionales. Ministerio de Agricultura, Alimentación y Medio Ambiente de España. 2015. Available online: https://www.mapa.gob.es/es/estadistica/temas/estadisticas-agrarias/agricultura/esyrce/ (accessed on 24 February 2022).
- Holland, J.A. The environmental consequences of adopting conservation tillage in Europe: Review the evidence. Agric. Ecosyst. Environ. 2004, 103, 1–25. [Google Scholar] [CrossRef]
- Romanyà, J.; Rovira, P.; Vallejo, R. Análisis del carbono en los suelos agrícolas de España. Aspectos relevantes en relación a la reconversión a la agricultura ecológica en el ámbito mediterráneo. Ecosistemas 2007, 16, 50–57. [Google Scholar]
- Lugato, E.; Panagos, P.; Bampa, F.; Jones, A.; Montanarella, L. A new baseline of organic carbon stock in European agricultural soils using a modelling approach. Glob. Change Biol. 2014, 20, 313–326. [Google Scholar] [CrossRef]
- Nadal-Romero, E.; Cammeraat, E.; Pérez-Cardiel, E.; Lasanta, T.F. Effects of secondary succession and afforestation practices on soil properties after cropland abandonment in humid Mediterranean mountain areas. Agric. Ecosyst. Environ. 2016, 228, 91–100. [Google Scholar] [CrossRef] [Green Version]
- Hooper, D.U.; Bignell, D.E.; Brown, V.K.; Brussaard, L.; Dangerfield, J.M.; Wall, D.; Wardle, D.; Coleman, D.C.; Giller, K.; Lavelle, P.; et al. Interactions between above and below ground biodiversity in terrestrial ecosystems: Patterns; mechanisms and feedbacks. BioScience 2000, 50, 1049–1061. [Google Scholar] [CrossRef]
- Desyatkin, A.R.; Shinya, I.D.; Roman, V.; Hatano, R. Changes of Soil C Stock under Establishment and Abandonment of Arable Lands in Permafrost Area-Central Yakutia. Atmosphere 2018, 9, 308. [Google Scholar] [CrossRef] [Green Version]
- Mazinanian, P. Forest Succession on Abandoned Agricultural Land and Its Carbon Stock. Master’s Thesis no. 286, Swedish University of Agricultural Sciences, Uppsala, Sweden, 2017; p. 40. [Google Scholar]
- Novara, A.; Gristina, L.; Sala, G.; Galati, A.; Crescimanno, M.; Cerdà, A.; Badalamenti, E.; La Mantia, T. Agricultural land abandonment in Mediterranean environment provides ecosystem services via soil carbon sequestration. Sci. Total Environ. 2017, 576, 420–429. [Google Scholar] [CrossRef] [Green Version]
- Gabarrón-Galeote, M.A.; Trigalet, S.; van Wesemael, B. Effect of land abandonmenton soil organic fractions along a Mediterranean precipitation gradient. Geoderma 2015, 249, 69–78. [Google Scholar] [CrossRef]
- Robert, M. Soil Carbon Sequestration for Improved Land Management. In World Soil Resources Report; FAO: Rome, Italy, 2001; p. 75. [Google Scholar]
- González, E.J.; Veroz, O.; Gil, J.A.; Ordóñez, R.M. 4 per Thousand Initiative: Soil Organic Carbon as a Tool for Mitigation and Adaptation to Climate Change in Spain; Ministerio de Agriultura, Pesca y Medio Ambiente: Madrid, Spain, 2018; pp. 144–150.


Publisher’s Note: MDPI stays neutral with regard to jurisdictional claims in published maps and institutional affiliations. |
© 2022 by the authors. Licensee MDPI, Basel, Switzerland. This article is an open access article distributed under the terms and conditions of the Creative Commons Attribution (CC BY) license (https://creativecommons.org/licenses/by/4.0/).