Abstract
Previous studies have proved that root distribution along gully headwalls greatly alters soil properties and further affects the soil erodibility of gully heads. However, it is not clear whether the gully headcut migration is affected by root distribution and soil properties. Five representative gullies developed in different land uses were selected to clarify the variations of root distribution and soil properties and their effects on headcut migration in the rainy season (May to October 2021) in the Mollisols region of northeast China. Results showed that the 68.4%–93.3% of root mass density and 65.6–88.5% of root length density were concentrated in 0–30 cm soil layer of gully heads, and the roots of <2.0 mm accounted for >85%. The gullies developed in farmlands had relatively higher soil compactness, shear strength and aggregate stability, but lower organic matter (OMC), disintegration capacity and soil permeability than those developed in woodlands, unpaved roads in farmland and stable gully-beds. Changes in soil properties of gully heads were closely related to root density. The linear, areal, and volumetric migration rate of gully heads varied greatly and were 1.07–35.11 m yr−1, 28.95–562.46 m2 yr−1 and 56.82–6626.37 m3 yr−1, respectively, with the average of 9.07 m yr−1, 156.92 m2 yr−1 and 1503.02 m3 yr−1, respectively. The change in headcut migration rate was significantly affected by root density, soil properties and drainage area, of which soil texture, OMC, soil aggregate structure, and the drainage area were the critical factors influencing headcut migration in the Mollisols region of northeast China.
1. Introduction
Land degradation is one of the hot issues of concern of the international community, among which gully erosion is a relatively serious stage of soil erosion and an important embodiment of land degradation. It has led to land fragmentation, land degradation and regional ecological deterioration, and even seriously threatens food strategic security [,]. Gully erosion has been a great ecological and environmental challenge in the world. Fortunately, gully erosion has also received a lot of attention in recent years [,,,], but it still lags splash erosion, sheet erosion and rill erosion. Therefore, the study of gully erosion mechanism and its critical influencing factors and control measures should be the focus of future research.
Globally, gully erosion showed a huge variability based on a compiled dataset from the 933 individual gullies from 70 study areas in 25 countries of six continents []. In fact, the huge variability of gully erosion was mainly caused by several factors, including weather and climate [,,], topography [,,], land use and cover [,,], and vegetation and soil properties [,,]. Rieke-Zapp and Nichols [] reported that the gully headcut retreat rate in a semiarid watershed in the southwestern United States during 1935–2006 was significantly affected by contributing drainage area and areal precipitation for precipitation exceeding a threshold rainfall intensity (maximum 30-minute rainfall intensity ≥ 25 mm h−1). However, the effect of land use/cover is controversial. Torri and Poesen [] stated the significant effect of land use on the initiation of gully erosion, but Hayas et al. [] and Vandekerckhove et al. [] reported that land use had no or little effect. In fact, the land use / cover was closely related to vegetation traits, so the effect of land use/cover on gully erosion was also dependent on vegetation type, cultivation technics, root traits, and especially the extent and architecture of its root systems [,,]. For example, Guo et al. [] suggested that the roots with diameters of 0–0.5 mm had greater effects on soil loss and morphological evolution of gully headcut erosion than roots with larger diameters. However, most of the previous studies on gully erosion have been carried out at watershed and regional scales, which determines that most studies can only clarify the effect of vegetation coverage on gully erosion and ignore the effect of vegetation root systems. Therefore, the impact of vegetation characteristics. especially root systems, on gully erosion needs to be further clarified.
In addition, many studies have documented that the root system had a positive effect on the improvement of soil properties [,,]. For example, root and its exudates can improve soil infiltration capacity, strengthen aggregate stability, and soil cohesion [,,]. The presence of roots is mainly dependent on the root binding effect, bonding effect and the biochemical effect [,]. Some soil property parameters, such as saturated hydraulic conductivity, soil aggregate stability, soil shear stress and soil disintegration rate, are regarded as being representative of soil erodibility [,,,]. Moreover, Guo et al. [,,,] have proved the positive effect of roots on soil properties of gully heads and further significantly decreased soil erodibility of gully heads in the Chinese Loess Plateau. Therefore, we propose the following hypothesis: the vertical distribution of roots along gully heads would affect soil properties (representing soil erodibility to some extent), and further affect the gully headcut migration.
The Mollisols area of northeast China (NEC), as one of the four largest mollisols regions globally, and is the base of grain production in China [], but it is being restricted by gully erosion []. At present, there are 296,000 gullies in the Mollisols area of NEC [,], of which 89% of the gullies are still in the developing stage, and gully erosion has damaged up to 2.2 × 10⁵ ha of land that accounts 0.4% of the total area of NEC, indicating that the gully erosion rate is high and that its risk extended gradually []. Our latest study (unpublished) showed that the soil loss rate caused by gully erosion was 1.4 mm yr−1,which was 2.55 times that of hillslope erosion. Moreover, the gullies developed in different land uses showed a distinctly different migration rate [,], so we hypothesized the difference in gully erosion rate was mainly induced by the differences in vegetation traits and soil properties of gully heads besides some environmental factors for a given study area.
Therefore, several gullies developed in different land use types were selected in a gully-dominated watershed in the Mollisols area of northeast China to satisfy the three objectives: (1) clarifying the differences in root distribution and soil properties of gully heads among different typical gullies, (2) quantifying the change of gully headcut retreat rate before and after the rainy season, and (3) elaborating on the critical factors influencing gully headcut retreat.
2. Materials and Methods
2.1. Study Area
This study was conducted at the Hailun Soil and Water Monitoring Station of the Chinese Academy of Sciences in the Guangrong watershed (1.87 km2), Hailun City, Heilongjiang Province, China (47°11′–47°10′ N, 126°54′–126°52′ E, Figure 1), located in the center of the Mollisols area of northeast China. The study area belongs to the typical Mollisols soil area of the rolling-hill region in northeast China. The study area is in a mid-temperate continental monsoon climate zone with an average annual temperature of 1.5 °C. The annual mean precipitation is 530 mm, with over 90% of the total precipitation occurring from May to September. It is cold and snowy in winter, but hot and rainy in the summer with heavy rainfall. Mollisol is the dominant soil type in the study area and its parent material is mostly quaternary pluvial loess-like clay. Approximately 70% of the land has been reclaimed as farmland, mainly for planting soybeans and corn. The combination of dramatic climate change, large terrain undulations, low vegetation coverage, and severe human activities induced serious gully erosion in the area, resulting in serious soil and water loss and the fragmentation of originally neat and integrated slope farmlands.
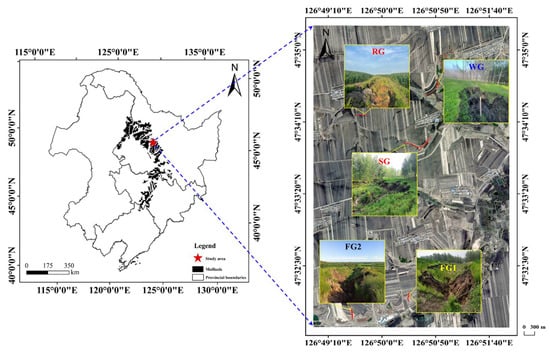
Figure 1.
Location of study area and the spatial distribution and photos of selected five typical gullies. FG1 and FG2, the gullies developed in farmland; RG, gully developed along unpaved road; WG, gully developed in woodland and grassland; SG, gully developed in stable gully channel.
2.2. Selection of Typical Gullies
From July to October 2020, based on a detailed investigation of the gullies and related vegetation and topographic characteristics, 49 gullies were found in the Guangrong watershed and they are classified into four types: gullies developed in farmland (FG), gullies developed along unpaved roads (RG), gullies developed in woodland and grassland (WG), and gullies developed in stable gully channels (SG) according to the land use and position gully head developed. Finally, five gullies were selected for this study. Specifically, two gullies developed in farmland were selected. The farmland gully 1 (FG1) is still in an active-developing stage, and the farmland gully 2 (FG2) is in a relatively stable stage and its gully head retreats relatively slower than FG1. Therefore, the two distinct gullies developed in farmland were selected for this study. The unpaved roads in farmland were mainly used for mechanical farming, food transportation and people and livestock walking. The runoff from farmlands often scours the unpaved roads and develops gullies, so the gully developed along an unpaved road (RG) is also a typical gully of this study area. The long-term mechanical crushing and trampling induced the relatively higher soil bulk density. Some herbs grow gradually at the gully head of RG due to the gully development, decreasing soil disturbance. Although most of the land in the study area has been converted to farmland, there are still a few natural forests and grasses in the low-lying terrain. So, the gully developed in woodland and grassland (WG) is also a typical gully in this region and is still in the development stage. Some gullies tend to be stabilized due to the restraining effect of vegetation restoration, and most of the eroded soil from the upstream drainage area is deposited in the gully channel, leading to the gradual uplift of the erosion base level of gully. With little human disturbance and revegetation, natural herbs grow gradually in the gully channel. However, the increase of precipitation in the last five years resulted in a large amount of runoff, which led to the secondary incision and development of gullies, so the gully was activated again. This gully was defined as the gully developed in the stable gully channel (SG) and regarded as a typical representative of the gully in the Mollisols region. The location of five gullies is shown in Figure 1 and their basic information is listed in Table 1.

Table 1.
Basic information of typical gullies.
2.3. Soil and Root Sample Collection and Measurement
For each selected gully, firstly, three 1 m × 1 m sampling quadrats were established along the boundary line of gully headwall for soil and root sampling (Figure 2a), and the plant growth in the sampling quadrats can represent the overall vegetation situation at the gully heads. The above-ground parts and debris of the plants were removed in the sampling quadrats. The soil and root samples were taken in the three sampling quadrats along headwall depths of 0–10 cm, 10–30 cm, 30–50 cm, 50–80 cm, and 80–120 cm. These samples are used to measure and calculate soil bulk density (SBD), saturated hydraulic conductivity (SHC), soil texture, soil disintegration rate (SDR), organic matter content (OMC), water-stable aggregate (WSA), root biomass density (RBD) and root length density (RLD) in the 120 cm soil profile of gully heads (Figure 2b,c). The SDR is defined as the mass or volume of soil particles separated from original soil in a still water environment per unit time [].
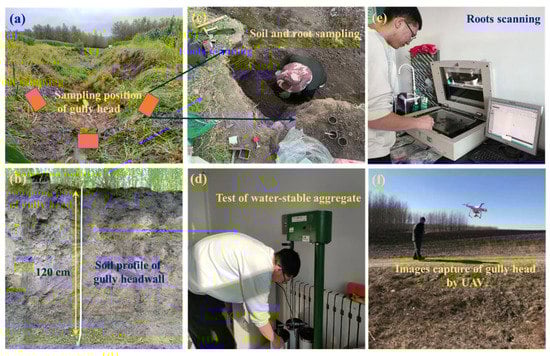
Figure 2.
Determination of sampling position of gully head (a), soil profile of headwall (b), photo of soil and root sampling (c), measurement of water-stable aggregate (d), root scanning (e) and images capture of gully head by UAV (f).
Firstly, a total of 15 soil samples (3 quadrats × 5 soil layers) for each gully head were collected using 15 steel rings (100 cm3) and then placed in an oven at 105 °C for 24 hours for determining SBD. At the same time, 15 soil samples were collected at each gully head using 15 cutting rings (6.18 cm in diameter and 4 cm high) to measure soil SHC by the constant head method. A dismountable cuboidal sampler (5 cm length) is used to take soil samples for measuring the SDR in a disintegrating box for 30 minutes [,]. Then, 15 undisturbed soil samples at five soil depths of 0–10 cm, 10–30 cm, 30–50 cm, 50–80 cm, and 80–120 cm in three sampling quadrats were collected to measure soil texture, WSA and OMC. The collected undisturbed soil sample (approximately 500 g) of each soil layer was put into a sampling bag and then taken back to the laboratory. After these soil samples were air-dried for about one week in a well-ventilated environment, the larger piece of soil is gently broken into small pieces of soil along its natural joint. The non-soil impurities such as gravel, animal and plant residues were picked out and then sieved through a sieve with 10 mm in diameter. The wet sieving method is used for determining the distribution of water-stable aggregates by a soil aggregate analyzer (DIK-2012). Firstly, 50 g of the air-dried and sieved soil sample is weighed by the quartering method (Figure 2d). The 50 g sample is vacuum-evacuated for 5 minutes and wetted in a vacuum environment gradually. The wetted soil samples were placed in the sieves for 2 mm, 1 mm, 0.5 mm, 0.25 mm, and 0.106 mm in sequence, and were oscillated up and down at a frequency of 30 times per minute under water. Soil aggregates in each sieve was washed in a drying box and then placed in drying oven for 12 hours at 105 °C for calculating the mass and percentage of water-stable aggregate of five diameters. The air-dried soil samples were used to measure soil texture (clay, silt, and sand) using a Master-Sizer 2000 laser particle size analyzer (Malvern Instruments Ltd., Malvern, UK). The determination of soil organic carbon was measured by the Vario EL Ⅲ elemental analyzer (Germany Elementar), and then the OMC was obtained by multiplying the soil organic carbon by 1.724.
15 dismountable cuboidal samplers (5 cm length) were used to collect soil-root samples in 5 five soil layers of 0–10 cm, 10–30 cm, 30–50 cm, 50–80 cm, and 80–120 cm in three quadrats of each gully head. After taking the soil samples back to the laboratory, each sample was placed in the sieve set at 0.25 mm to wash until all the roots in the soil sample were washed out. Then a root scanner (Epson Twain Pro) and root analysis system (Win Rhizo) were employed to measure root length of >2.0 mm, 1.0–2.0 mm, 0.5–1.0 mm, and <0.5 mm in diameter (Figure 2e). The scanned root samples were placed in a drying-oven at 65 °C for 48 hours and then weighted for determining RBD. The calculation of RLD and RBD is shown in the 2.5 Parameter calculation section.
2.4. Determination of Gully Headcut Migration
To obtain the gully headcut migration of the five selected gullies during rainy season, before spring tillage (20 April) and after autumn harvest (20 October) in 2021, a UAV (Phantom 4pro) provided by DJI Innovation Technology Co., LTD was used to take aerial photographs of five typical gully heads for producing a digital orthophoto map (DOM) and digital elevation model (DEM). About 400 photos were taken with the 80% overlapping between the adjacent photos for each gully head. A real-time kinematic (RTK) was used to measure the geographical coordinates of control points. The photographs of each gully head were synthesized with Pix4d mapper software to construct orthophotos and high-resolution DEMs (centimeter-level). In order to analyze the changes in morphology of gully heads, the gully shoulder line was drawn first in two DOMs of each gully, and then they were loaded in DEMs in ArcGIS 10.2 software for determining the position of should lines of gully heads in DEMs. Then, we superimposed DEMs of each gully head in the two periods using the 3D Analyst tool in ArcGIS 10.2 to calculate the linear, areal, and volumetric migration rates of five typical gully heads during the rainy season of 2021.
2.5. Parameter Calculation
Root mass density (RBD, kg m−3) and root length density (RLD, cm·cm−3), defined as the drying mass and length of roots per unit volume of soil, respectively, were calculated as follows:
where Mr is the drying mass of the roots (kg); Lr is root length (cm); L is the length of cuboidal sampler (m).
RBD = Mr/L3
RLD = Lr/L3
The mean weight diameter (MWD) and geometric mean diameter (GMD) of water-stable aggregate were calculated as follows:
where Ri is the average diameter of the ith aggregate (mm); wi is the dry weight of the ith aggregate (g).
2.6. Data Processing, Statistical Analysis, and Figure Plotting
The data sorting and preliminary analysis was conducted in Office 2016. SPSS 20.0 software (IBM, Chicago, IL, USA) was used to perform statistical analysis. The one-way analysis of variance (ANOVA) followed by least significant difference (LSD) was employed to determine the difference in soil properties and root traits among different types of gullies (α = 0.05). The correlations among gully headcut retreat, soil properties and root density were determined by the Pearson correlation method, and their relationships were determined by employing the simple regression analysis method. Origin 2020 software was employed to make graphics.
3. Results
3.1. Root Distribution along Gully Headwall
Figure 3 shows the variation of root mass density (RBD) and root length density (RLD) with soil depth of gully heads. The RBD in 0–10 cm layer of FG1, FG2 and RG was significantly greater than those in deeper soil layers (p < 0.05), and the 0–10 cm and 10–30 cm layers of SG and WG had the significantly higher RBD than other layers (p < 0.05, Figure 3a). RBDs in 0–10 cm of RG was highest (2.02 kg m−3), followed by FG1, SG, WG and FG2, while the SG and WG had the significantly greater RBD of 10–30 cm and 30–50 cm layers than other three gullies. Furthermore, the RBDs in >80 cm soil layers were only one hundredth of those in topsoil layers. The roots of FG1, FG2 and RG were mainly distributed in 0–30 cm soil layers, but the most of roots of SG and WG grow to a depth of 50 cm. On average, the RBD of RG and SG was the highest, followed by WG, FG1 and FG2.
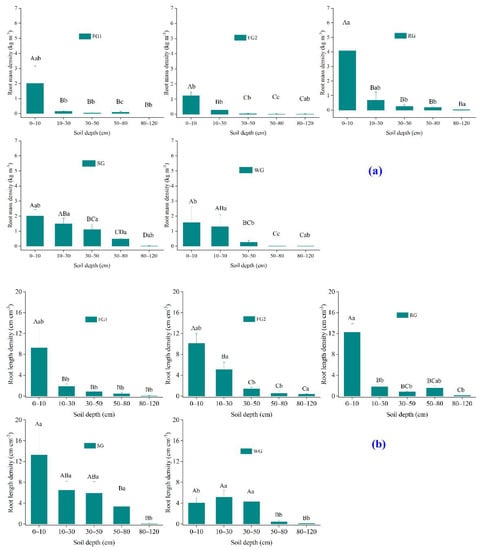
Figure 3.
Variation of root mass density (a) and root length density (b) of different gullies with soil depth. Different lowercase letters indicate significant difference among different gullies in the same soil layer, and the different capital letters indicate significant difference among different soil layers of same gully at p < 0.05 level. FG1 and FG2, the gullies developed in farmland; RG, gully developed along unpaved road; WG, gully developed in woodland and grassland; SG, gully developed in stable gully channel. Sample size is 3.
Similarly, the RLD of gully head also decreased with soil depth significantly (Figure 3b). The RLD of 0–10 cm soil layer of FG1, FG2 and RG accounted for 73.8%, 57.7% and 74.0% of total RLD, and were significantly greater than that in other soil layers (p < 0.05), but for SG and WG, the 0–50 cm layer occupied 88.3% and 95.8% of total RLD, respectively. For the 0–10 cm layer, the WG had the lowest RLD, and SG and RG had the largest RLD. However, for the 10–50 cm layer, the SG and WG had the significantly higher RLD than other gullies. On average, the root of SG was the longest, followed by FG2, RG, WG and FG1. Furthermore, the RLD of > 2.0 mm in diameter significantly decreased with soil depth, and the RLD of fine roots (0–2.0 mm) accounted for >85% of total RLD (Figure 4). For >50 cm soil layer, almost all the roots were fine roots smaller than 1.0 mm in diameter, especially for WG, the RLD of <0.5 mm accounted for >96% of total RLD.
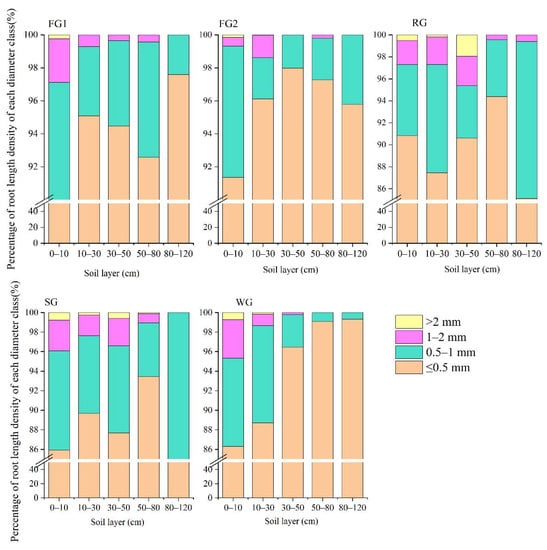
Figure 4.
Distribution characteristics of root length density in different diameter classes of gully heads. FG1 and FG2, the gullies developed in farmland; RG, gully developed along unpaved road; WG, gully developed in woodland and grassland; SG, gully developed in stable gully channel.
3.2. Soil Properties of Gully Heads
3.2.1. Soil Bulk Density, Texture, and Organic Matter
As shown in Table 2, the SBD of FG1, FG2 and RG significantly increased with the soil layer increased (p < 0.05), but the SBD of WG and SG in 30–50 cm layer was greatest. On average, the gullies developed in farmlands had the greatest SBD, followed by RG, WG and SG. Overall, the clay content slightly increased with the increase of soil depth, and the silt and sand content decreased. The soil texture of SG and WG was coarser than the other gullies. The OMC in the topsoil layer (0–30 cm) was significantly higher than that in deeper soil layers (p < 0.05), and the OMC exponentially decreased with soil depth of gully head increased (p < 0.05). Given the fact that the most of eroded soil upstream gully heads deposited in SG, so the OMC in SG was 1.88–2.81 times of that of other gullies on average.
Table 2.
Basic soil properties of headwalls of five gullies.
3.2.2. Soil Stress Strength, Disintegration Capacity and Saturated Hydraulic Conductivity
The variation in soil stress strength (SS) with soil depth of the gully head differed significantly among the five gullies. SS of FG1 gradually increased with soil depth, but for SG, it significantly decreased (p < 0.05). The lowest SS of FG2 was found in 30–50 cm soil layer, while the SS of RG and WG first increased and then decreased with soil depth increase. On average, the FG2 had the largest SS (average 5.70 kg cm−2), followed by RG, FG1, WG and SG. In terms of soil disintegration rate (SDR), the SDR of FG1, FG2 and RG significantly increased with soil depth as an exponential function (p < 0.05), but the opposite trend was found in SG and WG. On average, the SDR of SG was 1.10 times, 1.23 times, 2.06 times and 1.20 times of that of FG1, FG2, RG and WG, respectively. Notably, the saturated soil hydraulic conductivity (SHC) of FG1, FG2 and WG exhibited a change of increase-decrease with soil depth increase, of which the largest SHC was found in the 10−30 cm layer of FG1 and FG2 and in 50–80 cm of WG. Nevertheless, the SHC of RG and SG logarithmically decreased with soil depth (p < 0.05). ANOVA showed the conspicuous difference in SHC of the same soil depth among different gullies. The largest SHC (1.41 mm min−1) found in WG was 1.46–8.32 times greater than that of other gullies.
3.2.3. Soil Aggregate Distribution and Stability
The water-stable aggregate distribution of different diameters in five soil depths of five gully heads was illustrated in Figure 5. Overall, for each gully, the proportions of soil aggregate of > 2.0 mm, 1.0–2.0 mm and 0.5–1.0 mm decreased gradually with soil depth, the proportion of 0.25–0.50 mm firstly increased and then decreased with the soil depth, but the proportion of < 0.25 mm always increased. On average, the proportion of > 2.0 mm in RG was highest (10.19%), followed by WG, SG, FG2, and FG1, while the proportion of soil aggregates of 1.0–2.0 mm and > 2.0 mm basically kept at a constant for five gullies. The soil aggregate of 0–1.0 mm in each gully head accounted for 88.52%–92.70%, of which the < 0.25 mm aggregates accounted for 36.37%–64.92%.
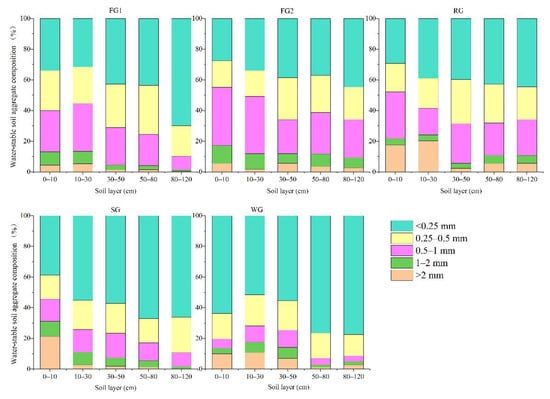
Figure 5.
Soil aggregate distribution in different depths of gully heads. FG1 and FG2, the gullies developed in farmland; RG, gully developed along unpaved road; WG, gully developed in woodland and grassland; SG, gully developed in stable gully channel.
As shown in Table 2, the MWD of FG1, FG2, SG and WG significantly and linearly decreased with soil depth increase (p < 0.05), but for RG, the largest MWD was found in 10–30 cm soil layer, which was 1.72–2.31 times greater than that of >30 cm soil layers. MWDs in 0–10 cm and 10–30 cm soil layers of RG were 1.54 mm and 1.56 mm, respectively, which were 1.07–1.64 times and 1.04–2.41 times significantly greater than those of other gullies (p < 0.05). For the 30–50 cm soil layer, the largest MWD found FG2 was significantly greater than that of RG, FG1 and SG, but it had no statistical difference with WG. However, when the depth increased to 80 cm and 120 cm, the RG had the largest MWDs (0.66 mm and 0.57 mm) that were significantly higher than that of other gullies. Similar with MWD, the GMD of the five gullies also significantly and linearly decreased with soil depth (Table 2, p < 0.05). Overall, for the 0–30 cm soil layer, the RG, FG2 and SG had the relatively higher GMD, but it had no significant difference with WG. For >30 cm soil layer, the GMD of RG and/or FG2 was significantly greater than that of other gullies (p < 0.05). Generally, the RG exhibited the higher soil structure stability of gully heads, and the stability of SG gully heads was weakest.
3.3. Relationships between Soil Properties of Gully Heads and Root Distribution
As illustrated in Figure 6, the SBD of gully heads negatively and significantly related to RBD and RLD, but OMC, sand content, SHC, MWD and GMD positively and significantly correlated to root density (p < 0.05). Further regression analysis showed that the SBD exponentially decreased with RBD and RLD increased (p < 0.01, Figure 7a,b), indicating that the presence of roots in soil can effectively improve soil porosity structure and lower soil compactness. OMC increased with RBD and RLD as a power and linear function, respectively (p < 0.01, Figure 7a,b), resulting from the fact that vegetation litter and root are the main resource of soil organic matter. The positive and significant relationship between sand content and root density (p < 0.01, Figure 7c,d) indicated that higher sand content, representing the low soil cohesiveness, was in favor of root growth. Therefore, the improved soil macro-porosity due to root growth was also beneficial to water infiltration into gully heads, resulting in the positive relationship between SHC and RBD and RLD (p < 0.01, Figure 7c,d). The MWD of gully heads increased with RLD and RBD as a power function (Figure 7e,f, p < 0.05), but the GMD linearly increased with RLD and RBD increased (p < 0.05), which manifested that the stability of soil structure of gully heads was closely affected by root distribution. However, it was found that the clay content, silt content, SS, and SDR had no statistical correlations with RBD and RLD (Figure 6, p > 0.05). In addition to roots, the SHC, SDR, SS and aggregate stability were also significantly affected by SBD, OMC, and soil texture (Figure 6, p < 0.05).
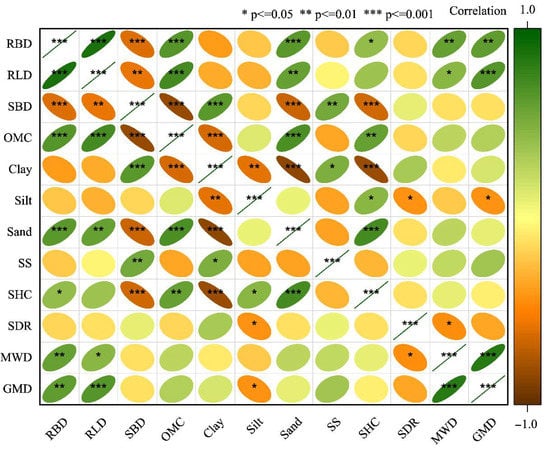
Figure 6.
Correlation between soil aggregates stability and root characteristics. RBD, root mass density; RLD, root length density; SBD, soil bulk density; OMC, organic matter content; SS, shear strength; SHC, saturated soil hydraulic conductivity; SDR, Soil disintegration rate; MWD, mean weight diameter of aggregate; GMD, geometric mean diameter.
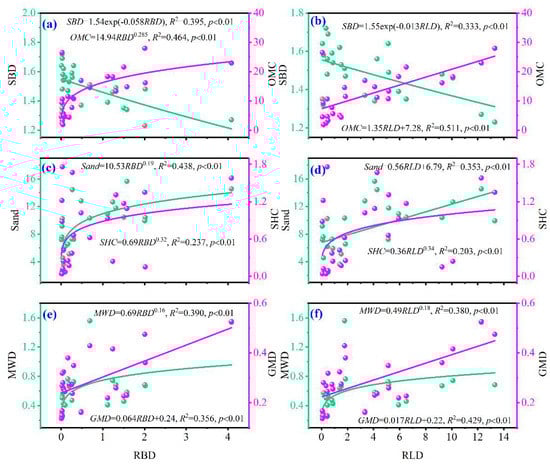
Figure 7.
(a–f) Relationship between MWD/GMD value and root parameters fitting function of water-stable aggregates. RBD, root mass density; RLD, root length density; SBD, soil bulk density; OMC, organic matter content; SHC, saturated soil hydraulic conductivity; MWD, mean weight diameter of aggregate; GMD, geometric mean diameter.
3.4. Gully Headcut Migration and Its Influencing Factors
The change in gully head morphology of five gullies was shown in the digital orthophoto map obtained by UAV in May and October 2021 (Figure 8). The five gullies exhibited a notably different development. The gully head of FG1 and FG2 migrated 1.69 m and 1.24 m, respectively, which was slightly greater than that of RG (1.07 m). However, the gully head of WG retreated 6.23 m during the rainy reason. More shockingly, the gully head of SG re-developed on the stable gully channel governed by revegetation, migrated as high as 35.11 m, which was 4.64–31.97 times greater than that of the other four gullies (Figure 8). In terms of migration area, the developed area of SG and WG due to gully head migration was 562.46 m2 and 104.91 m2, respectively, which were 15.03 times and 2.80 times those of FG1, FG2 and RG (Figure 8). Furthermore, we found that the volume of gully erosion of FG1 (341.75 m3) was higher than that of FG2 and WG, although the expansion area of FG1 was less than FG1 and WG, indicating the incision rate of FG1 was faster than FG2 and WG. In particular, the gully erosion amount of SG induced by headcut retreat was up to 6626.37 m3, which was 18.39 times, 36.47 times, 115.63 times and 20.15 times greater than that of FG1, FG2, RG and WG, respectively (Figure 8). This indicated that the stable gully was more susceptible to erosion than other gullies due to its weak soil structure (Table 2).
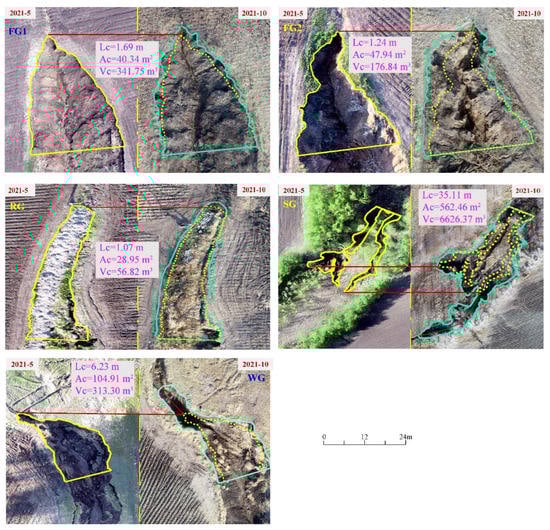
Figure 8.
Change in morphology of five typical gully heads from May to October 2021. FG1 and FG2, the gullies developed in farmland; RG, gully developed along unpaved road; WG, gully developed in woodland and grassland; SG, gully developed in stable gully channel. Lc, Ac and Vc indicate the changes in gully headcut retreat distance, area, and volume from May to October 2021, respectively.
In this study, the soil properties, root characteristics and drainage area upstream of gully head (A) were measured to clarify their effects on gully headcut retreat (Table 1 and Table 2). As shown in Figure A1, the gully headcut retreat distance (Figure A1a), area (Figure A1b) and volume (Figure A1c) significantly decreased with the increase of the averaged soil bulk density, soil shear strength, MWD and GMD as a power function (p < 0.05), but increased with the increase of organic matter content, soil disintegration rate and root density as a linear or power function (p < 0.05). Besides, in general, we found that the headcut migration decreased with the increase in clay content, and increased with silt content, sand content, A and root mass density increase, but the relationships among them had no statistical significance (p > 0.05). Even so, this change trend also indicated the important effect of the changes in soil and roots of gully head and its drainage area on gully headcut migration to a certain extent.
4. Discussion
4.1. Root Distribution and Soil Properties of Gully Heads
The RBD and RLD of all five gullies exponentially decreased with soil depth. This finding is in alignment with previous studies [,,,]. The 68.4%–93.3% of RBD and 65.6–88.5% of RLD were concentrated in 0–30 cm soil layer of gully heads, which was higher than the result of Farrish [] who reported that 60%–64% of the biomass occurred in the top soil. Furthermore, the most of roots of WG and SG can embed into 50 cm depth of gully heads higher than FG1, FG2 and RG (30 cm). For the two gullies developed in farmland and the one developed on unpaved road, the higher soil bulk density caused by large farming machine rolling was not conductive to root growth into deeper soil. For the SG and WG, there is little human disturbance of the soil of gully heads, so roots are more likely to enter the deep soil, and low soil bulk density also favors root growth []. Besides, we found that the RG, SG and WG had a relatively higher RBD than FG1 and FG2. This could be attributed to that situation that the soil around gully heads was constantly affected by human ploughing and weeding activities, causing the few vegetation roots at gully heads. Also, the vegetation growth at the gully heads of RG was promoted due to little human disturbance and the revegetation was conducted upstream gully heads of SG and WG, so the root density was improved [,]. Specifically, for the SG governed by afforestation in 2007, the most of eroded topsoil with high OMC, transported from the topsoil of farmland in drainage area upstream the gully head, deposited in the gully channel, and then the deposited sediment was characterized by higher OMC, low SBD, and weak soil structure (Table 2), so the good soil environment allowed plants to grow and allowed roots to penetrate deeper into the soil. Furthermore, the RLD of <2.0 mm of five gullies accounted for >85% of total RLD, and the roots of >2.0 mm were concentrated in the 0–30 cm layer. Especially for >50 cm soil layer, almost all the roots were fine roots of <1.0 mm. This showed that fine roots played a dominant role in gully heads of typical gullies in the Mollisols region of northeast China.
Our result further showed that the SBD of gully heads negatively related to RBD and RLD, but OMC, sand content, SHC, MWD and GMD positively correlated to root density, which implied that the presence of roots can effectively enhance soil porosity structure, lower soil compactness, improve soil structural stability and soil permeability and increase organic matter content. This result was also supported by previous studies [,,,,,]. Guo et al. [] reported that the SDR, SHC, SOM and MWD of gully heads significantly related to root diameter, RLD and root surface area density in the gullied region of the Loess Plateau. Furthermore, we found that some studies considered several soil properties including SHC, SDR, MWD, clay ratio, soil cohesion, and soil penetration resistance as indicators of soil erosion resistance [,,,,,,,]. Therefore, the positive effects of vegetation roots on soil properties of gully heads fully manifested that the soil resistance of gully heads to erosion was closely affected by root distribution. Furthermore, we found that the SS and SDR had no statistical correlations with RBD and RLD, but they were significantly affected by SBD, OMC, and soil texture (Figure 6, p < 0.05), which was mainly because the effect of vegetation on soil properties was affected by various factors and the influence was a long-term process []. This also indirectly indicated that soil texture, OMC and SBD mainly determined the SS and SDR in the Mollisols area of northeast China.
4.2. Gully Headcut Migration and Its Response to Influencing Factors
The linear, areal, and volumetric migration rate of the five typical gullies in the rainy season were 1.07–35.11 m yr−1, 28.95–562.46 m2 yr−1 and 56.82–6626.37 m3 yr−1, respectively, with the average of 9.07m yr−1, 156.92 m2 yr−1 and 1503.02 m3 yr−1, respectively. This result was close to the result reported by Hu et al. [] and Wu et al. [] in rolling hill areas in black soil of northeast China [,], and it was also within the range of Vanmaercke et al. [] who reported that linear, areal, and volumetric migration rate were 0.01–135 m yr−1, 0.01–3628 m2 yr−1 and 0.002–47430 m3 yr−1, respectively, through compiling the 933 individual gullies from 70 study areas in 25 countries of six continents that reflected a wide range of environmental conditions and gully headcut retreat globally. However, our results were distinctly greater than the result in the other study areas worldwide [,,,,]. For example, Frankl et al. [] found that the linear, areal, and volumetric retreat rate were 0.34 m yr−1, 1.70 m2 yr−1 and 5.20 m3 yr−1 over the rainy reason of 2010, respectively, while larger rates were found during medium to long time periods (1–47 years), with averages of 3.8 m yr−1, 31.5 m2 yr−1 and 47.7 m3 yr−1 in northern Ethiopia, respectively. Wang et al. [] reported the lower linear and areal retreat rate of 0.30 m yr−1 and 5.66 m2 yr−1 from 1969 to 2010 in the tableland region of the Chinese Loess Plateau. The above comparison indicated that the gully headcut migration rate in the Mollisols area of northeast China is relatively higher than that in other areas of the world. In fact, the huge variability of headcut retreat rate among different study areas was mainly caused by numerous factors, including weather and climate, topography, land use and cover, and vegetation and soil properties [,,,,,]. For example, the factors relating to rainfall intensity (e.g., the sum of rainfall events exceeding a certain intensity threshold) have been reported to explain differences in headcut retreat rates. Besides, the antecedent soil moisture content, soil thawing and snowmelt runoff play a critical role [,].
Furthermore, the headcut migration rate varied greatly among different types of gullies, although within the same study area (Figure 8), which was consistent with most of the previous studies. For this study in the given study area, the gully headcut migration rate was closely related to soil properties, root density and the drainage area. The increase of clay content, soil bulk density, soil shear strength, and soil aggregate stability and the decrease of silt and sand content and soil disintegration rate were conducive to contain gully head retreat (Figure A1). Wells et al. [] found that the effect of soil texture greatly modified the soil erodibility and headcut migration rates were correlated to the soil erodibility. The higher silt and sand content represents the higher soil erodibility. Thus, the SG and WG exhibited a higher retreat rate than other gullies. The high soil bulk density represents high soil compactness and has a positive effect on soil erosion reduction []. The soil aggregate stability and shear strength reflect soil erodibility of gully heads [,,,], and thus their improvement would restrain gully headcut retreat. However, we found that gully headcut retreat was positively related to organic matter content and root density, which was different from previous studies that have confirmed that the vegetation effect on reducing gully erosion mainly depended on the root characteristics [,,,,,,,]. For example, Guo et al. [,,,] stated that the soil erodibility of gully heads was significantly and negatively related to organic matter and root density, and the presence of grass roots reduced retreat distance, gully area and soil loss rate by 66.97–85.38%, 69.26–78.18%, and 45.64–68.45%, respectively, during headcut erosion. The discrepancies between this study and previous studies were mainly attributed to the differences in gully type, gully formation process and human activity. For the two gullies developed in farmlands (FG1, FG2), although the root density of gully heads was relatively lower, the retreat rate was still lower than the other gullies. To some extent, the tillage and weeding activities impeded vegetation growth at the gully heads of FG1 and FG2. However, the retreat rate of SG and WG was much larger than FG1 and FG2, although the root density was higher. The higher OMC, coarse texture and revegetation promoted the root growth []. Whereas, more importantly, the larger drainage area of SG and WG would collect much larger scale concentrated flow, combined with the weak soil aggregate stability and SS and higher SHC and SDR, resulting in higher headcut retreat rate than FG1 and FG2. In other words, for the gullies in the study watershed, the soil properties and drainage area of gully heads exhibited a greater effect on headcut retreat than root density. Therefore, soil structure stability determined by soil texture, OMC, water-stable aggregate distribution, and the drainage area upstream from the gully head were the critical factors influencing headcut migration in the Mollisols region of northeast China. This result was also supported by Rieke-Zapp and Nichols [], who reported a power relationship between gully headcut retreat rate and contributing drainage area and areal precipitation for precipitation exceeding a threshold rainfall intensity (maximum 30-minute rainfall intensity ≥ 25 mm h−1). Based on the above results, it is strongly recommended that some engineering measures should be established to drain the concentrated flow from gully head to drainage channel or dissipate the runoff energy to avoid gully headcut erosion. Additionally, some measures such as an earth check dam, a stone check dam, and vegetation buffers could be built in the gully channel to reduce runoff erosivity and deposit sediment in the gully channel.
5. Conclusions
This study was conducted to explore the effects of root distribution and soil properties of gully heads on gully headcut migration in the Mollisols region of northeast China. The results showed that more than 65.6% of the roots were distributed in a 0–30 cm soil layer of gully heads, and that > 85% of roots were < 2.0 mm in diameter. The gully heads that developed in farmlands and unpaved roads were characterized by higher soil compactness, shear strength and lower root density. The gully heads developed in woodland and stable gully-bed had a higher amount of organic matter, disintegration capacity and soil permeability. Soil properties of gully heads were significantly related to root density. The linear, areal, and volumetric migration rate in the rainy season varied greatly among the five types of gullies, and were 9.07 m yr−1, 156.92 m2 yr−1 and 1503.02 m3 yr−1 on average, respectively. Soil structure stability determined by soil texture, OMC, water-stable aggregate, and the drainage area upstream of the gully head were the critical factors influencing headcut migration in the Mollisols region of northeast China. It is strongly recommended that some engineering and vegetation measures be implemented to contain gully headcut erosion, in particular that stabilized gullies need further control to prevent re-activation by heavy rainfall.
Author Contributions
Conceptualization, X.Z., J.Q. and M.G.; methodology, X.Z., M.G. and J.X.; software, J.Q. and P.Z.; validation, Z.C. and L.W.; formal analysis, J.Q.; investigation, J.Q., P.Z. and J.X.; resources, J.Q., P.Z., M.G. and J.X.; data curation, J.Q. and P.Z.; writing—original draft preparation, X.Z., J.Q. and M.G.; writing—review and editing, X.Z. and M.G.; visualization, X.Z., J.Q., Z.C. and L.W.; supervision, M.G.; project administration, M.G.; funding acquisition, M.G. All authors have read and agreed to the published version of the manuscript.
Funding
This research was funded by the National Key Research and Development Program of China (2021YFD1500800), National Natural Science Foundation of China (grant number 42107356), China Postdoctoral Science Foundation (grant number 2020M681062, 2021T140663), the Heilongjiang Science Foundation Project (YQ2021C036), and the State Key Laboratory of Soil Erosion and Dryland Farming on the Loess Plateau (grant number A314021402-202102).
Data Availability Statement
Summarized data are presented and available in this manuscript and rest of the data used and/or analyzed are available from the corresponding author on reasonable request.
Conflicts of Interest
The authors declare that they have no conflict of interest.
Appendix A
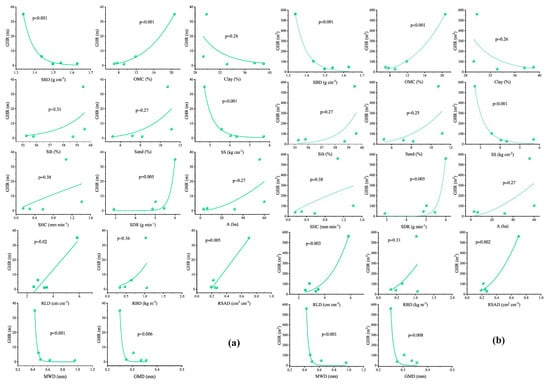
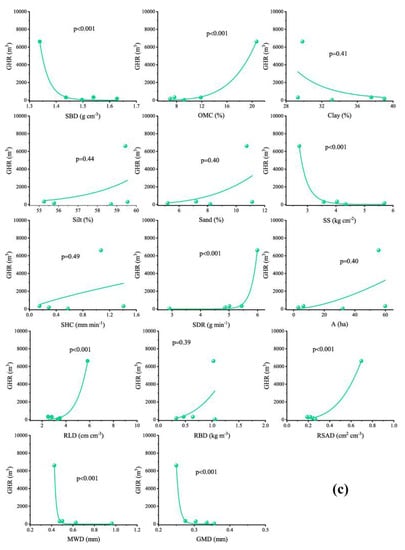
Figure A1.
Relationships between gully headcut migration distance (a), area (b) and volume (c) and soil properties, root characteristics and drainage area upstream gully head. GHR, gully headcut retreat; RBD, root mass density; RLD, root length density; SBD, soil bulk density; OMC, organic matter content; SHC, saturated soil hydraulic conductivity; MWD, mean weight diameter of aggregate; GMD, geometric mean diameter.
References
- Poesen, J.; Nachtergaele, J.; Verstraeten, G.; Valentin, C. Gully Erosion and Environmental Change: Importance and Research Needs. Catena 2003, 50, 91–133. [Google Scholar] [CrossRef]
- Belayneh, M.; Yirgu, T.; Tsegaye, D. Current extent, temporal trends, and rates of gully erosion in the Gumara watershed, Northwestern Ethiopia. Glob. Ecol. Conserv. 2020, 24, e01255. [Google Scholar] [CrossRef]
- Castillo, C.; Gómez, J.A. A century of gully erosion research: Urgency, complexity and study approaches. Earth-Sci. Rev. 2016, 160, 300–319. [Google Scholar] [CrossRef]
- Hosseinalizadeh, M.; Kariminejad, N.; Chen, W.; Pourghasemi, H.R.; Alinejad, M.; Mohammadian Behbahani, A.; Tiefenbacher, J.P. Gully headcut susceptibility modeling using functional trees, naïve Bayes tree, and random forest models. Geoderma 2019, 342, 1–11. [Google Scholar] [CrossRef]
- Vanmaercke, M.; Panagos, P.; Vanwalleghem, T.; Hayas, A.; Foerster, S.; Borrelli, P.; Rossi, M.; Torri, D.; Casali, J.; Borselli, L. Measuring, modelling and managing gully erosion at large scales: A state of the art. Earth-Sci. Rev. 2021, 218, 103637. [Google Scholar] [CrossRef]
- Vanmaercke, M.; Poesen, J.; Van Mele, B.; Demuzere, M.; Bruynseels, A.; Golosov, V.; Bezerra, J.F.R.; Bolysov, S.; Dvinskih, A.; Frankl, A.; et al. How fast do gully headcuts retreat? Earth-Sci. Rev. 2016, 154, 336–355. [Google Scholar] [CrossRef]
- Ionita, I.; Niacsu, L.; Petrovici, G.; Blebea-Apostu, A.M. Gully development in eastern Romania: A case study from Falciu Hills. Nat. Hazards 2015, 79, 113–138. [Google Scholar] [CrossRef]
- Rieke-Zapp, D.H.; Nichols, M.H. Headcut retreat in a semiarid watershed in the southwestern United States since 1935. Catena 2011, 87, 1–10. [Google Scholar] [CrossRef]
- Rodzik, J.; Furtak, T.; Zglobicki, W. The impact of snowmelt and heavy rainfall runoff on erosion rates in a gully system, Lublin Upland, Poland. Earth Surf. Processes Landf. 2009, 34, 1938–1950. [Google Scholar] [CrossRef]
- Li, Z.; Zhang, Y.; Zhu, Q.; He, Y.; Yao, W. Assessment of bank gully development and vegetation coverage on the Chinese Loess Plateau. Geomorphology 2015, 228, 462–469. [Google Scholar] [CrossRef]
- Moeyersons, J.; Makanzu Imwangana, F.; Dewitte, O. Site- and rainfall-specific runoff coefficients and critical rainfall for mega-gully development in Kinshasa (DR Congo). Nat. Hazards 2015, 79, 203–233. [Google Scholar] [CrossRef]
- Wang, H.; Zhang, G.-H. Temporal variation in soil erodibility indices for five typical land use types on the Loess Plateau of China. Geoderma 2021, 381, 114695. [Google Scholar] [CrossRef]
- Makanzu Imwangana, F.; Dewitte, O.; Ntombi, M.; Moeyersons, J. Topographic and road control of mega-gullies in Kinshasa (DR Congo). Geomorphology 2014, 217, 131–139. [Google Scholar] [CrossRef]
- Vandekerckhove, L.; Poesen, J.; Wijdenes, D.O.; Gyssels, G. Short-term bank gully retreat rates in Mediterranean environments. Catena 2001, 44, 133–161. [Google Scholar] [CrossRef]
- Nazari Samani, A.; Ahmadi, H.; Mohammadi, A.; Ghoddousi, J.; Salajegheh, A.; Boggs, G.; Pishyar, R. Factors Controlling Gully Advancement and Models Evaluation (Hableh Rood Basin, Iran). Water Resour. Manag. 2010, 24, 1531–1549. [Google Scholar] [CrossRef]
- Guo, M.; Wang, W.; Shi, Q.; Chen, T.; Kang, H.; Li, J. An experimental study on the effects of grass root density on gully headcut erosion in the gully region of China’s Loess Plateau. Land Degrad. Dev. 2019, 30, 2107–2125. [Google Scholar] [CrossRef]
- Torri, D.; Poesen, J. A review of topographic threshold conditions for gully head development in different environments. Earth-Sci. Rev. 2014, 130, 73–85. [Google Scholar] [CrossRef]
- Hayas, A.; Poesen, J.; Vanwalleghem, T. Rainfall and Vegetation Effects on Temporal Variation of Topographic Thresholds for Gully Initiation in Mediterranean Cropland and Olive Groves. Land Degrad. Dev. 2017, 28, 2540–2552. [Google Scholar] [CrossRef]
- Kang, H.; Wang, W.; Guo, M.; Li, J.; Shi, Q. How does land use/cover influence gully head retreat rates? An in-situ simulation experiment of rainfall and upstream inflow in the gullied loess region, China. Land Degrad. Dev. 2021, 32, 2789–2804. [Google Scholar] [CrossRef]
- Knapen, A.; Poesen, J.; Govers, G.; Gyssels, G.; Nachtergaele, J. Resistance of soils to concentrated flow erosion: A review. Earth-Sci. Rev. 2007, 80, 75–109. [Google Scholar] [CrossRef]
- Vannoppen, W.; Vanmaercke, M.; De Baets, S.; Poesen, J. A review of the mechanical effects of plant roots on concentrated flow erosion rates. Earth-Sci. Rev. 2015, 150, 666–678. [Google Scholar] [CrossRef] [Green Version]
- Guo, M.; Wang, W.; Wang, T.; Wang, W.; Kang, H. Impacts of different vegetation restoration options on gully head soil resistance and soil erosion in loess tablelands. Earth Surf. Processes Landf. 2020, 45, 1038–1050. [Google Scholar] [CrossRef]
- Wang, J.; Zhang, Y.; Deng, J.; Yu, S.; Zhao, Y. Long-Term Gully Erosion and Its Response to Human Intervention in the Tablel and Region of the Chinese Loess Plateau. Remote Sens. 2021, 13, 5053. [Google Scholar] [CrossRef]
- Wang, B.; Zhang, G.-H.; Shi, Y.-Y.; Zhang, X.C. Soil detachment by overland flow under different vegetation restoration models in the Loess Plateau of China. Catena 2014, 116, 51–59. [Google Scholar] [CrossRef]
- Hu, W.; Shao, M.; Wang, Q.; Fan, J.; Horton, R. Temporal changes of soil hydraulic properties under different land uses. Geoderma 2009, 149, 355–366. [Google Scholar] [CrossRef]
- Zhao, Y.; Wu, P.; Zhao, S.; Feng, H. Variation of soil infiltrability across a 79-year chronosequence of naturally restored grassland on the Loess Plateau, China. J. Hydrol. 2013, 504, 94–103. [Google Scholar] [CrossRef]
- Li, Q.; Liu, G.-B.; Zhang, Z.; Tuo, D.-F.; Bai, R.-R.; Qiao, F.-F. Relative contribution of root physical enlacing and biochemistrical exudates to soil erosion resistance in the Loess soil. Catena 2017, 153, 61–65. [Google Scholar] [CrossRef]
- Wang, B.; Zhang, G.-H. Quantifying the Binding and Bonding Effects of Plant Roots on Soil Detachment by Overland Flow in 10 Typical Grasslands on the Loess Plateau. Soil Sci. Soc. Am. J. 2017, 81, 1567–1576. [Google Scholar] [CrossRef]
- Parsakhoo, A.; Lotfalian, M.; Kavian, A.; Hosseini, S.A. Assessment of soil erodibility and aggregate stability for different parts of a forest road. J. For. Res. 2014, 25, 193–200. [Google Scholar] [CrossRef]
- Kusre, B.C.; Ghosh, P.; Nath, K. Prioritization of soil conservation measures using erodibility indices as criteria in Sikkim (India). J. Earth Syst. Sci. 2018, 127, 6. [Google Scholar] [CrossRef] [Green Version]
- Guo, M.; Chen, Z.; Wang, W.; Wang, T.; Wang, W.; Cui, Z. Revegetation induced change in soil erodibility as influenced by slope situation on the Loess Plateau. Sci. Total Environ. 2021, 772, 145540. [Google Scholar] [CrossRef]
- Guo, M.; Wang, W.; Kang, H.; Yang, B. Changes in soil properties and erodibility of gully heads induced by vegetation restoration on the Loess Plateau, China. J. Arid Land 2018, 10, 712–725. [Google Scholar] [CrossRef] [Green Version]
- Guo, M.M.; Wang, W.L.; Kang, H.L.; Yang, B.; Li, J.M. Changes in soil properties and resistance to concentrated flow across a 25-year passive restoration chronosequence of grasslands on the Chinese Loess Plateau. Restor. Ecol. 2020, 28, 104–114. [Google Scholar] [CrossRef]
- Wen, Y.; Kasielke, T.; Li, H.; Zepp, H.; Zhang, B. A case-study on history and rates of gully erosion in Northeast China. Land Degrad. Dev. 2021, 32, 4254–4266. [Google Scholar] [CrossRef]
- Li, C.; Fu, B.; Wang, S.; Stringer, L.C.; Wang, Y.; Li, Z.; Liu, Y.; Zhou, W. Drivers and impacts of changes in China’s drylands. Nat. Rev. Earth Environ. 2021, 2, 858–873. [Google Scholar] [CrossRef]
- Dong, Y.; Wu, Y.; Qin, W.; Guo, Q.; Yin, Z.; Duan, X. The gully erosion rates in the black soil region of northeastern China: Induced by different processes and indicated by different indexes. Catena 2019, 182, 104146. [Google Scholar] [CrossRef]
- Yang, J.; Zhang, S.; Chang, L.; Li, F.; Li, T.; Gao, Y. Gully erosion regionalization of black soil area in northeastern China. Chin. Geogr. Sci. 2017, 27, 78–87. [Google Scholar] [CrossRef] [Green Version]
- Zhang, X.; Liu, X. Current scenario of gully erosion and its control strategy in Mollisols areas of Northeast China. Trans. Chin. Soc. Agric. Eng. 2021, 37, 320–326, (In Chinese with English Abstract). [Google Scholar]
- Hu, G.; Wu, Y.; Liu, B.; Yu, Z.; You, Z.; Zhang, Y. Short-term gully retreat rates over rolling hill areas in black soil of Northeast China. Catena 2007, 71, 321–329. [Google Scholar] [CrossRef]
- Wu, Y.; Zheng, Q.; Zhang, Y.; Liu, B.; Cheng, H.; Wang, Y. Development of gullies and sediment production in the black soil region of northeastern China. Geomorphology 2008, 101, 683–691. [Google Scholar] [CrossRef]
- Farrish, K. Spatial and temporal fine-root distribution in three Louisiana forest soils. Soil Sci. Soc. Am. J. 1991, 55, 1752–1757. [Google Scholar] [CrossRef]
- Hendrick, R.L.; Pregitzer, K.S. Temporal and depth-related patterns of fine root dynamics in northern hardwood forests. J. Ecol. 1996, 84, 167–176. [Google Scholar] [CrossRef]
- Purbopuspito, J.; Van Rees, K. Root distribution at various distances from clove trees growing in Indonesia. Plant Soil 2002, 239, 313–320. [Google Scholar] [CrossRef]
- Han, F.; Zheng, J.; Zhang, X. Plant root system distribution and its effect on soil nutrient on slope land converted from farmland in the Loess Plateau. Trans. CSAE 2009, 25, 50–55, (In Chinese with English Abstract). [Google Scholar]
- Bengough, A.; Mackenzie, C.; Elangwe, H. Biophysics of the growth responses of pea roots to changes in penetration resistance. Plant Soil 1994, 167, 135–141. [Google Scholar] [CrossRef]
- Li, Y.Y.; Shao, M.A. Change of soil physical properties under long-term natural vegetation restoration in the Loess Plateau of China. J. Arid Environ. 2006, 64, 77–96. [Google Scholar] [CrossRef]
- Jiao, F.; Wen, Z.-M.; An, S.-S. Changes in soil properties across a chronosequence of vegetation restoration on the Loess Plateau of China. Catena 2011, 86, 110–116. [Google Scholar] [CrossRef]
- Wang, B.; Zhang, G.-H.; Yang, Y.-F.; Li, P.-P.; Liu, J.-X. Response of soil detachment capacity to plant root and soil properties in typical grasslands on the Loess Plateau. Agric. Ecosyst. Environ. 2018, 266, 68–75. [Google Scholar] [CrossRef]
- Liu, Z.; Liu, J.; Hu, W.; Qi, Y. Water-holding Characteristics of Litter and Soil of Juglans mandshurica Natural Secondary Forest with Different Densities. For. Eng. 2021, 37, 52–59. [Google Scholar] [CrossRef]
- Bryan, R.B. The development, use and efficiency of indices of soil erodibility. Geoderma 1968, 2, 5–26. [Google Scholar] [CrossRef]
- Cerdà, A. The influence of geomorphological position and vegetation cover on the erosional and hydrological processes on a Mediterranean hillslope. Hydrol. Processes 1998, 12, 661–671. [Google Scholar] [CrossRef]
- Yu, D.-S.; Shi, X.-Z.; Weindorf, D.C. Relationships Between Permeability and Erodibility of Cultivated Acrisols and Cambisols in Subtropical China. Pedosphere 2006, 16, 304–311. [Google Scholar] [CrossRef]
- Zhou, Z.C.; Gan, Z.T.; Shangguan, Z.P.; Dong, Z.B. Effects of grazing on soil physical properties and soil erodibility in semiarid grassland of the Northern Loess Plateau (China). Catena 2010, 82, 87–91. [Google Scholar] [CrossRef]
- Oostwoud Wijdenes, D.J.; Bryan, R. Gully-head erosion processes on a semi-arid valley floor in Kenya: A case study into temporal variation and sediment budgeting. Earth Surf. Processes Landf. 2001, 26, 911–933. [Google Scholar] [CrossRef]
- Marzolff, I.; Ries, J.B.; Poesen, J. Short-term versus medium-term monitoring for detecting gully-erosion variability in a Mediterranean environment. Earth Surf. Processes Landf. 2011, 36, 1604–1623. [Google Scholar] [CrossRef]
- Frankl, A.; Poesen, J.; Deckers, J.; Haile, M.; Nyssen, J. Gully head retreat rates in the semi-arid highlands of Northern Ethiopia. Geomorphology 2012, 173, 185–195. [Google Scholar] [CrossRef] [Green Version]
- Ionita, I.; Niacsu, L.; Poesen, J.; Fullen, M.A. Controls on the development of continuous gullies: A 60 year monitoring study in the Moldavian Plateau of Romania. Earth Surf. Processes Landf. 2021, 46, 2746–2763. [Google Scholar] [CrossRef]
- Wells, R.R.; Bennett, S.J.; Alonso, C.V. Effect of soil texture, tailwater height, and porewater pressure on the morphodynamics of migrating headcuts in upland concentrated flows. Earth Surf. Processes Landf. 2009, 34, 18671877. [Google Scholar] [CrossRef]
- Gyssels, G.; Poesen, J.; Bochet, E.; Li, Y. Impact of plant roots on the resistance of soils to erosion by water: A review. Prog. Phys. Geogr. 2005, 29, 189–217. [Google Scholar] [CrossRef] [Green Version]
- Zhang, J.; Song, C.; Wang, S. Dynamics of soil organic carbon and its fractions after abandonment of cultivated wetlands in northeast China. Soil Tillage Res. 2007, 96, 350–360. [Google Scholar] [CrossRef]
Publisher’s Note: MDPI stays neutral with regard to jurisdictional claims in published maps and institutional affiliations. |
© 2022 by the authors. Licensee MDPI, Basel, Switzerland. This article is an open access article distributed under the terms and conditions of the Creative Commons Attribution (CC BY) license (https://creativecommons.org/licenses/by/4.0/).