Article

Residents’ Preference for Urban Green Space Types and Their Ecological-Social Services in China

1
Department of Geography, School of Geography and Tourism, Shaanxi Normal University, Xi’an 710119, China
2
Department of Geography, School of Geography and Tourism, Xinjiang Normal University, Urumqi 830054, China
3
School of Tourism &Research Institute of Human Geography, Xi’an International Studies University, Xi’an 710128, China
4
State Key Laboratory of Urban and Regional Ecology, Research Center for Eco-Environmental Sciences, Chinese Academy of Sciences, Beijing 100085, China
*
Author to whom correspondence should be addressed.
Land 2022, 11(12), 2239; https://doi.org/10.3390/land11122239
Submission received: 10 November 2022 / Revised: 5 December 2022 / Accepted: 6 December 2022 / Published: 8 December 2022

Abstract

:
With accelerated urbanization and rapid expansion of the urban population, there is an increasing demand among urban residents for urban green spaces (UGS) and the ecosystem services (ES) they provide. The existing research mostly focuses on the spatial pattern of UGS types and ES provided by different UGS but ignores that residents’ preferences for UGS types and their ecological and social services should also be incorporated into the spatial planning decision-making of UGS. A web-based questionnaire was distributed randomly in urban areas of China and 1050 valid samples were collected in this study. Descriptive statistical analysis methods, structural equation modeling, and Pearson correlation were used to parse the residents’ preference for both UGS types, ecological–social services, and the relevant impact factors. The results showed that: (1) the strongest preference of residents for UGS and their ecological and social services are the attached green space, “beautifying the city”, and “physical and mental relaxation”, respectively; (2) the leading factors for residents’ access to UGS are “age” and “sufficient time”, except for attached green space. The most significant effect on both ecological and social services is the “season” factor. Further, “social gathering” and “exercise” are the services most and least likely to be affected. (3) Future planning of UGS should reinforce construction of attached green space and improve the aesthetics-related ES they provide. Construction of park green space and plaza green space should be enhanced to deal with the aging trend in society. Further, maintaining the existing construction of attached green space and building regional green space are crucial to the sustainability of UGS and its ecological–social services.

1. Introduction

Rapid urbanization in China has led to a transition from land-centered urbanization to people-centered urbanization, which has resulted in a growing concern for the natural environment by urban residents [1,2]. As an artificial environment to connect with nature, urban green spaces (UGS) have played an increasingly prominent role in the recent two decades around the world [3,4]. Naturally, UGS have attracted the attention of many researchers. Among all the research, it is clear that residents’ preference for UGS is one of the most studied fields for people-centered urbanization to study the relationship between residents with different characteristics and UGS [5]. For example, preferences towards aesthetics, health care, and biodiversity conservation that UGS can provide have all been widely studied [6,7]. These preference types are closely related to the variety of goods and services that natural ecosystems provide to humans [8]. Recently, the concept of ecosystem services (ES) has played an increasingly widespread role as a bridge in studying the interactions between society and ecosystems [9]. Meanwhile, quantitative research on urban ES has been growing, and UGS have become a critical research subject of these studies [10,11,12]. Therefore, the ES provided by UGS have been generating increasing attention from researchers and relevant management agencies recently in China [13], and residents’ preference for ES is pyramidally regarded as a key reference factor for future urban planning [14,15,16]. However, the classification of ES provided by UGS is still a challenge to be resolved [17]. Although the ES of UGS were usually classified by the Common International Classification for Ecosystem Services (CICES), their limitations are obvious in terms of cultural services and their framework [17]. Further, the universally accepted classification of ES proposed by MEA is not suitable for UGS and studies involving residents’ preferences [8] because the differences among provisioning, regulating, and cultural services are difficult for non-professional respondents to understand and should be more detailed in UGS application scenarios. To some extent, previous studies have ignored the classification of residents’ preferences for different ES, resulting in a lacking perception of the specific role of ES in UGS [18]. Therefore, it is necessary to establish a more concise and clear classification to study residents’ preference for ES in UGS.
Specifically, the services of UGS for urban residents’ preferences can be classified into two main aspects: ecological services and social services [19,20]. First, UGS can provide ecological services, such as climate regulation, biodiversity conservation, beautifying the city, etc. [21,22,23]. Further, UGS can provide social services, including maintaining mental health, maintaining physical health, offering a place for natural education and aesthetic appreciation, etc. [24,25,26,27]. Therefore, based on UGS characteristics, CICES, and existing studies, it is reasonable for our research to divide ES delivered by UGS into ecological services and social services [21,28]. In addition to the classification gaps of ES in UGS, comprehensive studies of various types of UGS are also always ignored. UGS can be divided into five categories, including park green space, plaza green space, attached green space, regional green space, and protected green space [29,30]. However, most current studies have only focused on a single type of UGS, such as park green space [31,32], plaza green space [33], attached green space [34], and few studies have integrated multiple types of UGS into their research [18]. Additionally, the data collected in previous studies on residents’ preference for UGS were mainly from mobile tracking, online reviews, questionnaires, etc. These data sources are influenced by a variety of factors. For instance, mobile tracking data are biased across economic gradients as people with higher incomes often use more mobile-tracking-related software [35]; online reviews may not be representative of all types of user groups [36]. Overall, data source combined with web-based questionnaire is the most extensively applied data source by far in current studies [37,38].
Overall, a web-based questionnaire research framework using descriptive statistical analysis methods, structural equation modeling (SEM), and such quantitative methods was adopted to study urban residents’ preference for various green space types and their ecological–social services in the urban regions of China. The objectives of this study are: (1) quantify the residents’ preference for UGS types; (2) explore the residents’ preference for ecological and social services provided by UGS; (3) discuss the impact factors influencing residents’ preference for UGS types and their ecological–social services. Based on the results, suggestions for future urban planning decisions under different preferences of residents for UGS and their ecological–social services are put forward.

2. Material and Methods

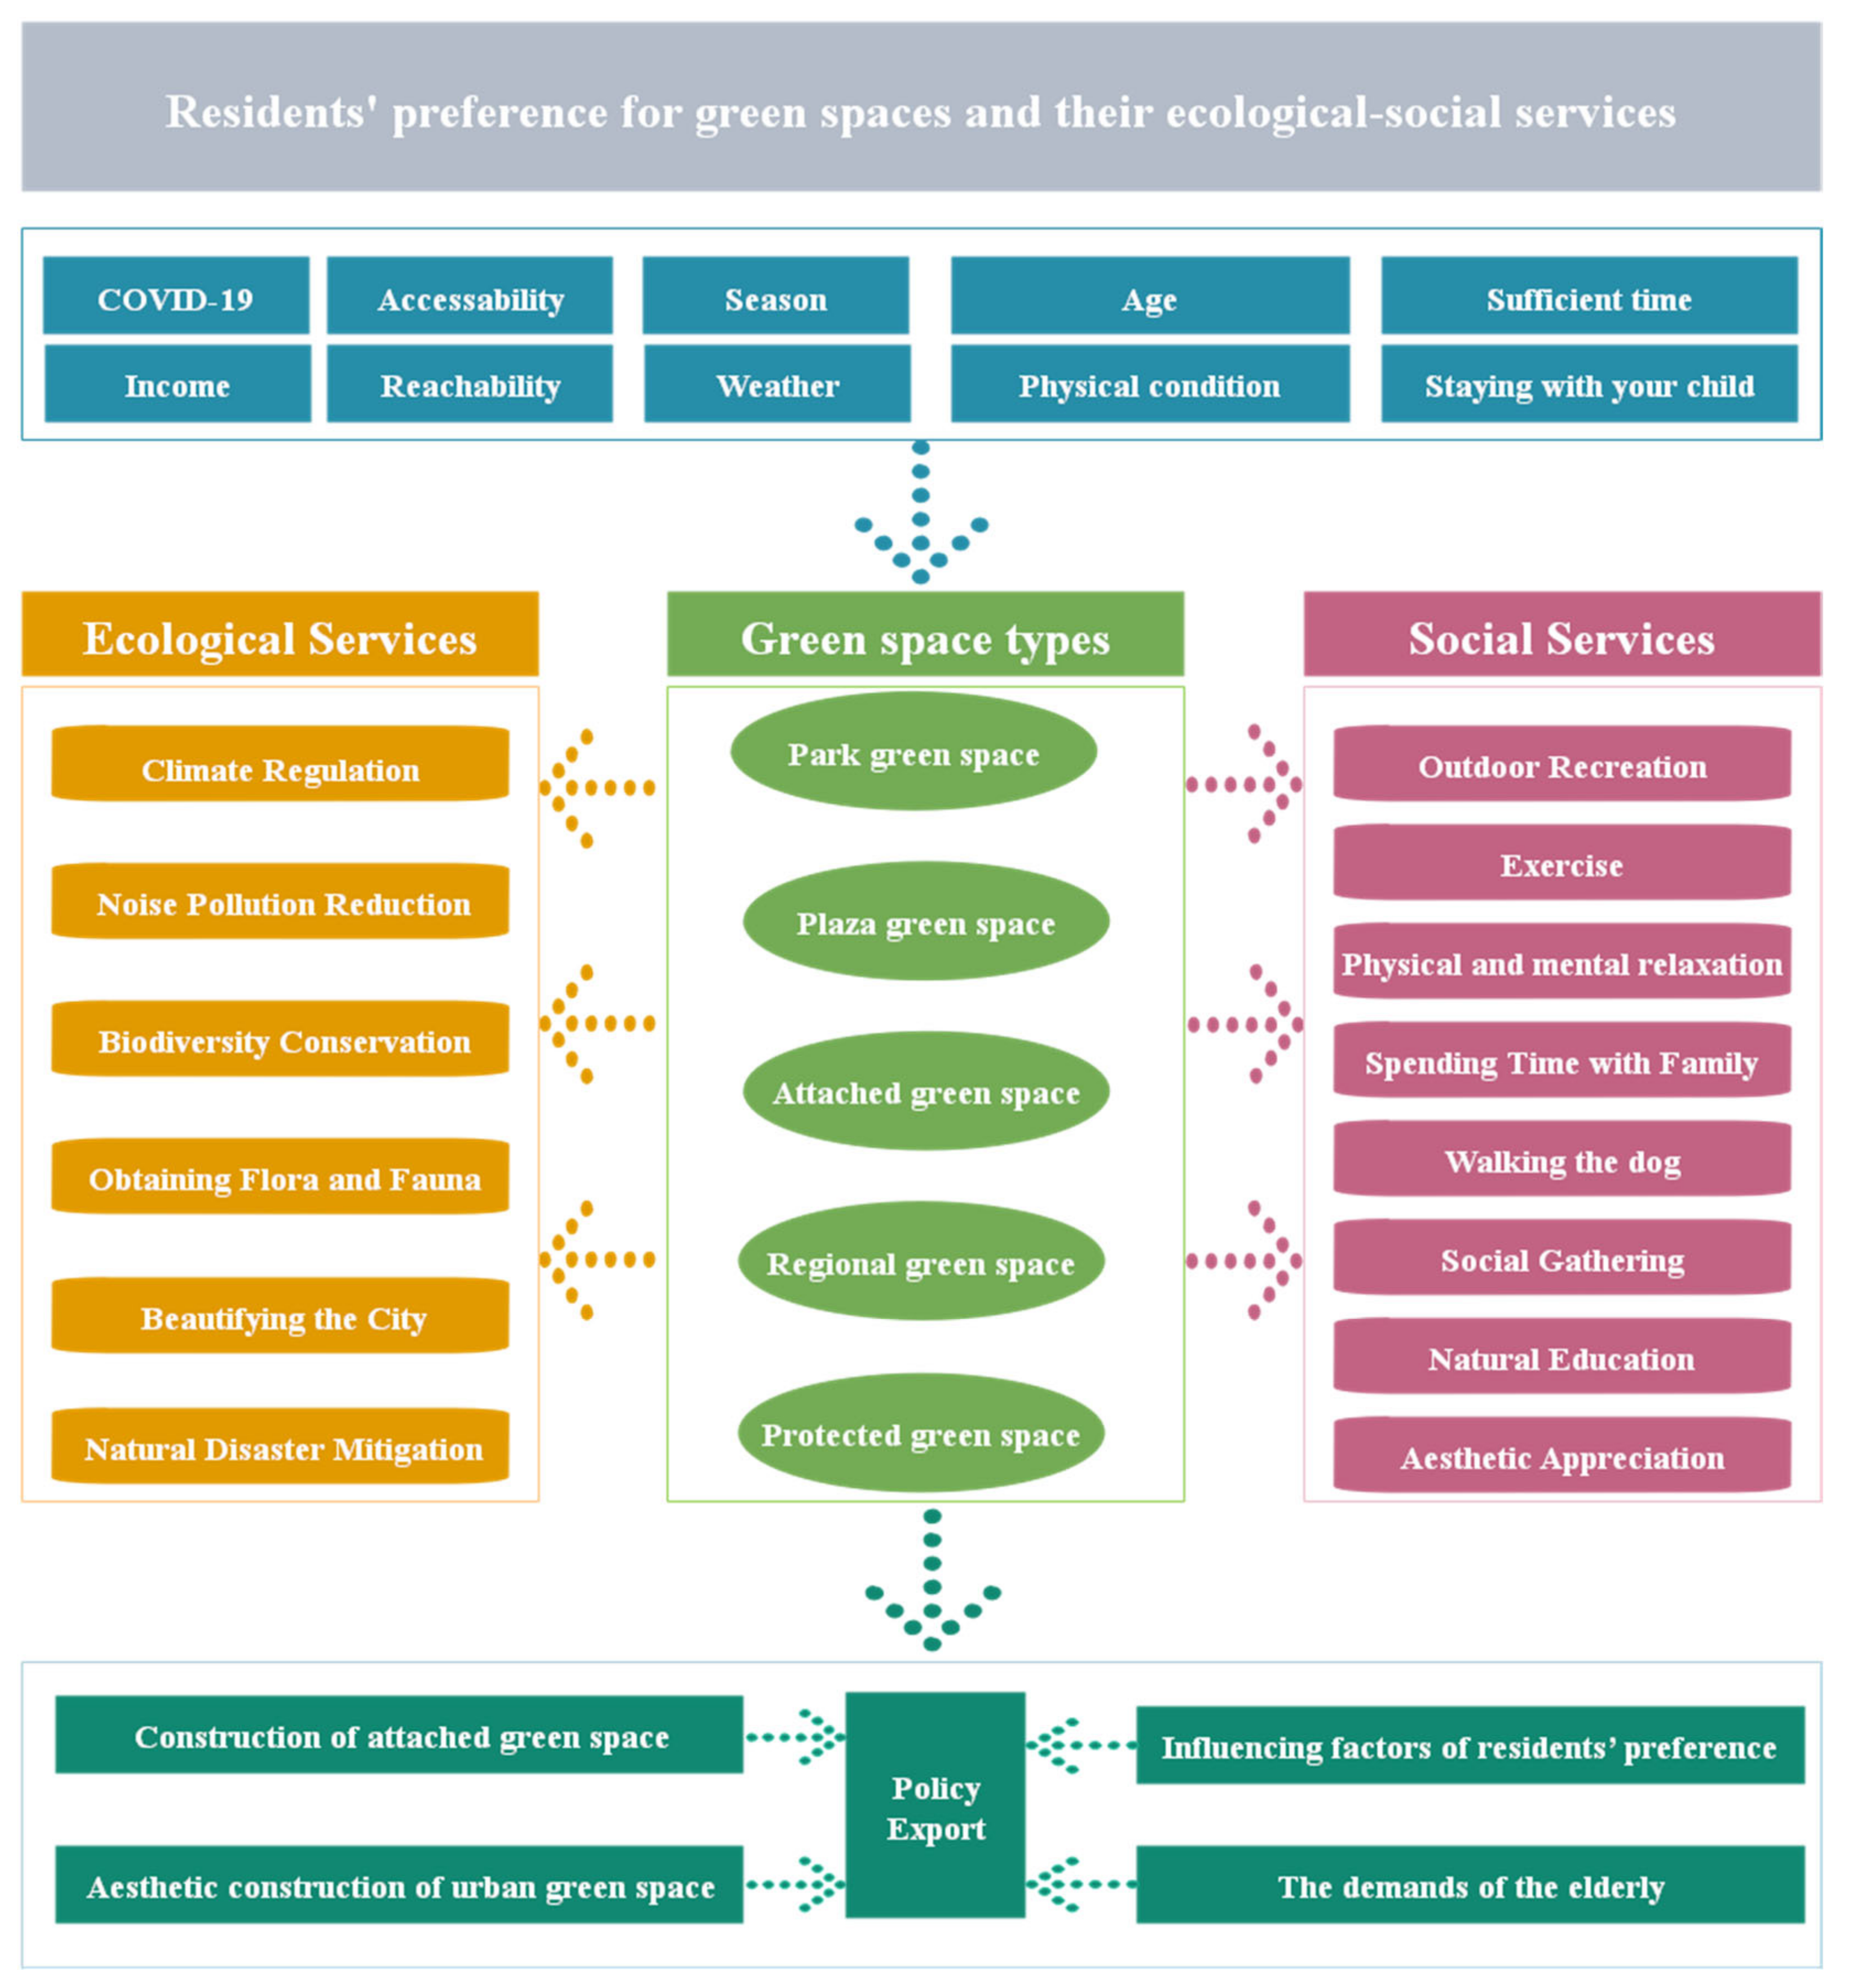
2.1. The Framework for Analyzing Residents’ Preference for UGS and Ecological–Social Services

To explore residents’ preference for UGS and their ecological and social services, this study systematically classified the factors influencing residents’ selection of the different types of UGS and ES, and effective suggestions for future policymaking were also proposed (Figure 1). UGS are separated into five types according to national standards and their functions. They include park green space, plaza green space, attached green space, regional green space, and protected green space, respectively. Distinctions of different UGS types were made to facilitate the respondents’ understanding in this study: the main difference between a park and plaza green space is that the plaza green space is mainly covered by impervious surfaces. The attached green space is affiliated with various types of urban construction land. Regional green space is outside the urban construction land and usually gathers in the suburbs. Protected green space is an independent green space type that is designed to meet the city’s requirements for health, isolation, security, and ecological protection. Thus, it is unavailable to residents and the questionnaire did not mention this green space type [29].
In addition, the ES provided by UGS is divided into ecological and social services in this framework. Ecological services are those UGS objectively brings to the residents, including climate regulation, noise pollution reduction, biodiversity conservation, obtaining flora and fauna, beautifying the city, and natural disaster mitigation. The social services are those residents experience subjectively, including outdoor recreation (focus on going outdoors), exercise, physical and mental relaxation, spending time with family (mainly the elderly and children), walking the dog, social gathering (emphasis on interaction with people in the same community), natural education, and aesthetic appreciation.
In our framework, the socio-demographic factors and environmental factors influencing residents’ preference for UGS were covered in ten items: COVID-19, accessibility, reachability, income, season, weather, age, physical condition, sufficient time, and staying with your child. The difference between accessibility and reachability is that accessibility stressed the ease of entry (e.g., entrance fees, reservations required, etc.) and reachability refers to the difficulty of transportation (e.g., rugged roads, long distances, etc.). Given the above-collected information, the questionnaire was used to obtain the driving factors of residents entering different kinds of UGS except for the protected green space, their demands for different green space types, and their preference for different social and ecological services. Based on the questionnaire data analysis, the gap of unclear classification of services in previous studies was filled.

2.2. Questionnaire Development and Data Collection

Based on the study framework and study objects, the questionnaire (Appendix A) consists of respondents’ demographic information, impact factors on UGS, preference for different UGS types, perception of ecological and social services provided by UGS, and willingness to protect UGS. After the questionnaire design was completed, a small range of pre-survey was carried out, and 20 questionnaires were obtained. Then, adjustments were made based on the opinions of the 20 respondents. Finally, the questionnaire was randomly selected throughout China. Due to the COVID-19 prevention and control in China, it is not possible to collect questionnaires offline. Therefore, the final version of the questionnaire was distributed online, powered by a widely used professional online questionnaire survey platform in China (www.wjx.cn, accessed on 1 March 2022) from 9 to 18 March 2022, and 1050 valid questionnaires were attained.

2.3. Sample Representation

The scale of this study is specific to the district and county scale to ensure the respondents were all from urban regions. The survey included 31 of 34 provincial administrative regions, 168 municipal administrations, as well as 379 district-level administrative units in China, except for Tibet, Taiwan, and Hong Kong. The sample covers an age range of all age groups. The age distribution conforms to a normal distribution, and the number of male respondents is a bit smaller than that of female respondents (Table 1). Nearly 60% of the respondents were married. Over 20% of the respondents indicated that they had children who cannot move alone and needed to be accompanied to the UGS. Among the respondents, nearly 50% have a bachelor’s degree, and nearly 40% of respondents have a master’s degree or doctoral degree. A generally high level of education can help respondents understand the questionnaire better [39]. According to the standard of residents’ disposable income in the China Statistical Yearbook, residents with a monthly disposable income of no more than CNY 2000 are defined as low-income, while those with a monthly disposable income of more than CNY 2000 are defined as high-income. The number of high-income respondents is nearly equal to that of the low-income group.

2.4. Statistical Analysis and Test Methods

The reliability of the questionnaire was tested by the internal consistency coefficient Cronbach’s α. Cronbach’s α is formulated as follows:
α = K K 1 1 S i 2 S x 2
where α is the reliability coefficient, K is the number of test questionnaires, S i 2 is variation in scores for all subjects on the questionnaire, S x 2 is the variance of the total score obtained by all subjects. If Cronbach’s α is greater than 0.8, it indicates good reliability of the questionnaire [40]. The Cronbach’s α value is 0.857 in this study; hence, the results of the questionnaire are capable of further analysis.
Descriptive statistical analysis methods, including mean value, standard error of the mean, median, plural, standard deviation, and variance, were used to explore the residents’ preferences for UGS types and the preference of residents for ES [18]. SEM was employed to clarify the correlation between the actual frequency and impact factors [41]. Additionally, the Pearson correlation coefficient and significance tests were applied to analyze the relationship between impact factors and ecological–social services; corresponding to the questionnaire is the relationship between the importance of various ES considered by residents and the factors affecting residents regarding UGS [18].

3. Results

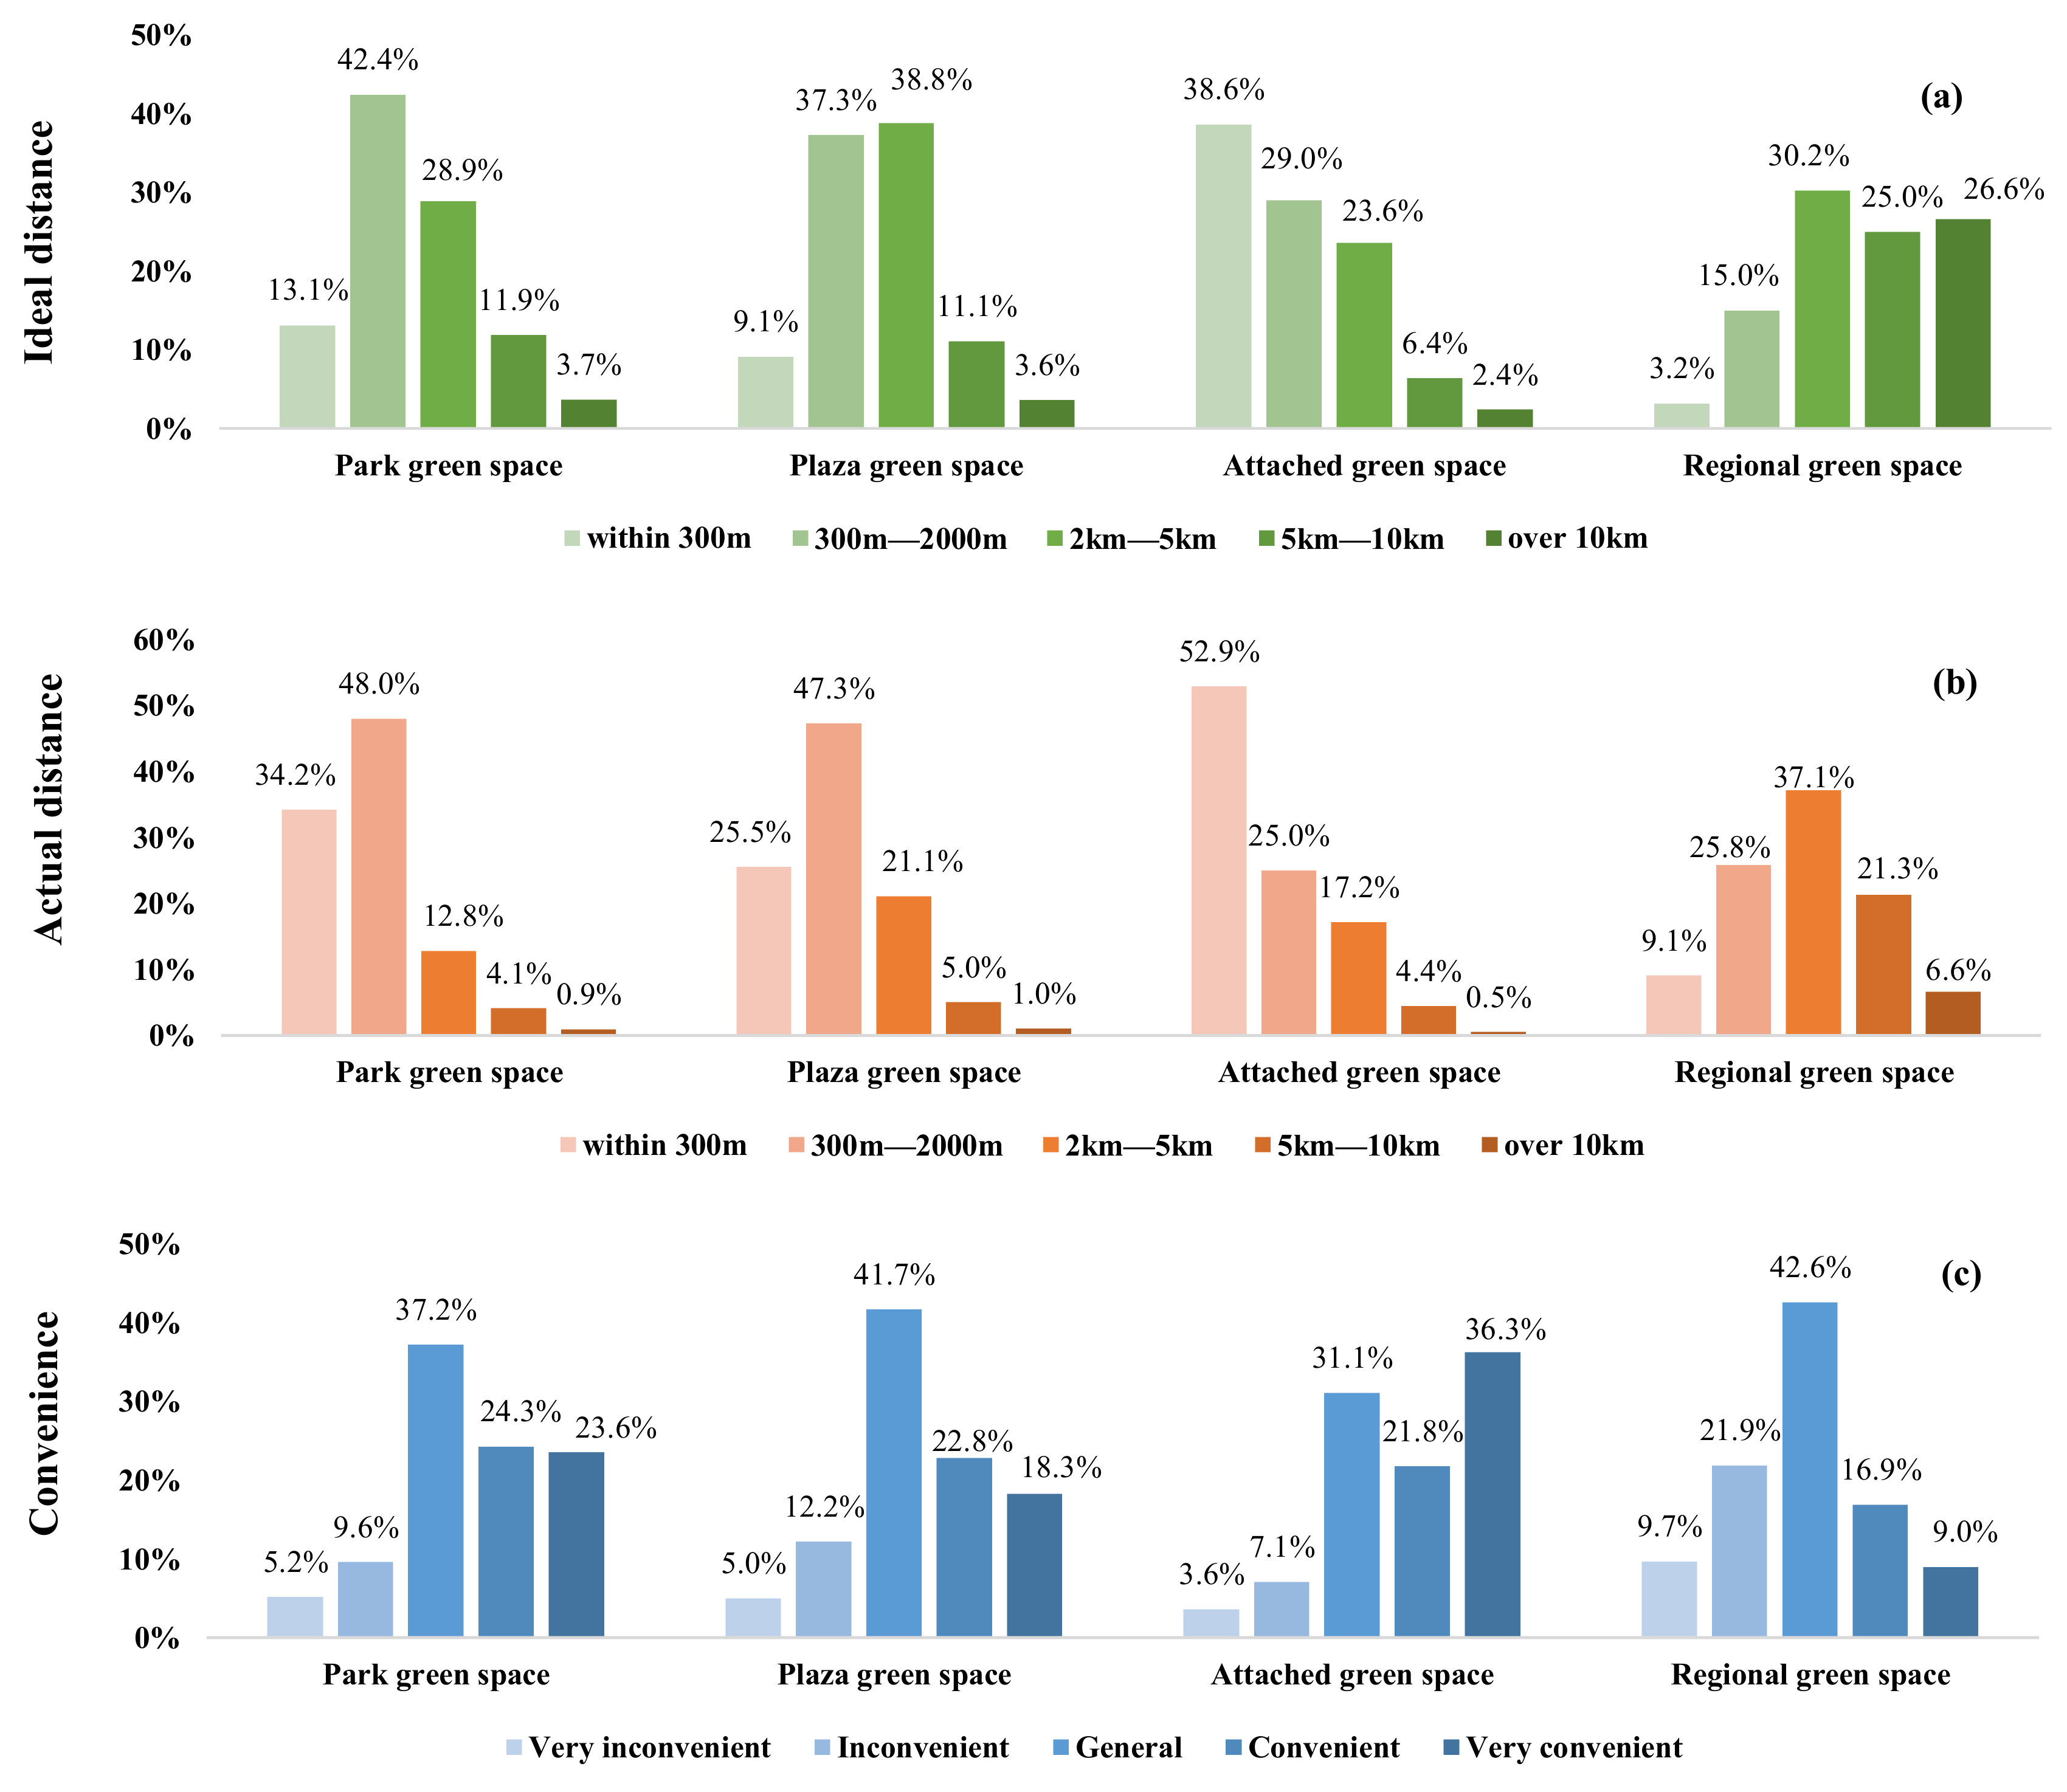
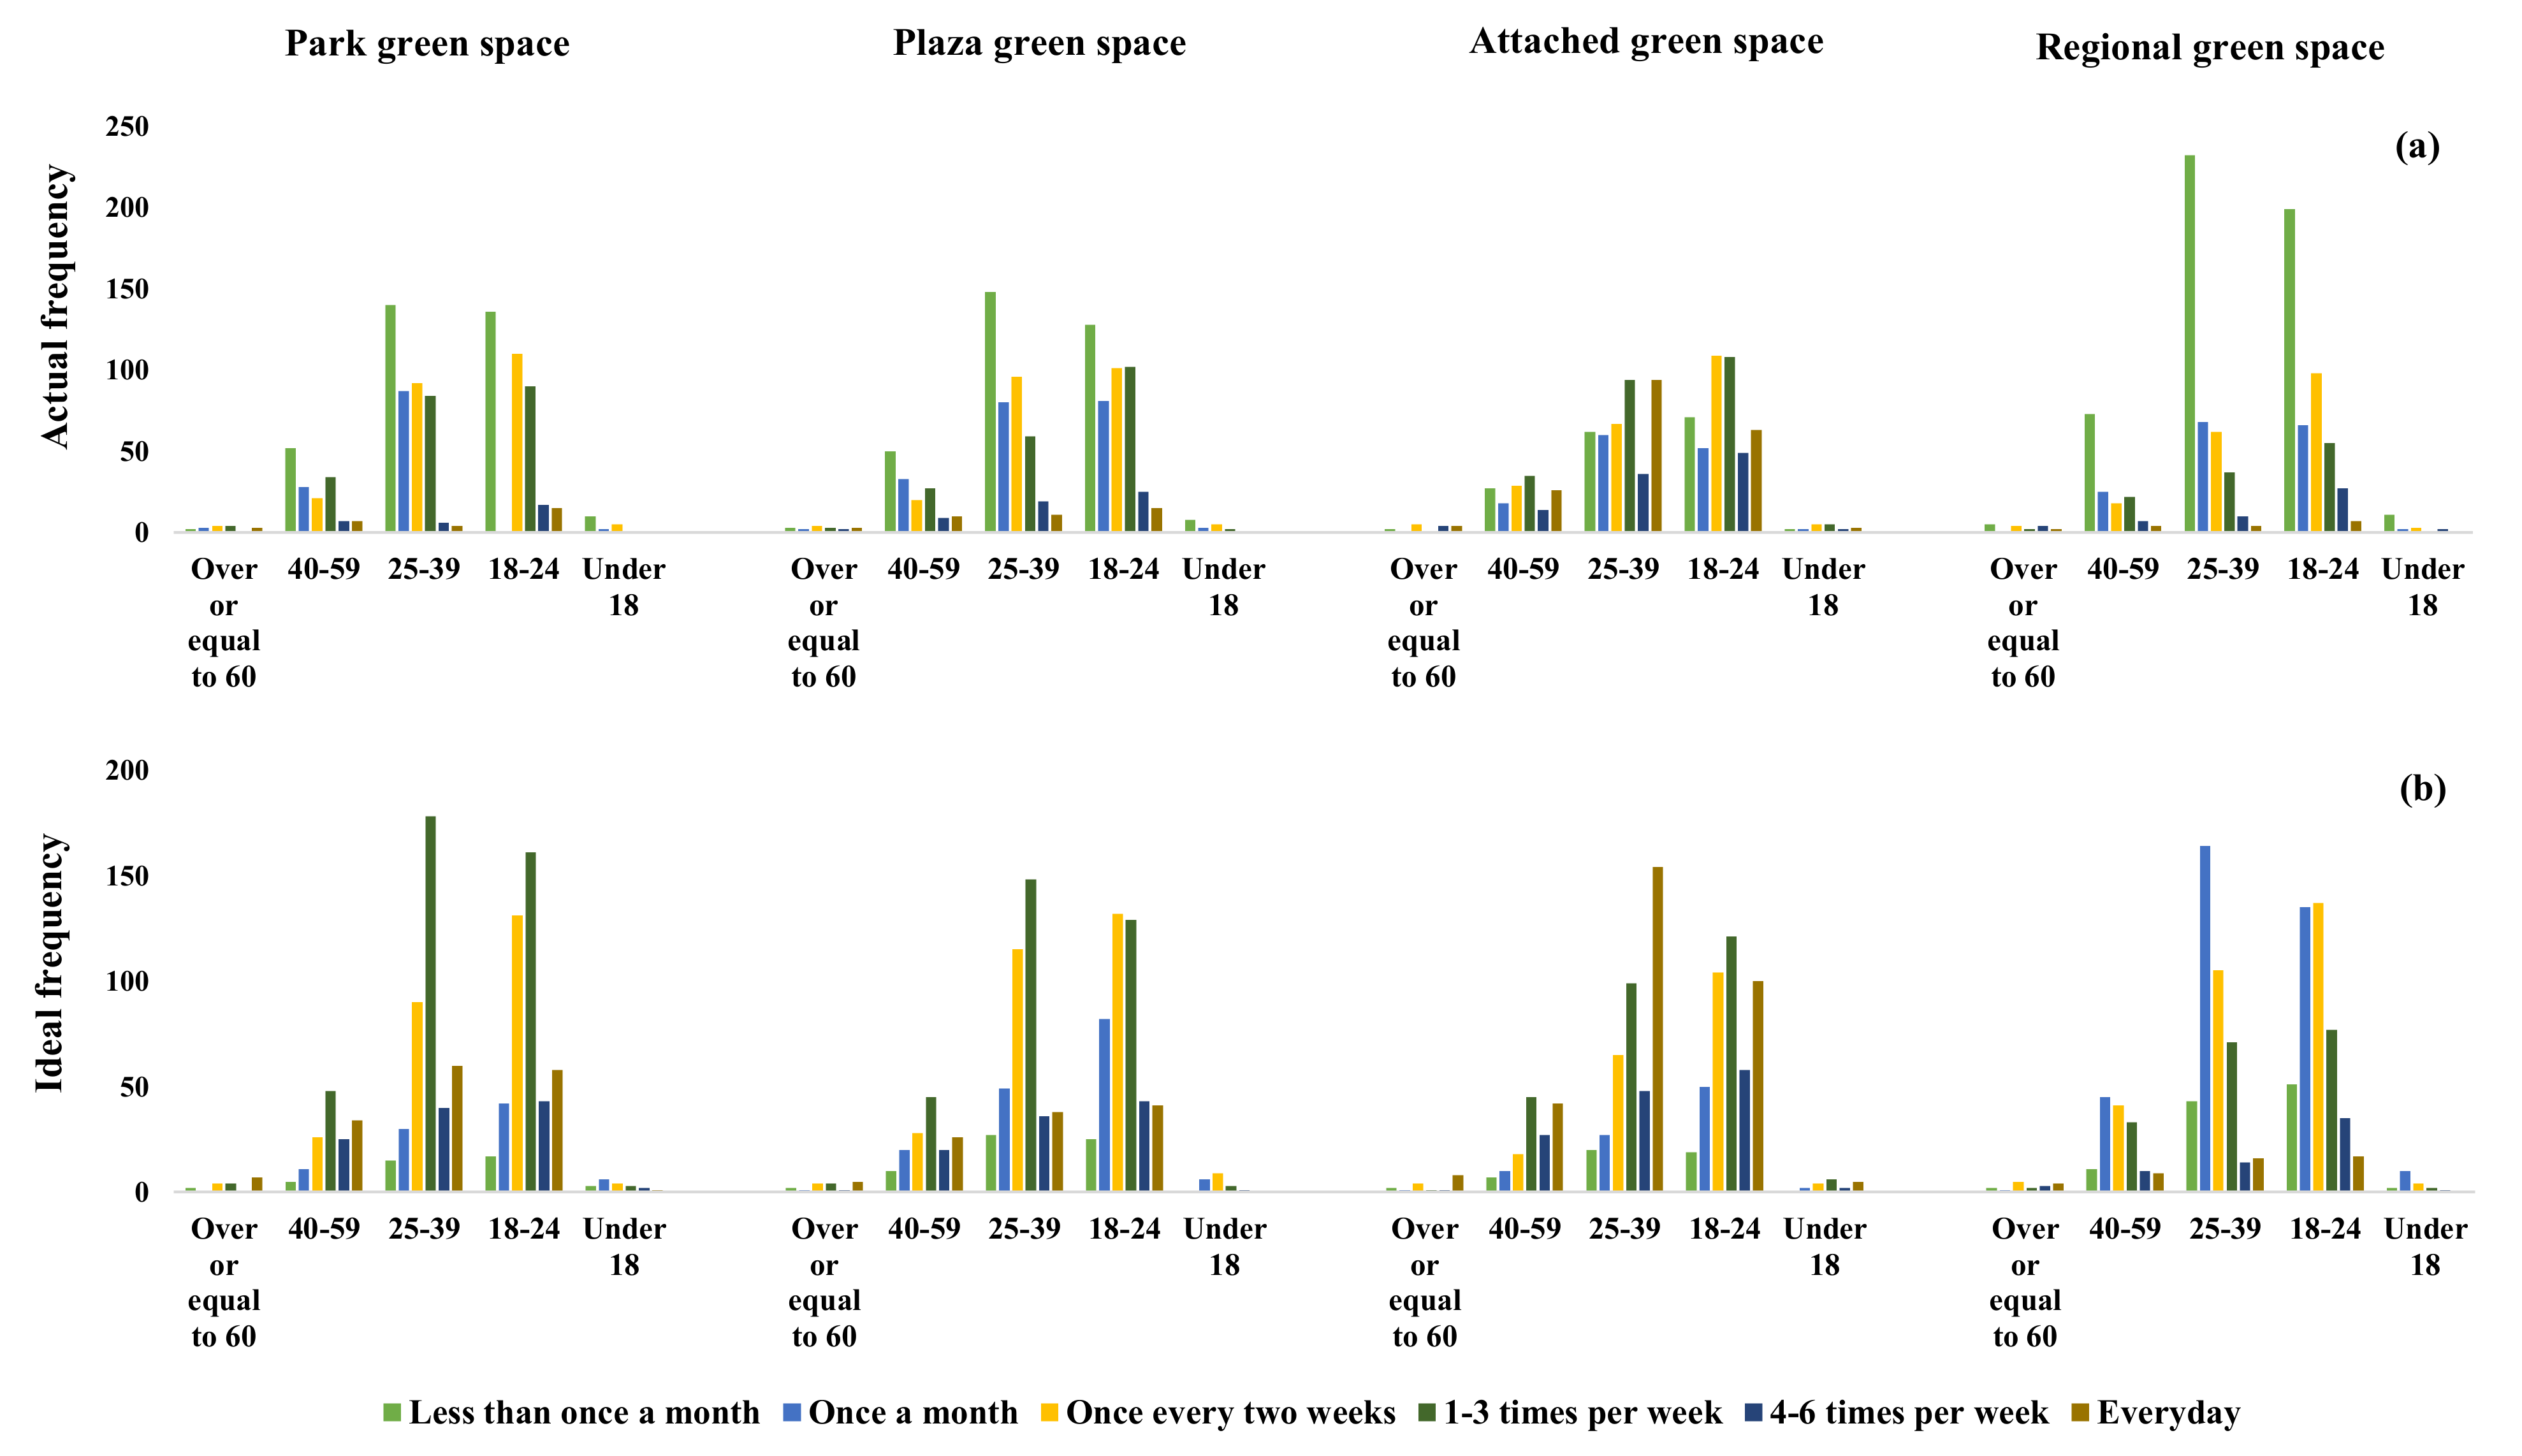
3.1. Urban Residents’ Preference for Green Space Types

In this study, the ideal frequency of visits was employed to represent residents’ preferences for different types of UGS, and the actual frequency of visits was used to reflect the real situation of visiting UGS. The difference between the ideal and actual frequency indicated reaching residents’ preference for UGS. Residents’ preference for park green space is similar to plaza green space. To be specific, the ideal frequency of respondents going to park green space and plaza green space was mainly “1–3 times per week”, and the actual frequency of park and plaza green space was “less than once a month” (Table 2).
In terms of attached green space, the actual frequency and the ideal frequency are the highest among all types of UGS. The ideal frequency of attached green space was mostly “everyday”, while the actual frequency was “1–3 times per week” (Table 2). It demonstrates that attached green space was the type of UGS most strongly preferred by residents. As for the ideal distance residents expected from the attached green space, the option of “within 300 m” was up to 52.9% (Figure 2A), which was much higher than any other type of UGS. It demonstrated that urban residents have the strongest preference for attached green space as attached green space is closest to residents and the actual distance “within 300 m” accounted for 38.6% (Figure 2B). Consequently, it was the most convenient UGS type for residents to enter (Figure 2C). The Pearson correlation coefficient between the actual frequency and level of convenience was 0.495 (p < 0.01).
The ideal frequency of respondents going to a regional green space was mostly “once a month”, and the actual frequency of regional green space was “less than once a month” (Table 2). The actual frequency of four UGS types is less than the ideal frequency, indicating that residents’ demand for UGS was not being met. Among them, attached green space is most preferred by residents.

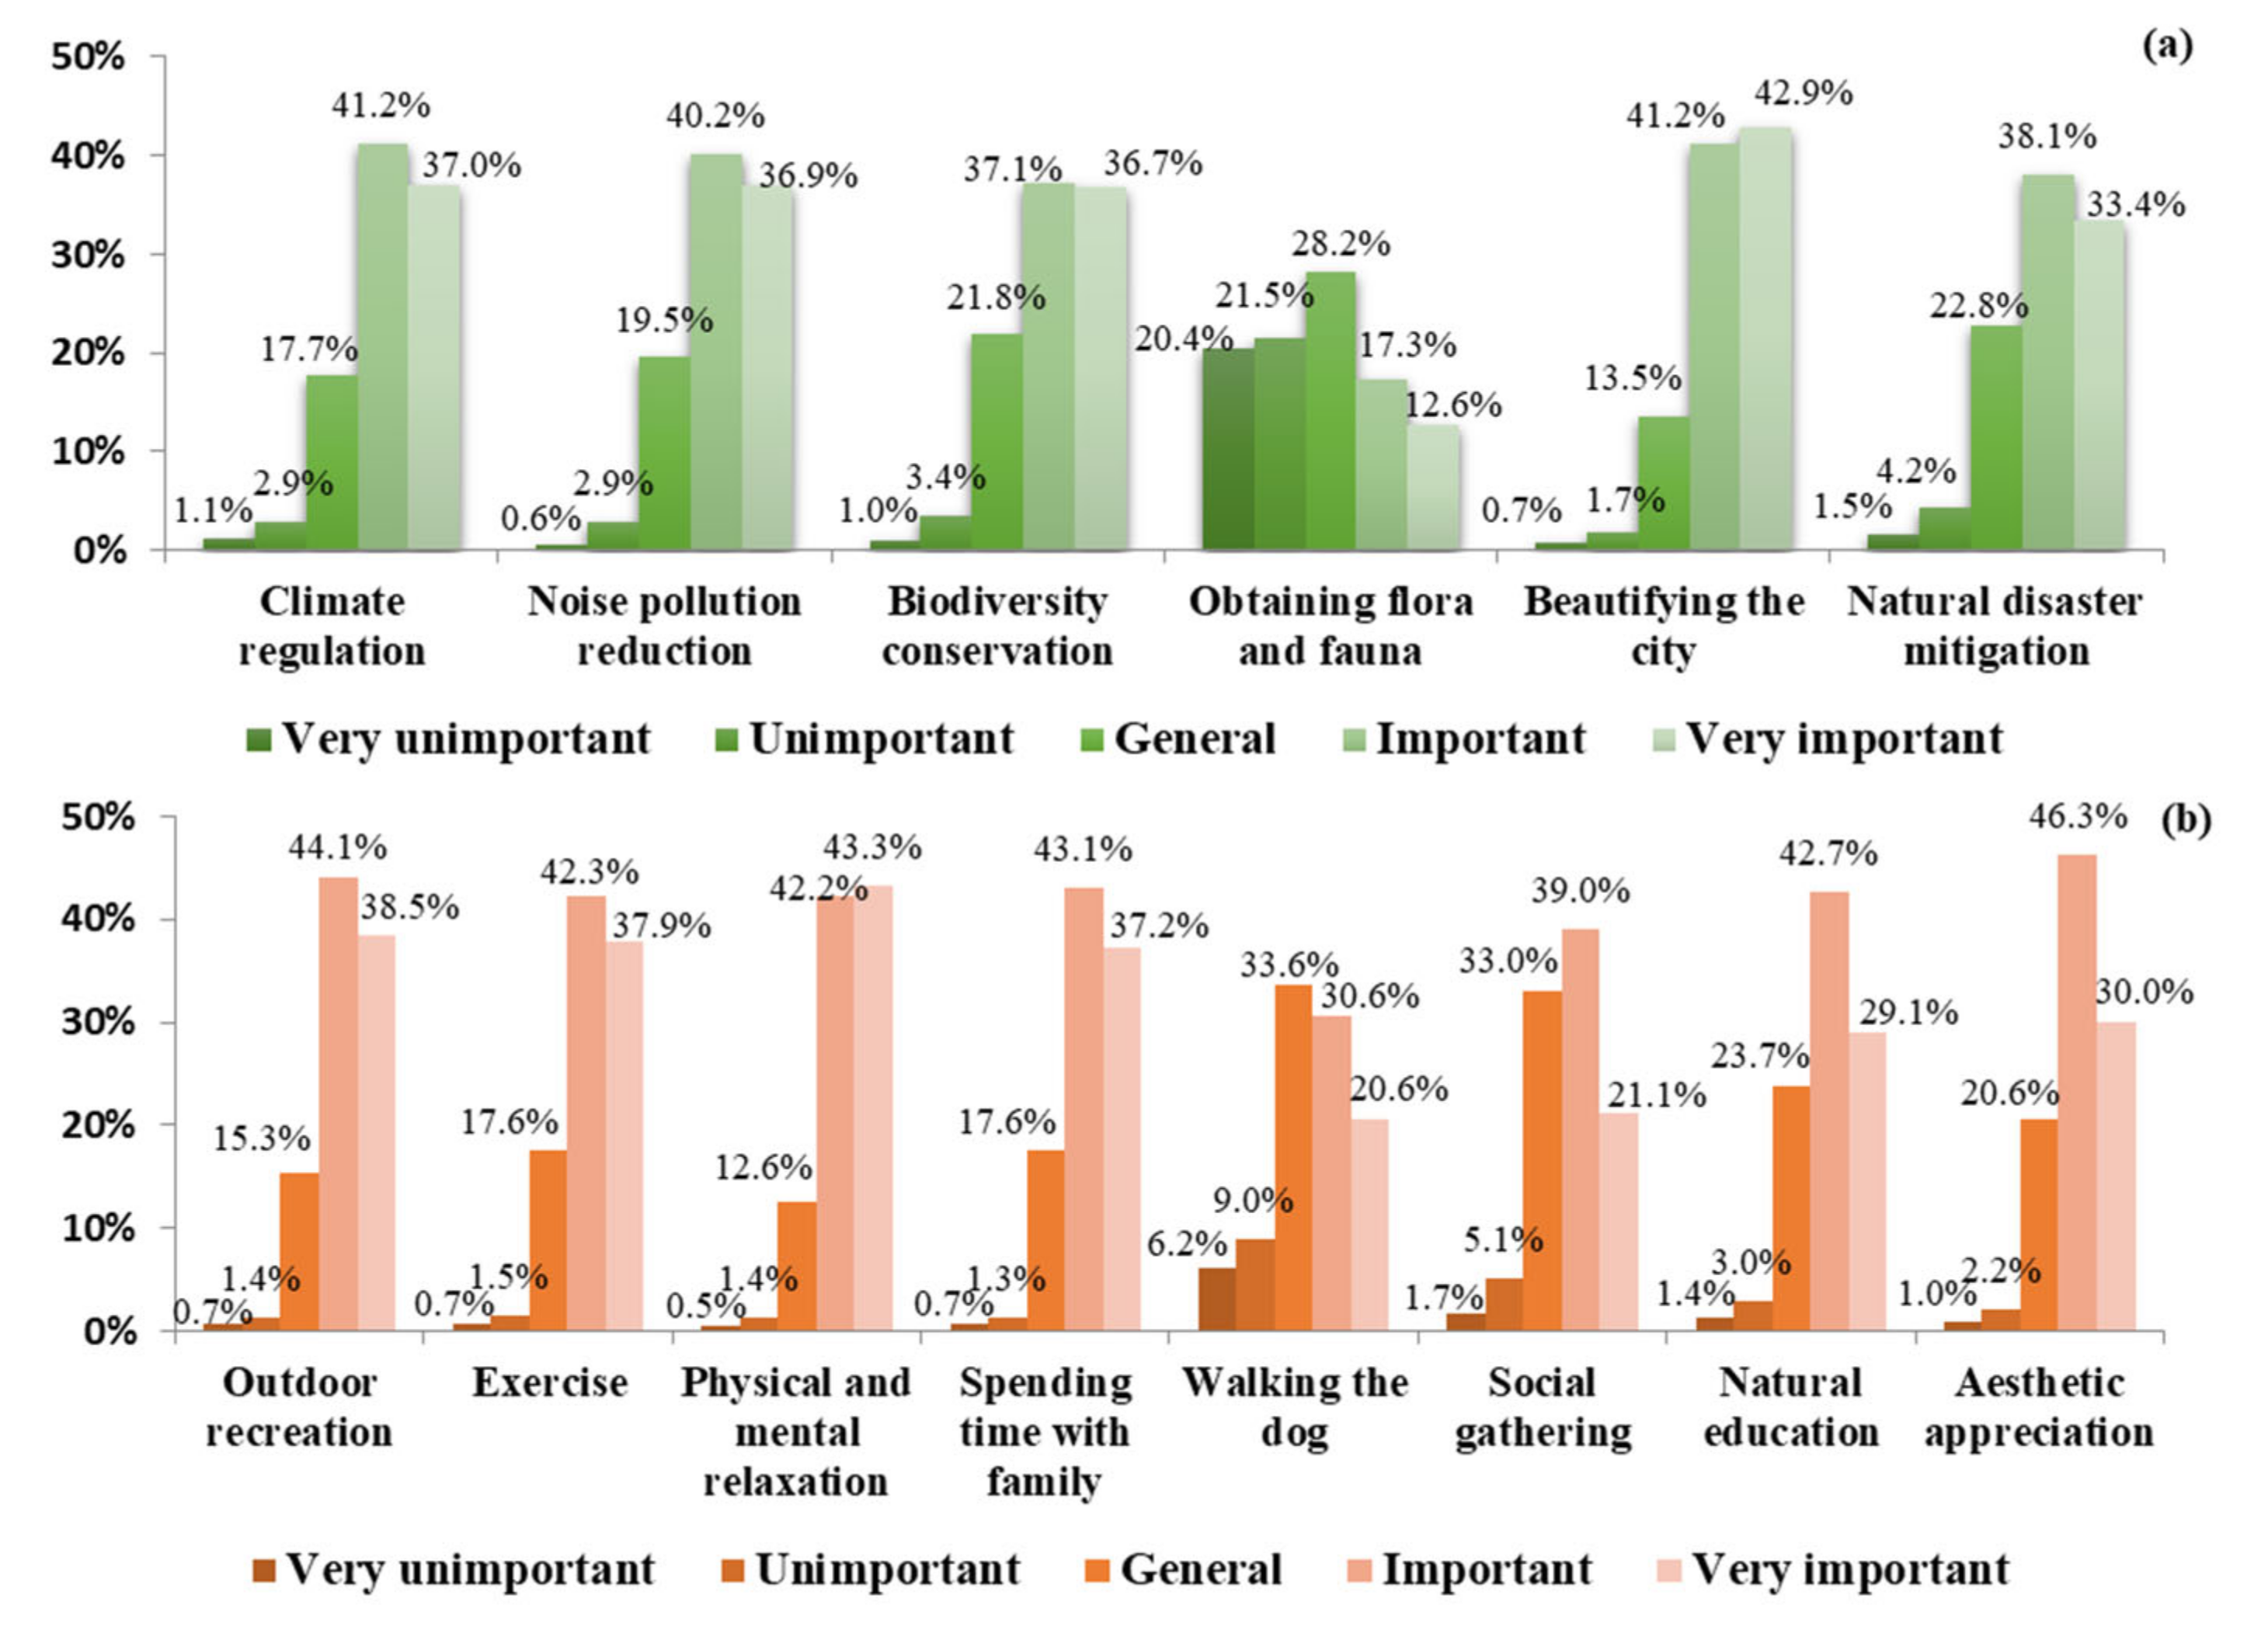
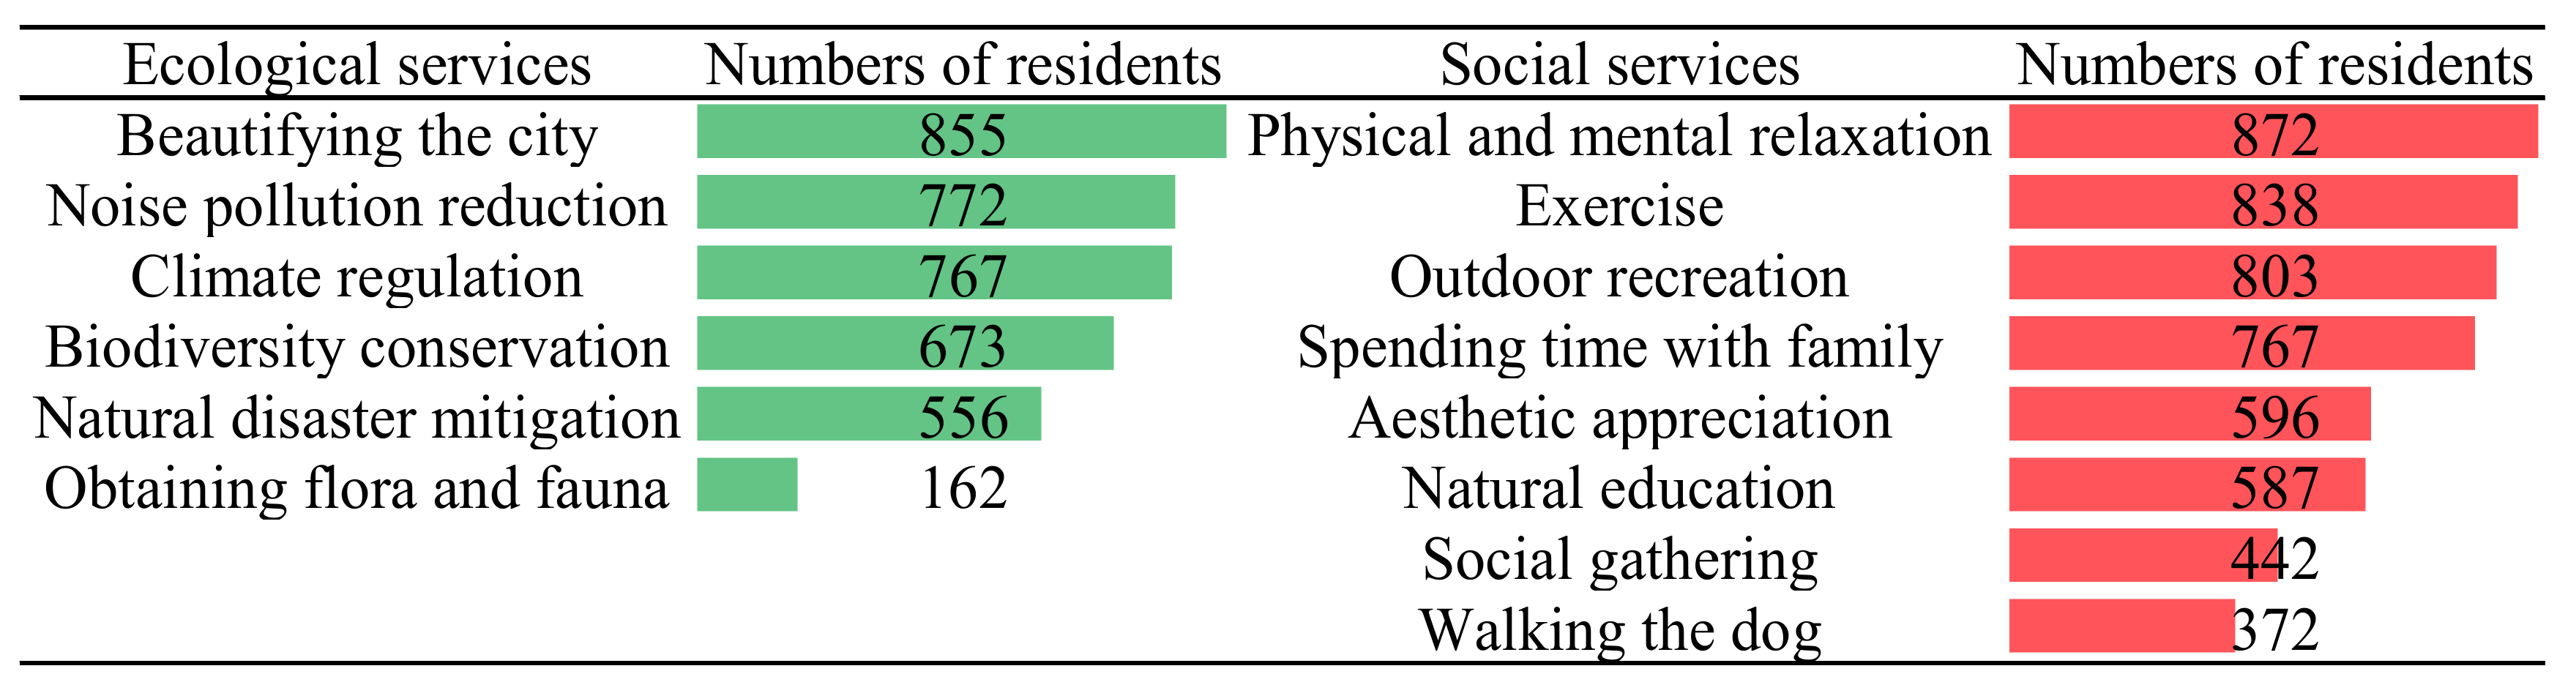
3.2. Residents’ Preference for Ecological and Social Services

The most preferred ecological service by urban residents was beautifying the city, with 42.9% of the respondents considering it “very important” and more than 41.2% “important” (Figure 3A). The preference for beautifying the city has been growing with the increasing income and education level of residents. Due to the current deteriorating climate, severe environment, and prominently serious noise pollution in cities, 41.2%, 40.2%, 38.1%, and 37.1% of residents regarded climate regulation, noise pollution reduction, natural disaster mitigation, and biodiversity conservation as “important”, respectively [42,43,44]. The preference for obtaining flora and fauna by residents was not obvious, and the importance of this service is most chosen “general” by residents.
The most preferred social service by urban residents was physical and mental relaxation. The questionnaire showed that 43.3% of respondents considered physical and mental relaxation as “very important” (Figure 3B), much higher than any other social services. The percentages of outdoor recreation, exercise, spending time with family, natural education, and aesthetic appreciation considered “important” are 44.1%, 42.3%, 43.1%, 42.7%, and 46.3%, respectively. Among the five social services, aesthetic appreciation was most preferred by residents. Based on the preferences for ecological services, aesthetics-related ES of UGS are the most desired ES by residents. At social gatherings, less than 40% of residents consider them “important”, and 33.6% of respondents rated the importance of walking the dog as “general”.
The services that residents most want to contribute are close to the services they most strongly preferred. Among the ecological services, the services that residents are most and least willing to contribute are beautifying the city and obtaining flora and fauna. Further, 855 and 162 respondents are willing to do so, respectively (Figure 4). For social services, the services that residents are most and least willing to contribute are physical and mental relaxation and walking the dog: 872 and 372 respondents are willing to do so, respectively. According to the survey, up to 97.2% of the residents are willing to take different actions to protect UGS. The most popular behaviors to protect UGS among residents were providing time (participating in voluntary work) and conducting advocacy or activities.

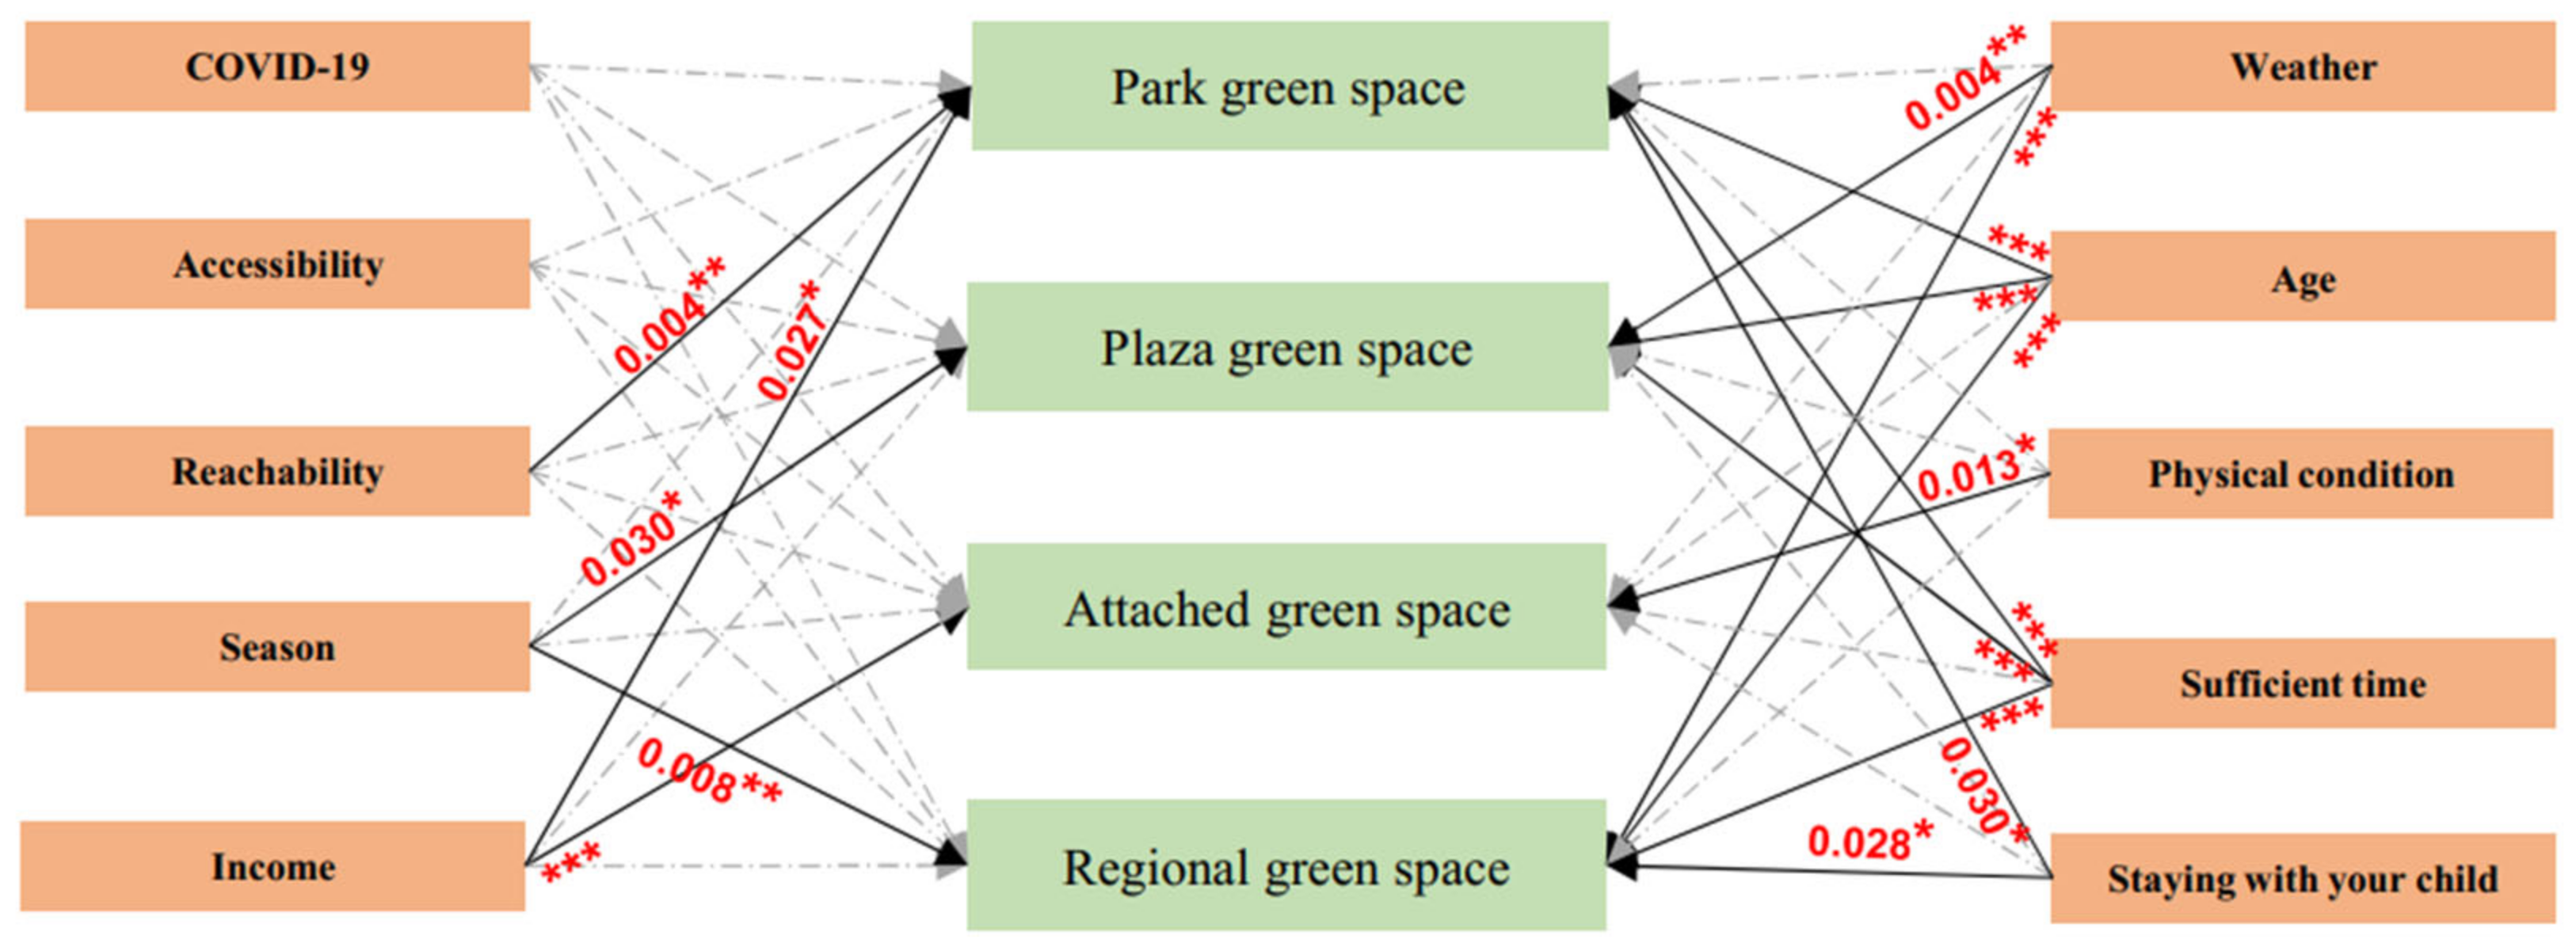
3.3. The Factors Influencing Residents’ Preference

Residents’ preferences for UGS types and ecological–social services were influenced by plenty of factors. It was shown that “season” has the greatest impact on services (Table 3), followed by “weather”, “reachability”, and “sufficient time”. The other driven factors had no striking impact on services. “Social gathering” was a highly susceptible service among the ES of UGS. Conversely, the service least likely to be impacted is “exercise”.
Significant discrepancies existed among the factors that affect residents’ access to different types of UGS. As the SEM showed, park green space was influenced by five factors (Figure 5). The two most influential factors of these were “age” and “sufficient time” (p < 0.001), followed by “reachability” (p < 0.01). In contrast, the least impact factors were “season” and “accompany children” (p < 0.05). Residents’ access to plaza green space was affected by four factors. Among the most influential were “age” and “sufficient time” (p < 0.001), followed by “weather” (p < 0.01) and “season” (p < 0.05). The least factors influencing residents’ visits to attached green spaces were “income” (p < 0.001) and “physical condition” (p < 0.05), and residents’ access to regional green space was affected by five factors. The greatest impact factors were “weather”, “age”, and “sufficient time” (p < 0.001). Next were “season” (p < 0.01) and “accompany children” (p < 0.05). Residents’ access to attached green space was least likely to be affected among the four types of UGS, which illustrated that residents’ preference for attached green space was not easily influenced. The two factors that most influence residents’ preference for UGS were “age” and “sufficient time”.
“Age” is one of the most important factors in residents’ preference for UGS because it significantly affects (p < 0.001) three green space types. For park and plaza green space, the most selected options of the actual and ideal frequency among urban residents are “less than once a month” and “1–3 times per week” basically for all ages (Figure 6). For regional green space, people aged 25–59 have the same preference, while a small difference was shown between those aged 18–24. Attached green space had the highest actual frequency and ideal frequency. For the 40–59 group, the frequency was “1–3 times per week”. As age decreased, the actual frequency of the 25–39 group was “1–3 times per week”, while the ideal frequency was “everyday”. The actual frequency of the 18–24 group to attached green space was lower than the ideal frequency. In conclusion, the type of green space most affected by “age” was attached green space, followed by regional green space, which essentially had no impact on park green space and plaza green space.

4. Discussion

4.1. The Difference in Residents’ Preference for UGS and Their Social–Ecological Services

Due to the great heterogeneity of UGS between regions, researchers pay different attention to their types. For example, research in Lithuania divided green space types into urban parks, urban gardens, urban green squares, and urban greeneries [18]; a study of twelve American cities divided green space types into parks, playgrounds, golf courses, country clubs, zoos, and cemeteries [45]. Most UGS types including the classification we use are divided on the basis of function and area, proving that the results of our study can be disseminated worldwide. Among the green space types, as protected green spaces are mostly located in dangerous areas (i.e., railroads, expressways) and are difficult for residents to approach [46], the questionnaire in this study did not take the protected green spaces into account. However, the essential role of protected green spaces in protecting the personal safety of residents cannot be ignored. In the event of the COVID-19 pandemic, the sanitary isolation functions of protected green spaces have been performing a prominent role [47,48]. Therefore, adequate attention should be paid to protected green space in future studies, especially in the post-COVID-19 epidemic era.
Of the four green space types mentioned in the survey, attached green space, which is the closest and most convenient to residents according to the result, was most preferred by urban residents. Therefore, attached green space is the type that future green space planning and construction should focus on. Beautifying the city and aesthetic appreciation are considered important ecological services and social services by the residents. The findings revealed that aesthetics-related ES are most preferred by urban residents among the ES provided by UGS. Similar results were also confirmed by Bo Chen in Hangzhou and P. James in Europe [49,50]. Consequently, the aesthetic value of UGS should be paid more attention to meet the demands of residents in future UGS planning. Enhancing the diversity of landscapes in UGS has been considered to be an effective way to promote the aesthetics of UGS [51], such as increasing plant diversity and water bodies cleaning, which are shown to increase residents’ satisfaction with the aesthetics of UGS [6].
In terms of residents’ preference for social services, physical and mental relaxation was favored by inhabitants the most. The results also verified the fact that UGS can be beneficial to the physical and mental health of residents [52,53]. During the period of COVID-19, people’s mental health has been greatly affected, and the positive role of UGS in people’s mental health cannot be ignored [54,55]. The preferred outdoor recreation and exercise services elucidate the importance of fitness equipment in UGS. Further, it is also worth noting residents’ preference for natural education. This shows that residents’ concern about the educational function of nature is on the rise [56]. Residents’ attention to climate regulation, noise pollution reduction, natural disaster mitigation, and biodiversity conservation can also support this view. Then, sites and facilities related to nature also need to be addressed in current and future UGS planning. The results also showed that the services residents most want to contribute are close to the services they most strongly preferred. Therefore, policymakers should fully utilize the initiative of residents and get them involved in the daily maintenance of UGS.

4.2. Influencing Factors of Residents’ Preference for UGS

One of the largest influencing factors of residents’ preference for UGS is “age”. Therefore, it is of great significance to adjust the management of UGS according to the age of residents based on China’s population aging phenomenon. Preference for UGS in the 40–59 age group should be emphasized in future UGS planning as this group is aging in the following decade. With the increasing aging of China’s population, socio-environmental justice for the elderly is being taken into much more consideration in UGS planning and construction [57]. Meanwhile, the findings of this study showed that the existing UGS are incapable to meet the demands of the over or equal to 60 and 40–59 age groups. The parks and plazas are not built-in sufficient numbers and are not evenly distributed [58]. The attached green space in the city is available to satisfy the needs of the aged 40–59 group. Although urban residents aged 40–59 do not have a high demand for regional green space, their demands are still unmet. In conclusion, great effort should be made to build park and plaza green space to better meet the needs of the elderly in the present and future. Moreover, it is necessary to construct regional green space, and the existing level of construction of attached green space ought to be maintained. In addition, facilities for the elderly in UGS are also indispensable; for example, the green belt setting between roads and the sidewalk cannot only green the urban space but also help improve road safety for pedestrians, especially elderly pedestrians [46]. In a nutshell, there is much work to be completed in planning and construction of UGS by policymakers and implementers.
Another major influencing factor of residents’ preference for UGS is “sufficient time”. China’s large population leads to a variety of stresses, especially in cities, including housing pressure and work pressure, so there is not sufficient time to travel to distant UGS in time after work [59]. The results also demonstrated that attached green space is the least susceptible type of UGS. Despite this, “income” has a significant impact on residents’ access to attached green space (Figure 5). Income status directly affects construction of attached green spaces in the vicinity of residential areas [34,60]. The income-driven disparity also suffers from a deeper lack of environmental justice and unequally distributed UGS [61,62]. Most of the attached green space is private and accessible to residents of the community. This phenomenon is particularly conspicuous during the COVID-19 pandemic period, which is not conducive to environmental justice [35,63]. Moreover, the interests of low-income groups and marginalized groups in future UGS planning, especially regarding attached green spaces, are to be a concern [64]. Methodologies improving the environmental justice of UGS proposed by scholars could offer a reference [65]. For example, non-governmental organizations play a huge role in achieving environmental justice, and this fact has been proven in California [58]. In addition to age, another factor that has less of an effect on attached green space is “physical condition”, and it only affects attached green space. The reason may be that residents in poor physical condition may be more likely to choose the attached green space that is closest to their home for activities, while the other three types farther away are not included in the activity range [66].
Finally, although the impact factor of COVID-19 on people’s preferences has not been as dramatic as we thought, its influence cannot be ignored. The results showed that there was no significant correlation between COVID-19 and residents’ preference for different types of UGS. This is probably because of the particularity of the sampling time. During the period when the questionnaire was collected, the COVID-19 pandemic was not serious in China, and there was no large-scale lockdown policy that would affect residents’ access to UGS [67]. The COVID-19 epidemic and related lockdown policies have a huge impact on people’s travel [68]. However, studies have found that residents prefer to go to UGS rather than recreational places and workplaces during the COVID-19 pandemic [69,70]. The impact of COVID-19 on residents’ travel to UGS depends on the intensity of the lockdown. Therefore, it is still crucial to strengthen construction of UGS during the COVID-19 pandemic [69].

4.3. Prospects and Future Research

Limitations exist in this research. First, the questionnaire had shortcomings at the collection stage. For instance, the sample was not evenly distributed, with significantly more female respondents than male respondents. Due to COVID-19, the questionnaire was distributed online. Although imbalance in online distribution was avoided as much as possible, there were still some limitations, such as the problem of spatial and age groups disequilibrium. Although such deviations are inevitable in questionnaires and ES studies [39], we expect to improve them in future studies.
Second, it was found that the understanding of the specific ecological and social services provided by UGS among respondents is not comprehensive, resulting in a high degree of similarity in some questionnaire results. Therefore, efforts should be made to disseminate knowledge and applications related to UGS and services to the public, helping residents to better understand the meaning of UGS. The popularization of ES is important to help residents better understand the meaning of UGS. In addition, due to the differentiation of environmental factors in different regions and different scales, there will be spatial differences in residents’ preferences for UGS types and their ES [71]. Spatialized preferences and social values can be evaluated in combination with models such as SolVES in further study, and a comparative study of different scales is also indispensable [72,73]. Additionally, it is also an important research direction in the future to use a variety of statistical analysis methods to study the preferences reflected by data samples from different angles and to use more refined scales to study the interior of UGS.

5. Conclusions

This paper constructed a framework to study urban residents’ preferences and driver factors for both considering the UGS types and their ecological–social services by using a web-based questionnaire. It effectively compensated for the lack of a classification of ES in UGS and UGS definitions. The results indicate that attached green space is most preferred by residents, and the two factors, income and physical condition, had an impact on entering attached green space for the residents. Park green space and regional green space are influenced by five factors, while plaza green space is affected by four factors. Age and sufficient time are the two factors that have the strongest impact on residents’ access to UGS. The most preferred ecological service and social services are beautifying the city and physical and mental relaxation, respectively. The services influenced by factors are less pronounced than the UGS types influenced by factors. “Season” has the most significant impact on ecological–social services.
Practical and useful policy recommendations are also proposed for future UGS planning and construction based on our study to contribute to offering a better living environment for urban residents. Building attached green space and enhancing UGS’ aesthetics-related ES are crucial in further actions. Additionally, as age is one of the most influential factors in residents’ visits to UGS, the demands of the elderly for UGS should be given priority. For the aging population, building more park green spaces and plaza green spaces is of vital importance. In addition to maintaining existing attached green spaces, it is also necessary to promote construction of regional green space. Future studies should continue to strengthen the spatial multi-scale UGS research and increase the average distribution of questionnaire samples as much as possible.

Author Contributions

Conceptualization, W.Z. and L.Z.; methodology, W.Z. and L.Z.; visualization, W.Z. and L.Z.; formal analysis, W.Z.; writing—original draft, W.Z.; Writing—review and editing, L.Z., X.L., P.W., Z.W., L.P., L.J. and H.W.; supervision, L.Z.; funding acquisition, L.Z., L.J. and H.W. All authors have read and agreed to the published version of the manuscript.

Funding

This research was supported by the National Natural Science Foundation of China (41871187) and the Natural Science Basic Research Plan in Shaanxi Province of China (2020JQ415).

Data Availability Statement

The data that support the findings of this study are available from the first author upon reasonable request.

Conflicts of Interest

No potential conflict of interest was reported by the authors.

Appendix A

The specific questionnaire is provided: A questionnaire about urban residents’ preference for green space use.
Q1 Your gender:
  • Male
  • Female
Q2 Your birth year:
Q3 Your Marital Status:
  • Married
  • Unmarried
Q4 Is there a child in your home who is not yet capable of moving around on their own?
  • Yes
  • No
Q5 Your current occupation:
  • Professionals (such as teachers, accountants, lawyers, architects, medical professionals, journalists, etc.)
  • Service workers
  • Freelancers
  • Workers
  • Company employees
  • Institutions, civil servants, government employees
  • Full-time students
  • Businessmen, employers, small businessmen, self-employed
  • Farmers, fishermen, herdsmen, etc.
  • Unemployed, unemployed
  • Other _________________
Q6 What is your highest level of education (including currently enrolled)?
  • Primary School and below
  • Junior High School
  • Senior High school/Technical school
  • College degree
  • Bachelor’s degree
  • Master’s degree and above
Q7 City and region of your province of residence:
Q8 What is your reason for living in your current place of residence?
  • Is a permanent resident of your current place of residence
  • Admitted talent
  • Relatives
  • Have a relatively stable occupation or source of living (including job transfer, study, graduate employment, etc.)
  • Residents with legal fixed residence
  • Other _________________
Q9 What is your approximate monthly disposable income?
  • Less than 500 RMB
  • 500–1499 RMB
  • 1500–1999RMB
  • 2000–3499 RMB
  • 3500–6999 RMB
  • More than 7000 RMB
Q10 What is the magnitude of each of the following factors influencing your visit to an urban green space?
  • Basically no impact  Little impact  Average impact  High impact  Very high impact
  • COVID-19 ○  ○  ○  ○  ○
  • Accessibility (e.g., entrance fees, reservations required, etc.)  ○  ○   ○  ○  ○
  • Reachability (e.g., rugged roads, long distances, etc.)   ○  ○  ○  ○  ○
  • Income  ○  ○  ○  ○  ○
  • Season  ○  ○    ○  ○  ○
  • Weather  ○  ○  ○  ○  ○
  • Age  ○  ○  ○  ○  ○
  • Physical condition   ○  ○  ○  ○  ○
  • Sufficient time  ○  ○  ○  ○  ○
  • Staying with your child   ○  ○  ○  ○  ○
  • Please read the description and answer the following questions:
  • Park green space:
  • Park green space is open to the public, with leisure and recreation as the main function and both ecological and social functions. It includes various comprehensive parks, amusement parks, zoos, and other special parks.
Q11 What is the actual distance of the closest park green space to your residential area and what is the ideal distance of the most reasonable park green space to your residential area?
  • Within 300 m   300 m–2000 m  2 km–5 km  5 km–10 km   Over 10 km
  • Actual distance  ○  ○  ○  ○  ○
  • Ideal distance  ○  ○  ○  ○  ○
Q12 How easy it is for you to get to the park green space?
  • Very inconvenient  Inconvenient   General  Convenient  Very convenient
  • Level of convenience  ○  ○  ○  ○  ○
Q13 How many times do you actually go to the park green space and how many times do you ideally want to go to the park green space?
  • Less than once a month   Once a month  Once every two weeks 1–3 times per week  4–6 times per week   Everyday
  • Actual frequency   ○  ○  ○  ○  ○  ○
  • Ideal frequency   ○  ○  ○  ○  ○  ○
Q14 How well do the park green spaces in your city meet your ecological demands, such as protecting the ecological environment, and the social demands of the residents themselves?
  • Completely unsatisfiable   Mostly unsatisfiable  Basically satisfied   Mostly satisfied  Completely satisfied
  • Ecological demands   ○  ○  ○  ○  ○
  • Social demands  ○  ○  ○  ○  ○
  • Plaza green space:
  • An urban public activity site with the functions of recreation, memorial, assembly, and shelter. The main difference with the park green space is that it is mainly impervious surface.
Q15 What is the actual distance of the closest plaza green space to your residential area and what is the ideal distance of the most reasonable plaza green space to your residential area?
  • Within 300 m   300 m–2000 m  2 km–5 km  5 km–10 km    Over 10 km
  • Actual distance  ○  ○  ○  ○  ○
  • Ideal distance   ○  ○  ○  ○  ○
Q16 How easy it is for you to get to the plaza green space?
  • Very inconvenient   Inconvenient  General   Convenient Very convenient
  • Level of convenience  ○  ○  ○  ○  ○
Q17 How many times do you actually go to the plaza green space and how many times do you ideally want to go to the plaza green space?
  • Less than once a month    Once a month   Once every two weeks 1–3 times per week  4–6 times per week  Everyday
  • Actual frequency   ○  ○  ○  ○  ○  ○
  • Ideal frequency ○  ○  ○  ○  ○  ○
Q18 How well do the plaza green spaces in your city meet your ecological demands, such as protecting the ecological environment, and the social demands of the residents themselves?
  • Completely unsatisfiable   Mostly unsatisfiable  Basically satisfied   Mostly satisfied  Completely satisfied
  • Ecological demands   ○  ○  ○  ○  ○
  • Social demands  ○  ○  ○  ○  ○
  • Attached green space within a subdivision or work unit:
  • The attached green space is attached to various types of urban construction land. Including residential land (green space in subdivisions, green space in schools), etc.
Q19 What is the actual distance of the closest attached green spaces within a subdivision or work unit to your residential area and what is the ideal distance of the most reasonable attached green spaces within a subdivision or work unit to your residential area?
  • Within 300 m  300 m–2000 m   2 km–5 km  5 km–10 km    Over 10 km
  • Actual distance   ○  ○  ○  ○  ○
  • Ideal distance   ○  ○  ○  ○  ○
Q20 How easy it is for you to get to the attached green spaces within a subdivision or work unit?
  • Very inconvenient  Inconvenient   General  Convenient   Very convenient
  • Level of convenience  ○  ○  ○  ○  ○
Q21 How many times do you actually go to the attached green spaces within a subdivision or work unit and how many times do you ideally want to go to the attached green spaces within a subdivision or work unit?
  • Less than once a month   Once a month   Once every two weeks 1–3 times per week   4–6 times per week   Everyday
  • Actual frequency   ○  ○  ○  ○  ○  ○
  • Ideal frequency   ○  ○  ○  ○  ○  ○
Q22 How well do the attached green spaces within a subdivision or work unit in your city meet your ecological demands, such as protecting the ecological environment, and the social demands of the residents themselves?
  • Completely unsatisfiable   Mostly unsatisfiable  Basically satisfied  Mostly satisfied  Completely satisfied
  • Ecological demands  ○  ○  ○  ○  ○
  • Social demands  ○  ○  ○  ○  ○
  • Large-scale regional green space:
  • Located outside the urban construction land (usually on the outskirts of the city) with urban and rural ecological environment and natural resources and cultural resources protection production and other functions of the green space. For example, scenic spots, forest parks, wetland parks, etc.
Q23 What is the actual distance of the closest large-scale regional green spaces to your residential area and what is the ideal distance of the most reasonable large-scale regional green spaces to your residential area?
  • Within 300 m   300 m–2000 m   2 km–5 km  5 km–10 km   Over 10 km
  • Actual distance  ○  ○  ○  ○  ○
  • Ideal distance  ○  ○  ○  ○  ○
Q24 How easy it is for you to get to the large-scale regional green spaces?
  • Very inconvenient   Inconvenient  General  Convenient   Very convenient
  • Level of convenience  ○  ○  ○  ○  ○
Q25 How many times do you actually go to the large-scale regional green spaces and how many times do you ideally want to go to the large-scale regional green spaces?
  • Less than once a month   Once a month  Once every two weeks 1–3 times per week  4–6 times per week   Everyday
  • Actual frequency   ○  ○  ○  ○  ○  ○
  • Ideal frequency   ○  ○  ○  ○  ○  ○
Q26 How well do the large-scale regional green spaces in your city meet your ecological demands, such as protecting the ecological environment, and the social demands of the residents themselves?
  • Completely unsatisfiable  Mostly unsatisfiable  Basically satisfied  Mostly satisfied  Completely satisfied
  • Ecological demands  ○  ○  ○  ○  ○
  • Social demands  ○  ○  ○  ○  ○
Q27 The followings are the ecological functions that urban green spaces can provide, please evaluate their importance.
  • Very unimportant   Unimportant    General   Important  Very important
  • Climate regulation  ○  ○  ○  ○  ○
  • Noise pollution reduction  ○  ○  ○  ○  ○
  • Biodiversity conservation  ○  ○  ○  ○  ○
  • Obtaining flora and fauna  ○  ○  ○  ○  ○
  • Beautifying the city  ○  ○  ○  ○  ○
  • Natural disaster mitigation  ○  ○  ○  ○  ○
Q28 The followings are the social functions that urban green spaces can provide, please evaluate their importance.
  • Very unimportant  Unimportant   General   Important    Very important
  • Outdoor recreation  ○  ○  ○  ○  ○
  • Exercise  ○  ○  ○  ○  ○
  • Relaxation  ○  ○  ○  ○  ○
  • Spending time with family  ○  ○  ○  ○  ○
  • Pet Skating   ○  ○  ○  ○  ○
  • Social gathering  ○  ○  ○  ○  ○
  • Natural education  ○  ○  ○  ○  ○
  • Aesthetic appreciation  ○  ○  ○  ○  ○
Q29 Do you want to contribute your efforts to protect urban green space?
  • Yes
  • No (Please skip to question 33)
Q30 If you could contribute to the conservation of urban green spaces to ensure that they continue to provide the ecological and social functions listed in the table above, which of the following would you prefer?
  • Financial donation
  • Additional taxation
  • Provide time (participate in voluntary work)
  • Conduct advocacy or activities
  • Other _________________*
Q31 Which ecological functions are you willing to use your contribution to support? Please select the functions that you would most like to support?
  • Climate regulation
  • Noise pollution reduction
  • Biodiversity conservation
  • Obtaining flora and fauna
  • Beautifying the city
  • Natural disaster mitigation
Q32 Which social functions are you willing to use your contribution to support? Please select the functions that you would most like to support?
  • Outdoor recreation
  • Exercise
  • Relaxation
  • Spending time with family
  • Pet Skating
  • Social gathering
  • Natural education
  • Aesthetic appreciation
Q33 Suppose your city intends to make more efforts to build urban green spaces for the benefit of the people, please rank the four types of urban green spaces in order of your idea from most to least investment? [For the ranking question, please fill in the numbers in the brackets] *
[ ]
Park green space
[ ]
Plaza green space
[ ]
Attached green space within a subdivision or work unit
[ ]
Large-scale regional green space
The questionnaire has ended, thank you for your support of our research project, and have a nice life!

References

  1. Chen, M.; Liu, W.; Tao, X. Evolution and assessment on China’s urbanization 1960–2010: Under-urbanization or over-urbanization? Habitat Int. 2013, 38, 25–33. [Google Scholar] [CrossRef]
  2. Chen, M.; Liu, W.; Lu, D. Challenges and the way forward in China’s new-type urbanization. Land Use Policy 2016, 55, 334–339. [Google Scholar] [CrossRef]
  3. Carrus, G.; Scopelliti, M.; Lafortezza, R.; Colangelo, G.; Ferrini, F.; Salbitano, F.; Agrimi, M.; Portoghesi, L.; Semenzato, P.; Sanesi, G. Go greener, feel better? The positive effects of biodiversity on the well-being of individuals visiting urban and peri-urban green areas. Landsc. Urban Plan. 2015, 134, 221–228. [Google Scholar] [CrossRef]
  4. White, M.P.; Alcock, I.; Grellier, J.; Wheeler, B.W.; Hartig, T.; Warber, S.L.; Bone, A.; Depledge, M.H.; Fleming, L.E. Spending at least 120 minutes a week in nature is associated with good health and wellbeing. Sci. Rep. 2019, 9, 7730. [Google Scholar] [CrossRef] [Green Version]
  5. Sadeghi, A.R.; Jangjoo, S. Women’s preferences and urban space: Relationship between built environment and women’s presence in urban public spaces in Iran. Cities 2022, 126, 103694. [Google Scholar] [CrossRef]
  6. Wang, R.; Zhao, J.; Meitner, M.J.; Hu, Y.; Xu, X. Characteristics of urban green spaces in relation to aesthetic preference and stress recovery. Urban For. Urban Green. 2019, 41, 6–13. [Google Scholar] [CrossRef]
  7. Teixeira, C.P.; Fernandes, C.O.; Ryan, R.; Ahern, J. Attitudes and preferences towards plants in urban green spaces: Implications for the design and management of Novel Urban Ecosystems. J. Environ. Manag. 2022, 314, 115103. [Google Scholar] [CrossRef] [PubMed]
  8. MEA (Millennium Ecosystem Assessment). Ecosystems and Human Well-Being: Synthesis; Island Press: Washington, DC, USA, 2005. [Google Scholar]
  9. Peng, L.; Zhang, L.; Li, X.; Wang, Z.; Wang, H.; Jiao, L. Spatial expansion effects on urban ecosystem services supply-demand mismatching in Guanzhong Plain Urban Agglomeration of China. J. Geogr. Sci. 2022, 32, 806–828. [Google Scholar] [CrossRef]
  10. Cortinovis, C.; Geneletti, D. Ecosystem services in urban plans: What is there, and what is still needed for better decisions. Land Use Policy 2018, 70, 298–312. [Google Scholar] [CrossRef]
  11. Veerkamp, C.J.; Schipper, A.M.; Hedlund, K.; Lazarova, T.; Nordin, A.; Hanson, H.I. A review of studies assessing ecosystem services provided by urban green and blue infrastructure. Ecosyst. Serv. 2021, 52, 101367. [Google Scholar] [CrossRef]
  12. Liu, O.Y.; Russo, A. Assessing the contribution of urban green spaces in green infrastructure strategy planning for urban ecosystem conditions and services. Sustain. Cities Soc. 2021, 68, 102772. [Google Scholar] [CrossRef]
  13. Li, X.; Zhang, L.; O’Connor, P.J.; Yan, J.; Wang, B.; Liu, D.L.; Wang, P.; Wang, Z.; Wan, L.; Li, Y. Ecosystem Services under Climate Change Impact Water Infrastructure in a Highly Forested Basin. Water 2020, 12, 2825. [Google Scholar] [CrossRef]
  14. Burkhard, B.; Kroll, F.; Nedkov, S.; Müller, F. Mapping ecosystem service supply, demand and budgets. Ecol. Indic. 2012, 21, 17–29. [Google Scholar] [CrossRef]
  15. Wolff, S.; Schulp, C.J.E.; Verburg, P.H. Mapping ecosystem services demand: A review of current research and future perspectives. Ecol. Indic. 2015, 55, 159–171. [Google Scholar] [CrossRef]
  16. Uehara, T.; Hidaka, T.; Tsuge, T.; Sakurai, R.; Cordier, M. An adaptive social-ecological system management matrix for guiding ecosystem service improvements. Ecosyst. Serv. 2021, 50, 101312. [Google Scholar] [CrossRef]
  17. Fischer, L.K.; Honold, J.; Botzat, A.; Brinkmeyer, D.; Cvejić, R.; Delshammar, T.; Elands, B.; Haase, D.; Kabisch, N.; Karle, S.J.; et al. Recreational ecosystem services in European cities: Sociocultural and geographical contexts matter for park use. Ecosyst. Serv. 2018, 31, 455–467. [Google Scholar] [CrossRef]
  18. Misiune, I.; Julian, J.P.; Veteikis, D. Pull and push factors for use of urban green spaces and priorities for their ecosystem services: Case study of Vilnius, Lithuania. Urban For. Urban Green. 2021, 58, 126899. [Google Scholar] [CrossRef]
  19. Wang, J.; Chen, S.; Yao, S.M. New Thought of the Research on the Function of Green Space in Urban Planning. Geogr. Geo-Inf. Sci. 2004, 20, 99–103. [Google Scholar]
  20. Gui, K.P.; Xu, J.G.; Zhang, X. Optimization of urban green space spatial arrangement based on supply-demand analysis: A case study in Nanjing City, China. J. Appl. Ecol. 2013, 24, 1215–1223. [Google Scholar] [CrossRef]
  21. Lepczyk, C.A.; Aronson, M.F.J.; Evans, K.L.; Goddard, M.A.; Lerman, S.B.; MacIvor, J.S. Biodiversity in the City: Fundamental Questions for Understanding the Ecology of Urban Green Spaces for Biodiversity Conservation. BioScience 2017, 67, 799–807. [Google Scholar] [CrossRef] [Green Version]
  22. Li, X.; Lei, S.; Feng, J.; Wen, Y.L. Assessing the value of cultural ecosystem services in urban green space of Beijing. J. Arid Land Resour. Environ. 2019, 33, 33–39. [Google Scholar]
  23. Jaung, W.; Carrasco, L.R.; Shaikh, S.F.E.A.; Tan, P.Y.; Richards, D.R. Temperature and air pollution reductions by urban green spaces are highly valued in a tropical city-state. Urban For. Urban Green. 2020, 55, 126827. [Google Scholar] [CrossRef]
  24. Richardson, E.A.; Pearce, J.; Mitchell, R.; Kingham, S. Role of physical activity in the relationship between urban green space and health. Public Health 2013, 127, 318–324. [Google Scholar] [CrossRef] [PubMed] [Green Version]
  25. Wolsink, M. ‘Sustainable City’ requires ‘recognition’—The example of environmental education under pressure from the compact city. Land Use Policy 2016, 52, 174–180. [Google Scholar] [CrossRef]
  26. Dang, H.; Li, J. The integration of urban streetscapes provides the possibility to fully quantify the ecological landscape of urban green spaces: A case study of Xi’an city. Ecol. Indic. 2021, 133, 108388. [Google Scholar] [CrossRef]
  27. Ha, J.; Kim, H.J.; With, K.A. Urban green space alone is not enough: A landscape analysis linking the spatial distribution of urban green space to mental health in the city of Chicago. Landsc. Urban Plan. 2022, 218, 104309. [Google Scholar] [CrossRef]
  28. Ahn, J.J.; Kim, Y.; Lucio, J.; Corley, E.A.; Bentley, M. Green spaces and heterogeneous social groups in the U.S. Urban For. Urban Green. 2020, 49, 126637. [Google Scholar] [CrossRef]
  29. Urban Green Space Classification Standards. Available online: www.mohurd.gov.cn (accessed on 1 March 2022).
  30. Urban Green Space Planning Standards. Available online: www.mohurd.gov.cn (accessed on 1 March 2022).
  31. Cho, D.-c.; Shin, D.B. Development of general purpose model for park and green space management system in South Korea. Spat. Inf. Res. 2017, 25, 593–604. [Google Scholar] [CrossRef]
  32. Pearsall, H.; Eller, J.K. Locating the green space paradox: A study of gentrification and public green space accessibility in Philadelphia, Pennsylvania. Landsc. Urban Plan. 2020, 195, 103708. [Google Scholar] [CrossRef]
  33. Oliveira, I.F.; Lion, M.B.; Cardoso, M.Z. A plaza too far: High contrast in butterfly biodiversity patterns between plazas and an urban reserve in Brazil. Landsc. Urban Plan. 2018, 180, 207–216. [Google Scholar] [CrossRef]
  34. Yang, J.; Bao, Y.J.; Jin, C.; Li, X.M.; Li, Y.H. The Impact of Urban Green Space Accessibility on House Prices in Dalian City. Sci. Geogr. Sin. 2018, 38, 1952–1960. [Google Scholar] [CrossRef]
  35. Venter, Z.S.; Barton, D.N.; Gundersen, V.; Figari, H.; Nowell, M. Urban nature in a time of crisis: Recreational use of green space increases during the COVID-19 outbreak in Oslo, Norway. Environ. Res. Lett. 2020, 15, 104075. [Google Scholar] [CrossRef]
  36. Huai, S.; Van de Voorde, T. Which environmental features contribute to positive and negative perceptions of urban parks? A cross-cultural comparison using online reviews and Natural Language Processing methods. Landsc. Urban Plan. 2022, 218, 104307. [Google Scholar] [CrossRef]
  37. Hou, Y.; Qu, Y.; Zhao, Z.; Shen, J.; Wen, Y. Residents’ Spatial Image Perception of Urban Green Space through Cognitive Mapping: The Case of Beijing, China. Forests 2021, 12, 1614. [Google Scholar] [CrossRef]
  38. Wang, P.; Han, L.; Mei, R. An Impact Asymmetry Analysis of Small Urban Green Space Attributes to Enhance Visitor Satisfaction. Int. J. Environ. Res. Public Health 2022, 19, 2922. [Google Scholar] [CrossRef]
  39. Zhang, K.; Tang, X.; Zhao, Y.; Huang, B.; Huang, L.; Liu, M.; Luo, E.; Li, Y.; Jiang, T.; Zhang, L.; et al. Differing perceptions of the youth and the elderly regarding cultural ecosystem services in urban parks: An exploration of the tour experience. Sci. Total Environ. 2022, 821, 153388. [Google Scholar] [CrossRef]
  40. Wang, X.; Gu, Z.L.; Mei, H. Tourist Attraction Customer Satisfaction Index Model. Acta Geogr. Sin. 2005, 60, 807–816. [Google Scholar]
  41. Li, H.; Browning, M.; Cao, Y.; Zhang, G. From Childhood Residential Green space to Adult Mental Wellbeing: A Pathway Analysis among Chinese Adults. Behav. Sci. 2022, 12, 84. [Google Scholar] [CrossRef]
  42. Kabisch, N.; Haase, D. Green spaces of European cities revisited for 1990–2006. Landsc. Urban Plan. 2013, 110, 113–122. [Google Scholar] [CrossRef]
  43. Castán Broto, V.; Robin, E. Climate urbanism as critical urban theory. Urban Geogr. 2020, 42, 715–720. [Google Scholar] [CrossRef]
  44. Ahmad, M.; Khan, Z.; Anser, M.K.; Jabeen, G. Do rural-urban migration and industrial agglomeration mitigate the environmental degradation across China’s regional development levels? Sustain. Prod. Consum. 2021, 27, 679–697. [Google Scholar] [CrossRef]
  45. Jimenez, M.P.; Wellenius, G.A.; James, P.; Subramanian, S.V.; Buka, S.; Eaton, C.; Gilman, S.E.; Loucks, E.B. Associations of types of green space across the life-course with blood pressure and body mass index. Environ. Res. 2020, 185, 109411. [Google Scholar] [CrossRef] [PubMed]
  46. Lv, M.; Wang, N.; Yao, S.; Wu, J.; Fang, L. Towards Healthy Aging: Influence of the Built Environment on Elderly Pedestrian Safety at the Micro-Level. Int. J. Environ. Res. Public Health 2021, 18, 9534. [Google Scholar] [CrossRef]
  47. Okech, E.A.; Nyadera, I.N. Urban green spaces in the wake of COVID-19 pandemic: Reflections from Nairobi, Kenya. GeoJournal 2022, 87, 4931–4945. [Google Scholar] [CrossRef] [PubMed]
  48. Johnson, T.F.; Hordley, L.A.; Greenwell, M.P.; Evans, L.C. Associations between COVID-19 transmission rates, park use, and landscape structure. Sci. Total Environ. 2021, 789, 148123. [Google Scholar] [CrossRef] [PubMed]
  49. Chen, B.; Adimo, O.A.; Bao, Z. Assessment of aesthetic quality and multiple functions of urban green space from the users’ perspective: The case of Hangzhou Flower Garden, China. Landsc. Urban Plan. 2009, 93, 76–82. [Google Scholar] [CrossRef]
  50. James, P.; Tzoulas, K.; Adams, M.D.; Barber, A.; Box, J.; Breuste, J.; Elmqvist, T.; Frith, M.; Gordon, C.; Greening, K.L.; et al. Towards an integrated understanding of green space in the European built environment. Urban For. Urban Green. 2009, 8, 65–75. [Google Scholar] [CrossRef]
  51. Ma, B.; Hauer, R.J.; Xu, C. Effects of Design Proportion and Distribution of Color in Urban and Suburban Green Space Planning to Visual Aesthetics Quality. Forests 2020, 11, 278. [Google Scholar] [CrossRef] [Green Version]
  52. Qiao, Y.; Chen, Z.; Chen, Y.; Zheng, T. Deciphering the Link Between Mental Health and Green Space in Shenzhen, China: The Mediating Impact of Residents’ Satisfaction. Front. Public Health 2021, 9, 561809. [Google Scholar] [CrossRef]
  53. Xu, J.; Wang, F.; Chen, L.; Zhang, W. Perceived urban green and residents’ health in Beijing. SSM Popul. Health 2021, 14, 100790. [Google Scholar] [CrossRef]
  54. Faisal, R.A.; Jobe, M.C.; Ahmed, O.; Sharker, T. Mental Health Status, Anxiety, and Depression Levels of Bangladeshi University Students during the COVID-19 Pandemic. Int. J. Ment. Health Addict. 2022, 20, 1500–1515. [Google Scholar] [CrossRef] [PubMed]
  55. Pouso, S.; Borja, A.; Fleming, L.E.; Gomez-Baggethun, E.; White, M.P.; Uyarra, M.C. Contact with blue-green spaces during the COVID-19 pandemic lockdown beneficial for mental health. Sci. Total Environ. 2021, 756, 143984. [Google Scholar] [CrossRef] [PubMed]
  56. Perez-Lopez, R.; Eugenio-Gozalbo, M.; Edgerton, E.; Aragones, J.I. Editorial: Sustainable and Environmentally Concerned Citizens: Garden-Based Learning to Promote the Importance of Physical, Natural, and Social Resources. Front. Psychol. 2021, 12, 703057. [Google Scholar] [CrossRef] [PubMed]
  57. Enssle, F.; Kabisch, N. Urban green spaces for the social interaction, health and well-being of older people—An integrated view of urban ecosystem services and socio-environmental justice. Environ. Sci. Policy 2020, 109, 36–44. [Google Scholar] [CrossRef]
  58. Rigolon, A.; Gibson, S. The role of non-governmental organizations in achieving environmental justice for green and blue spaces. Landsc. Urban Plan. 2021, 205, 103970. [Google Scholar] [CrossRef]
  59. Zhan, D.; Kwan, M.-P.; Zhang, W.; Chen, L.; Dang, Y. The impact of housing pressure on subjective well-being in urban China. Habitat Int. 2022, 127, 102639. [Google Scholar] [CrossRef]
  60. Du, X.; Zhang, X.; Wang, H.; Zhi, X.; Huang, J. Assessing Green Space Potential Accessibility through Urban Artificial Building Data in Nanjing, China. Sustainability 2020, 12, 9935. [Google Scholar] [CrossRef]
  61. Wolch, J.R.; Byrne, J.; Newell, J.P. Urban green space, public health, and environmental justice: The challenge of making cities ‘just green enough’. Landsc. Urban Plan. 2014, 125, 234–244. [Google Scholar] [CrossRef] [Green Version]
  62. Venter, Z.S.; Shackleton, C.M.; Van Staden, F.; Selomane, O.; Masterson, V.A. Green Apartheid: Urban green infrastructure remains unequally distributed across income and race geographies in South Africa. Landsc. Urban Plan. 2020, 203, 103889. [Google Scholar] [CrossRef]
  63. Pipitone, J.M.; Jović, S. Urban green equity and COVID-19: Effects on park use and sense of belonging in New York City. Urban For. Urban Green. 2021, 65, 127338. [Google Scholar] [CrossRef]
  64. Calderón-Argelich, A.; Benetti, S.; Anguelovski, I.; Connolly, J.J.T.; Langemeyer, J.; Baró, F. Tracing and building up environmental justice considerations in the urban ecosystem service literature: A systematic review. Landsc. Urban Plan. 2021, 214, 104130. [Google Scholar] [CrossRef]
  65. Hsu, Y.-Y.; Hawken, S.; Sepasgozar, S.; Lin, Z.-H. Beyond the Backyard: GIS Analysis of Public Green Space Accessibility in Australian Metropolitan Areas. Sustainability 2022, 14, 4694. [Google Scholar] [CrossRef]
  66. Wang, H.; Dai, X.; Wu, J.; Wu, X.; Nie, X. Influence of urban green open space on residents’ physical activity in China. BMC Public Health 2019, 19, 1093. [Google Scholar] [CrossRef] [PubMed]
  67. Burnett, H.; Olsen, J.R.; Nicholls, N.; Mitchell, R. Change in time spent visiting and experiences of green space following restrictions on movement during the COVID-19 pandemic: A nationally representative cross-sectional study of UK adults. BMJ Open 2021, 11, e044067. [Google Scholar] [CrossRef]
  68. Xi, J.; Liu, X.; Wang, J.; Yao, L.; Zhou, C. A Systematic Review of COVID-19 Geographical Research: Machine Learning and Bibliometric Approach. Ann. Am. Assoc. Geogr. 2022, 1–18. [Google Scholar] [CrossRef]
  69. Venter, Z.S.; Barton, D.N.; Gundersen, V.; Figari, H.; Nowell, M.S. Back to nature: Norwegians sustain increased recreational use of urban green space months after the COVID-19 outbreak. Landsc. Urban Plan. 2021, 214, 104175. [Google Scholar] [CrossRef]
  70. Zhai, W.; Liu, M.; Peng, Z.-R. Social distancing and inequality in the United States amid COVID-19 outbreak. Environ. Plan. A Econ. Space 2020, 53, 3–5. [Google Scholar] [CrossRef]
  71. Li, L.; Zheng, Y.; Ma, S. Links of urban green space on environmental satisfaction: A spatial and temporarily varying approach. Environ. Dev. Sustain. 2022. [Google Scholar] [CrossRef]
  72. Sherrouse, B.C.; Semmens, D.J.; Ancona, Z.H. Social Values for Ecosystem Services (SolVES): Open-source spatial modeling of cultural services. Environ. Model. Softw. 2022, 148, 105259. [Google Scholar] [CrossRef]
  73. Zhang, L.; Tan, P.Y. Associations between Urban Green Spaces and Health are Dependent on the Analytical Scale and How Urban Green Spaces are Measured. Int. J. Environ. Res. Public Health 2019, 16, 578. [Google Scholar] [CrossRef]
Figure 1. The overview of residents’ preference for UGS and their ecological and social services.
Land 11 02239 g001
Figure 2. (a) The ideal distance of respondents’ residence from different green space types and (b) the actual distance of respondents’ residence from different green space types. (c) The convenience of residents to the urban green spaces.
Land 11 02239 g002
Figure 3. (a) The importance of the ecological services that respondents believe urban green spaces can provide; (b) the importance of the social services that respondents believe urban green spaces can provide.
Land 11 02239 g003
Figure 4. Numbers of residents willing to contribute to protecting services of urban green space.
Land 11 02239 g004
Figure 5. Final SEM. Solid lines indicate statistically significant pathways; dotted lines indicate statistically non-significant pathways. *, p < 0.05; **, p < 0.01; ***, p < 0.001.
Land 11 02239 g005
Figure 6. (a) The actual and (b) ideal frequencies of urban residents’ visits to different green space types concerning age. The x-axis represents the age of the respondent and the y-axis represents the number of people who chose to go to that frequency for that green space type.
Land 11 02239 g006
Table 1. Demographic information of respondents in the questionnaire (n = 1050).
Demographic InformationTypeFrequency
AgeUnder 1819
18–24452
25–39413
40–59149
Over or equal to 6017
GenderMale381
Female669
Marital statusMarried392
Unmarried658
Have children or notYes392
No658
The highest degree currently enrolledPrimary School and below1
Junior High School12
Senior High school/Technical school62
College degree56
Bachelor’s degree501
Master’s degree and above418
Monthly disposable income (RMB)Less than 50064
500–1499214
1500–1999222
2000–3499150
3500–6999194
Above or equal to 7000206
Table 2. The actual frequency and ideal frequency that respondents go to the four types of urban green spaces. Ratings are as the illustration shows.
The Actual Frequency of Urban Green Space
Park Green SpacePlaza Green SpaceAttached Green SpaceRegional Green Space
Mean value2.512.573.542.11
Standard error of the mean0.0420.0440.0510.041
Median2242
Plural1141
Standard deviation1.3511.4221.6521.339
Variance1.8252.0222.7281.794
The ideal frequency of urban green space
Mean value3.883.554.222.88
Standard error of the mean0.040.0410.0460.038
Median4443
Plural4462
Standard deviation1.2821.3181.4831.246
Variance1.6431.7372.1991.551
Note: 1—less than once a month; 2—once a month; 3—once every two weeks; 4—1–3 times per week; 5—4–6 times per week; 6—every day.
Table 3. Factors affecting the ecological and social services. Orange means no correlation, green means correlation, and, the darker the green, the greater the correlation. *, p < 0.05; **, p < 0.01.
COVID-19AccessibilityReachabilityIncomeSeasonWeatherAgePhysical
Condition
Sufficient
Time
Staying with
Your Child
Climate
regulation
0.072 *0.094 **0.137 **−0.0190.105 **0.156 **−0.0370.0450.098 **0.019
Noise pollution
reduction
0.061 *0.080 **0.126 **0.0250.087 **0.135 **−0.0490.0030.093 **0.008
Biodiversity
conservation
0.078 *0.0490.119 **0.0090.100 **0.148 **−0.0220.0170.078 *0.018
Obtaining flora
and fauna
−0.0060.06−0.0030.177 **0.071 *−0.0580.180 **0.076 *−0.072 *0.111 **
Beautifying
the city
0.092 **0.063 *0.105 **−0.0330.094 **0.159 **−0.0170.030.141 **0.055
Natural disaster
mitigation
0.095 **−0.0180.062 *0.062 *0.117 **0.079 **−0.0080.010.0370.009
Outdoor
recreation
0.061 *0.064 *0.116 **−0.0530.106 **0.185 **−0.0470.0270.129 **0.056
Exercise0.0250.0510.077 *−0.020.091 **0.155 **−0.0310.0310.125 **0.041
Physical and
mental relaxation
0.0550.065 *0.101 **−0.0580.063 *0.162 **−0.098 **−0.010.144 **0.007
Spending time
with family
0.0420.0410.101 **−0.0280.114 **0.154 **−0.037−0.0150.075 *0.079 *
Walking
the dog
0.0010.070 *0.084 **0.124 **0.112 **0.0540.092 **0.077 *0.065 *0.022
Social
gathering
0.0580.060.074 *0.105 **0.138 **0.111 **0.082 **0.072 *0.094 **0.082 **
Natural
education
0.067 *0.0430.109 **0.061 *0.153 **0.135 **0.067 *0.065 *0.111 **0.134 **
Aesthetic
appreciation
0.070 *0.0520.089 **0.0510.114 **0.132 **0.0040.0520.140 **0.065 *
Publisher’s Note: MDPI stays neutral with regard to jurisdictional claims in published maps and institutional affiliations.

