

Comparison of Vegetation Types for Prevention of Erosion and Shallow Slope Failure on Steep Slopes in the Southeastern USA


Abstract
1. Introduction
- Select vegetation types that may provide erosion control and slope stabilization for priority sites and compare them to the current management practice of planting turf grass from seed.
- Determine which species establish and grow well on moderately steep roadside slopes in the Piedmont region of the southeastern USA using experimental plots. This includes vetiver grass, which has not previously been used in this region.
- Compare surface erosion rates from the experimental plots based on whole-plot sediment yield determined from runoff collection and point-based erosion or deposition measured with erosion pins.
- Estimate the contribution of each species to increased slope stability by measuring root biomass and diameter distribution in soil cores collected from the experimental plots.
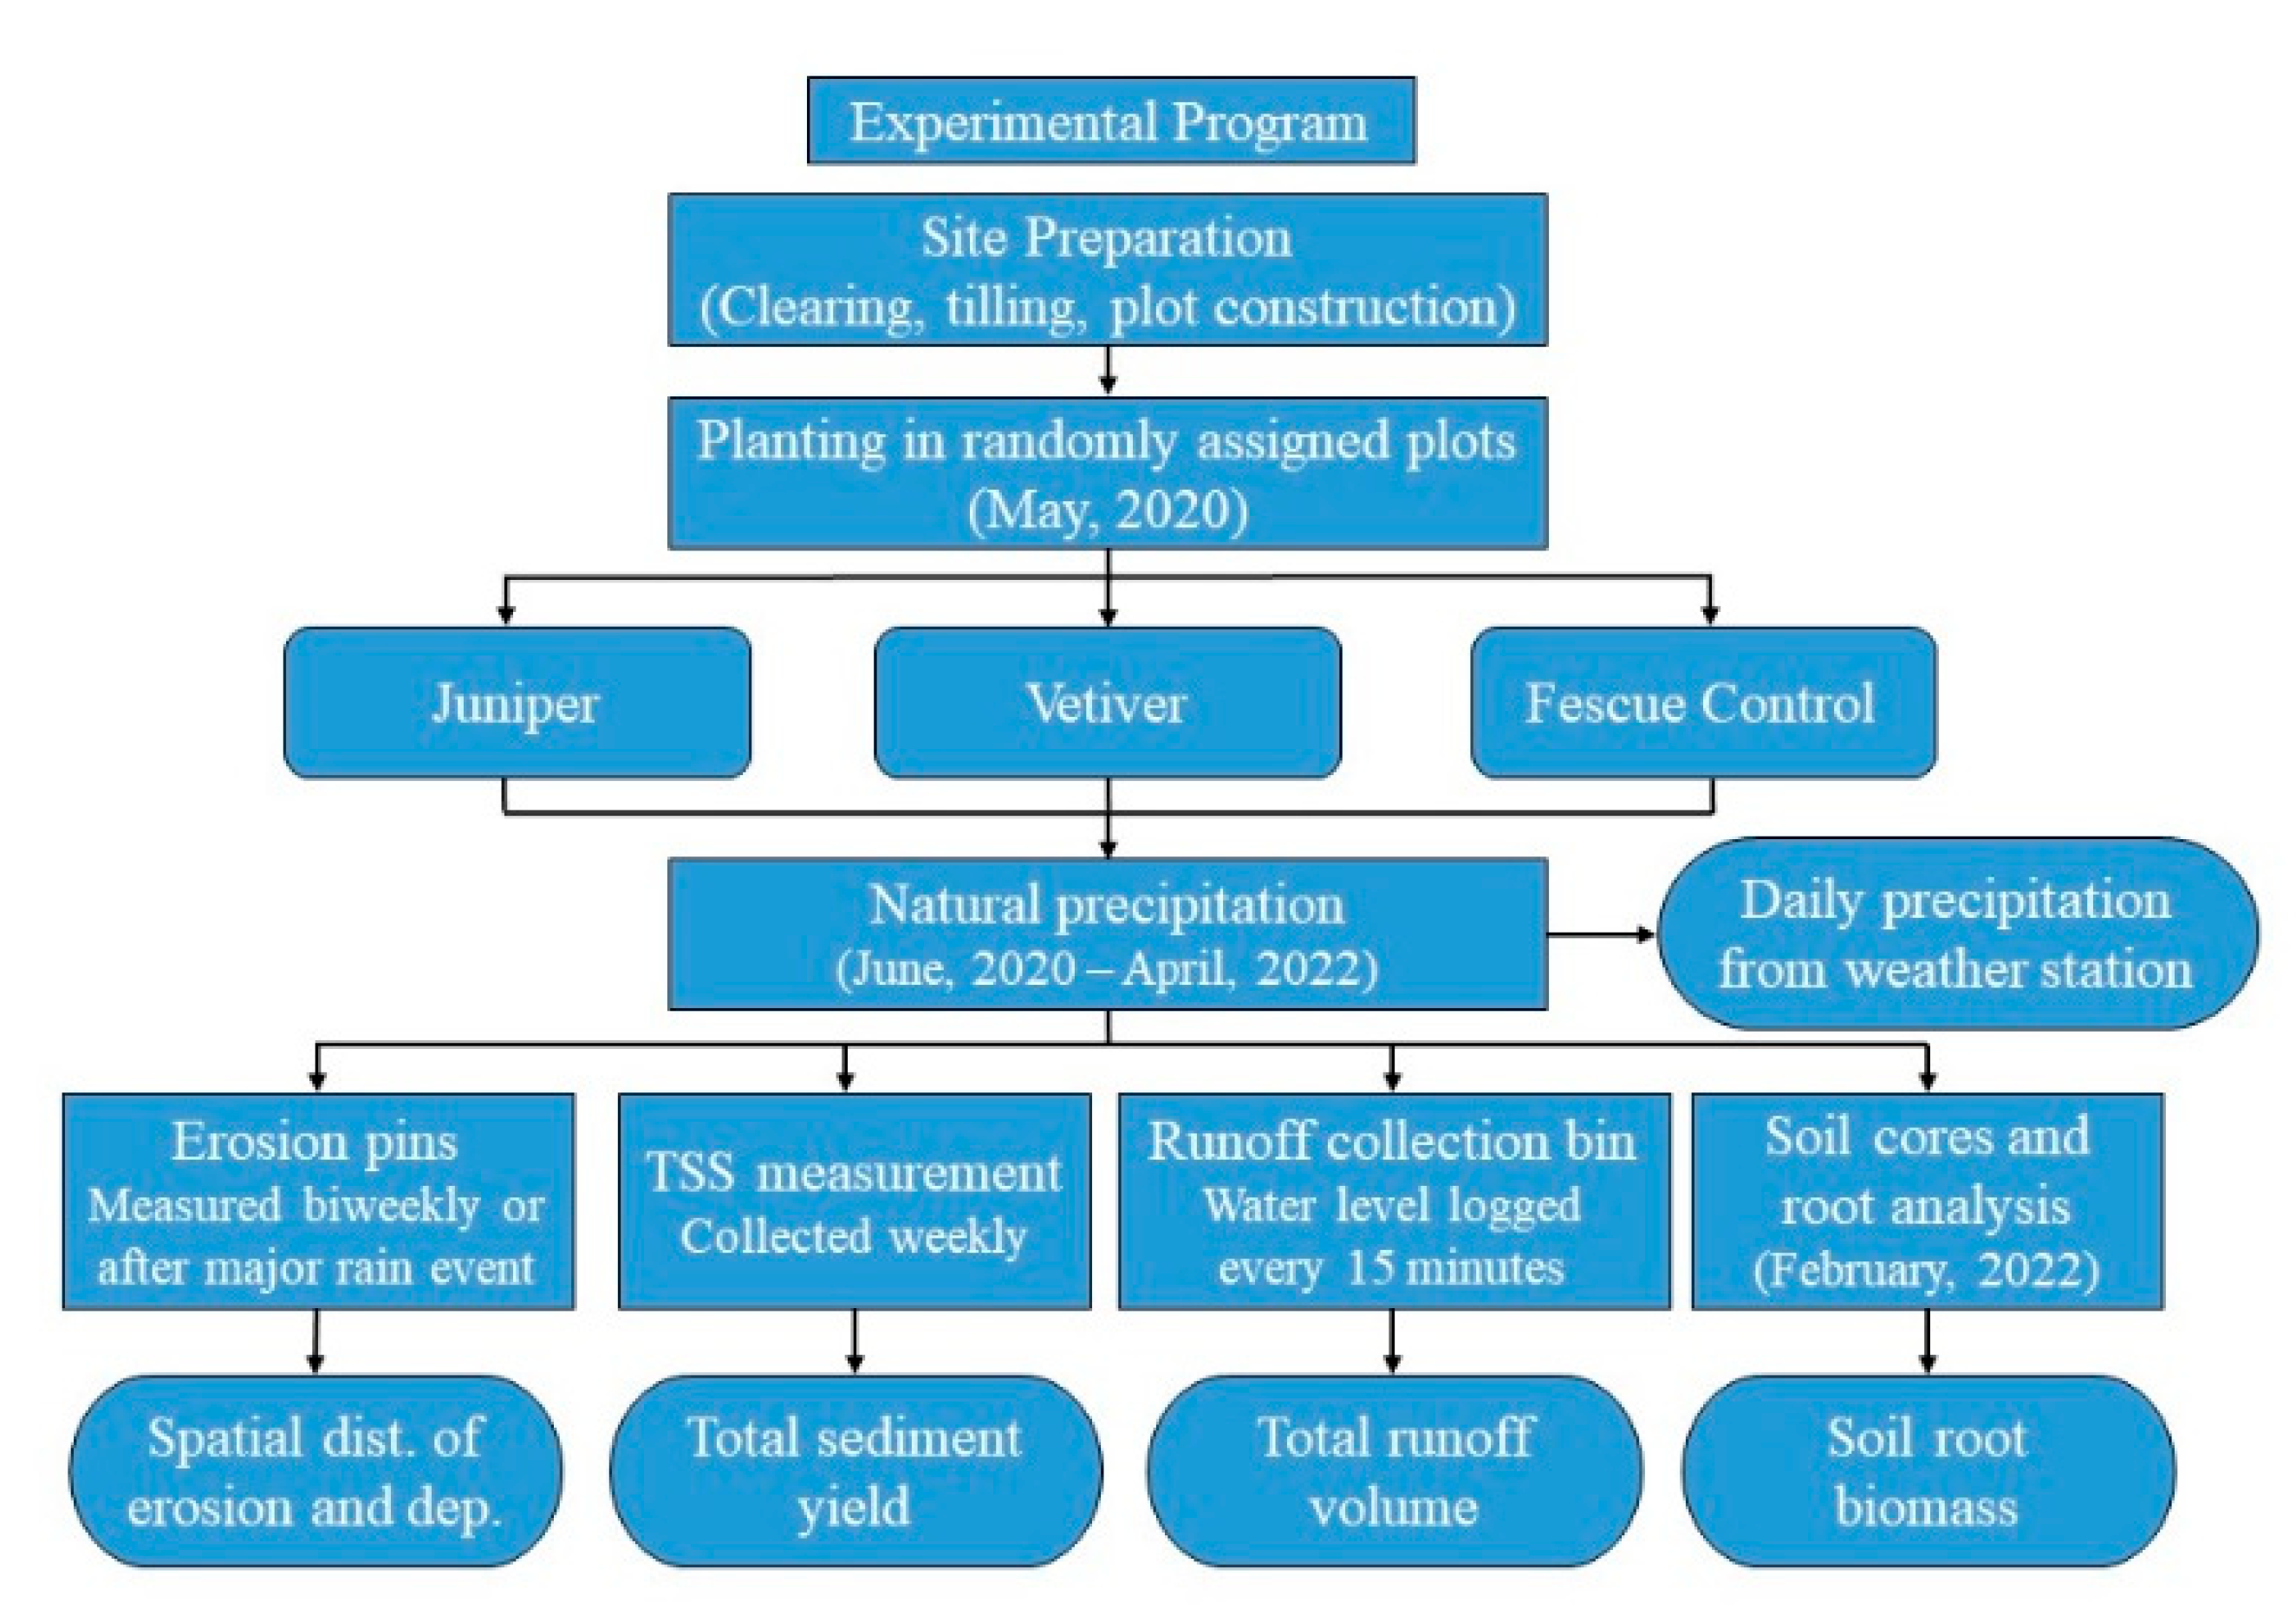
2. Materials and Methods
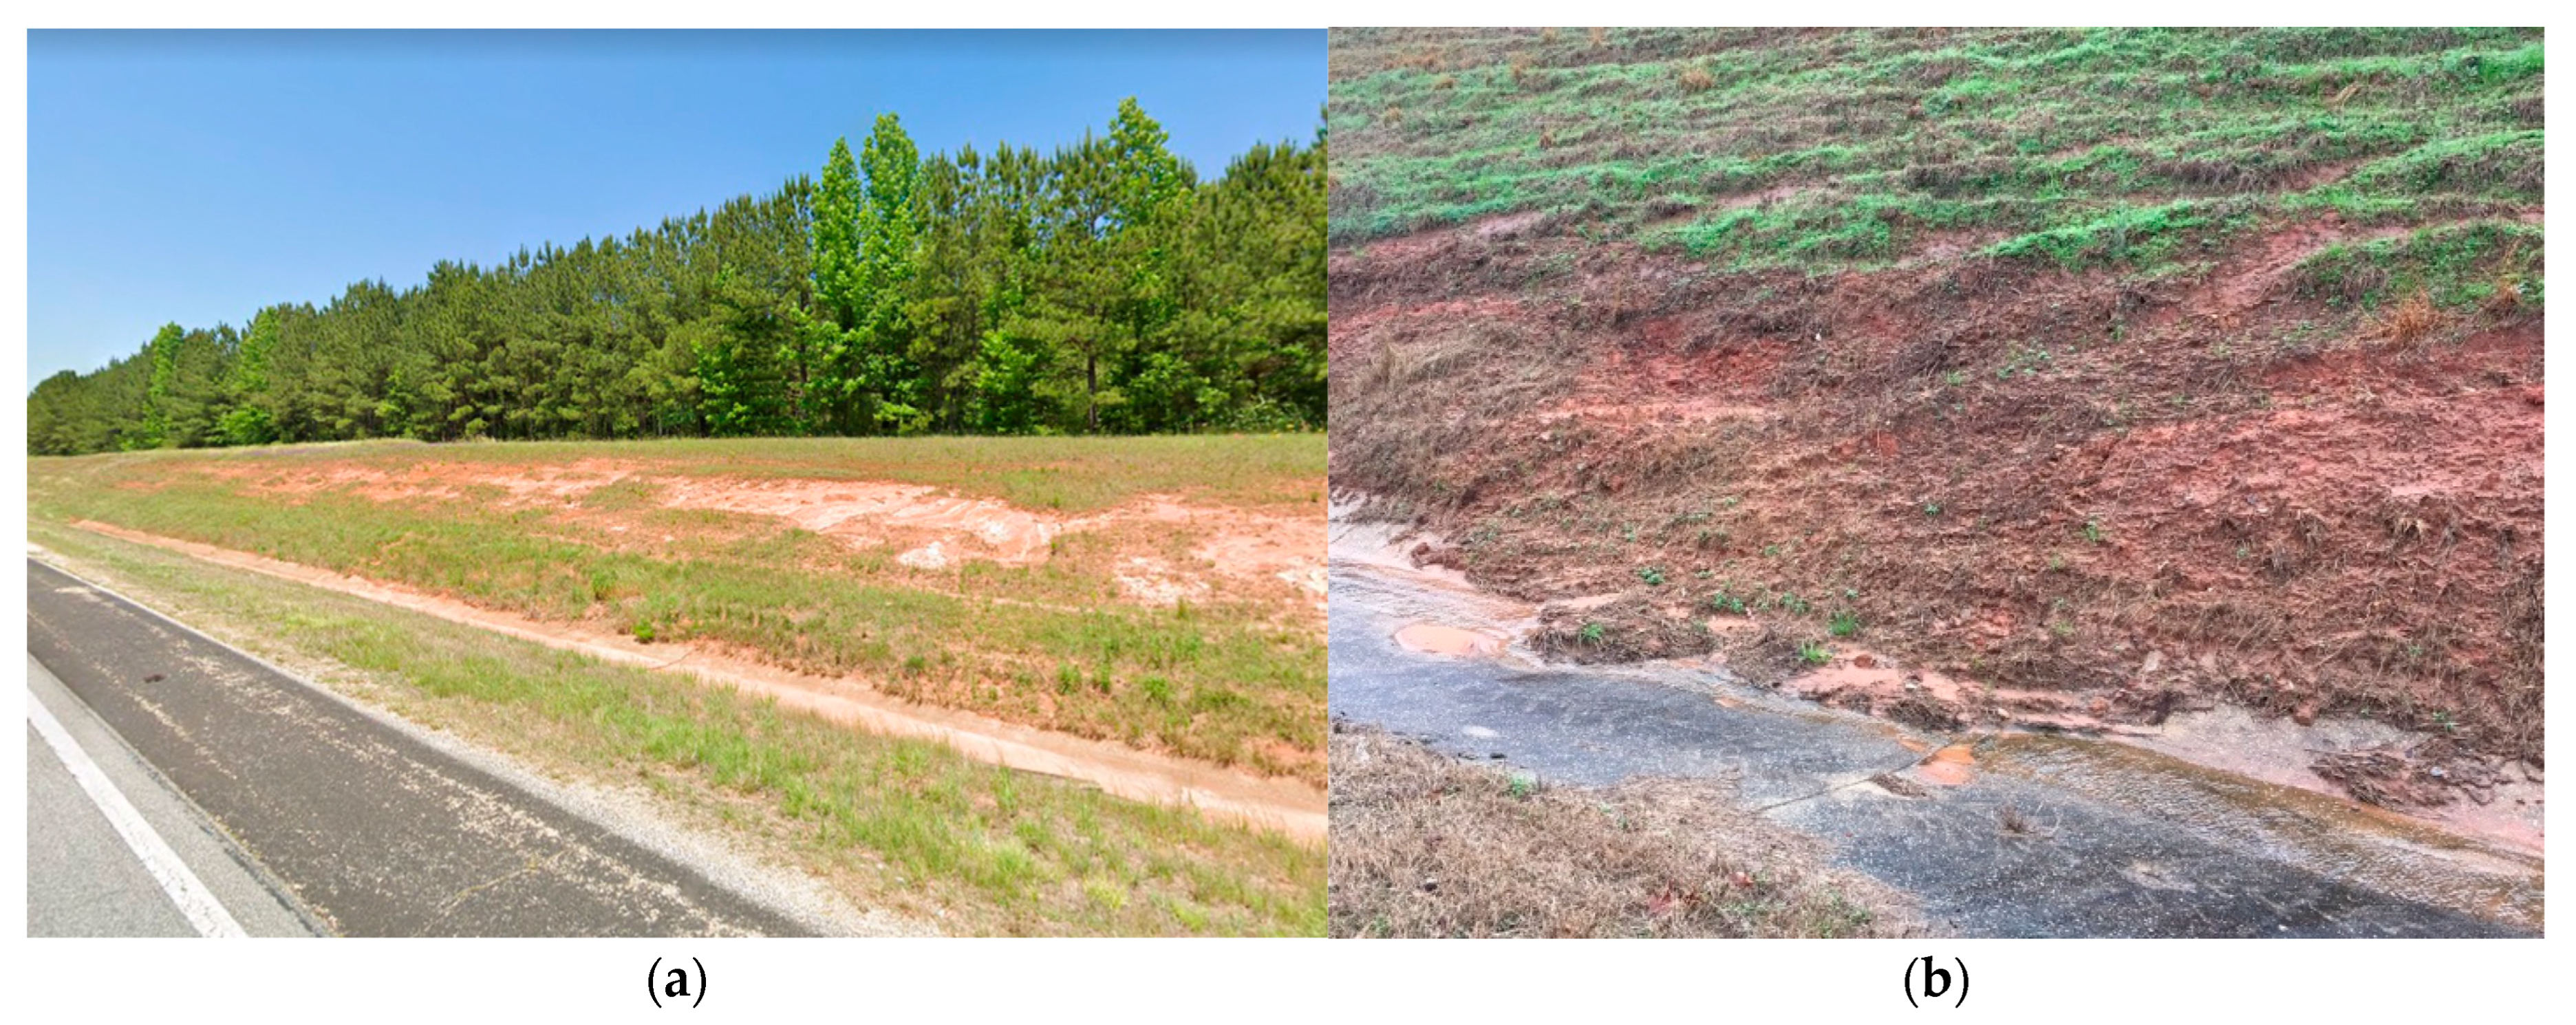
2.1. Study Site
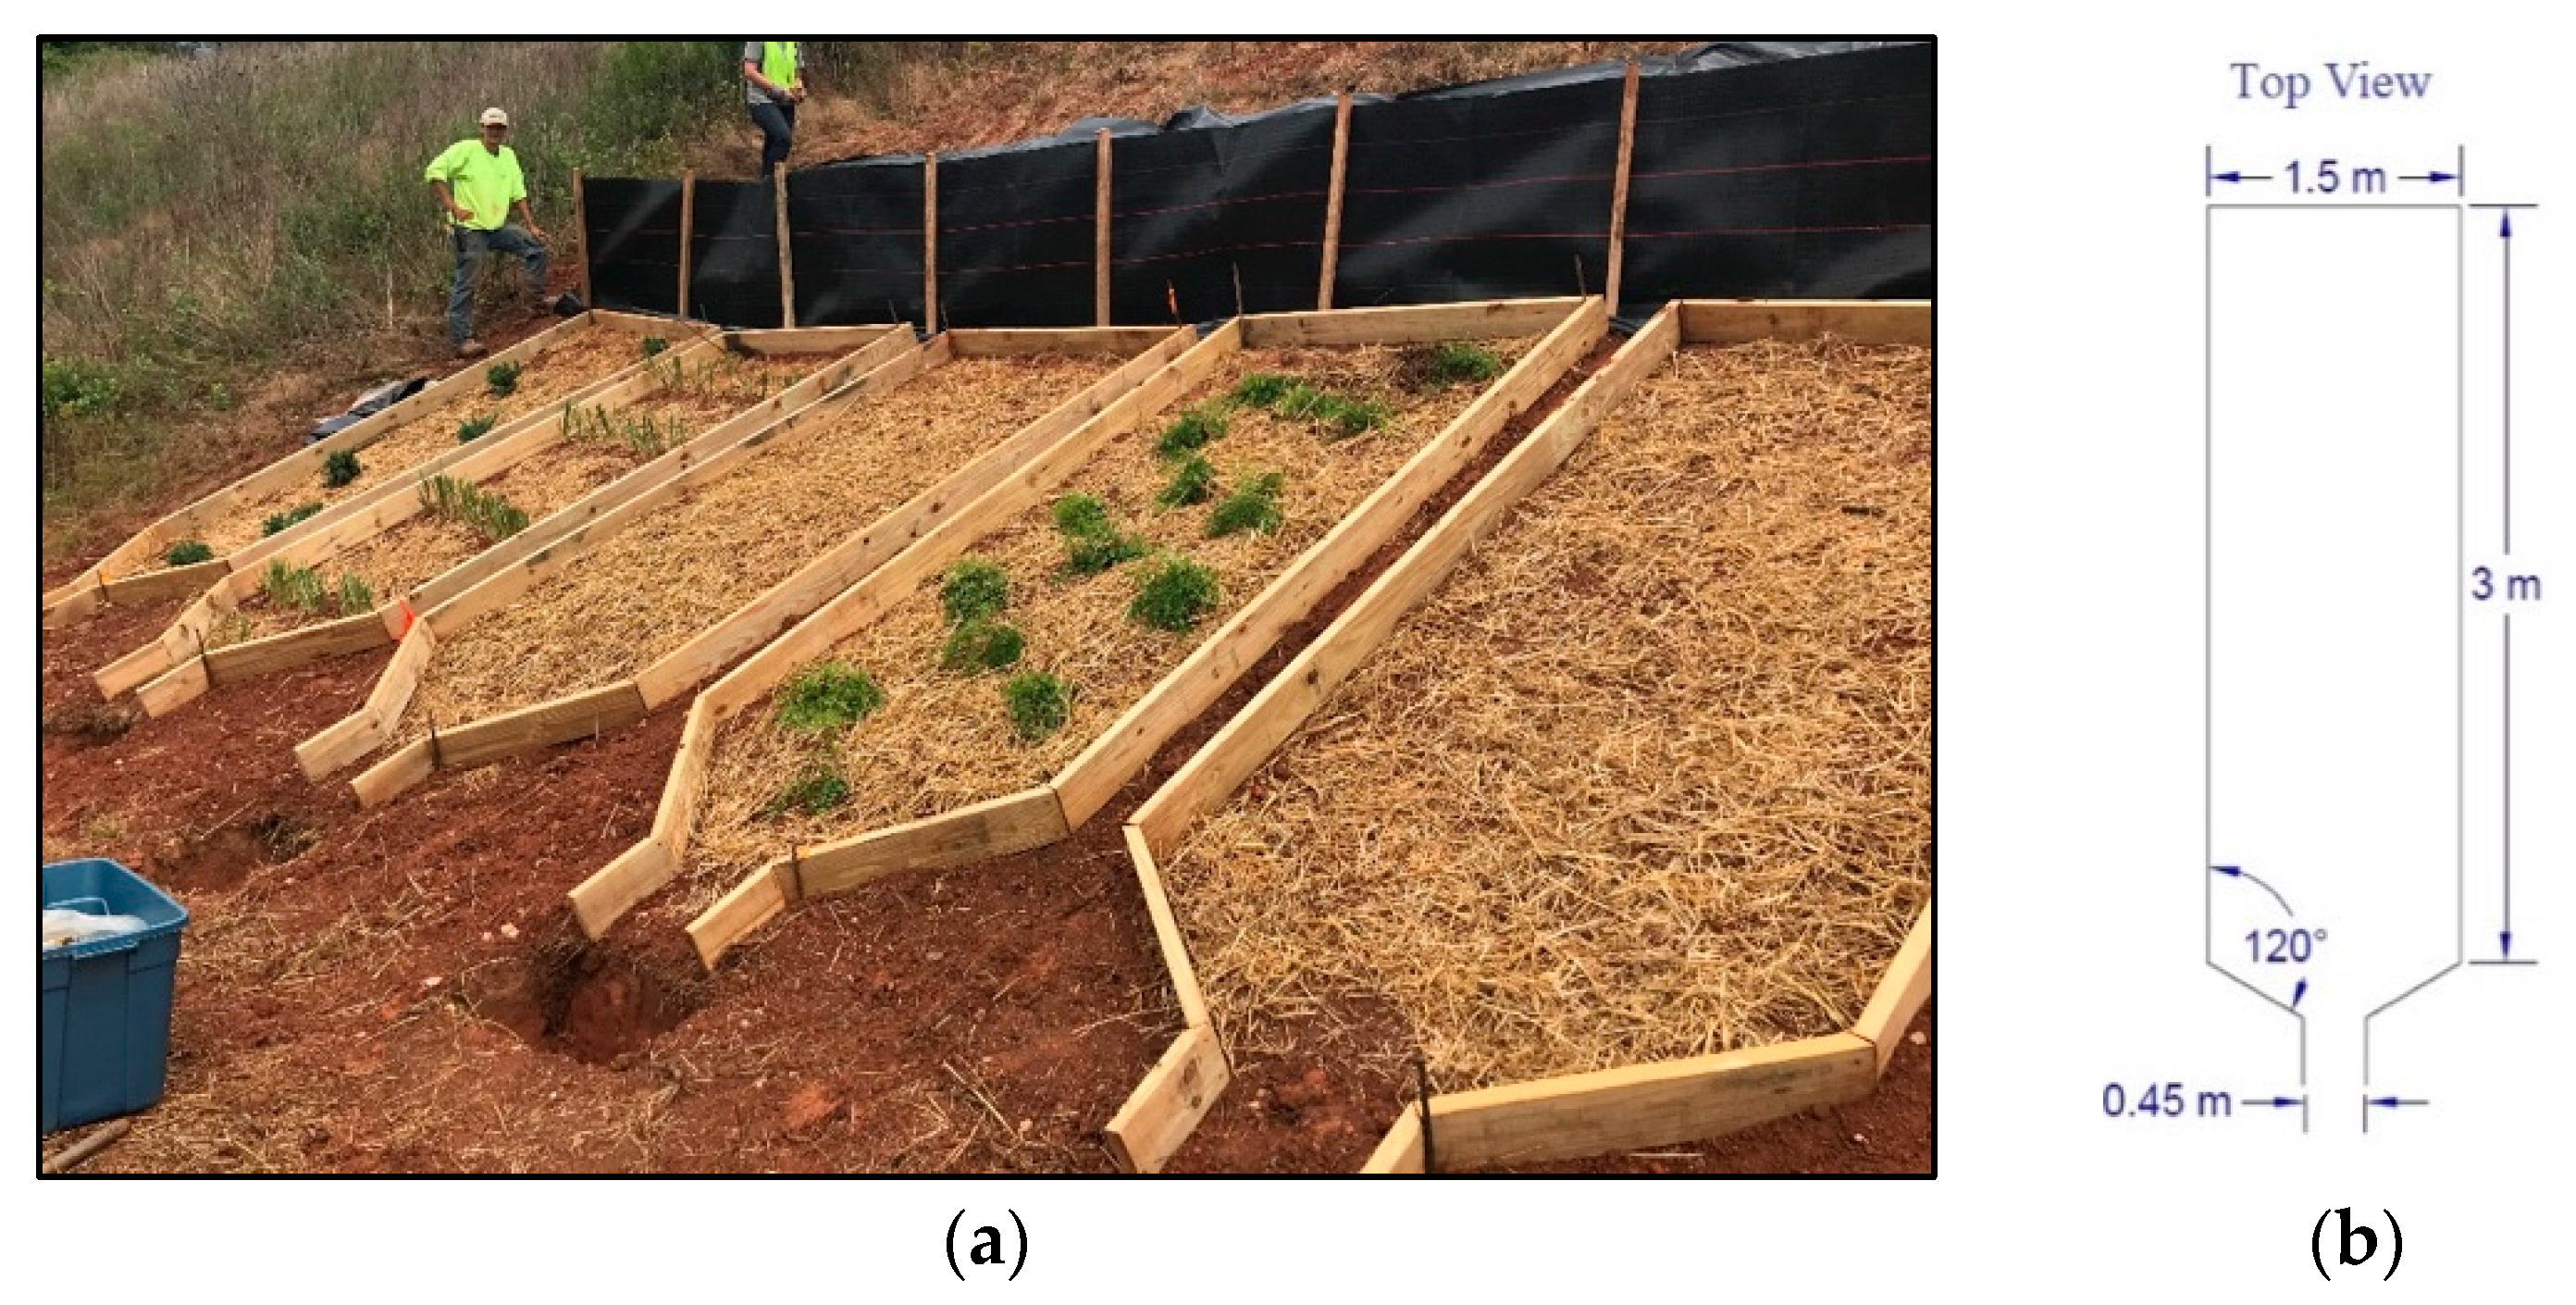
2.2. Experimental Plot Design
2.3. Vegetation Planting and Maintenance
- Grass Control: One plot was planted with turf grass typical of what would be used for erosion control under current management practices in Alabama [6]. The Kentucky-31 cultivar of fescue grass (Lolium arundinaceum) was planted from seed. This plot was used to compare the other species with the status quo.
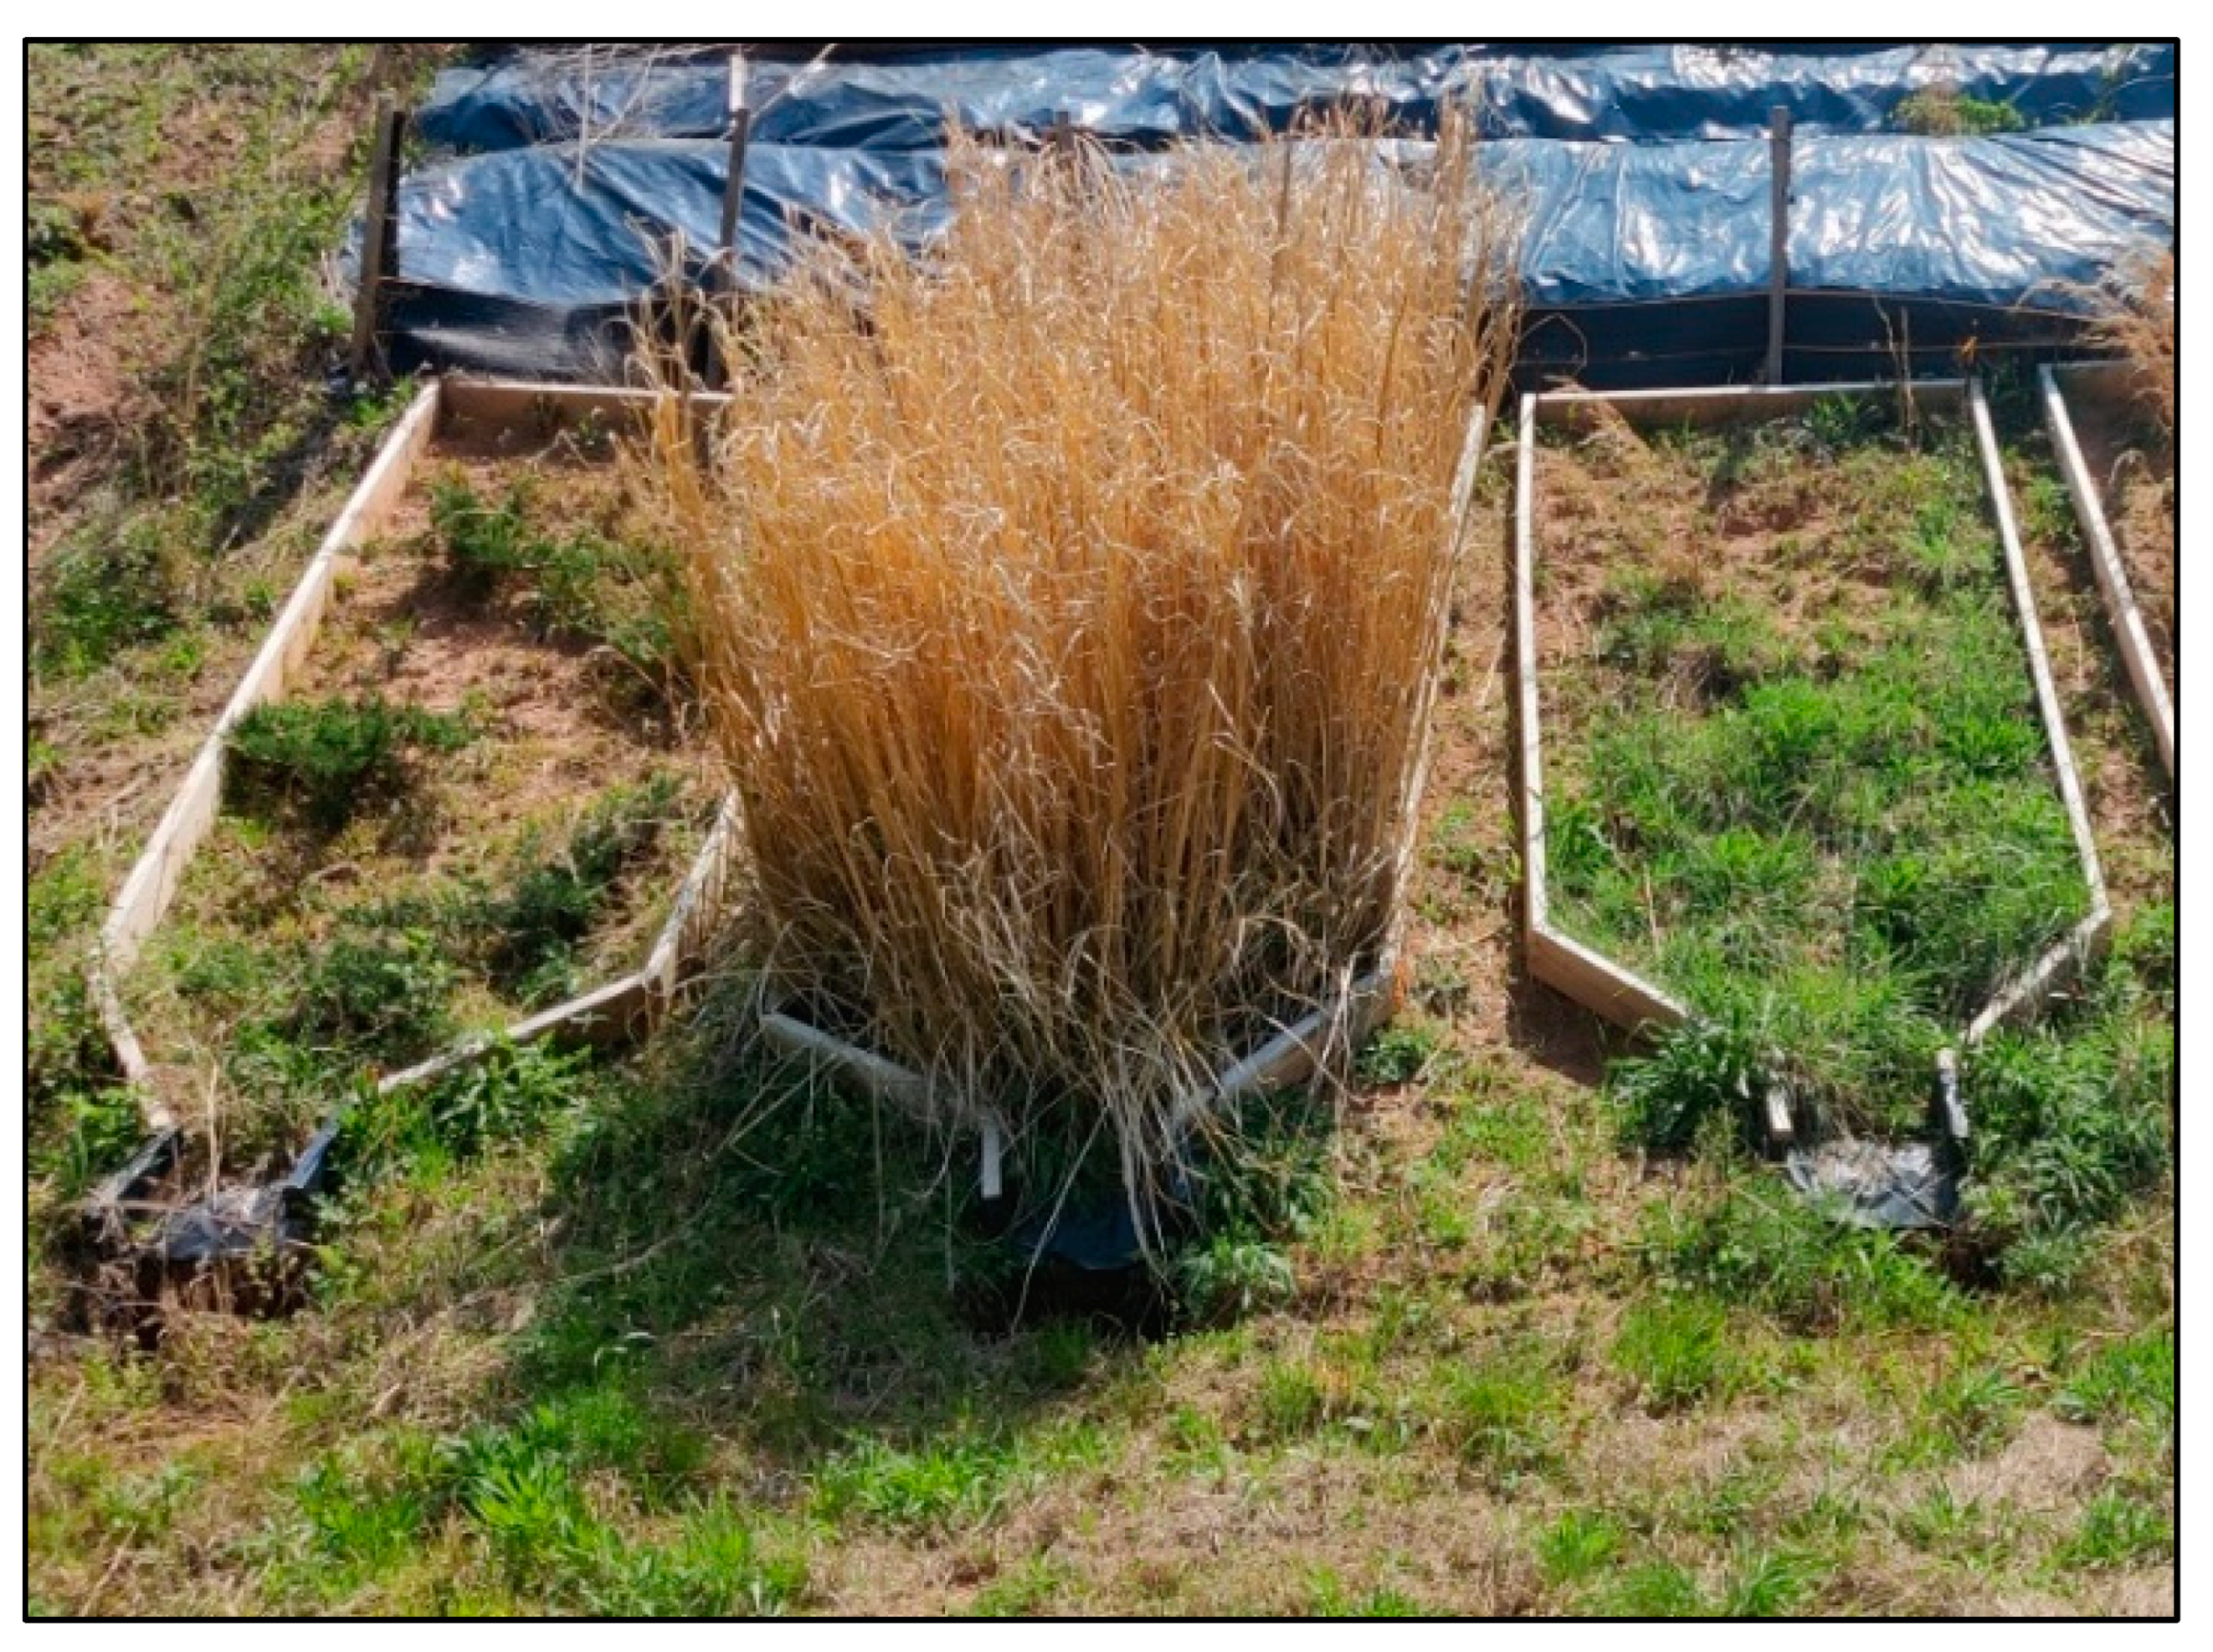
- Deep-rooted Grass: Vetiver grass (Vetiveria zizaniodies) is a deep-rooted grass native to southeast Asia that has been used for decades to improve slope stability, improve streambank establishment, and decrease sediment run-off in agricultural areas [44,54,55,56]. The grass is planted as a slip rather than as a seed and is generally sold sterile so it will not flower and be invasive to the surrounding native flora [30]. Slips were planted in four hedgerows parallel to the slope.
- Woody Shrub: Juniper is a deep-rooted, drought tolerant woody shrub that grows well on steep slopes [56]. It was grown from potted plants. Either Juniperus chinensis or Juniperus horizontalis was planted based on availability. The two species have similar characteristics.
- Perennial Legume: Hairy vetch (Vivica villosa) is a winter-active legume species used for erosion control and as an agricultural cover crop due to its ability to fix atmospheric nitrogen. It has a fast above- and belowground growth rate and high transpiration rate [57]. Hairy vetch grows best when planted in the fall so it can be beneficial for fall/winter construction projects when other species are typically dormant [56]. It was planted from seed in this study.
- Fern: Ferns are useful in erosion control practices as they create dense, long-lasting ground cover and naturally grow in disturbed areas with low nutrient and moisture access [58]. Maidenhair fern (Adiantum pedatum) is native to the southeast and is able to grow on near-vertical faces [31]. They were planted from potted plants.
- Native Prairie Grass: Native species are generally preferred in landscaping because they are adapted to local conditions and can enhance native biodiversity [59,60,61]. Unlike non-native deep-rooted grasses, they can be grown from seed. Switchgrass (Panicum virgatum), which has a deep and fibrous root system and is climatically adapted throughout the USA [27], was planted from seed.
2.4. Runoff and Erosion
2.4.1. Runoff Collection with TSS
2.4.2. Erosion Pins
2.5. Root Biomass Analysis
3. Results
3.1. Vegetation Growth and Establishment
3.2. Runoff and Erosion
3.2.1. Runoff Collection Method
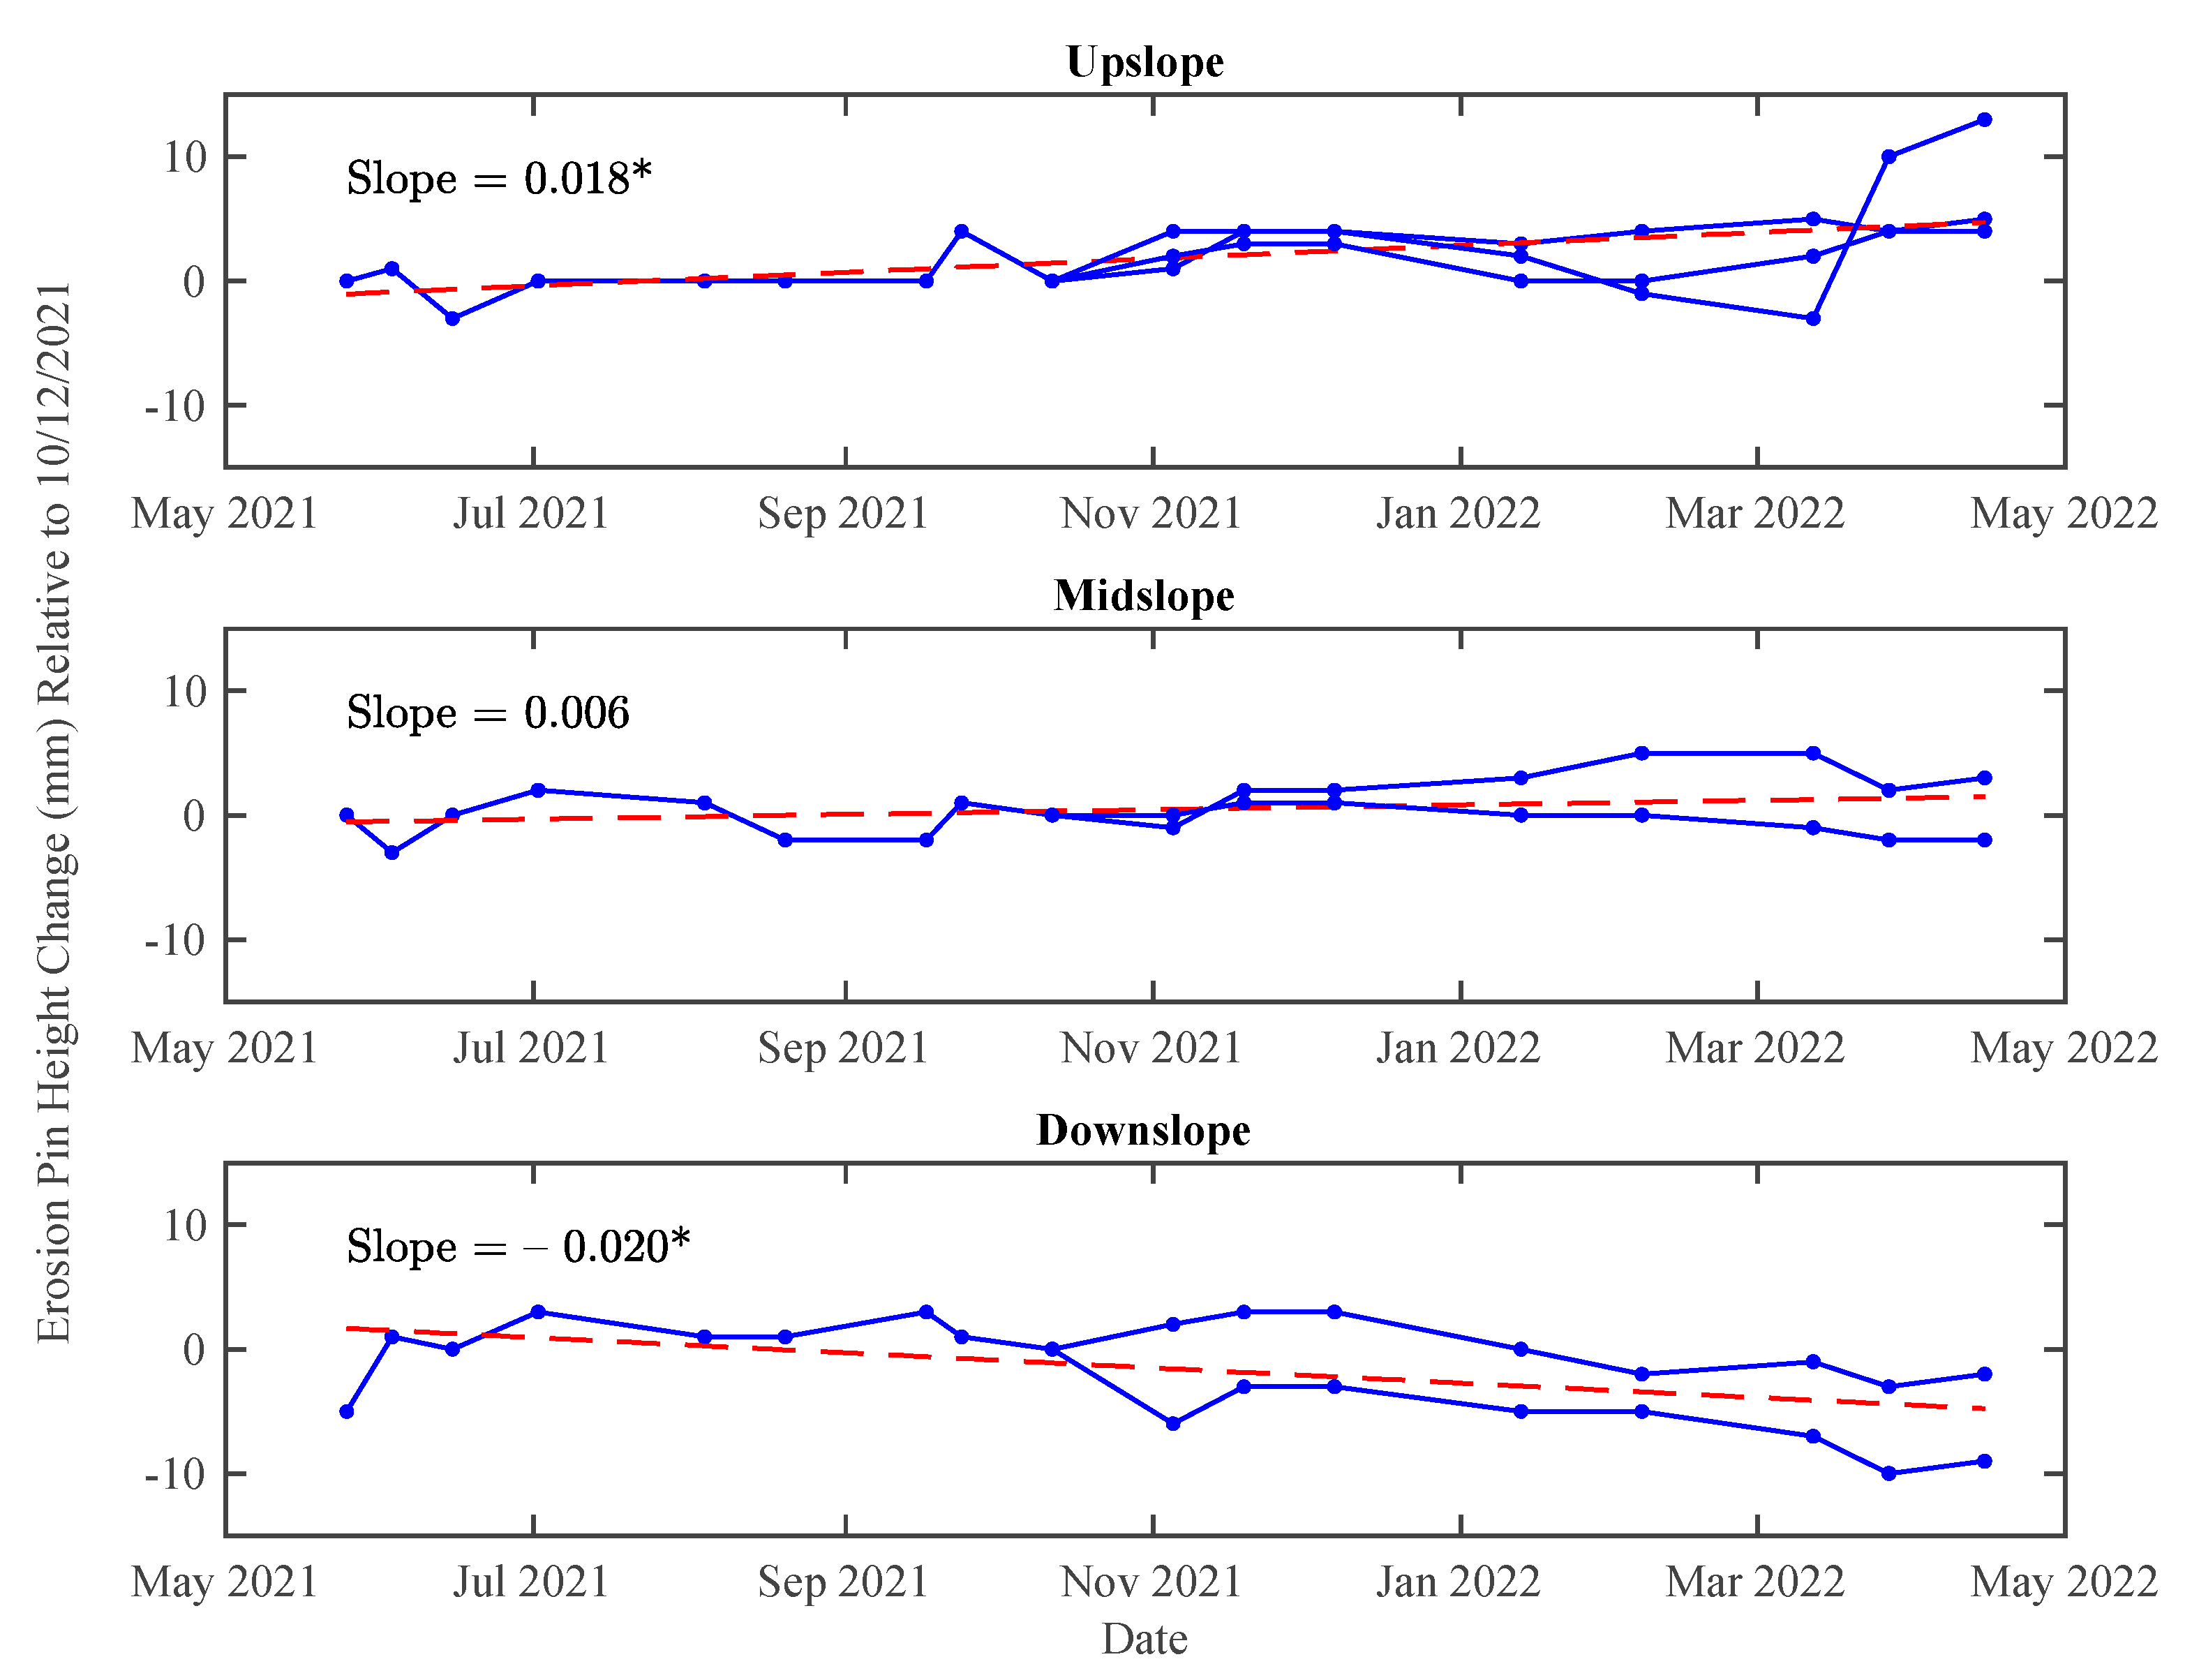
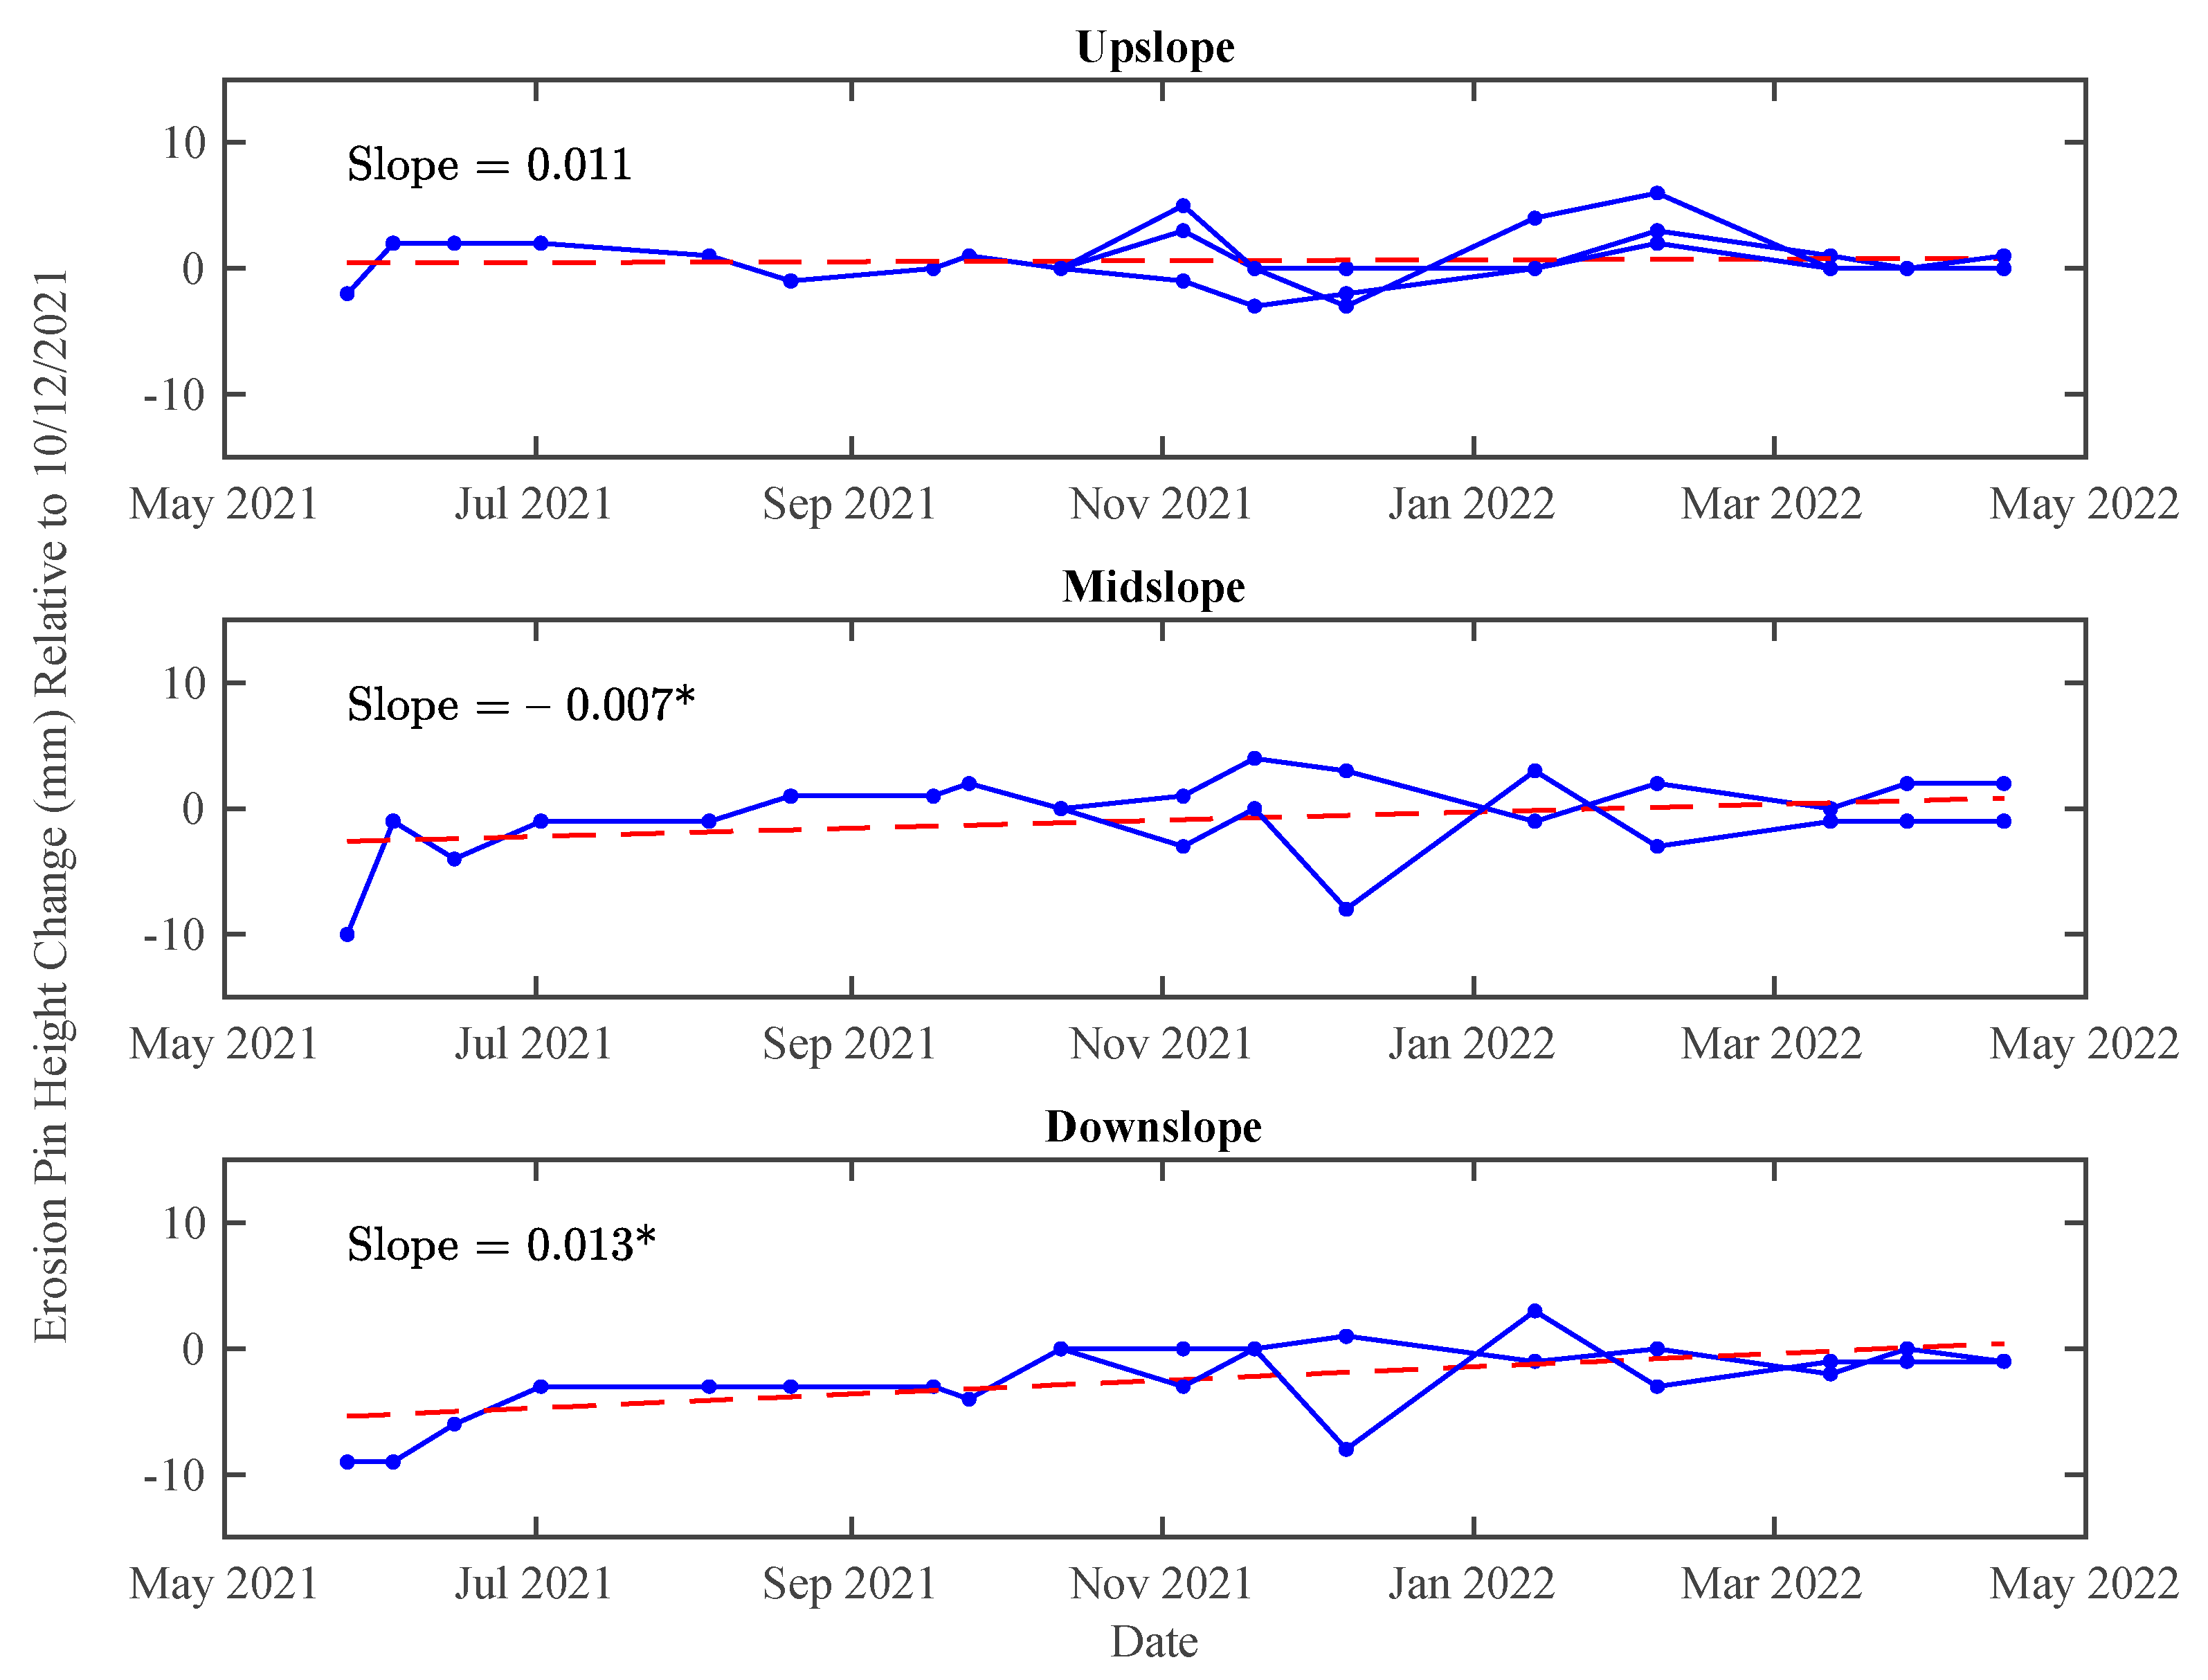
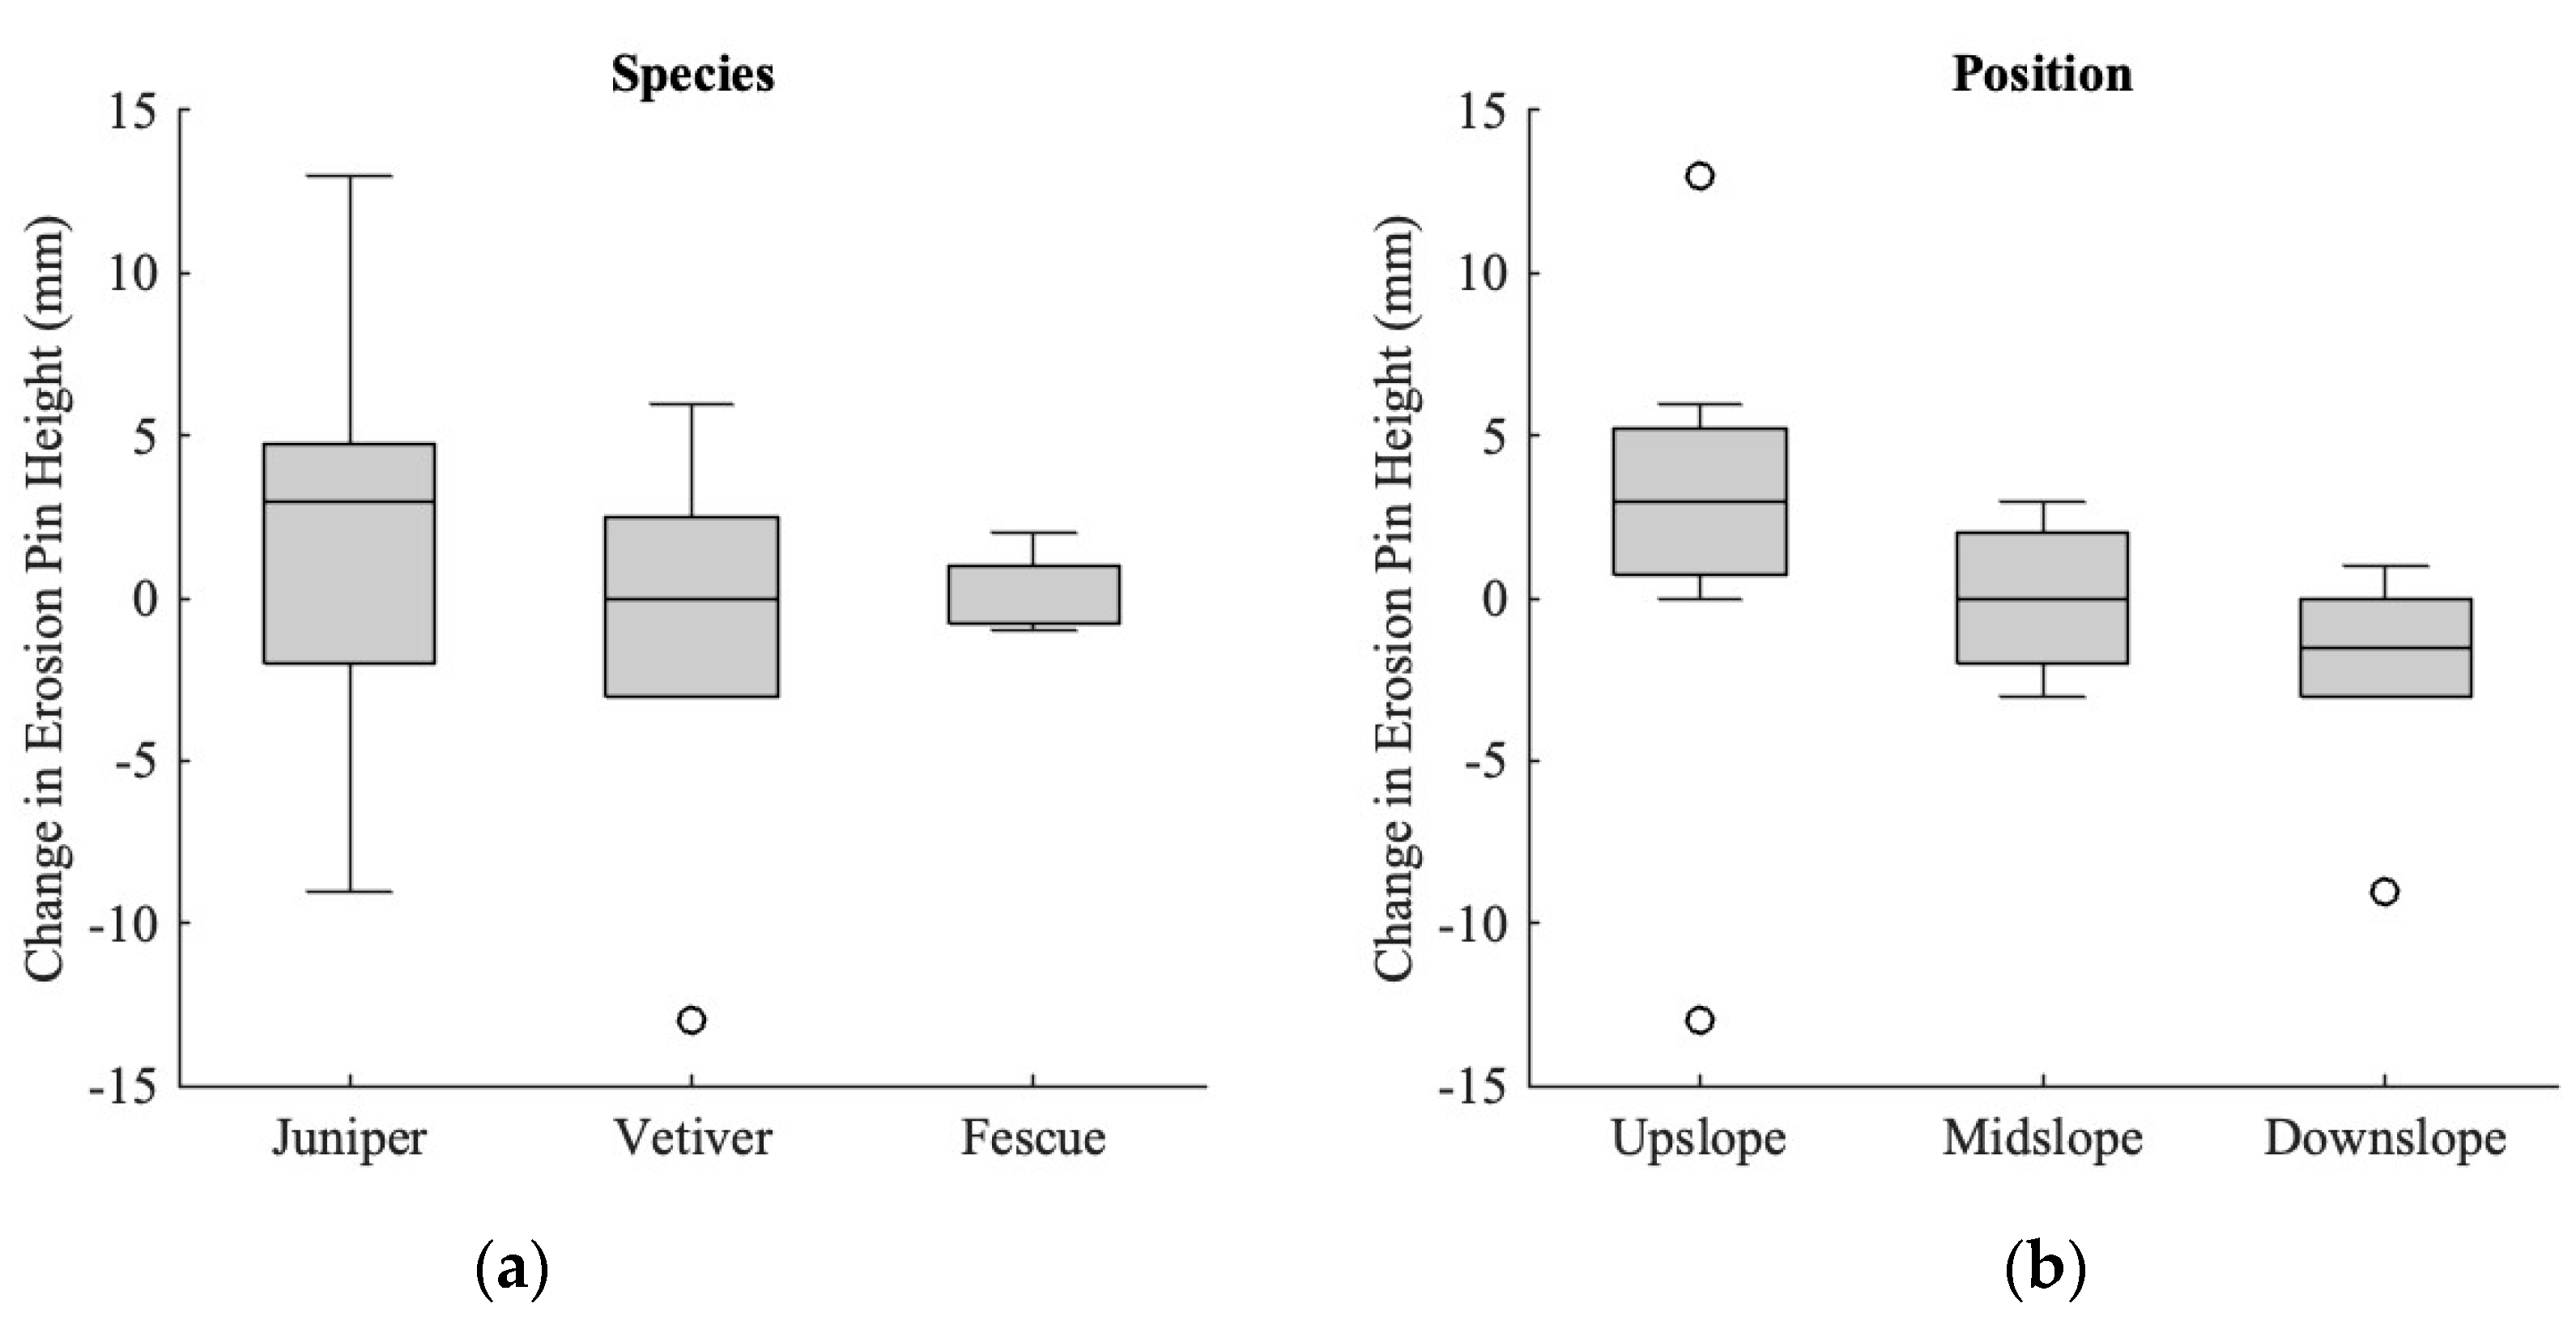
3.2.2. Erosion Pins
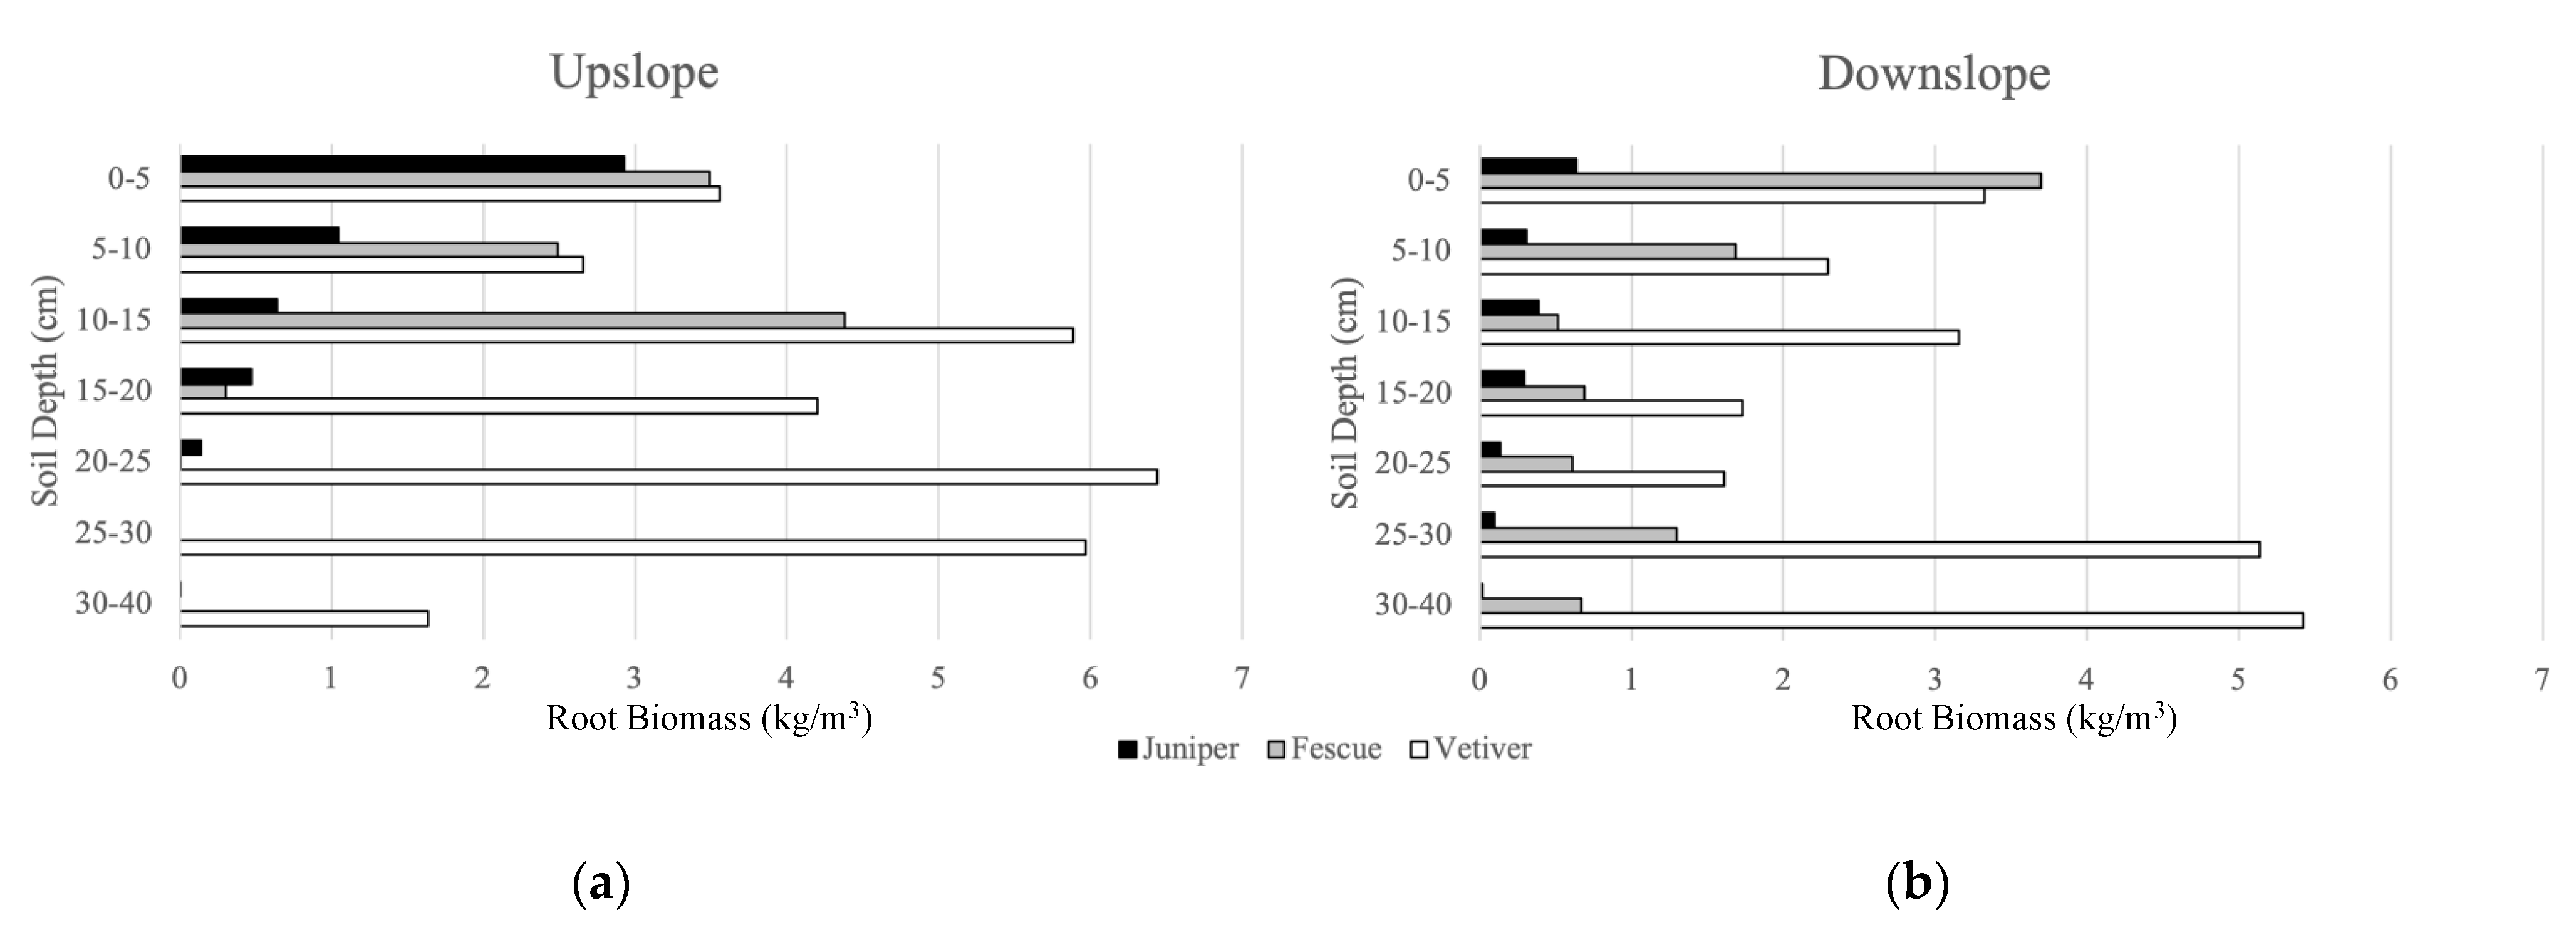
3.3. Root Biomass
3.4. Results Summary
4. Discussion
5. Conclusions
Supplementary Materials
Author Contributions
Funding
Institutional Review Board Statement
Informed Consent Statement
Data Availability Statement
Acknowledgments
Conflicts of Interest
References
- Knights, M.J.; Montgomery, J.; Carcamo, P.S. Development of a Slope Failure Database for Alabama Highways. Bull. Eng. Geol. Environ. 2020, 79, 423–438. [Google Scholar] [CrossRef]
- Liu, Y.J.; Wang, T.W.; Cai, C.F.; Li, Z.X.; Cheng, D.B. Effects of Vegetation on Runoff Generation, Sediment Yield and Soil Shear Strength on Road-Side Slopes under a Simulation Rainfall Test in the Three Gorges Reservoir Area, China. Sci. Total Environ. 2014, 485, 93–102. [Google Scholar] [CrossRef] [PubMed]
- Morgan, R.P.; Rickson, R.J. Slope Stabilization and Erosion Control: A Bioengineering Approach; Taylor & Francis: Oxfordshire, UK, 2003. [Google Scholar]
- Montgomery, J.; Knights, M.; Xuan, M.; Carcamo, P. Evaluation of Landslides along Alabama Highways; Report to the Alabama Department of Transportation, Highway Research Center: Auburn, AL, USA, 2019. [Google Scholar]
- National Research Council. Assessing and Managing the Ecological Impacts of Paved Roads; National Academies Press: Washington, DC, USA, 2005. [Google Scholar]
- Alabama Soil and Water Conservation Committee Alabama Handbook for Erosion Control, Sediment Control and Stormwater Management on Construction Sites and Urban Areas, Alabama Soil and Water Conservation Committee, Montgomery, AL, USA. 2018. Available online: https://alabamasoilandwater.gov/wp-content/uploads/2021/03/2018-Handbook-Vol-1.pdf (accessed on 21 September 2022).
- Stokes, A.; Spanos, I.; Norris, J.E.; Cammeraat, E. Eco- and Ground Bio-Engineering: The Use of Vegetation to Improve Slope Stability: Proceedings of the First International Conference on Eco-Engineering 13–17 September 2004; Springer Science & Business Media: Berlin/Heidelberg, Germany, 2007; ISBN 978–1-4020–5593–5. [Google Scholar]
- Bordoloi, S.; Ng, C.W.W. The Effects of Vegetation Traits and Their Stability Functions in Bio-Engineered Slopes: A Perspective Review. Eng. Geol. 2020, 275, 105742. [Google Scholar] [CrossRef]
- Liu, X.; Lan, H.; Li, L.; Cui, P. An Ecological Indicator System for Shallow Landslide Analysis. CATENA 2022, 214, 106211. [Google Scholar] [CrossRef]
- Löbmann, M.T.; Geitner, C.; Wellstein, C.; Zerbe, S. The Influence of Herbaceous Vegetation on Slope Stability–A Review. Earth-Sci. Rev. 2020, 209, 103328. [Google Scholar] [CrossRef]
- He, J.J.; Cai, Q.G.; Tang, Z.J. Wind Tunnel Experimental Study on the Effect of PAM on Soil Wind Erosion Control. Environ. Monit. Assess. 2008, 145, 185–193. [Google Scholar] [CrossRef]
- Roundy, D. How Do Plants Help Prevent Erosion Control? Granite Seed: Lehi, Utah, 2019. [Google Scholar]
- Rousseva, S.; Torri, D.; Pagliai, M. Effect of Rain on the Macroporosity at the Soil Surface. Eur. J. Soil Sci. 2002, 53, 83–93. [Google Scholar] [CrossRef]
- Greenway, D.R. Vegetation and Slope Stability. In Slope Stability: Geotechnical Engineering and Geomorphology; Chichester: West Sussex, UK, 1987; pp. 187–230. [Google Scholar]
- Langbein, W.B.; Schumm, S.A. Yield of Sediment in Relation to Mean Annual Precipitation. Eos Trans. Am. Geophys. Union 1958, 39, 1076–1084. [Google Scholar] [CrossRef]
- Chen, H.; Zhang, X.; Abla, M.; Lü, D.; Yan, R.; Ren, Q.; Ren, Z.; Yang, Y.; Zhao, W.; Lin, P. Effects of Vegetation and Rainfall Types on Surface Runoff and Soil Erosion on Steep Slopes on the Loess Plateau, China. Catena 2018, 170, 141–149. [Google Scholar] [CrossRef]
- Ranjan, V.; Sen, P.; Kumar, D.; Sarsawat, A. A Review on Dump Slope Stabilization by Revegetation with Reference to Indigenous Plant. Ecol. Process. 2015, 14, 1–11. [Google Scholar] [CrossRef]
- Reubens, B.; Poesen, J.; Danjon, F.; Geudens, G.; Muys, B. The Role of Fine and Coarse Roots in Shallow Slope Stability and Soil Erosion Control with a Focus on Root System Architecture: A Review. Trees 2007, 21, 385–402. [Google Scholar] [CrossRef]
- Masi, E.B.; Segoni, S.; Tofani, V. Root Reinforcement in Slope Stability Models: A Review. Geosciences 2021, 11, 212. [Google Scholar] [CrossRef]
- De Baets, S.; Poesen, J.; Reubens, B.; Wemans, K.; Baerdemaeker, J.D.; Muys, B. Root Tensile Strength and Root Distribution of Typical Mediterranean Plant Species and Their Contribution to Soil Shear Strength. Plant Soil 2008, 305, 207–226. [Google Scholar] [CrossRef]
- Bennett, S.J.; Simon, A. Riparian Vegetation and Fluvial Geomorphology; American Geophysical Union: Washington, DC, USA, 2004; Volume 8. [Google Scholar]
- Zhou, Y.; Watts, D.; Li, Y.; Cheng, X. A Case Study of Effect of Lateral Roots of Pinus Yunnanensis on Shallow Soil Reinforcement. For. Ecol. Manag. 1998, 103, 107–120. [Google Scholar] [CrossRef]
- Stokes, A.; Atger, C.; Bengough, A.G.; Fourcaud, T.; Sidle, R.C. Desirable Plant Root Traits for Protecting Natural and Engineered Slopes against Landslides. Plant Soil 2009, 324, 1–30. [Google Scholar] [CrossRef]
- Simon, A.; Collison, A.J.C. Quantifying the Mechanical and Hydrologic Effects of Riparian Vegetation on Streambank Stability. Earth Surf. Process. Landf. 2002, 27, 527–546. [Google Scholar] [CrossRef]
- Nelson, S.A. Slope Stability, Triggering Events, Mass Movement Hazards. Nat. Disasters 2013. Tulane University, New Orleans, LA, USA. Available online: https://www2.tulane.edu/~sanelson/Natural_Disasters/slopestability.pdf (accessed on 21 September 2022).
- Patil, U.D.; Shelton III, A.J.; Aquino, E. Bioengineering Solution to Prevent Rainfall-Induced Slope Failures in Tropical Soil. Land 2021, 10, 299. [Google Scholar] [CrossRef]
- Cook, T. Tall Fescue Lolium Arundinaceum (Schreb.) Darbysh. Oregon State University, Corvallis, OR, USA. 2005. Available online: https://agsci.oregonstate.edu/sites/agscid7/files/horticulture/beaverturf/TallFescue-1-5-05V.pdf (accessed on 21 September 2022).
- Burylo, M.; Hudek, C.; Rey, F. Soil Reinforcement by the Roots of Six Dominant Species on Eroded Mountainous Marly Slopes (Southern Alps, France). Catena 2011, 84, 70–78. [Google Scholar] [CrossRef]
- Sharif, M. US Army Experience: Cold Tolerance and Seed Viability Characteristics of Vetiver. In Proceedings of the Second International Vetiver Conference, Thailand, 18–22 January 2000. [Google Scholar]
- Truong, P. Vetiver Grass System: Potential Applications for Soil and Water Conservation in Northern California. In Proceedings of the Application of the Vetiver System for Phytoremediation of Mercury Pollution in the Lake and Yolo Counties, Northern California, 10 May 2000; Volume 9. [Google Scholar]
- Knouse, J.A. Ferns as Conservation Agents. Available online: https://www.jaknouse.athens.oh.us/ferns/ferncons.html (accessed on 30 March 2021).
- Hamidifar, H.; Keshavarzi, A.; Truong, P. Enhancement of River Bank Shear Strength Parameters Using Vetiver Grass Root System. Arab. J. Geosci. 2018, 11, 611. [Google Scholar] [CrossRef]
- Saifuddin, M.; Osman, N. Evaluation of Hydro-Mechanical Properties and Root Architecture of Plants for Soil Reinforcement. Curr. Sci. 2014, 107, 845–852. [Google Scholar]
- Ali, F.H.; Osman, N. Shear Strength of a Soil Containing Vegetation Roots. Soils Found. 2008, 48, 587–596. [Google Scholar] [CrossRef]
- Kokutse, N.K.; Temgoua, A.G.T.; Kavazović, Z. Slope Stability and Vegetation: Conceptual and Numerical Investigation of Mechanical Effects. Ecol. Eng. 2016, 86, 146–153. [Google Scholar] [CrossRef]
- Levine, E.R.; Knox, R.G.; Lawrence, W.T. Relationships between Soil Properties and Vegetation at the Northern Experimental Forest, Howland, Maine. Remote Sens. Environ. 1994, 47, 231–241. [Google Scholar] [CrossRef]
- Raich, J.W.; Tufekciogul, A. Vegetation and Soil Respiration: Correlations and Controls. Biogeochemistry 2000, 48, 71–90. [Google Scholar] [CrossRef]
- Lynne, K. Starting Seeds vs. Buying Plants: Which Is Better? New Life on A Homestead. New Life Homestd. 2013. Available online: https://www.newlifeonahomestead.com/starting-seeds-vs-buying-plants/ (accessed on 21 September 2022).
- Messer, R.C. Evaluating Maintenance Techniques for Long-Term Vegetation Establishment on Disturbed Slopes in Alabama. M.S. Thesis, Auburn University, Auburn, AL, USA, 2011. [Google Scholar]
- Bochet, E.; García-Fayos, P.; Tormo, J. How Can We Control Erosion of Roadslopes in Semiarid Mediterranean Areas? Soil Improvement and Native Plant Establishment. Land Degrad. Dev. 2010, 21, 110–121. [Google Scholar] [CrossRef]
- Bochet, E.; García-Fayos, P.; Poesen, J. Topographic Thresholds for Plant Colonization on Semi-Arid Eroded Slopes. Earth Surf. Process. Landf. J. Br. Geomorphol. Res. Group 2009, 34, 1758–1771. [Google Scholar] [CrossRef]
- Grace, J.M. Effectiveness of Vegetation in Erosion Control from Forest Road Sideslopes. Trans. ASAE 2002, 45, 681. [Google Scholar]
- Hodges, T.M.; Lingwall, B.N. Effects of Microbial Biomineralization Surface Erosion Control Treatments on Vegetation and Revegetation along Highways. Transp. Res. Rec. 2020, 2674, 1030–1040. [Google Scholar] [CrossRef]
- Kim, K.; Riley, S.; Fischer, E.; Khan, S. Greening Roadway Infrastructure with Vetiver Grass to Support Transportation Resilience. CivilEng 2022, 3, 147–164. [Google Scholar] [CrossRef]
- Myers, D.T.; Rediske, R.R.; McNair, J.N. Measuring Streambank Erosion: A Comparison of Erosion Pins, Total Station, and Terrestrial Laser Scanner. Water 2019, 11, 1846. [Google Scholar] [CrossRef]
- Thomsen, L.M.; Baartman, J.E.M.; Barneveld, R.J.; Starkloff, T.; Stolte, J. Soil Surface Roughness: Comparing Old and New Measuring Methods and Application in a Soil Erosion Model. Soil 2015, 1, 399–410. [Google Scholar] [CrossRef]
- Hunolt, A.E.; Brantley, E.F.; Howe, J.A.; Wright, A.N.; Wood, C.W. Comparison of Native Woody Species for Use as Live Stakes in Streambank Stabilization in the Southeastern United States. J. Soil Water Conserv. 2013, 68, 384–391. [Google Scholar] [CrossRef]
- Srivastava, A.; Yetemen, O.; Saco, P.M.; Rodriguez, J.F.; Kumari, N.; Chun, K.P. Influence of Orographic Precipitation on Coevolving Landforms and Vegetation in Semi-Arid Ecosystems. Earth Surf. Process. Landf. 2022, 47, 2846–2862. [Google Scholar] [CrossRef]
- Saco, P.M.; Moreno-de las Heras, M. Ecogeomorphic Coevolution of Semiarid Hillslopes: Emergence of Banded and Striped Vegetation Patterns through Interaction of Biotic and Abiotic Processes. Water Resour. Res. 2013, 49, 115–126. [Google Scholar] [CrossRef]
- NRCS Information on Rainfall, Frequency, & Distributions NRCS NEH Part 630 Ch.4. Available online: https://www.nrcs.usda.gov/wps/portal/nrcs/detailfull/national/water/?cid=stelprdb1044959 (accessed on 27 May 2020).
- Terando, A.J.; Costanza, J.; Belyea, C.; Dunn, R.R.; McKerrow, A.; Collazo, J.A. The Southern Megalopolis: Using the Past to Predict the Future of Urban Sprawl in the Southeast US. PLoS ONE 2014, 9, e102261. [Google Scholar] [CrossRef]
- US Department of Agriculture. National Weather and Climate Service Interactive Map. Available online: https://www.nrcs.usda.gov/wps/portal/ (accessed on 21 September 2022).
- Durner, W.; Iden, S.C. The Improved Integral Suspension Pressure Method (ISP+) for Precise Particle Size Analysis of Soil and Sedimentary Materials. Soil Tillage Res. 2021, 213, 105086. [Google Scholar] [CrossRef]
- Dalton, P.A.; Smith, R.J.; Truong, P.N.V. Vetiver Grass Hedges for Erosion Control on a Cropped Flood Plain: Hedge Hydraulics. Agric. Water Manag. 1996, 31, 91–104. [Google Scholar] [CrossRef]
- Kemper, W.D. Vetiver Grass: A Thin Green Line against Erosion. J. Soil Water Conserv. 1993, 48, 426–427. [Google Scholar]
- US Department of Agriculture, The PLANTS Database: Plant List of Attributes, Names, Taxonomy, and Symbols. US Department of Agriculture, Natural Resource Conservation Service, National Plant Data Team, Baton Rouge, LA, USA. 2015. Available online: http://Plants.Usda.Gov (accessed on 21 September 2022).
- Wiesmeier, M.; Lungu, M.; Hübner, R.; Cerbari, V. Remediation of Degraded Arable Steppe Soils in Moldova Using Vetch as Green Manure. Solid Earth 2015, 6, 609–620. [Google Scholar] [CrossRef]
- Chau, N.L.; Chu, L.M. Fern Cover and the Importance of Plant Traits in Reducing Erosion on Steep Soil Slopes. Catena 2017, 151, 98–106. [Google Scholar] [CrossRef]
- DuBois, L.; Latimer, J.G.; Appleton, B.L.; Close, D. America’s Anniversary Garden. Native Plants. Publication 426-223. Virginia Cooperative Extension, Blacksburg, VA, USA. 2009. Available online: https://vtechworks.lib.vt.edu/bitstream/handle/10919/48226/426-223_pdf.pdf?sequence=1 (accessed on 21 September 2022).
- Correll, D.L. Principles of Planning and Establishment of Buffer Zones. Ecol. Eng. 2005, 24, 433–439. [Google Scholar] [CrossRef]
- Hoag, C.J. Vertical Bundles: A Streambank Bioengineering Treatment to Establish Willows and Dogwoods on Streambanks. In Technical Note USDA-NRCS. Boise, Idaho-Salt Lake City, Utah. Plant Material; USDA-NRCS (US Department of Agriculture Natural Resource Conservation Service): Boise, Idaho; Idaho-Salt Lake City, Utah, 2009; Volume 53, pp. 1–6. [Google Scholar]
- Hart, E.A.; Mills, H.H.; Li, P. Measuring Erosion Rates on Exposed Limestone Residuum Using Erosion Pins: A 10-Year Record. Phys. Geogr. 2017, 38, 541–555. [Google Scholar] [CrossRef]
- USEPA Method 160.2: Total Suspended Solids (TSS) (Gravimetric, Dried at 103–105° C) US Environmental Protection Agency, Washington, DC, USA. 1999. Available online: https://www.nemi.gov/methods/method_summary/5213/ (accessed on 21 September 2022).
- Haigh, M.J. The Use of Erosion Pins in the Study of Slope Evolution. Br. Geomorphol. Res. Group Tech. Bull. 1977, 18, 31–49. [Google Scholar]
- Kearney, S.P.; Fonte, S.J.; García, E.; Smukler, S.M. Improving the Utility of Erosion Pins: Absolute Value of Pin Height Change as an Indicator of Relative Erosion. CATENA 2018, 163, 427–432. [Google Scholar] [CrossRef]
- Frasier, I.; Noellemeyer, E.; Fernández, R.; Quiroga, A. Direct Field Method for Root Biomass Quantification in Agroecosystems. MethodsX 2016, 3, 513–519. [Google Scholar] [CrossRef] [PubMed]
- Franks, C.D.; Goings, K.A. Separating Roots from the Soil by Hand Sieving. Available online: https://www.nrcs.usda.gov/Internet/FSE_DOCUMENTS/nrcs142p2_050967.pdf (accessed on 21 September 2022).
- Wang, L.; Zhang, Y.; Jia, J.; Zhen, Q.; Zhang, X. Effect of Vegetation on the Flow Pathways of Steep Hillslopes: Overland Flow Plot-Scale Experiments and Their Implications. CATENA 2021, 204, 105438. [Google Scholar] [CrossRef]
- Pollen, N.; Simon, A. Estimating the Mechanical Effects of Riparian Vegetation on Stream Bank Stability Using a Fiber Bundle Model. Water Resour. Res. 2005, 41, W07025. [Google Scholar] [CrossRef]
- Grimshaw, R.G.; Helfer, L. Vetiver Grass for Soil and Water Conservation, Land Rehabilitation, and Embankment Stabilization: A Collection of Papers and Newsletters Compiled by the Vetiver Network; The World Bank: Washington, DC, USA, 1995. [Google Scholar]
- Yoon, P.K. Important Biological Considerations in Use of Vetiver Grass Hedgerows (VGHR) for Slope Protection and Stabilisation. In Vegetation and Slopes; Institution of Civil Engineers: London, UK, 1995; pp. 212–221. [Google Scholar]
- Zhang, S.; Zhang, J.; Liu, Y.; Liu, Y.; Wang, Z. The Effects of Vegetation Distribution Pattern on Overland Flow. Water Environ. J. 2018, 32, 392–403. [Google Scholar] [CrossRef]
- Tinoco, R.O.; San Juan, J.E.; Mullarney, J.C. Simplification Bias: Lessons from Laboratory and Field Experiments on Flow through Aquatic Vegetation. Earth Surf. Process. Landf. 2020, 45, 121–143. [Google Scholar] [CrossRef]
- Nicosia, A.; Di Stefano, C.; Pampalone, V.; Palmeri, V.; Ferro, V.; Polyakov, V.; Nearing, M.A. Testing a Theoretical Resistance Law for Overland Flow under Simulated Rainfall with Different Types of Vegetation. CATENA 2020, 189, 104482. [Google Scholar] [CrossRef]
- Li, C.; Pan, C. Overland Runoff Erosion Dynamics on Steep Slopes with Forages under Field Simulated Rainfall and Inflow. Hydrol. Process. 2020, 34, 1794–1809. [Google Scholar] [CrossRef]
- Zhuang, X.; Wang, W.; Ma, Y.; Huang, X.; Lei, T. Spatial Distribution of Sheet Flow Velocity along Slope under Simulated Rainfall Conditions. Geoderma 2018, 321, 1–7. [Google Scholar] [CrossRef]
- Zaimes, G.Ν.; Tamparopoulos, A.E.; Tufekcioglu, M.; Schultz, R.C. Understanding Stream Bank Erosion and Deposition in Iowa, USA: A Seven Year Study along Streams in Different Regions with Different Riparian Land-Uses. J. Environ. Manag. 2021, 287, 112352. [Google Scholar] [CrossRef] [PubMed]
- Machado, L.; Holanda, F.S.R.; da Silva, V.S.; Maranduba, A.I.A.; Lino, J.B. Contribution of the Root System of Vetiver Grass towards Slope Stabilization of the São Francisco River. Semin. Cienc. Agrar. 2015, 36, 2453–2463. [Google Scholar] [CrossRef][Green Version]
- Fitzjohn, C.; Ternan, J.L.; Williams, A.G. Soil Moisture Variability in a Semi-Arid Gully Catchment: Implications for Runoff and Erosion Control. Catena 1998, 32, 55–70. [Google Scholar] [CrossRef]
- Polyakov, V.; Lal, R. Modeling Soil Organic Matter Dynamics as Affected by Soil Water Erosion. Environ. Int. 2004, 30, 547–556. [Google Scholar] [CrossRef]
- Polyakov, V.O.; Lal, R. Soil Organic Matter and CO2 Emission as Affected by Water Erosion on Field Runoff Plots. Geoderma 2008, 143, 216–222. [Google Scholar] [CrossRef]
- Williams, J.R. Sediment-Yield Prediction with Universal Equation Using Runoff Energy Factor. In Present Prospect. Technol. Predict. Sediment Yield Sources 1975; US Department of Agriculture, Agriculture Research Service: Washington DC, USA, 1975; pp. 244–252. [Google Scholar]


| Species | Plot | Planting Date | Termination Date |
|---|---|---|---|
| Juniper 1 | 1 | May 2020 | August 2022 |
| Vetiver | 2 | May 2020 | August 2022 |
| Fescue | 3 | May 2020 | August 2022 |
| Maidenhair Fern | 4 | May 2020 | July 2021 |
| Hairy Vetch | 5 | May 2020 | April 2021 |
| Juniper 2 and Fescue | 4 | July 2021 | August 2022 |
| Switchgrass | 5 | April 2021 | August 2022 |
| Species | Position | Slope (90% CI) | R2 | p-Value |
|---|---|---|---|---|
| Juniper | Upslope 1 | 0.018 (0.009, 0.026) | 0.28 | <0.01 |
| Juniper | Midslope | 0.006 (−0.001, 0.013) | 0.09 | 0.13 |
| Juniper | Downslope 2 | −0.020 (−0.031, −0.009) | 0.29 | <0.01 |
| Fescue | Upslope | 0.011 (−0.004, 0.026) | 0.05 | 0.22 |
| Fescue | Midslope 2 | −0.007 (−0.013, −0.001) | 0.16 | 0.04 |
| Fescue | Downslope 1 | 0.013 (0.006, 0.021) | 0.30 | <0.01 |
| Vetiver | Upslope | 0.001 (−0.005, 0.007) | 0.00 | 0.76 |
| Vetiver | Midslope 1 | 0.011 (0.000, 0.021) | 0.11 | 0.09 |
| Vetiver | Downslope 1 | 0.020 (0.014, 0.027) | 0.36 | <0.01 |
| Species | Upslope (kg/m3) | Downslope (kg/m3) | Mean (kg/m3) |
| Juniper | 0.65 | 0.24 | 0.45 |
| Fescue | 1.33 | 1.23 | 1.28 |
| Vetiver | 4.00 | 3.51 | 3.75 |
Publisher’s Note: MDPI stays neutral with regard to jurisdictional claims in published maps and institutional affiliations. |
© 2022 by the authors. Licensee MDPI, Basel, Switzerland. This article is an open access article distributed under the terms and conditions of the Creative Commons Attribution (CC BY) license (https://creativecommons.org/licenses/by/4.0/).
Share and Cite
Asima, H.; Niedzinski, V.; O’Donnell, F.C.; Montgomery, J. Comparison of Vegetation Types for Prevention of Erosion and Shallow Slope Failure on Steep Slopes in the Southeastern USA. Land 2022, 11, 1739. https://doi.org/10.3390/land11101739
Asima H, Niedzinski V, O’Donnell FC, Montgomery J. Comparison of Vegetation Types for Prevention of Erosion and Shallow Slope Failure on Steep Slopes in the Southeastern USA. Land. 2022; 11(10):1739. https://doi.org/10.3390/land11101739
Chicago/Turabian StyleAsima, Homayra, Victoria Niedzinski, Frances C. O’Donnell, and Jack Montgomery. 2022. "Comparison of Vegetation Types for Prevention of Erosion and Shallow Slope Failure on Steep Slopes in the Southeastern USA" Land 11, no. 10: 1739. https://doi.org/10.3390/land11101739
APA StyleAsima, H., Niedzinski, V., O’Donnell, F. C., & Montgomery, J. (2022). Comparison of Vegetation Types for Prevention of Erosion and Shallow Slope Failure on Steep Slopes in the Southeastern USA. Land, 11(10), 1739. https://doi.org/10.3390/land11101739