Article

Variations in the Distribution and Genetic Relationships among Luciola unmunsana Populations in South Korea

1
Department of Life Sciences, College of Natural Science, Yeungnam University, Gyeongsan 38541, Korea
2
Research Center for Endangered Species, National Institute of Ecology, Yeongyang 36531, Korea
*
Author to whom correspondence should be addressed.
Land 2021, 10(7), 730; https://doi.org/10.3390/land10070730
Submission received: 13 May 2021 / Revised: 2 July 2021 / Accepted: 8 July 2021 / Published: 12 July 2021

Abstract

:
The firefly species Luciola unmunsana was first discovered on the Unmunsan Mountain in Cheongdo-gun, Gyeongsangbuk-do, South Korea and consequently named after the mountain. The population and habitats of this once-abundant species have recently decreased significantly due to light and environmental pollution caused by industrialization and urbanization. This study investigated the distribution and density of L. unmunsana around the ecological landscape conservation area of the Unmunsan Mountain. Additionally, we conducted molecular experiments on regional variations, genetic diversity and phylogenetic relationships among the various populations of L. unmunsana in South Korea. The genetic relationships among populations were also analyzed using mitochondrial DNA by collecting 15 male adults from each of the 10 regions across South Korea selected for analysis. Differences were observed between populations in the east, west and south of the Baekdudaegan Mountain Range. The firefly populations collected from the eastern region, which included Gyeongsang-do, showed a close genetic relationship with fireflies collected from the Unmunsan Mountain. Thus, the findings of this study can be used as baseline data for re-introducing L. unmunsana to the Unmunsan Mountain.

1. Introduction

Urban population growth and accompanying urban expansion have rapidly progressed in the Korean Peninsula since the end of the Korean War in 1953 [1]. This rapid urbanization has played a role in environmental pollution and habitat modification in South Korea [2]. Habitat loss and light pollution are known drivers of insect decline [3,4,5]. In particular, firefly populations and their habitats have considerably decreased due to artificial light [3,4,5,6], land-use changes [3], use of pesticides [4,7,8] and habitat modification [9] caused by rapid industrialization and urbanization [10]. Although fireflies were common insect species in South Korea several decades ago, their current numbers have become severely limited as a result of habitat modification by urbanization [11].
Only eight firefly species have been recorded in the Korean Peninsula [12], while they constitute more than 2000 species in 100 genera worldwide [13]. Three species are recognized in Korea in the genus Luciola of Luciolinae: L. lateralis, L. unmunsana and L. papariensis [14]. Among them, L. unmunsana Doi 1931, is a species endemic to Korea [15]. It was first discovered on Mt. Unmun in 1931 by the Japanese scholar Doi and has been named after the mountain [15]. Several genetic studies using luciferase genes showed that L. papariensis and L. unmunsana were the same species [16,17]. Phylogenetic studies of fireflies in Korea and Japan using luciferase and mitochondrial cytochrome oxidase I (COI) genes confirmed that the two species were synonymous [18,19,20]. L. unmunsana and L. papariensis are nearly identical morphologically [14,21]. Kim et al. [20] suggested that L. papariensis and L. unmunsana are not different species because the pronotal semicircular speckle is polymorphic within species and sometimes differs between species. Kang [22] also pointed out that L. papariensis may be the same as L. unmunsana, or at least may not be distributed in South Korea based on topotypical specimens of L. unmunsana with the blackish semicircular speckle on the pronotum and collected from the type locality, Mt. Unmun [14].
According to two year-long research projects focused on L. unmunsana [23,24], it was revealed that the firefly has a one-year life cycle and lives as a larva for the most of its life, followed by the adult stage, which lasts only for approximately two weeks. The adults are normally active from late May to mid-July and their time of appearance varies depending on the altitude and climate of the habitat. Male and female adults show sexual dimorphism in shape. Males have two light emitters at the end of the abdominal segment, while females have only one. Furthermore, male adults can fly using their elytra and hind wings, but females cannot fly because their hind wings are functionally degenerated. This flightless morph in females impacts their ability to disperse [25].
Because of advances in sequencing and computational technologies, DNA sequences have become the major source of new information for advancing our understanding of evolutionary and genetic relationships [26]. Several types of DNA sequences have been employed for molecular phylogenetics and population genetics [27]. The mitochondrial cytochrome oxidase I gene (COI) has often been used to identify genetic variations within a species [28,29,30,31], phylogenic relationships [14,32,33] and the rate of evolution [34,35]. The mitochondrial cytochrome oxidase II gene (COII) has been used successfully to study population genetic structure and population history of a wide range of insect species [36,37,38,39]. The mitochondrial 16s rDNA sequence has been commonly used to clarify interspecific or intraspecific variations [28,40,41,42].
We hypothesized the occurrence of genetic variations among the L. unmunsana populations due to the flightless morphs in females, depending on the presence of geographical barriers between local populations (e.g., rivers, mountains). In this study, we investigated the spatial distribution of L. unmunsana populations and performed DNA sequencing using COII and 16s rDNA genes of L. unmunsana to identify the geographical variations among its populations.

2. Materials and Methods

2.1. Sampling Sites for L. unmunsana

The distribution of L. unmunsana populations were surveyed for three years (2012 to 2014) from May to July, including one year of preliminary survey in 2012 before confirming the exact study locations [23,24]. We chose 10 sampling regions: Jeju Island; Busan city; Gyeongsan-si, Mt. Unmun and Cheongdo-gun in Gyeongsangbuk-do; Goesan-gun and Okcheon-gun in Chungcheongbuk-do; Asan-si in Chungcheongnam-do; Jangseong-gun in Jeollanam-do; and Namyangju-si in Gyeonggi-do (Figure 1). All L. unmunsana individuals in these areas were confirmed to have an orange-red color pattern without a blackish speckle on the pronotum (Figure 2). In each region, a line census was conducted from 21:00 to 24:00 local time by two or more technicians with a mechanical counter (VA-1100HC) to assess the firefly population in the area. From this data, population averages were determined. Target areas were mapped using ArcMap ver. 10.1, as shown in in Figure 1. Soil organic matter and atmospheric humidity were measured to describe L. unmunsana’s preferred habitat. Soil was sampled at four major sites (Mt. Unmun, Jeju Island, Pusan and Namyangju) which were well known for L. unmunsana habitat. The soil organic matter in each sample was determined using the process described by Heiri et al. [43]. We also used a hygrometer (DT-172, Sunshi Process Systems, Deccan gymkhana pune, India) to monitor atmospheric humidity at three major sites (Mt. Unmun, Igidae in Busan and Hannam-ri in Jeju).

2.2. DNA Extraction

Fifteen male adults were sampled for genetic analysis from each of the 10 regions (Table 1). The collected adults were first immersed in distilled water (DW) at the site for 2 h to remove ethanol. Subsequently, the samples were finely ground using a tissue homogenizer and BioMasher II Grinder (BIOFACT Inc., Daejeon, Korea) to completely homogenize the tissues. This process was performed using the HiGeneTM Genomic DNA Prep Kit for Animal Tissue (BIOFACT Inc., Daejeon, Korea). DNA concentrations from the samples were checked using electrophoresis (Takara Bio Inc., Shiga, Japan) on a 1.5% agarose gel.

2.3. Sequencing

The extracted DNA was diluted 10 times for sequence amplification using the polymerase chain reaction (PCR) process. Subsequently, 1.0 µm DNA template was amplified using a 10× PCR buffer, 2.5 mM dNTP, 5 U Taq (DNA Polymerase), Band Doctor solution, 10 pmole primer set (TK2-J-3037, TK-N-3785/LR-J-12887-1, LR-N-13398-1) and rinsed thrice with DW. The primers were selected based on the studies of Suzuki and Kim [18,44,45]. Furthermore, some sequences were modified for 16s rRNA analysis (Table 2).
The conditions of the PCR process were as follows: pre-denaturation at 94 °C for 5 min, denaturation at 94 °C for 1 min, annealing at 60 °C for 1 min and extension at 72 °C for 1 min. These steps were repeated 30 times. In addition, a final extension at 72 °C for 7 min was followed by cooling at 4 °C for 10 min. The amplified PCR products were loaded on a 1.5% agarose gel, mixed with an eco-dye and checked under UV light. Samples which exhibited faint or invisible bands during electrophoresis were subjected to PCR again and the entire process was repeated. PCR products with normal bands were purified using a HiGeneTM PCR Purification Kit and sequenced along with the primer (Table 2).
Sequences of cytochrome oxidase II (COII) and 16s rRNA genes were sorted and edited using Geneious ver. 5.6.7 and MEGA X. The sequences were identified as L. unmunsana through a basic local alignment search tool (BLAST) by the National Center for Biotechnology Information (NCBI). Haplotype and haplotype diversity were calculated using DNA sp ver. 5. Different sequences were considered as different haplotypes. Accordingly, a network of sequence haplotypes was prepared using TCS ver. 1.21. Additionally, a maximum likelihood (ML) method was created in MEGA X based on the gamma distributed with an invariant sites (G + I) pattern by the general time reversible (GTR) model [46]. To determine the most appropriate base substitution model for the Bayesian inference (BI) method, a model test was performed using Jmodeltest 2.1.7. Then, based on the highest score using the Akaike information criterion (AIC), the HKY + g and the general time reversible models were selected for COII and 16s rRNA analysis, respectively. Based on these models, Bayesian analysis was performed using MrBayes 3.2.3 [47,48] until the value after 3,000,000 generations was less than 0.05. The tree sampling option of each model was analyzed using the HKY + g and GTR models and the log-likelihood value of each model was analyzed using the Markov Chain Monte Carlo (MCMC) method. A phylogenetic tree was generated from the results using FigTree ver. 1.4.4.

2.4. AMOVA Test

The genetic diversity of each population was analyzed through an analysis of molecular variance (AMOVA) test and pairwise differences were determined using Arlequin ver. 3.5.1 [48,49]. Among the 10 selected study sites, the west and east sides of the Baekdudaegan Mountain Range (Figure 1) and Jeju Island were identified to have three separate populations. This was based upon the assumption that the female L. unmunsana’s inability to fly could have separated the populations due to mobility limitations. The genetic variations among groups, among populations within a group and within populations were determined using the standard AMOVA test. Finally, genetic distances between haplotypes were assessed based on pairwise differences.

3. Results and Discussion

3.1. Population Density of L. unmunsana

Surveys during two consecutive years (2013 and 2014) showed that several villages in the Jeju island (e.g., Cheongsu and Hannam) in South Korea had relatively higher L. unmunsana populations. Cheongsu had the largest population counts (452 in 2013, 327 in 2014) during 100-m line censuses. Outside of the Jeju island, Okcheon had the largest L. unmunsana inland population. There, 144 individuals were counted during the 100-m line census of 2013. Though Mt. Unmun was famous as type locality for L. unmunsana, populations there were lower than at other locations (7 to 12 individuals in 2013 and 4 to 28 individuals in 2014). Gyeongsan and Jangseong had slightly higher populations in a one-year, 100-m census with over 70 individuals counted at both areas (Table 3 and Figure 3).
We found that every site having a relatively large L. unmunsana population (e.g., three areas on Jeju Island) had more organic matter in the soil. Results of soil organic matter sample analyses from several sites showed that three regions in Jeju had higher soil organic matter (Table 4) than other regions (including Unmun Mt., Sinseondae and Namyangju). This suggests that L. unmunsana prefers soils abundant in organic matter. Furthermore, they appear to prefer topsoil with a pronounced organic litter layer.
The field survey also revealed that preferred habitats of L. unmunsana included forest edges with abundant water resources such as a lake or continuously wet valley (Figure 4). This suggests that humidity, as well as soil organic matter, may be a key factor in habitat preference. However, survival of L. unmunsana populations in regions with steep and/or rough topography (e.g., Mt. Unmun, three regions in Busan, Gyeongsan, etc.) suggests that L. unmunsana can survive regardless of topsoil and humidity conditions. The population occurrence of L. unmunsana is along the Mt. Unmun’s biggest watershed where there is a continuously wet valley that contributes humidity for its habitat, even without significant soil organic matter (Figure 4h). Three regions in Busan (Igidae, Sinseondae and Taejongdae) also supported small populations of L. unmunsana despite having less than ideal soil and topographic conditions. These regions receive moist air carried by sea winds from the East Sea (Figure 4c).
Though there is no major river or lake on Jeju Island, the humidity derived from plentiful surface water running through a wide buffer strip along Mt. Halla (Figure 4g) reliably substitutes for the humidity otherwise associated with a continuously wet valley (Figure 4a–f,h). As Figure 5 shows, the three major habitats for L. unmunsana (Okcheon and Mt. Unmun for inland conditions and Jeju for island conditions) had relatively high daily mean humidity levels.

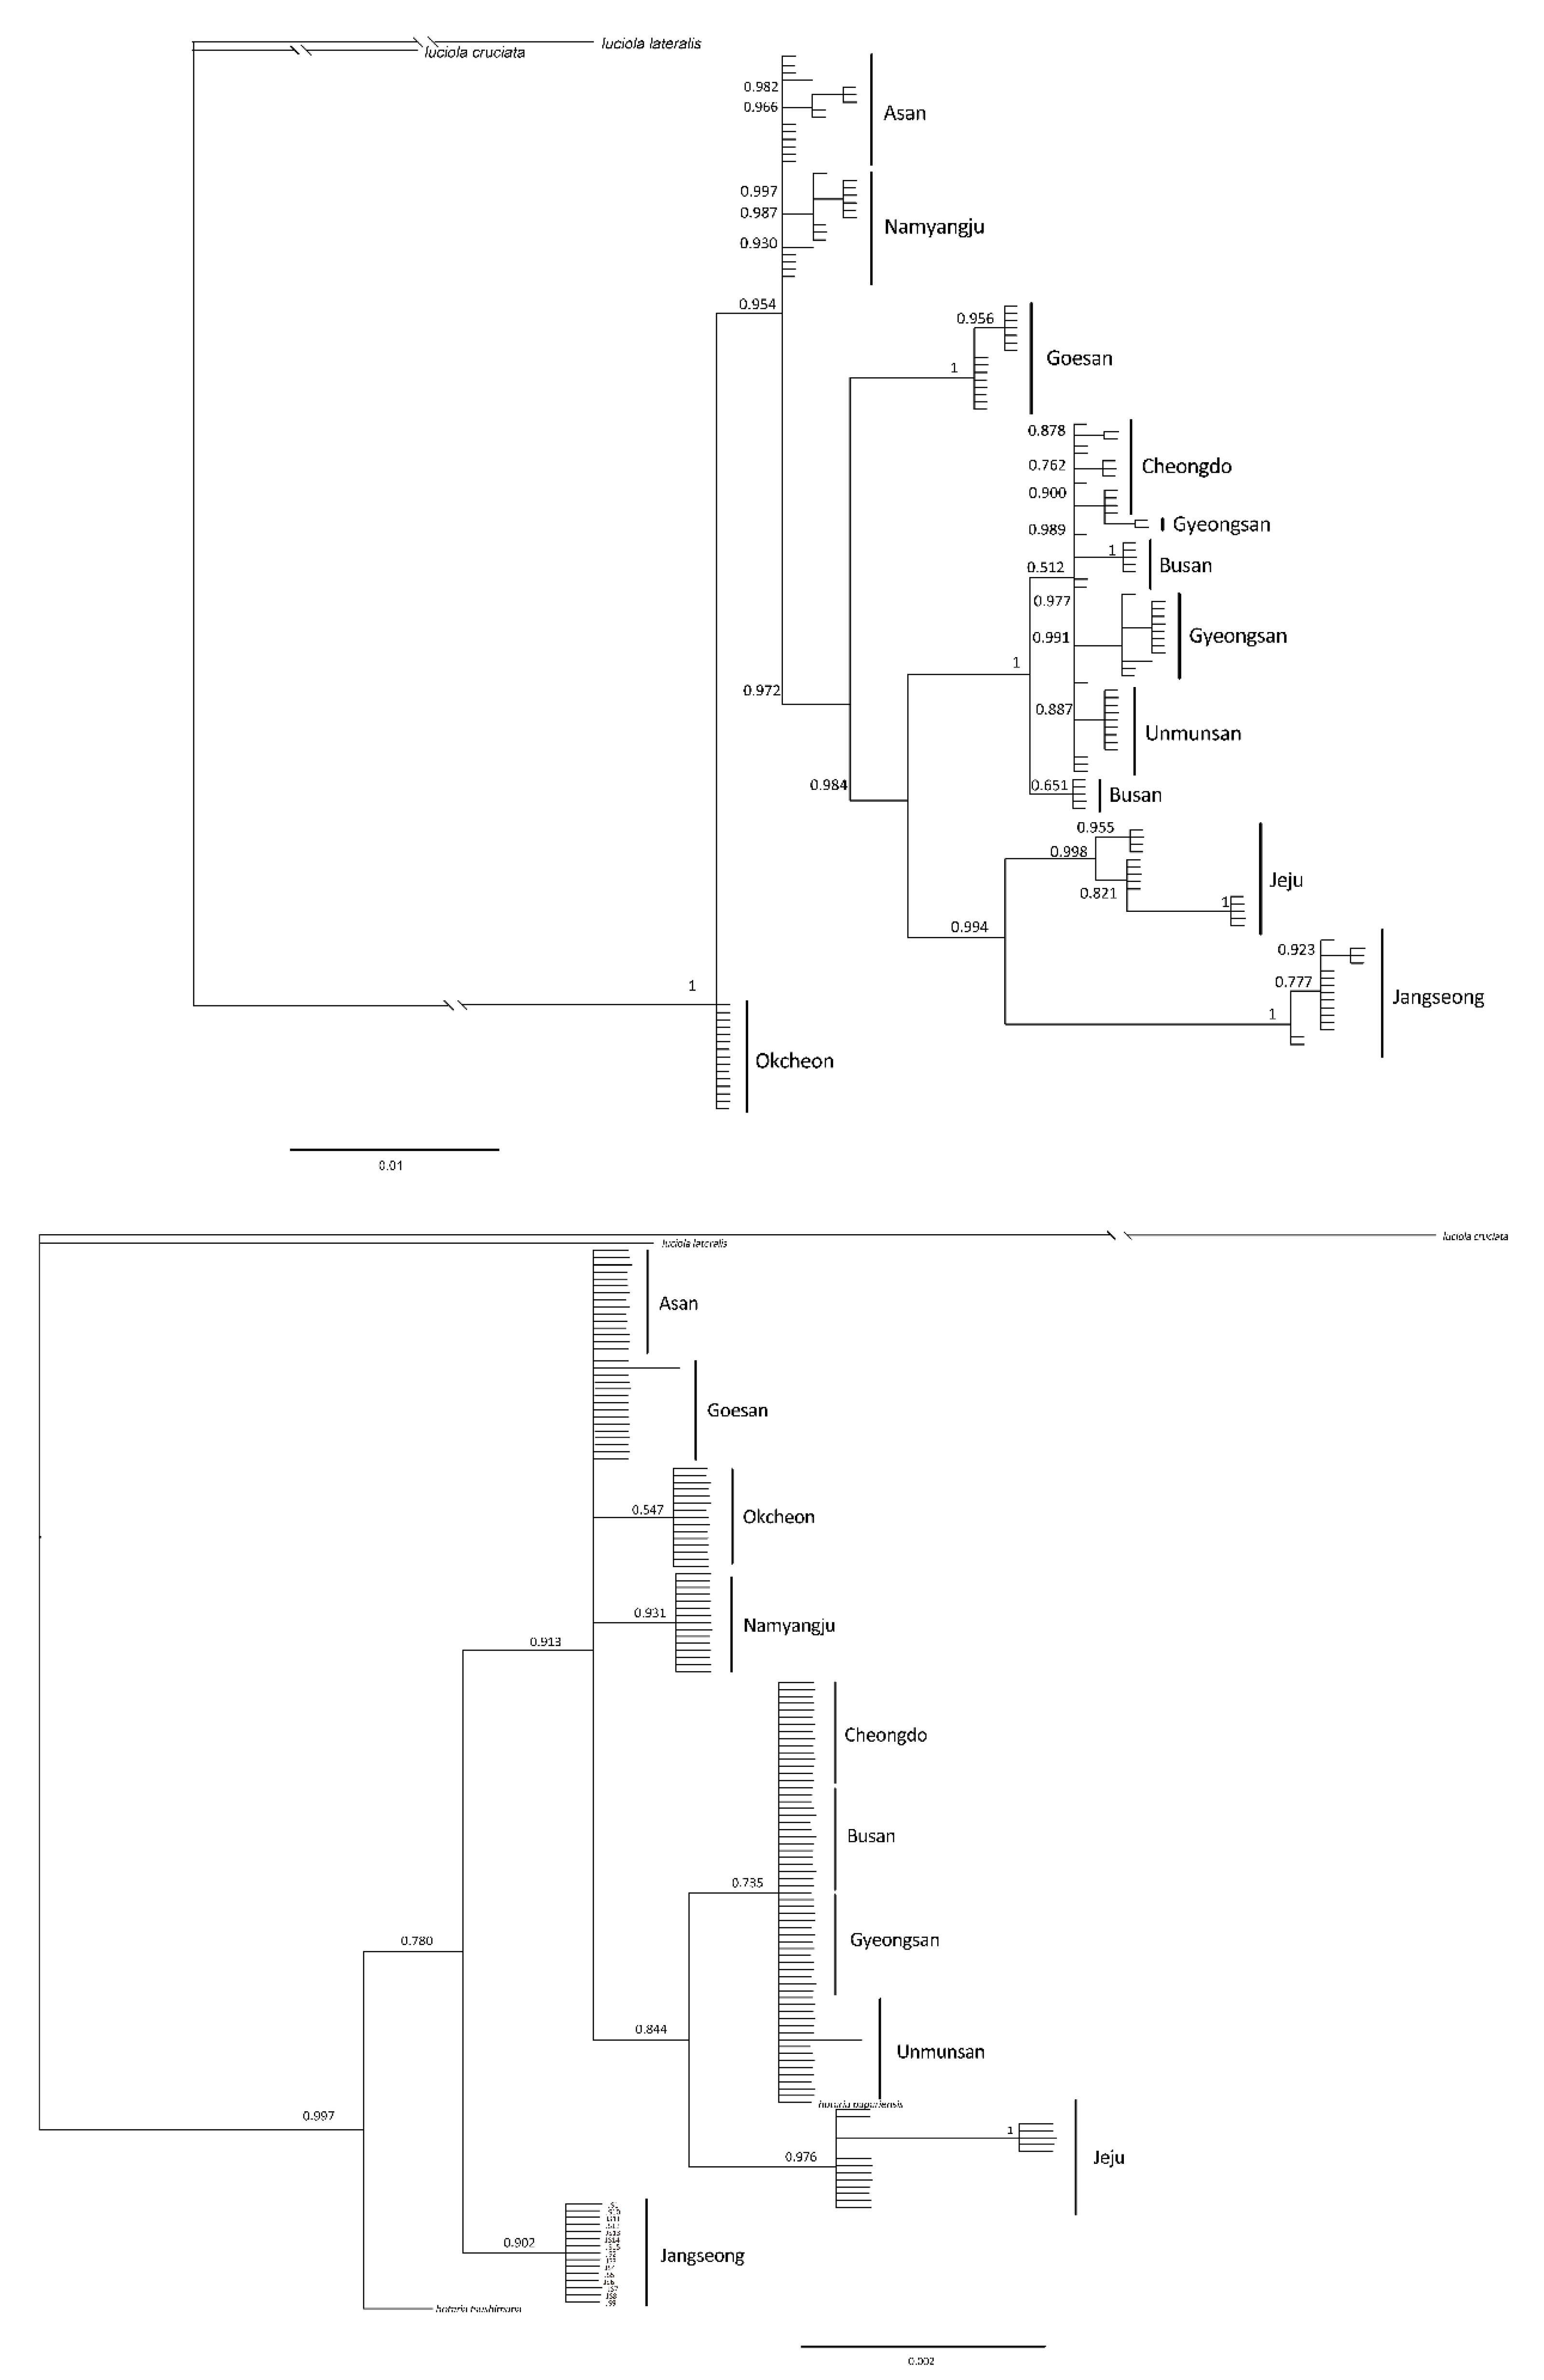
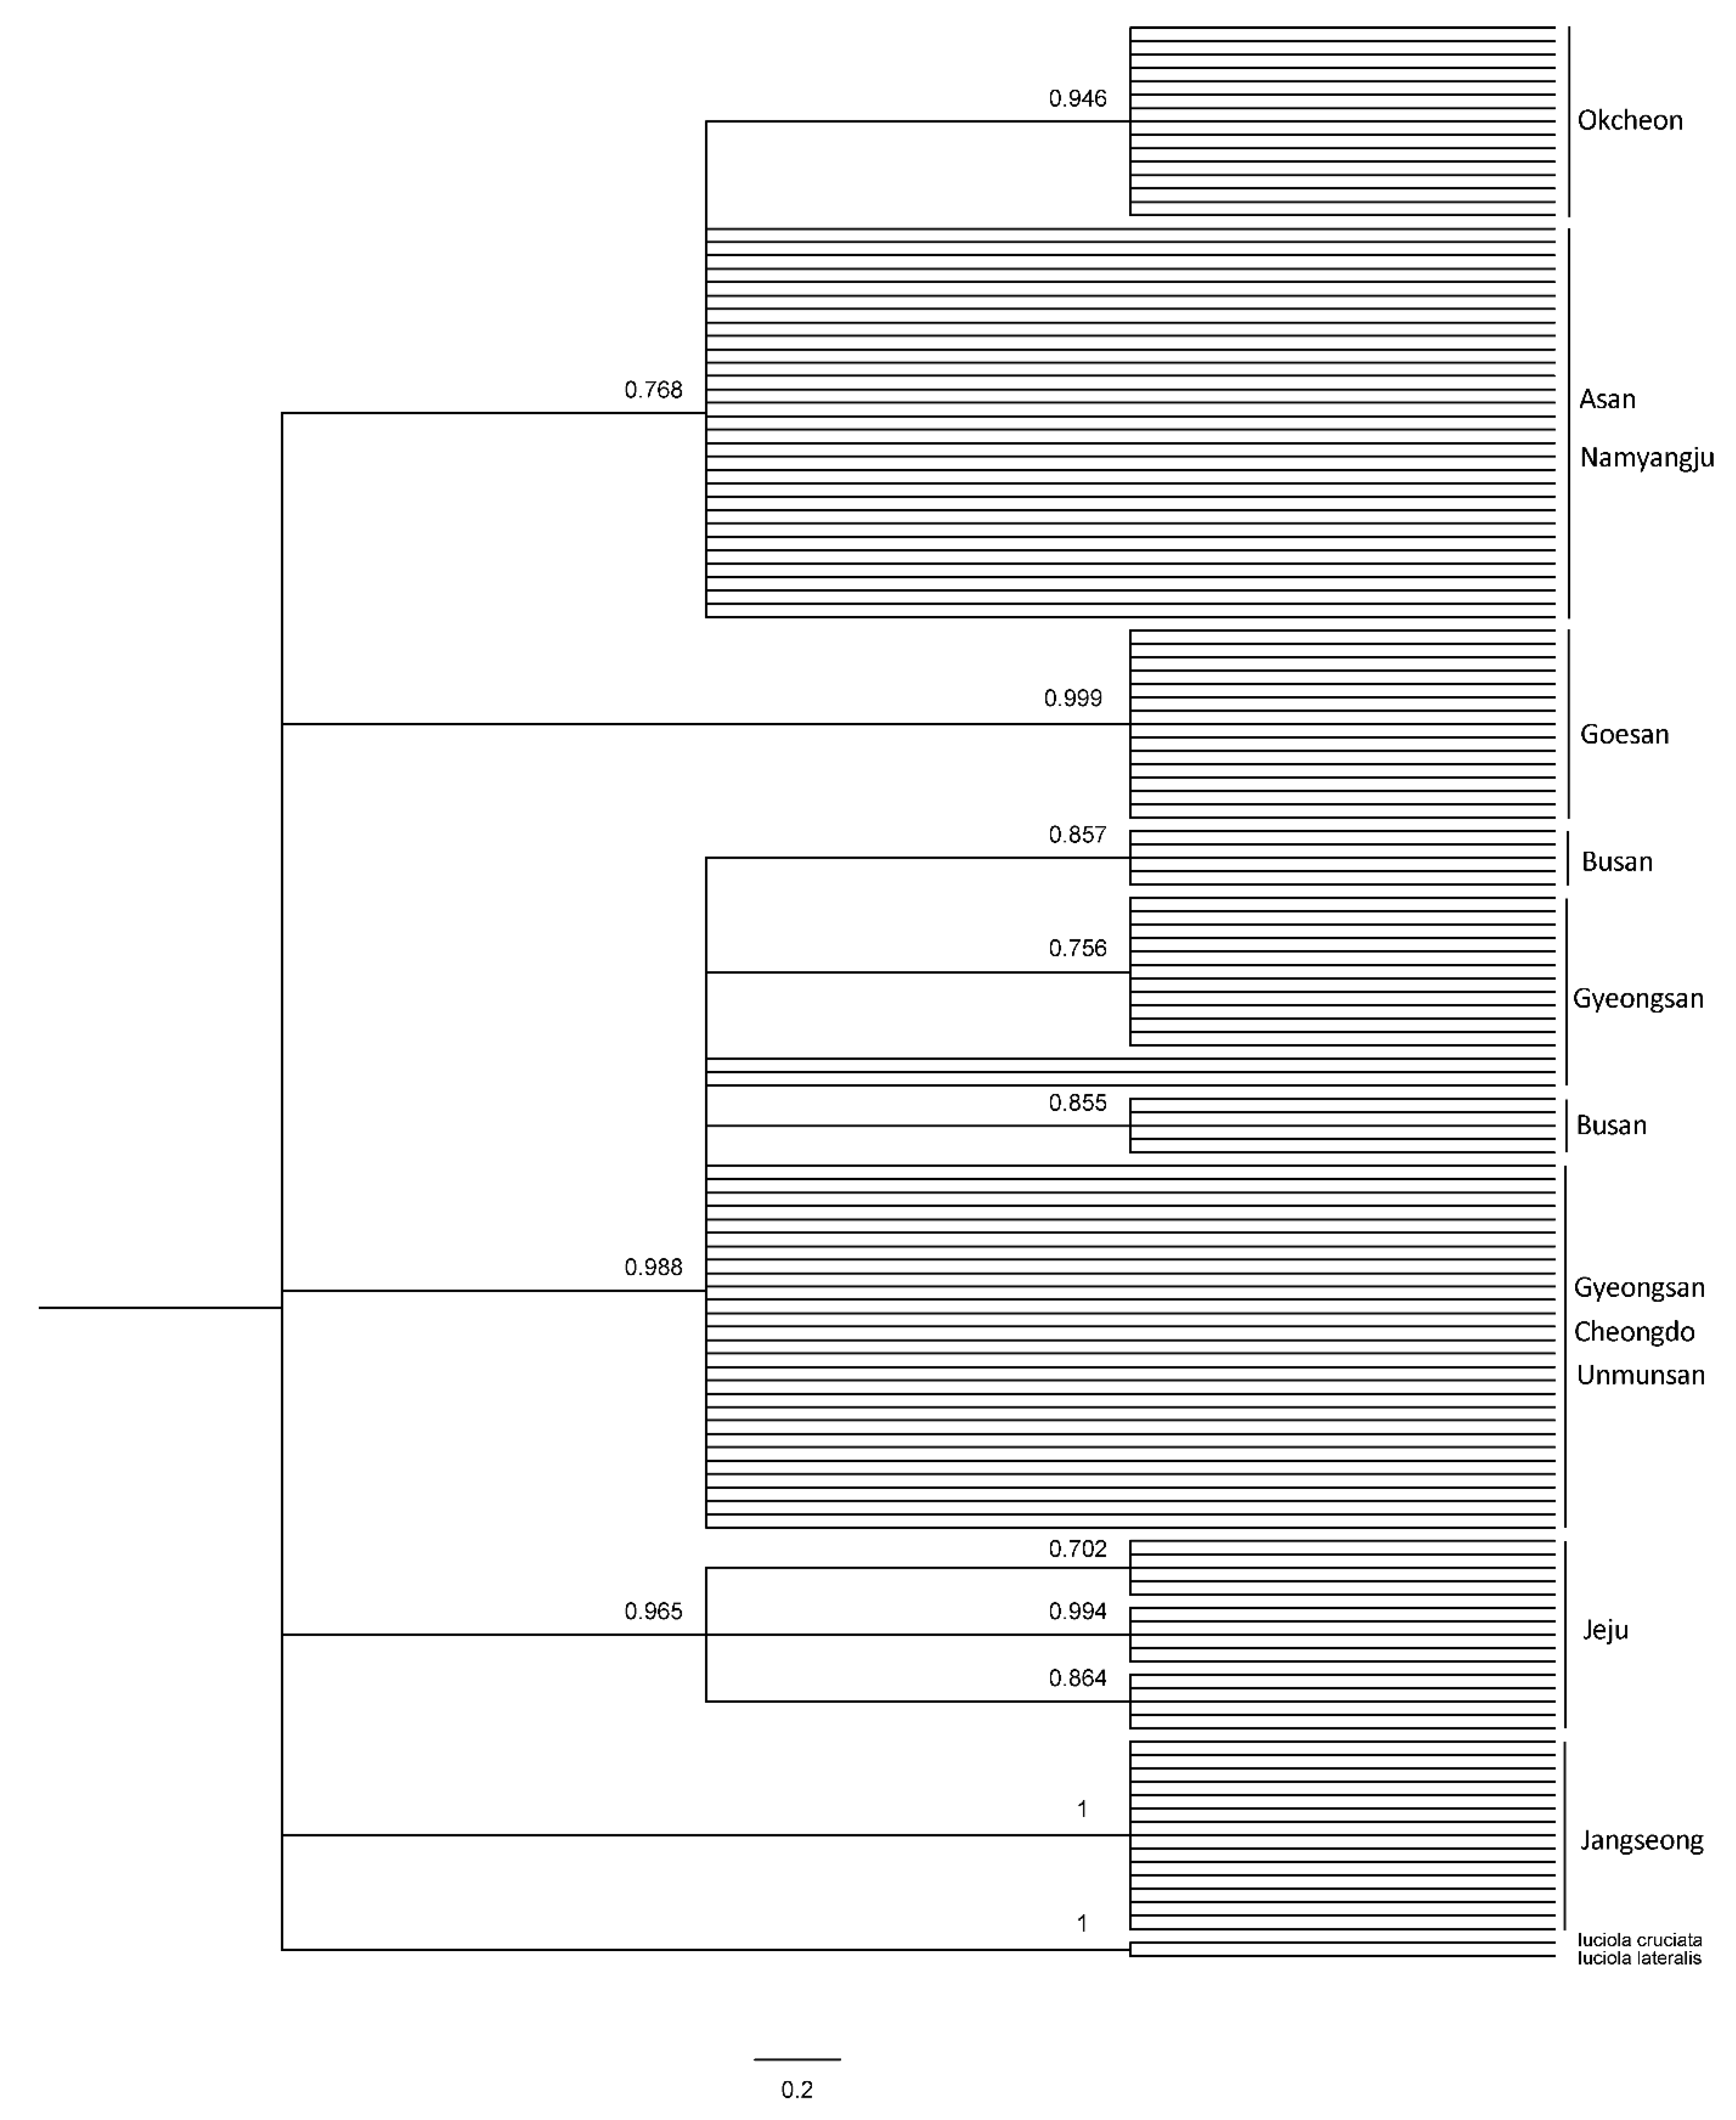
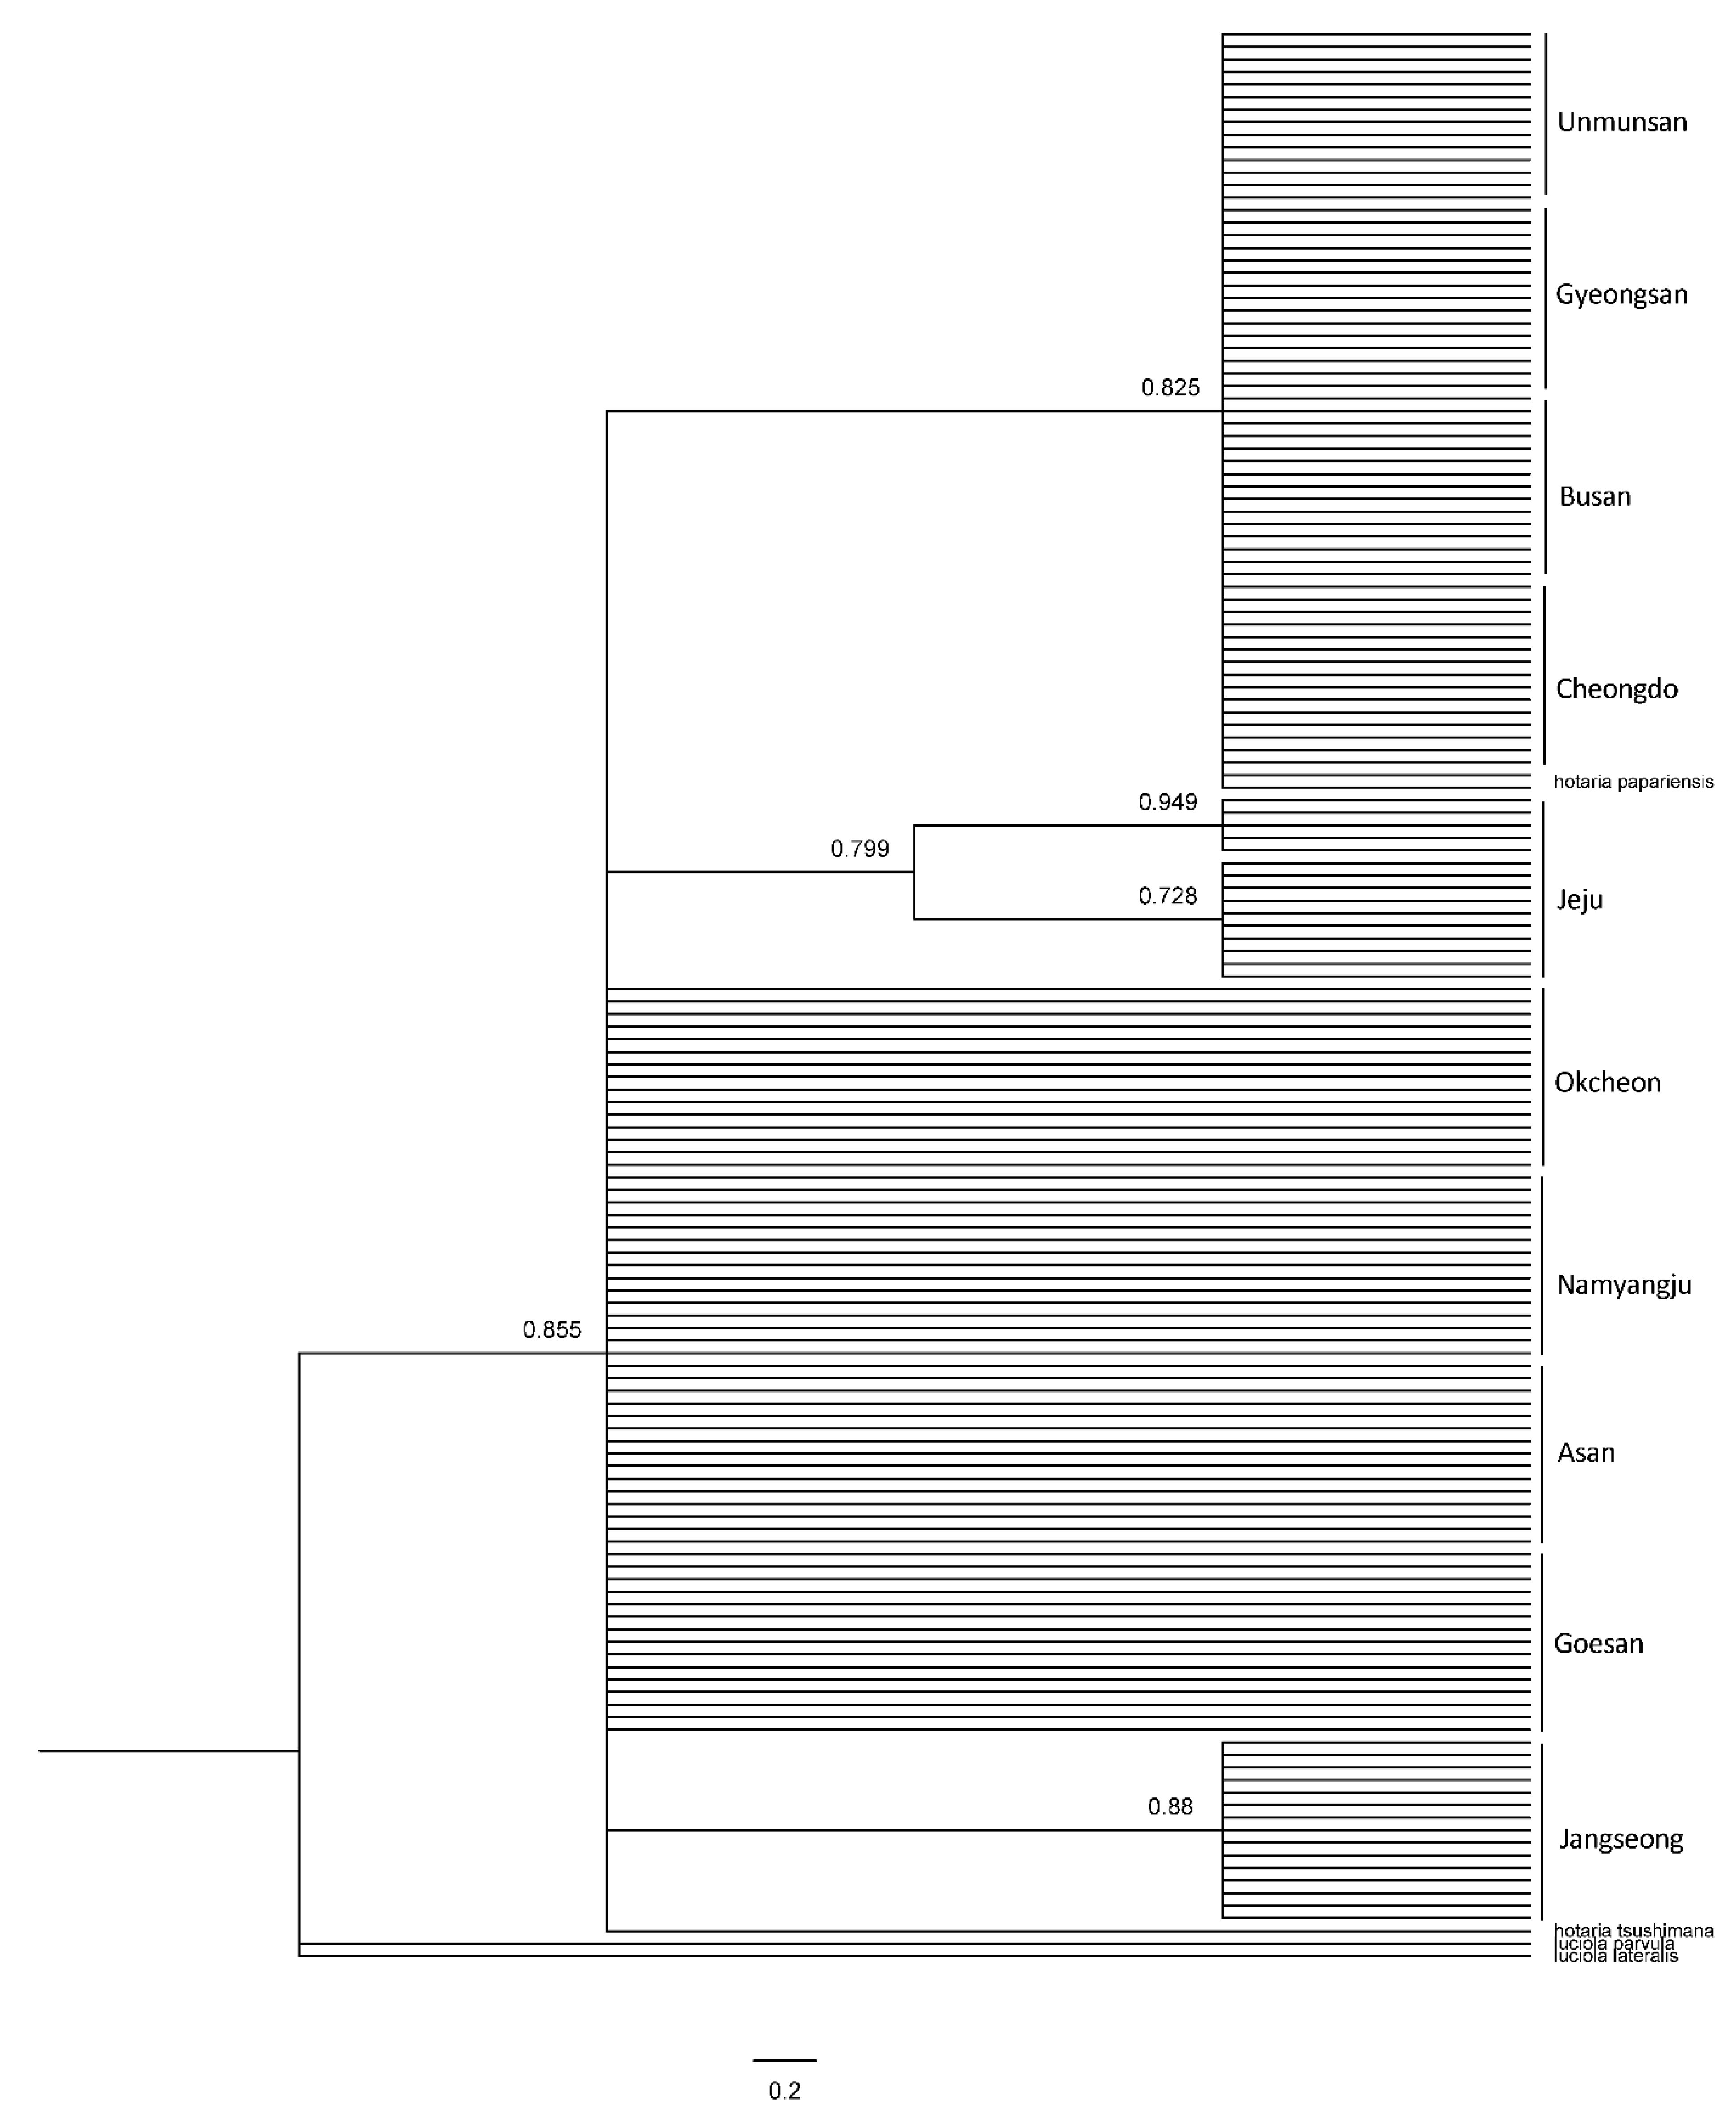
3.2. Genetic Analysis

PCR and sequencing were performed on the mitochondrial COII and 16s rRNA genes of 150 L. unmunsana fireflies. Of these, results from 143 and 150 fireflies, respectively, were viable. The species were identified as L. unmunsana through the BLAST search in the NCBI database. Furthermore, COII had a length of 615 bp and 27 haplotypes (H1–H27), while 16s rRNA exhibited a length of 468 bp and 9 haplotypes (H1–H9). A network was developed using TCS 1.21 software. We conducted a systematic analysis using Bayesian inference (BI) methods and maximum likelihood (ML); with L. lateralis, L. cruciata, Hotaria parvula and Hotaria thushimana as outgroups. A network developed using the TCS program with the 27 haplotypes of the COII gene indicated a clear distinction between the populations of Gyeongsang-do, Chungcheong-Gyeonggi, Jeollabuk-do, Jeollanam-do and Jeju Island, separated by the Baekdudaegan Mountain Range (Figure 6). A characteristic of the TCS program is that the populations are not interconnected after the 95% connection limit is exceeded. Therefore, the disconnection between the Jeju Island, Jeollabuk-do, Jeollanam-do, Chungcheong-Gyeonggi and Gyeongsang-do regions in the network indicates that the populations are distinct from one another. Furthermore, small populations around each constellation-shaped population indicated that the firefly populations stabilized after past mutations that occurred within the group. By contrast, although the groups formed around Gyeongsang-do, Chungcheong-do, Gyeonggi-do, Jeollabuk-do, Jeollanam-do and Jeju Island in the network based on the 16s rRNA gene analysis were similar to those observed based on the COII results, no significant differences in the distances between the groups were observed, despite regional distances (Figure 7). The possible reasons for this are as follows: First, due to the differences in the number of haplotypes in the gene, the short 16s rRNA sequence showed a limited number of variations. Second, the frequency of haplotypes shared among the groups in each region was low. The small number of haplotypes shared among the groups, combined with the unique haplotypes in each region, shows that the degree of differentiation in each region had progressed considerably.
The systematic analysis of the haplotypes of the COII and 16s rRNA genes resulted in one group, comprising firefly populations of the Mt. Unmun, Cheongdo-gun, Busan City and Gyeongsan-si in the BI and ML trees, for both COII and 16s rRNA genes, similar to the network results (Figure 8, Figure 9 and Figure 10). Furthermore, every node value in the BI and ML analyses was supported by 70% or higher on the BI and ML trees using the COII and 16s rRNA genes. However, the correlations between the regions in the trees were not distinct because of low genetic variations. A distinct genetic distance was observed in the network generated from haplotype-based analysis of the Jeju Island populations. However, in the ML analyses, the island populations appeared closer to those in the eastern region of Baekdudaegan, which is unlikely. This is because few or no haplotypes were shared by the populations and each population had already undergone genetic variations over previous years, resulting in unique regional haplotypes.

3.3. AMOVA Test

Groups were artificially set up in all the regions based on the network and BI and ML tree methods were used to analyze the genetic variations through the AMOVA test. However, the network results showed that the COII gene was becoming isolated. Hence, four groups were established around the Baekdudaegan Mountain Range: the eastern region (Mt. Unmun, Cheongdo-gun, Gyeongsan-si and Busan City); western region (Goesan-gun, Asan-si, Okcheon-gun and Namyangju-si); southern region (Jangseong-gun); and the Jeju Island, which was established separately. This shows that isolation must have progressed further on the island than in the inland areas. Consequently, the percentage of variation was 69.54% among the groups, 23.9% among populations within groups and 6.47% within populations (Table 5). This suggests that genetic variations between the groups have progressed to some degree, whereas the degree of variation among populations in each group was low. The genetic distance among the groups implied that differentiation was underway as the species had stabilized much earlier. This was similar to the initial assumption of mobility being limited by flightless female adults. The relatively low frequency of genetic variation among populations in each group indicated that the gene transfer rate was low. Pairwise difference analysis showed values close to 0 for Mt. Unmun, Busan City, Cheongdo-gun and Gyeongsan-si. This indicates close genetic distances, whereas the values for the other regions were close to 1, indicating wide genetic distances (Table 6). Because each group had unique haplotypes and few or no haplotypes were shared among the groups, the results of genetic diversity comparisons were marginally significant. Although the genetic distances or the values comparing genetic relationships among the regions were uncertain, the populations genetically closest to those found in the Mt. Unmun ecological landscape conservation area were identified.

4. Conclusions

This study investigated the distributions of L. unmunsana male adults in the major regions of the Korean Peninsula, conducted genetic analysis of the male adults observed in each region and derived genetic relationships among the regional populations.
Among the regions in Korea where L. unmunsana population was detected, the Jeju Island had the highest L. unmunsana population counts, with densities of more than 300 male adults per unit area. Additionally, L. unmunsana appeared in other regions (including Busan City, Okcheon-gun, Gyeongsan-si, Namyangju-si, Jangseong-gun and Asan-si), but their density was approximately 30 to 50 male adults per unit area. L. unmunsana populations were nationally distributed and appeared from late May to mid-July. The time of appearance varied regionally; from late May to mid-July in inland areas and from mid-June to mid-July on the Jeju Island. In particular, the fireflies appeared later on the Jeju Island, although it experiences a warm and humid climate in all seasons. Furthermore, results of genetic analyses indicated a difference in the genetic distance between populations on the Jeju Island and those in inland areas. However, these findings require further investigation.
Genetic analysis of male adults was performed for the 10 regions in South Korea using mitochondrial DNA to analyze the genetic relationships among the L. unmunsana populations. A genetic distance was observed between the east and west sides of the Baekdudaegan Mountain Range. A different genetic distance was observed in the Jeju Island. Because the habitats of fireflies are gradually decreasing, many local governments are attempting to preserve and restore firefly species in South Korea. Thus, establishing clear directions for restoration and introduction of fireflies, to maintain genetic diversity, is important from an ecological perspective.

Author Contributions

Conceptualization, G.-S.J.; methodology, T.-S.K. and K.K.; software, T.-S.K. and K.K.; validation, T.-S.K. and G.-S.J.; formal analysis, G.-S.J.; investigation, G.-S.J.; resources, T.-S.K. and K.K.; data curation, T.-S.K. and K.K.; writing—original draft preparation, T.-S.K., K.K. and G.-S.J.; writing—review and editing, T.-S.K., K.K. and G.-S.J.; visualization, T.-S.K. and K.K.; supervision, G.-S.J.; project administration, G.-S.J.; funding acquisition, G.-S.J. All authors have read and agreed to the published version of the manuscript.

Funding

This research was supported by Yeungnam University Research Grants in 2019.

Institutional Review Board Statement

Not applicable.

Informed Consent Statement

Not applicable.

Data Availability Statement

All of the sample data were gathered in fields and treated by the authors for this article.

Conflicts of Interest

The authors declare no conflict of interest.

References

  1. Cho, K.H.; Lee, D.; Kim, T.; Jang, G. Measurement of 30-year urban expansion using spatial entropy in changwon and gimhae, Korea. Sustainability 2021, 13, 632. [Google Scholar] [CrossRef]
  2. Lee, S.; Miller-Rushing, A.J. Degradation, urbanization, and restoration: A review of the challenges and future of conservation on the Korean Peninsula. Biol. Conserv. 2014, 176, 262–276. [Google Scholar] [CrossRef]
  3. Sánchez-Bayo, F.; Wyckhuys, K.A.G. Worldwide decline of the entomofauna: A review of its drivers. Biol. Conserv. 2019, 232, 8–27. [Google Scholar] [CrossRef]
  4. Lewis, S.M.; Wong, C.H.; Owens, A.C.S.; Fallon, C.; Jepsen, S.; Thancharoen, A.; Wu, C.; De Cock, R.; Novák, M.; López-Palafox, T.; et al. A global perspective on firefly extinction threats. BioScience 2020, 70, 157–167. [Google Scholar] [CrossRef] [Green Version]
  5. Owens, A.C.S.; Cochard, P.; Durrant, J.; Farnworth, B.; Perkin, E.K.; Seymoure, B. Light pollution is a driver of insect declines. Biol. Conserv. 2020, 241, 108259. [Google Scholar] [CrossRef]
  6. Grubisic, M.; Grunsven, R.H.A.; van Kyba, C.C.M.; Manfrin, A.; Hölker, F. Insect declines and agroecosystems: Does light pollution matter? Ann. Appl. Biol. 2018, 173, 180–189. [Google Scholar] [CrossRef]
  7. Hagen, O.; Santos, R.M.; Schlindwein, M.N.; Viviani, V.R. Artificial Night Lighting Reduces Firefly (Coleoptera: Lampyridae) Occurrence in Sorocaba, Brazil. Adv. Entomol. 2015, 3, 24. [Google Scholar] [CrossRef] [Green Version]
  8. Marques, S.M.; Silva, J.E.D. Quantitative analysis of organophosphorus pesticides in freshwater using an optimized firefly luciferase-based coupled bioluminescent assay. Luminescence 2014, 29, 378–385. [Google Scholar] [CrossRef]
  9. Jusoh, W.; Hashim, N.R. The effect of habitat modification on firefly populations at the rembau-linggi estuary, peninsular malaysia. Lampyrid 2012, 2, 149–155. [Google Scholar]
  10. Vaz, S.; Manes, S.; Gama-Maia, D.; Silveira, L.; Mattos, G.; Paiva, P.C.; Figueiredo, M.; Lorini, M.L. light pollution is the fastest growing potential threat to firefly conservation in the atlantic forest hotspot. Insect Conserv. Divers. 2021, 14, 211–224. [Google Scholar] [CrossRef]
  11. Lee, K.; Kim, Y.; Lee, J.; Song, M.; Nam, S. Toxicity of Firefly, Luciola Lateralis (Coleoptera: Lampyridae) to Commercially Registered Insecticides and Fertilizers. Korean J. Appl. Entomol. 2008, 47, 265–272. [Google Scholar] [CrossRef]
  12. The Eontomological Society of Korea; Korean Society of Applied Entomology. Check List of Insects from Korea; Konkuk University Press: Seoul, Korea, 1994; p. 676. [Google Scholar]
  13. Lewis, S.M.; Cratsley, C.K. Flash Signal Evolution, Mate Choice, and Predation in Fireflies. Annu. Rev. Entomol. 2008, 53, 293–321. [Google Scholar] [CrossRef] [PubMed] [Green Version]
  14. Han, T.; Kim, S.; Yoon, H.J.; Gyun Park, I.; Park, H. Evolutionary History of Species of the Firefly Subgenus Hotaria (Coleoptera, Lampyridae, Luciolinae, Luciola) Inferred from DNA Barcoding Data. Contrib. Zool. 2020, 89, 127–145. [Google Scholar] [CrossRef]
  15. Doi, H. A New Species of Luciola from Korea. J. Chosen Nat. Hist. Soc. 1931, 12, 54–55. [Google Scholar]
  16. Choi, Y.S.; Lee, K.S.; Bae, J.S.; Lee, K.M.; Kim, S.R.; Kim, I.; Lee, S.M.; Sohn, H.D.; Jin, B.R. Molecular Cloning and Expression of a cDNA Encoding the Luciferase from the Firefly, Hotaria Unmunsana. Comp. Biochem. Physiol. Part B Biochem. Mol. Biol. 2002, 132, 661–670. [Google Scholar] [CrossRef]
  17. Choi, Y.S.; Bae, J.S.; Lee, K.S.; Kim, S.R.; Kim, I.; Kim, J.G.; Kim, K.Y.; Kim, S.E.; Suzuki, H.; Lee, S.M. Genomic Structure of the Luciferase Gene and Phylogenetic Analysis in the Hotaria-Group Fireflies. Comp. Biochem. Comp. Biochem. Physiol. Part B Biochem. Mol. Biol. 2003, 134, 199–214. [Google Scholar] [CrossRef]
  18. Kim, I.; Lee, S.; Bae, J.; Jin, B.; Kim, S.; Kim, J.; Yoon, H.; Yang, S.; Lim, S.; Sohn, H. Genetic Divergence and Phylogenetic Relationships among the Korean Fireflies, Hotaria Papariensis, Luciola Lateralis, and Pyrocoelia Rufa (Coleoptera: Lampyridae), using Mitochondrial DNA Sequences. Korean J. Appl. Entomol. 2000, 39, 211–226. [Google Scholar]
  19. Lee, S.; Kim, I.; Bae, J.; Jin, B.; Kim, S.; Kim, J.; Yoon, H.; Yang, S.; Lim, S.; Sohn, H. Mitochondrial DNA Sequence Variation of the Firefly, Pyrocoelia Rufa (Coleoptera: Lampyridae), in Korea. Korean J. Appl. Entomol. 2000, 39, 181–191. [Google Scholar]
  20. Kim, I.; Kim, J.G.; Jin, B.R. Phylogenetic Relationships of the Fireflies Co-Occurring in Korean and Japanese Territories Analyzed by Luciferase and Mitochondrial DNA Sequences. Int. J. Ind. Entomol. 2004, 9, 155–165. [Google Scholar]
  21. Kim, M.J.; Park, J.S.; Kim, I. Complete Mitochondrial Genome of the Korean Endemic Firefly, Luciola Unmunsana (Coleoptera: Lampyridae). Mitochondrial DNA Part B 2020, 5, 3165–3167. [Google Scholar] [CrossRef] [PubMed]
  22. Kang, T.W. Cantharioids I (Arthropoda, Insecta, Coleoptera). Insect Fauna Korea 2012, 12, 1–102. [Google Scholar]
  23. Jang, G.; Kim, T.; Kwon, K.; Lee, J.; Kim, A.; Hwang, S.; Kim, J. Research on Ecological Restoration of Luciola Unmunsana (1st Year); Daegu Regional Environment Agency: Daegu, Korea, 2013. [Google Scholar]
  24. Jang, G.; Kim, T.; Kwon, K.; Lee, J.; Kim, A.; Hwang, S.-H.; Kim, J.-H. Research on Ecological Restoration of Luciola Unmunsana (2nd Year); Daegu Regional Environment Agency: Daegu, Korea, 2014. [Google Scholar]
  25. Langellotto, G.A.; Denno, R.F.; Ott, J.R. A Trade-Off between Flight Capability and Reproduction in Males of a Wing-Dimorphic Insect. Ecology 2000, 81, 865–875. [Google Scholar] [CrossRef]
  26. Hajibabaei, M.; Singer, G.A.C.; Hebert, P.D.N.; Hickey, D.A. DNA Barcoding: How it Complements Taxonomy, Molecular Phylogenetics and Population Genetics. Trends Genet. 2007, 23, 167–172. [Google Scholar] [CrossRef]
  27. Tibayrenc, M. Bridging the Gap between Molecular Epidemiologists and Evolutionists. Trends Microbiol. 2005, 13, 575–580. [Google Scholar] [CrossRef]
  28. Prijovic, M.; Skaljac, M.; Drobnjakovic, T.; Zanic, K.; Peric, P.; MarÄic, D.; Puizina, J. Genetic Variation of the Greenhouse Whitefly, Trialeurodes Vaporariorum (Hemiptera: Aleyrodidae), among Populations from Serbia and Neighbouring Countries, as Inferred from COI Sequence Variability. Bull. Entomol. Res. 2014, 104, 357. [Google Scholar] [CrossRef] [PubMed]
  29. Sánchez-Velázquez, E.J.; Santillán-Galicia, M.T.; Novelli, V.M.; Nunes, M.A.; Mora-Aguilera, G.; Valdez-Carrasco, J.M.; Otero-Colina, G.; Freitas-Astúa, J. Diversity and Genetic Variation among Brevipalpus Populations from Brazil and Mexico. PLoS ONE 2015, 10, e0133861. [Google Scholar] [CrossRef] [Green Version]
  30. Sun, P.; Shi, Z.; Yin, F.; Peng, S. Genetic variation analysis of mugil cephalus in china sea based on mitochondrial coi gene sequences. Biochem. Genet. 2012, 50, 180–191. [Google Scholar] [CrossRef] [PubMed]
  31. Xu, Z.; Chen, J.; Cheng, D.; Yong, L.; Frédéric, F. Genetic Variation among the Geographic Population of the Grain Aphid, Sitobion Avenae (Hemiptera: Aphididae) in China Inferred from Mitochondrial COI Gene Sequence. Agric. Sci. China 2011, 10, 1041–1048. [Google Scholar] [CrossRef]
  32. Islam, S.U.; Qasim, M.; Lin, W.; Islam, W.; Arif, M.; Ali, H.; Du, Z.; Wu, Z. Genetic Interaction and Diversity of the Families Libellulidae and Gomphidae through COI Gene from China and Pakistan. Acta Trop. 2018, 182, 92–99. [Google Scholar] [CrossRef] [PubMed]
  33. Pfeiler, E.; Bitler, B.G.; Ramsey, J.M.; Palacios-Cardiel, C.; Markow, T.A. Genetic Variation, Population Structure, and Phylogenetic Relationships of Triatoma Rubida and T. Recurva (Hemiptera: Reduviidae: Triatominae) from the Sonoran Desert, Insect Vectors of the Chagas’ Disease Parasite Trypanosoma Cruzi. Mol. Phylogenet. Evol. 2006, 41, 209–221. [Google Scholar] [CrossRef]
  34. Avise, J.C. Molecular Markers, Natural History and Evolution; Chapman & Hall: New York, NY, USA, 2012. [Google Scholar]
  35. Kang, T.H.; Han, T.M.; Okushima, Y.; Park, H.C. Integrative Taxonomy of Asiopodabrus Fragiliformis (Kang and Kim, 2000) (Coleoptera: Cantharidae) and its Related Species. Zootaxa 2012, 3259, 1–33. [Google Scholar]
  36. Lewter, J.A.; Szalanski, A.L.; Nagoshi, R.N.; Meagher Jr, R.L.; Owens, C.B.; Luttrell, R.G. Genetic Variation within and between Strains of the Fall Armyworm, Spodoptera Frugiperda (Lepidoptera: Noctuidae). Fla. Entomol. 2006, 89, 63–68. [Google Scholar] [CrossRef]
  37. Clements, K.M.; Wiegmann, B.M.; Sorenson, C.E.; Smith, C.F.; Neese, P.A.; Roe, R.M. Genetic Variation in the Myzus Persicae Complex (Homoptera: Aphididae): Evidence for a Single Species. Ann. Entomol. Soc. Am. 2000, 93, 31–46. [Google Scholar] [CrossRef]
  38. Frati, F.; Spinsanti, G.; Dallai, R. Genetic Variation of mtCOII Gene Sequences in the Collembolan Isotoma Klovstadi from Victoria Land, Antarctica: Evidence for Population Differentiation. Polar Biol. 2001, 24, 934–940. [Google Scholar] [CrossRef]
  39. Chen, B.; Harbach, R.E.; Butlin, R.K. Genetic Variation and Population Structure of the Mosquito Anopheles Jeyporiensis in Southern China. Mol. Ecol. 2004, 13, 3051–3056. [Google Scholar] [CrossRef]
  40. Clements, J.; Garcia, M.; Bradford, B.; Crubaugh, L.; Piper, S.; Duerr, E.; Zwolinska, A.; Hogenhout, S.; Groves, R.L. Genetic Variation among Geographically Disparate Isolates of Aster Yellows Phytoplasma in the Contiguous United States. J. Econ. Entomol. 2020, 113, 604–611. [Google Scholar] [CrossRef]
  41. Mrázek, J.; Štrosová, L.; Fliegerova, K.; Kott, T.; Kopečný, J. Diversity of insect intestinal microflora. Folia Microbiol. 2008, 53, 229–233. [Google Scholar] [CrossRef] [PubMed]
  42. Vobis, M.; D’Haese, J.; Mehlhorn, H.; Mencke, N.; Blagburn, B.L.; Bond, R.; Denholm, I.; Dryden, M.W.; Payne, P.; Rust, M.K. Molecular Phylogeny of Isolates of Ctenocephalides Felis and Related Species Based on Analysis of ITS1, ITS2 and Mitochondrial 16S rDNA Sequences and Random Binding Primers. Parasitol. Res. 2004, 94, 219–226. [Google Scholar] [CrossRef]
  43. Heiri, O.; Lotter, A.F.; Lemcke, G. Loss on Ignition as a Method for Estimating Organic and Carbonate Content in Sediments: Reproducibility and Comparability of Results. J. Paleolimnol. 2001, 25, 101–110. [Google Scholar] [CrossRef]
  44. Suzuki, H. Studies on Biological Diversity of Firefly in Japan. Int. J. Ind. Entomol. 2001, 2, 91–105. [Google Scholar]
  45. Suzuki, H.; Sato, Y.; Ohba, N.; Bae, J.; Jin, B.; Sohn, H.; Kim, S. Phylogeographic Analysis of the Firefly, Luciola Lateralis, in Japan and Korea Based on Mitochondrial Cytochrome Oxidase II Gene Sequences (Coleoptera: Lampyridae). Biochem. Genet. 2004, 42, 287–300. [Google Scholar] [CrossRef] [PubMed]
  46. Kimura, M. A Simple Method for Estimating Evolutionary Rates of Base Substitutions through Comparative Studies of Nucleotide Sequences. J. Mol. Evol. 1980, 16, 111–120. [Google Scholar] [CrossRef] [PubMed]
  47. Holsinger, K.E.; Mason-Gamer, R.J. Hierarchical Analysis of Nucleotide Diversity in Geographically Structured Populations. Genetics 1996, 142, 629–639. [Google Scholar] [CrossRef]
  48. Huelsenbeck, J.P.; Ronquist, F. Mrbayes: Bayesian Inference of Phylogenetic Trees. Bioinformatics 2001, 17, 754–755. [Google Scholar] [CrossRef] [PubMed] [Green Version]
  49. Excoffier, L.; Lischer, H.E.L. Arlequin Suite Ver 3.5: A New Series of Programs to Perform Population Genetics Analyses Under Linux and Windows. Mol. Ecol. Resour. 2010, 10, 564–567. [Google Scholar] [CrossRef] [PubMed]
Figure 1. Study sites for L. unmunsana.
Land 10 00730 g001
Figure 2. Views of L. unmunsana male and female adults.
Land 10 00730 g002
Figure 3. Population density of L. unmunsana in South Korea.
Land 10 00730 g003
Figure 4. L. unmunsana habitats with continuously wet valleys (except for Jeju Island).
Land 10 00730 g004
Figure 5. Daily mean atmospheric humidity in June (left) and July (right), 2014.
Land 10 00730 g005
Figure 6. Haplotype network based on the mitochondrial DNA COII sequence of four local L. unmunsana groups.
Land 10 00730 g006
Figure 7. Haplotype network based on the sequence mtDNA 16s rRNA of L. unmunsana.
Land 10 00730 g007
Figure 8. Phylogenetic analysis of 27 mitochondrial COII gene (upper tree) and 9 mitochondrial 16s rRNA gene (under tree) of L. unmunsana. The trees were developed by the Bayesian inference method using the Mrbayes software.
Land 10 00730 g008
Figure 9. Phylogenetic analysis of 27 mitochondrial COII gene of L. unmunsana. The tree was developed by the ML method using the MEGA software.
Land 10 00730 g009
Figure 10. Phylogenetic analysis of 9 mitochondrial 16s rRNA gene of L. unmunsana. The tree was developed by the ML method using the MEGA software.
Land 10 00730 g010
Table 1. L. unmunsana sampling information used for genetic analysis.
No.Sampling Site
(Population)
Sampling DateHaplotypePCR Success
16s rRNA (9)
Hd: 0.9566
COII (28)
Hd: 0.9566
16s rRNACOII
1Asan-si1514.05.31H1H1, H2
H3. H4
1515
2Cheongdo-gun1514.06.08H2H5, H6
H7, H8
1514
3Busan cityIgidae513.06.04
14.06.05
H2H9
H10
1512
Sinseondae513.06.19
14.06.05
Taejongdae513.06.19
14.06.05
4Gyeongsan-si1514.05.30H2H19, H20
H21, H22
1514
5Mt. Unmun1513.06.10
14.05.29
14.07.14
14.07.16
14.07.18
H2
H9
H281513
6Namyangju-si1513.06.19H8H24, H25
H26, H27
1515
7Okcheon-gun1513.06.08
14.05.31
H7H231515
8Goesan-gun1514.05.31H1
H6
H17
H18
1515
9Jeju IslandCheongsu513.07.08
14.06.26
H3
H4
H11
H12
H13
1515
Hannam513.06.24
14.06.27
Seonheul513.06.26
14.06.29
10Jangseong-gun1514.06.05H5H14, H15
H16
1515
Table 2. Primers used in the analysis of genetic relationships.
GeneSequenceReference
COII
TK2-J-30375′-ATGGCAGATTAGTGCAATGG-3′[44,45]
TK-N-37855′-GTTTAAGAGACCAGTACTTG-3′
16s rRNA
LR-J-12887-15′-CCGGTTTAAACTCAGATCATGT-3′[18]
LR-N-13398-15′-TGCCTGTTTATTAAAAACAT-3′
Table 3. Census results of L. unmunsana in South Korea.
No.Observation SitesDate
(2013)
No. of MalesDate
(2014)
No. of Males
1Mt. Unmun6 June 201388 June 20144
29 June 201428
14 June 20131214 July 201414
16 July 20147
18 June 2013718 July 20145
2Cheongdo-gunNo field investigation8 June 201443
3Gyeongsan-siNo field investigation30 May 201478
7 June 201417
3Seonheul-ri (Jeju)26 June 201314129 June 201417
29 June 201381
4Hannam-ri (Jeju)27 June 201325027 June 201497
1 July 201478
5Cheongsu-ri (Jeju)34 June 201345226 June 2014327
28 June 2014289
30 June 2014143
6Okcheon-gun 7 June 201314431 May 201424
7 June 201420
8Igidae (Busan)5 June 2013275 June 201423
10 June 201424
11 June 20147
9Sinseondae (Busan)6 June 2013155 June 201447
10 June 201462
11 June 201447
10Taejongdae (Busan)4 June 2013325 June 201412
11 June 201434
11Namyangju-si19 June 201355No field investigation
12Asan-siNo field investigation31 May 201417
13Jangseong-gunNo field investigation5 June 201478
14Goesan-gunNo field investigation
Table 4. Comparing organic matter and color of soil in the representative habitats of L. unmunsana.
Site NameDWWLILOI
(% wt. loss)
TOCOM
(%)
Soil Color
Cheongsu103.83817.0029.31Brownish black Land 10 00730 i001
Hannam105.15122.9639.58
Seonheul104.44419.7534.05
Mt. Unmun100.441.432.46Grayish yellow Land 10 00730 i002
Igidae101.5156.4711.15Olive brown Land 10 00730 i003
Sinseondae100.883.265.627Yellowish brown Land 10 00730 i004
Namyangju100.330.971.679Dark grayish yellow Land 10 00730 i005
DW: dry weight; WLI: Wt. loss on ignition; LOI (%): loss on ignition; TOC: total organic carbon; OM: organic matter.
Table 5. Hierarchical analysis based on the mitochondrial COII gene.
Source of
Variation
dfSum of SquareVCPVFIST
Among group3698.706.3369.540.754440.00000
Among populations within group6188.312.1823.990.928690.00000
Within populations13378.310.596.470.709600.00098
Total142965.3291100
df = degrees of freedom; VC = variation components; PV = percentage of variation; FI = fixation indices; ST = significance tests.
Table 6. Pairwise differences in the genes among the regional population by the distance method using the mitochondrial COII gene.
SiteCDUMNCBSSDASOCGSJSJJ
CD-
UM0.3777-
NC0.56440.6667-
BS0.31800.46090.5561-
SD0.91590.93920.89540.8807-
AS0.92120.94550.90080.88680.6202-
OC0.96620.98640.94730.93900.89050.8677-
GS0.94960.96910.93240.92200.92860.92620.9785-
JS0.96810.97940.95620.95030.96600.96990.98870.9800-
JJ0.87170.88710.85750.83980.86010.86550.89800.88490.9080-
CD = Cheongdo-gun; UM = Unmunsan Mt.; NC = Gyeongsan-si; BS = Busan City; SD = Namyangju-si; AS = Asan-si; OC = Okcheon-gun; GS = Goesan-gun; JS = Jangseong-gun; JJ = Jeju Island.
Publisher’s Note: MDPI stays neutral with regard to jurisdictional claims in published maps and institutional affiliations.

