Abstract
Improving the ability of the urban rail transit system to cope with rainstorm disasters is of great significance to ensure the safe travel of residents. In this study, a model of the hierarchical relationship of the influencing factors is constructed from the resilience perspective, in order to research the action mechanisms of the influencing factors of urban rail transit stations susceptible to rainstorm disaster. Firstly, the concept of resilience and the three attributes (resistance, recovery, and adaptability) are interpreted. Based on the relevant literature, 20 influencing factors are discerned from the 3 attributes of the resilience of urban rail transit stations. Subsequently, an interpretative structural model (ISM) is utilised to analyse the hierarchical relationship among the influencing factors. The key influencing factors of station resilience are screened out using social network analysis (SNA). Combined with ISM and SNA for analysis, the result shows that the key influencing factors are: “Flood prevention monitoring capability”; “Water blocking capacity”; “Flood prevention capital investment”; “Personnel cooperation ability”; “Emergency plan for flood prevention”; “Flood prevention training and drill”; “Publicity and education of flood prevention knowledge”; and “Regional economic development level”. Therefore, according to the critical influencing factors and the action path of the resilience influencing factors, station managers can carry out corresponding flood control work, providing a reference for enhancing the resilience of urban rail transit stations.
1. Introduction
In China, there have been significant developments due to the constantly prosperous economy and unprecedented urbanisation, making the traffic congestion problem of large cities gradually severe [1]. Nonetheless, urban rail transit, with its advantages of size, speed, comfort, affordable pricing, and environmental benefits [2,3], can sufficiently alleviate the traffic congestion of megacities [4]. Therefore, in the past decade, China has increasingly built more urban rail transit lines. According to the China Association of Metros data in 2020, the route length of urban rail transit in mainland China reached 7978.19 km [5], which is 2.21 times larger than that of Germany, the second-longest route length in the world, measuring 3604.16 km [6].
However, urban rail transit, especially its underground stations, are more vulnerable to disasters caused by heavy rain. Recently, due to extreme weather conditions, such as the frequent occurrence of rainstorms, China has been most seriously affected by rainstorm disasters [7]. Rainstorms are the most common and disaster-prone natural disasters that have the most significant impact, with the broadest range and the highest frequency, on the urban transportation system and have caused substantial economic losses and severe security threats to urban development and public life [4,8]. For instance, on 28 June 2018, the Guangfu station of the Chengdu Metro was hit by heavy rain, resulting in water intrusion into the station, and the station was forced to stop operation. On 21 May 2020, due to heavy rainfall in Guangzhou, the flood water invaded many stations along Guangzhou Metro Line 13, resulting in the shutdown of Line 13, which has affected passengers’ travel. On 20 July 2021, a rare extreme rainstorm occurred, whereby flood water poured onto Zhengzhou Metro Line 5, resulting in a train being besieged by the flood. Following an intense rescue mission, 14 passengers did not survive the disaster.
Therefore, identifying the key influencing factors of the resilience of urban rail transit stations against disasters caused by rainstorms plays a significant role in ensuring the regular operation of the station, which can help station managers to take corresponding protective measures. Previous studies have researched the influencing factors of the resilience of urban rail transit stations against rainstorm disasters from different perspectives, such as comprehensive evaluation, scenario simulation analysis, and flood control measures analysis. For example, Lyu et al. [9] conducted a flood risk assessment on the Guangzhou metro system considering 12 influencing factors, including rainfall, elevation, slope, and metro line density; Yu et al. [10] evaluated the waterlogging risk of Chengdu Metro Line 4 from 6 influencing factors, such as the drainage pipe network, surrounding terrain, and regional situation; and Lyu et al. [11] observed 16 influencing factors, including rainfall, slope, land use type, and river density, to evaluate the waterlogging risk of the Shenzhen metro system. Furthermore, Wang et al. [4] considered 20 influencing factors, such as land subsidence, rainstorm intensity, subway line density, entrance height, and passenger flow, to evaluate the flood risk level of the Beijing subway system. In order to assess the flood risk of the Shanghai metro system, 19 influencing factors, such as the green area ratio, type of exit, drainage capacity, and GDP were considered in the work of Lyu et al. [12]. In the scenario simulation analytical type, Quan et al. [13] focused on the impact of a rainstorm in different return periods on the Shanghai Metro. Lyu et al. [14] analysed the impact of different rainfall intensities on the Shanghai central metro system. Forero-Ortiz et al. [15] simulated the flood water depth on the impact of transport service continuity of Barcelona Metro Line 3. In terms of the analytical type of flood control measures, Aoki et al. [16] analysed the impact of different flood control equipment on the subway station’s flood control capacity and considered the entrance to the underground station as the most affected part of the station by rainstorms.
The above research results mainly analyse the flood risk analysis of urban rail transit stations, primarily focusing on external influencing factors, such as rainfall intensity, entrance attributes, land subsidence, and surrounding terrain, to research the impact of flood disasters on urban rail transit stations. However, there is a lack of research that considers or identifies the relationship of the critical influencing factors of urban rail transit systems. Urban rail transit is a complex system affected by external factors and internal subsystems, making the factors affecting the resilience of urban rail transit stations against rainstorms numerous and complicated [17]. Therefore, it is essential to study its action path and key influencing factors to better analyse the impact of rainstorms on urban rail transit underground stations.
Furthermore, most of the existing studies focus on the stations vulnerable or unable to withstand the adverse effects of rainstorms [18]. Recently, resilience theory is a significant theory in the field of disaster prevention and mitigation, which can be used to explore the ability of a system to resist, recover, and adapt to natural disasters [19,20,21,22], and has become a hotspot in the field of disaster prevention and mitigation in urban systems [23]. Therefore, enhancing the resilience of urban rail transit stations can improve the disaster-bearing capacity and self-recovery of urban rail transit systems when exposed to rainstorms, to improve the reliability and safety of urban rail transit system operations.
However, there are few studies on the resilience of urban rail transit systems against rainstorms. Thus, from the perspective of resilience, this study aims to identify and analyse the critical influencing factors of the resilience of urban rail transit systems against rainstorms by combing the interpretative structure model method (ISM) and social network analysis method (SNA), to provide a reference for improving the ability of the station to deal with disasters caused by rainstorms.
The subsequent parts of this paper are organised as follows: Section 2 introduces the concept of resilience and determines the influencing factors of the station’s resilience; Section 3 details the methods of ISM and SNA; in Section 4, ISM and SNA are applied for empirical analysis; and, finally, the conclusion is obtained in Section 5.
2. Selection of the Influencing Factors
2.1. Resilience
“Resilience” originated from “resilio” in Latin, which means “returning to the original state”. Later, English borrowed the word and it evolved into “resile” [24]. In 1973, the ecologist Holling [25] applied, foremost, resilience theory in system ecology to express the idea that the ecosystem can operate normally or restore itself to a state of equilibrium after being disturbed by the external world. Since then, the concept of resilience has gradually extended from the ecological field to other fields, including engineering, society, and medicine [26,27,28]. However, researchers in different fields have different definitions of resilience and emphasise different aspects of its multiple meanings, and the details are shown in Table 1.

Table 1.
Definition of resilience in various fields.
In recent years, based on the concept of resilience, the application of resilience in infrastructure has gradually become a research hotspot, such as urban resilience, transport resilience, and urban rail transit resilience. Huang et al. [39] studied the critical influencing factors on urban resilience and its affecting mechanisms in China. Chen et al. [21] constructed a new resilience model to study urban resilience in Taiwan, by collecting empirical data from Taiwan during the Morakot. Based on the “scale–density–morphology” resilience framework, Feng et al. [40] evaluated the urban resilience of Shenyang city. Testa et al. [41] assessed the resilience of transportation networks against extreme events by applying topological graph properties, by using the transportation network of the New York City metropolitan area as a case study. Zhang and Wang [42] utilised the WIPW as the network performance metric for relieving the risk of surface road transportation networks from the perspective of resilience. Sohouenou and Neves [43] offered an assessment skeleton for road network resilience to research the impacts of link–repair sequences on the resilience of road networks. Considering resilience properties, Leobons et al. [44] proposed a framework of indicators for measuring the resilience of urban transportation systems. For urban rail transit resilience, Li et al. [2] evaluated the network resilience of the Beijing subway by accounting for the measurement model of passenger flow and network topological structure. Taking four subway station projects of Chengdu Metro Line 11 as the research object, Liu et al. [22] adopted the projection pursuit method to measure the resilience of subway station projects against waterlogging disasters. These scholars considered resilience as the ability of a system to maintain its stability in the face of external disturbances and to quickly recover from damage.
However, there is no consensus on the concept of resilience and most scholars and institutions agree that resilience encompasses or is associated with the meaning of resistance, recovery, and adaptability [19,20,21,22]. Therefore, the resilience of urban rail transit systems against rainstorms is also considered, in the present study, from the perspective of the three aspects. It is defined as follows: when suffering from unpredictable and abrupt catastrophes, the urban rail transit system can bear and absorb the harmful effects that are the result of the disaster, to preserve the primary function of the system to the maximum extent. Through the self-healing, studying, and organisation of the system, the system can be restored to a normal state; moreover, in the face of similar disasters in the future, the system will suffer minor damage and recover faster, that is to say, the system will show more vital adaptability.
Therefore, this paper summarises the influencing factors of urban rail transit station resilience against rainstorms in the context of the three attributes of resilience.
2.2. Three Attributes of the Station’s Resilience
2.2.1. Resistance
Resistance usually refers to the external invasion resistance and immunity of the human body. The application of resistance in disaster science is considered as the system’s ability to withstand and absorb the disturbance of natural catastrophes [20,22,45]. On account of this, the resistance of urban rail transit stations refers to the ability of the station to absorb the adverse effects of rainstorms to guarantee the station’s essential functions are not damaged to the greatest extent.
The entrance is the passageway connecting the underground station and the ground. In most cases, the flood water enters the station from the entrance. Therefore, different types of entrances and the height of the steps have different roles in the resistance of the invasion of the water. Moreover, the higher the green coverage around the station, the stronger the soil’s water storage capacity and the stronger the effect of reducing the rainwater collection speed. By enhancing the drainage capacity of the municipal pipe network, the ponding around the station can be drained away rapidly, reducing the probability of flood disasters around the entrance and reducing the flood prevention pressure of the station. Good flood prevention monitoring measures can effectively monitor the waterlogging around the entrance of the station: once the danger of flooding is detected, the staff can set the water blocking board, sandbags, and other flood prevention materials at the entrance to carry out the water blocking work, ensuring the dryness and cleanliness of the station. Furthermore, when the flood danger becomes severe, the number of casualties can be reduced by implementing effective evacuation methods.
2.2.2. Recovery
The original meaning of “recovery” refers to the process by which a spring returns to its normal state after being stressed. According to the Chinese dictionary, the meaning of “recovery” is the restoration of a system to its previous or stable state. Therefore, the recovery of urban rail transit stations refers to the prompt restoration of an unbalanced state to an anticipated stable state when the station is damaged. The “stable state” can be the primary state or a new equilibrium state [21,22,45]. It emphasises that the station can operate smoothly and normally after recovery.
When encountering ponding, the station will enter a state of recovery. At this time, the station’s drainage equipment plays a significant role. The stronger the drainage capacity, the faster the speed of cleaning up the ponding. The number of staff, the proficiency level of staff, and the coordination ability also accelerate the station’s recovery rate. The power supply and communication systems’ guaranteed capability can assist the staff’s flood prevention work and ensure maintenance during the recovery period. The investment in flood prevention capital can not only replace the damaged station equipment in time, but can also provide flood control subsidies and rewards to the staff to promote the rapid implementation of recovery work.
2.2.3. Adaptability
Adaptability can be understood as “adaptation”, which is interpreted in the Chinese dictionary as the pleasant state in which the individual can adjust to various environments, ways, times, people, and things. Moreover, Andresen and Gronau [46] considered adaptability as the capability to modify one’s structure to adjust to changes. Furthermore, Thieken et al. [45] considered adaptability as a system’s capacity to study one-time events and adjust the status. It can go beyond the previous state of facing disasters.
On account of the definition mentioned above, the adaptability of urban rail transit stations is understood as the ability of the station to adjust its structure through self-healing, learning, and organisation when resisting and absorbing the impact of rainstorms to better cope with different levels of severity of the rainstorms in the future.
Establishing an appropriate flood prevention emergency plan can result in the rapid enforcement of flood prevention arrangements in the station according to the existing provisions when facing flood disasters, or adjustments, according to similar plans, to improve the station’s adaptability to the rainstorm. Through the training of flood control, the staff can find the loopholes in the flood prevention work and make timely corrections and adjustments. Through the publicity and education of flood prevention methods, the staff can improve the attitude of individuals toward flood prevention and distinguish the priorities of flood prevention projects. Additionally, the rail passengers can actively cooperate with the flood prevention work. The maintenance of the station can keep the stable state of flood prevention equipment when encountering flood danger, so that the flood prevention work of the station can be carried out smoothly. The development of the regional economy provides financial support for improving the flood prevention facilities of the urban system, which not only enhance the flood prevention capacity of the area around the station, but also strengthen the implementation of the flood prevention measures of the station. These factors play a crucial role in the station’s first response to the disasters following a rainstorm and play a significant part in future flood prevention work. Therefore, under the influence of these factors, the station has a richer flood prevention experience and faster response when facing similar rainstorms, which make the station more adaptable.
Based on the understanding, as explained above, of the factors that influence the resilience of urban rail transit stations, this paper selected 20 factors that influence a station’s resilience against rainstorms, which is presented in Table 2.
Table 2.
Influencing factors of the station’s resilience.
3. Methodology
3.1. Interpretative Structural Modelling (ISM)
3.1.1. Conceptual Interpretation of ISM
Interpretative structural modelling (ISM) is a method used to transform complex and fuzzy models into well-defined models, and was first proposed and applied by Warfield [55] in 1973. This method has been widely applied to analyse the interactive relationship between factors with a hierarchical structure [56,57]. For example, using the integrated ISM-MICMAC model, Kinker et al. [57] built the structural model of service quality barriers to understand the interrelation between service quality barriers. Ali et al. [58] utilised the ISM approach to identify the contextual relationships between the barriers that are imposed by learning six sigma implementations in the supply chain. Patel et al. [59] used mixed ISM and fuzzy MICMAC to describe the contextual relationships and interrelationships between circular economy enablers. ISM can describe the essence of the system better than manifestation modes, such as text, tables, and formulas [60]. The interrelationships between the factors affecting informal learning were studied in the work of Suresh and Balajee [61], by employing the ISM method. By referring to these studies, this paper will adopt the method to hierarchise the factors that influence the resilience of urban rail transit stations against rainstorms, by employing the following four steps.
3.1.2. Construction of the ISM Model
Determine the Pair-Wise Relationship between the Influencing Factors
Identifying the pair-wise relationship is the first step for applying ISM, which is usually assessed based on expert opinions by conducting semi-structured interviews. All the experts are invited to judge whether factor i affects factor j with four symbols (V, A, X, and O).
- (a)
- V indicates that factor i affects factor j;
- (b)
- A indicates that factor j affects factor i;
- (c)
- X indicates that there is the mutual impact of factors i and j;
- (d)
- O indicates that there is no impact between factors i and j.
Based on the collected answers from experts, the structural self-interaction matrix (SSIM) is established to reflect the pair-wise relationship between the factors.
Calculate the Reachability Matrix
The developed SSIM is then transferred into a binary matrix called the initial reachability matrix (IRM) for further calculation by converting the four symbols (V, A, X, and O) of the SSIM to 0 and 1. The conversion rules are given in Table 3.
Table 3.
The rules for conversion.
The initial reachability matrix (IRM) only displays the direct relationships between the influencing factors. A final reachability matrix M can present both direct and indirect relationships, usually attained by employing the transitivity rule [62,63]. The transitivity rule indicates that if factor i affects factor j, and factor j affects factor k, then i virtually affects k. The matrix M can be obtained by adding the transitivity to the IRM through the Boolean operation, which involves the self-multiplication of the matrix until it reaches a stable state. Software, such as MATLAB, can help this calculation process for generating matrix M.
Level Partitions Analysis of the Reachability Matrix
In order to establish the hierarchical structure model of influencing factors, it is necessary to determine the level of each factor in the hierarchical structure. To do this effectively, the antecedent set T(Fi), reachability set R(Fi), and intersection set R(Fi) ∩ T(Fi) of each influence factor must first be identified. The reachability set R(Fi) is the set of all factors affected by factor Fi, which is obtained by the column factor with the value of “1” in the corresponding row of factor Fi; the antecedent set T(Fi) represents the set of all factors affecting factor Fi, which is obtained by the row factor with the value of “1” in the corresponding column of factor Fi; and the intersection R(Fi) ∩ T(Fi) represents the set of factors that affect each other, which is obtained by the intersection of the antecedent set T(Fi) and reachability set R(Fi) [64,65].
According to the ISM principle, an intersection set should be placed on the top factors with the same reachability set. In other words, factors at the top level are always affected by other factors. Once the factors on the topmost level are identified, they will be discarded until all the RFs have been partitioned in the ISM structure.
Establishment of the Interpretation Structure Model
Based on the result of the level partitions, a directed hierarchical structure diagram can be constructed to present the chain of influence of each factor. The first layer of influencing factors is at the top of the structure diagram.
3.2. Social Network Analysis (SNA)
3.2.1. Conceptual Interpretation of SNA
Social network analysis (SNA) is a relational data research method based on network structure analysis [66]. SNA can describe the relationship between nodes in a network composed of nodes and edges, explaining the relationship between nodes and corresponding quantitative indicators [67]. That is to say, based on the node relationship data, applying network quantitative indicators and relationship network topology, SNA can study the structural characteristics of the network and the status of nodes in the network [68]. Therefore, SNA provides an analytical method for understanding the behavioural changes of the interactions between actors, and a unique insight into the understanding and development of the research of network structure analysis theory [69].
Currently, SNA is widely applied in sociology, economics, ecology, and other fields. For instance, Prell et al. [70] distinguished the central stakeholders in natural resource management by employing the SNA method: Marks et al. [71] utilised SNA to identify the critical staff in child care centres for obesity preventions; Hauck et al. [72] used SNA to recognise the critical stakeholders for agricultural biodiversity governance; and Mbaru and Barnes [73] utilised SNA to identify the key players for four types of natural resource conservation objectives.
There is a relatively complex correlation between the factors that influence the resilience of urban rail transit stations against rainstorms, and each interactive influencing factor constitutes a factor network [74]. Therefore, considering the influencing factors of a station’s resilience as nodes in the network, and regarding the relationship between the influencing factors of a station’s resilience as the connecting line of interaction between the nodes, SNA metrics, like degree centrality and closeness centrality, is adopted to identify the key influencing factors of a station’s resilience against rainstorms, in the present paper. In this network structure, the relationship between the influencing factors includes being affected by other factors and influencing other factors, which are all considered as a connection between two influencing factors.
3.2.2. SNA Metrics
Degree Centrality
In a network, the connection strength between a node and other nodes is different, indicating that its level of importance is also different. At this point, the importance of a node in the entire network can be measured using degree centrality. The larger the degree centrality value, the more nodes associated with this node, and the more critical this node is in the network [68,69]. Currently, for comparative analysis, normalised degree centrality is regarded as a more standard calculation form [75], and its calculation formula is:
where CD(Ni) denotes the normalised degree centrality of node i; e(Nj, Ni) denotes the number of connections between node i and node j, it is equal to 1 if node i is connected to node j; and n is the number of nodes in the network, where n − 1 denotes the maximum probable number of connections for the node in the network.
Closeness Centrality
In a network, there can be a case in which one node has a high degree of centrality, showing a solid connection with the surrounding nodes but a faint connection with other nodes. Therefore, degree centrality cannot fully describe the role played by a node in the entire network.
Considering the indirect relationship between nodes, closeness centrality is used to describe the accessibility and convenience of a node in the entire network [68]. It is obtained by calculating the sum of the shortest distance between this node and other nodes. The distance is expressed here as the number of edges between two nodes. If the distance between a node and other nodes is relatively short, the node has a high closeness centrality. In other words, the smaller the closeness centrality of a node, the closer the connection with other nodes in the network, and the closer the node is to the centre of the network [69]. In order to facilitate the comparison, relatively compact centrality is also used to calculate the value, and its calculation formula is as follows:
where CC(Ni) denotes the reciprocal of the close centrality of node i. The larger the value, the smaller the close centrality of the point, and the more the point is in the centre of the network. Moreover, d(Nj, Ni) denotes the minimum number of edges connecting node i and node j; n is the number of nodes in the network, where n − 1 denotes the maximum probable number of connections for the node in the network.
4. Empirical Analysis
4.1. The Analysis of the ISM Results
4.1.1. Determine the Pair-Wise Relationship between the Influencing Factors
According to Section 3.1, semi-structured interviews with experts can be conducted to determine the interrelationships between these twenty influencing factors. As opined by Shen et al. [76], ISM emphasises the quality of respondents rather than their quantities. It does not require a large sample of respondents for the data survey. In order to ensure the experts are sufficient, this study selected 20 experts from the fields of academia, business, and government with strong experience and knowledge of urban rail transit stations. Furthermore, the research group conducted a pre-survey with these experts to understand whether or not they were familiar with these twenty factors. Finally, five experts were selected to participate in the semi-structured interviews. A few studies also adopted five experts for the purpose of analysis and showed reliable results [62,63]. The profiles of these five experts are presented in Table 4.
Table 4.
Background information of the experts.
Based on the feedback of whether factor i affects factor j with the four symbols (V, A, X, and O), according to the principle in Section 3.1, the structural self-interaction matrix (SSIM) was generated. When the experts presented significant differences in the relationship between one pair of influencing factors, this paper applied the “minority gives way to the majority” principle to determine the interrelationships [62]. The structural self-interaction matrix (SSIM) of the factors influencing the resilience level of the station is shown in Table 5.
Table 5.
The structural self-interaction matrix (SSIM).
4.1.2. Calculate the Reachability Matrix
According to the SSIM, an initial reachability matrix (IRM) can be developed using the conversion rules presented in Table 3, which is shown in Table 6.
Table 6.
The initial reachability matrix (IRM).
Based on the IRM, this study applies the MATLAB R2014a software to conduct the Boolean operation, to calculate the final reachability matrix M. The result is shown in Table 7.
Table 7.
The final reachability matrix M.
4.1.3. Level Partitions of the Reachability Matrix
Based on the principle presented in Section 3.1, the antecedent set T(Fi), reachability set R(Fi), and intersection set R(Fi) ∩ T(Fi) of each influence factor can be determined. Take F4 as an instance, where the reachability set R(F4) = {F4}; the antecedent set T(F4) = {F1, F2, F3, F4, F5, F6, F8, F10, F11, F12, F13, F14, F15, F16, F17, F18, F19, F20}; and the intersection set R(Fi) ∩ T(Fi) = {F4}. Likewise, the reachability sets, antecedent sets, and intersection sets for other influence factors can be obtained, as shown in Table 8.
Table 8.
Relationship set and the hierarchical division of the influencing factors.
The principle of “R(Fi) ∩ T(Fi) = R(Fi)” is applied to assign the factors of each level. For example, F4, F7, and F9 in Table 8 meet this principle. Thus, these three factors should be placed on Level I. By removing these three factors, F1, F2, F3, F5, and F6 are in line with the principle, and they are partitioned to Level 2. The same procedure is repeated to identify the level partitions with the rest of the factors. Table 8 presents the results of the level partitions of the twenty factors.
4.1.4. Establishment of the Interpretation Structure Model
Using the level partitions of each influencing factor in Table 8, the hierarchical structure of each influencing factor can be drawn, as shown in Figure 1. Some of the cross-level influences can be transmitted via the middle-level factors, so this paper makes a corresponding merger and simplifies some cross-level influence paths.
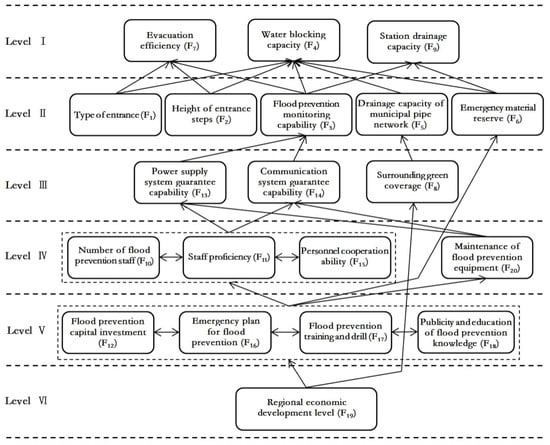
Figure 1.
The hierarchical structure of the influencing factors.
4.1.5. The Results of the ISM
On account of the hierarchy analysis of each influencing factor, presented in Figure 1, the “Evacuation efficiency” (F7), “Water blocking capacity” (F4), and “Station drainage capacity” (F9) is on the first level, which has the most direct impact on the resilience of the station. The bottom influencing factor is the “Regional economic development level” (F19), which can directly or indirectly affect the other factors, and has a far-reaching impact on the resilience of the station. It can be regarded as the source influencing factor of the resilience of the station. The factors ranging from the second to fifth level, in the middle layer, cannot directly affect the resilience of the station; however, they can directly affect the factors on the top level, and can also transfer the influence of the factors on the bottom level to the top level to play a part in connecting the bottom top levels.
4.2. The Analysis of the SNA Results
According to Table 5, the relationship between the factors influencing the station’s resilience is determined. Hence, using the relationship data in Table 5, the network structure of the factors influencing the station’s resilience can be drawn using Gephi software, as shown in Figure 2. In the figure, the red node represents the resistance factor, the green node represents the recovery factor, and the blue node represents the adaptability factor. Additionally, the node’s size indicates the degree centrality value, and the larger the point, the greater the degree centrality value.
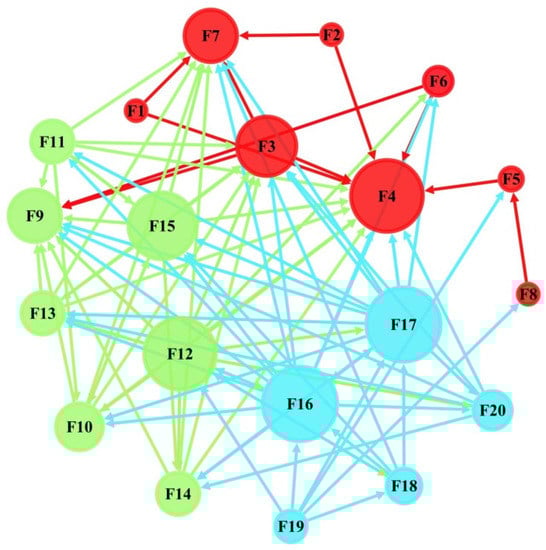
Figure 2.
The network structure of the influencing factors.
Calculated using Formulas (1) and (2), Pajek software is applied to calculate each node’s degree centrality and closeness centrality in the factor network. For instance, take F1, where the sum of e(Nj, N1) for F1 (node 1) is equal to 2, n is 20, and the sum of d(Nj, N1) for F1 (node 1) is equal to 39, thus:
CD(N1) = 2/(20 − 1) = 0.1053,
CC(N1) = (20 − 1)/39 = 0.4872.
CC(N1) = (20 − 1)/39 = 0.4872.
The specific results for all the factors are shown in Table 9. Since there are three attributes of resilience influencing factors, this paper sorted the three attributes, respectively, to select the key influencing factors of each attribute.
Table 9.
The normalised degree centrality of each influencing factor.
Degree centrality indicates the importance of a node in the network, and relative centrality indicates how closely a node is related to other nodes. A node can be considered as a critical node in a network if it is essential and closely related to the other nodes. Therefore, by combining the degree centrality and closeness centrality, presented in Table 9, this paper selects the top two influencing factors from the three attributes, respectively, as the key influencing factors of the station’s resilience.
In the ranking of resistance attributes, the top two influencing factors ranked by degree centrality are “Water blocking capacity” (F4) (CD(N4) = 0.7368) and “Flood prevention monitoring capability” (F3) (CD(N3) = 0.6316). Subsequently, in the ranking of recovery attributes, the top two influencing factors ranked by degree centrality are “Flood prevention capital investment” (F12) (CD(N12) = 0.7368) and “Personnel cooperation ability” (F15) (CD(N15) = 0.6842). Finally, in the ranking of adaptability attributes, the top two influencing factors ranked by degree centrality are “Emergency plan for flood prevention” (F16) (CD(N16) = 0.8947) and “Flood prevention training and drill” (F17) (CD(N17) = 0.8421).
Likewise, in terms of closeness centrality, the selected influencing factors from the three attributes are consistent with those selected according to degree centrality, indicating that they are both critical and quite compactly related to the other nodes.
4.3. Discussion
According to the results of the ISM, the hierarchical structure of the influencing factors is sorted into six levels, as shown in Figure 1. Combining the ISM and SNA results, the comparison of the importance in the same level can be carried out, as shown in Figure 3.
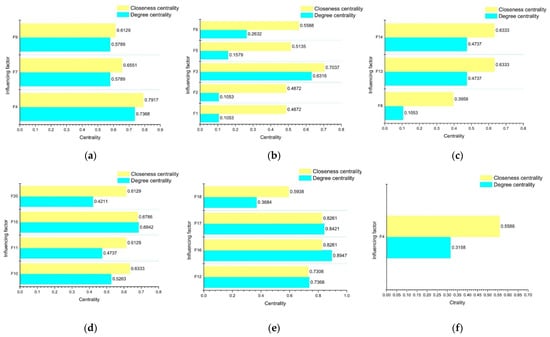
Figure 3.
Bar chart of degree centrality and closeness centrality of the influencing factors at all levels in the ISM chart: (a) the influencing factors for Level I; (b) the influencing factors for Level II; (c) the influencing factors for Level III; (d) the influencing factors for Level IV; (e) the influencing factors for Level V; and (f) the influencing factors for Level VI.
4.3.1. The Critical Influencing Factors for Level I
As shown in Figure 3a, the water blocking capacity, evacuation efficiency, and station drainage capacity belong to the first level, which can directly influence the resilience of urban rail transit stations when facing rainstorms. The water blocking capacity stands in the most significant place due to its highest degree of centrality and closeness centrality, followed by evacuation efficiency and station drainage capacity, with a little distance. Water blocking capacity and station drainage capacity belong to the category of drainage facility, which is considered as the most crucial factor in assessing the resilience of cities. At the same time, rainstorms and flood disasters occur [77]. Considering the necessity and uncertainty of individuals, evacuation efficiency is proposed to be assessed and managed from population sensitivity [78]. Therefore, emphasising the construction and improvement of water blocking facilities can directly and efficiently promote the resilience of the urban rail transit systems against rainstorm disasters.
4.3.2. The Critical Influencing Factors for Level II
The results in Figure 3b indicate that there are five factors in level II: type of entrance, the height of the entrance steps, flood prevention monitoring capability, the drainage capacity of municipal pipe network, and emergency material reserve, which all belong to the dimension of resistance. Based on the SNA results, flood prevention monitoring capability is the first. The emergency material reserve and drainage capacity of municipal pipe networks, the type of entrance, and the height of entrance steps are the last. Flood prevention monitoring capability plays a role in the initial stage of a disaster as the result of a rainstorm d. The emergency material reserve is conducive to the process of rainstorms occurring, promoting resilience from addressing rainstorms. The other three factors can be summarised as the external engineering of urban rail transits, which directly impacts the resilience of urban rail transits during the occurrence of rainstorms [11,12]. Therefore, more attention should be paid to what departments in the urban rail transit system can address the disaster induced by rainstorms. In contrast, the engineering construction of urban rail transit stations has met the standards.
4.3.3. The Critical Influencing Factors for Level III
As shown in Figure 3c, surrounding green coverage, power supply system guarantee capability, and communication system guarantee capability are on level III. It can be easily found that power supply system guarantee capability and communication system guarantee capability are more important than surrounding green coverage. However, the power supply system and communication system guarantee capabilities play a protective role when a rainstorm affects the station, and the impact on the resilience of the station is not so direct. Showing that the same reason with level II, power supply system guarantee capability and communication system guarantee capability work in the process of dealing with damage caused by rainstorms. However, surrounding green coverage is conducive to the prevention of urban rail transit stations from being affected by rainstorms, with a relative lower importance to evaluate the risk of floods as a result of rainstorms [77,78,79]. Similarly, more care should be taken to reduce the damage to urban rail transit stations caused by rainstorms. Therefore, the influencing factors of Level III are relatively less important for the station’s resilience.
4.3.4. The Critical Influencing Factors for Level IV
As shown in Figure 3d, there are four factors on this level: the number of flood prevention staff, staff proficiency, personnel cooperation ability, and maintenance of flood prevention equipment. Except for the maintenance of flood prevention equipment, the other three factors are all in the dimension of recovery. The four factors’ degree centrality and closeness centrality values are relatively higher and closer, indicating the greater importance and a minor difference in this level. The number of flood prevention staff, staff proficiency, and personnel cooperation ability reflect that individuals significantly impact the resilience of urban rail transit stations against rainstorms. However, it is not the most direct factor [77]. Therefore, strengthening staff management and training seems to be conducive to promoting the resilience of urban rail transit stations [80].
4.3.5. The Critical Influencing Factors for Level V
Figure 3e demonstrates four factors on level V: flood prevention capital investment, emergency plan for flood prevention, flood prevention training and drill, publicity and the education of flood prevention knowledge. At this level, flood prevention capital investment, emergency plans for flood prevention, and flood prevention training and drill are good performers in the degree centrality and closeness centrality, playing a pivotal role in reducing flash floods [81]. Although the degree centrality value and closeness centrality value of publicity and the education of flood prevention knowledge seem to be relatively lower, well-trained individuals equipped with the correct knowledge about disaster prevention can help others respond appropriately during disasters and prevent life-threatening results [82]. Hence, investment, emergency plans, training, and education cannot be ignored.
4.3.6. The Critical Influencing Factors for Level VI
As shown in Figure 3f, only the regional economic development level belongs to this level. According to the ISM results, regional economic development, at the bottom of the hierarchical structure, is the most indirect but essential factor. Economic and social development is closely related to various human activities [83], which also plays a critical role in disaster prevention and mitigation [78]. Therefore, strengthening the development of the economy and society can significantly contribute to the promotion of the resilience of urban rail transit stations.
5. Conclusions
In general, with the background of disasters caused by rainstorms, the ISM model was applied to hierarchically classify the intricate influencing factors of the station’s resilience to present an explicit, concrete, and intuitive network structure. Meanwhile, the SNA model was utilised to select the key influencing factors of the station’s resilience from the network of influencing factors. On account of the three attributes of resilience, including resistance, recovery, and adaptability, as well as the critical influencing factors of each level in the ISM, this paper ultimately selects eight critical influencing factors of the station’s resilience against rainstorms, which include: “Flood prevention monitoring capability” (F3); “Water blocking capacity” (F4); “Flood prevention capital investment” (F12); “Personnel cooperation ability” (F15); “Emergency plan for flood prevention” (F16); “Flood prevention training and drill” (F17); “Publicity and education of flood prevention knowledge “ (F18); and “ Regional economic development level “ (F19).
This study provides a feasible solution that constructs the hierarchical structure of influencing factors for the station’s resilience by adopting the ISM method. This research provides significant references to help the station managers recognise the action path and mechanism of the factors influencing its resilience. In addition, this study presents a workable solution that screens out the key influencing factors of the station’s resilience by employing SNA, which allows the station’s managers to recognise which influencing factors require more attention. Therefore, this paper offers a reference for station managers to carry out targeted flood control work, which also delivers an idea to reinforce the resilience of urban rail transit stations to rainstorm disasters. Nonetheless, the limitations to this study are acknowledged because the generalisation of the data caused by methodology forced us to select five experts for analysis. In the future, the research team will collect more research data from quantifying the impact of factors on the resilience of urban rail transit stations when facing rainstorms or other disasters.
Author Contributions
Conceptualization, L.J. and D.L.; methodology, D.L. and Y.Z. (Yu Zhang); software, D.L.; validation, L.J.; formal analysis, D.L.; investigation, D.L. and X.H.; resources, L.J.; data curation, D.L. and X.H.; writing—original draft preparation, D.L.; writing—review and editing, L.J., Y.Z. (Yu Zhang), Y.W. and Y.Z. (Yinghan Zhu); visualization, D.L.; supervision, L.J.; project administration, L.J.; funding acquisition, L.J. All authors have read and agreed to the published version of the manuscript.
Funding
This research was funded by the National Natural Science Foundation of China (Grant No.71901043, No. 72004187), the Humanities and Social Science project of Ministry of Education of China (Grant No. 21YJC630169), the Science and Technology Research Project of Chongqing Education Commission (Grant No.KJQN201900713, Grant No. KJQN202000724), the Humanities and Social Science Research Project of Chongqing Education Commission (Grant No. 2020QNGL31, Grant No. 21SKJD072), the Natural Science Foundation of Chongqing (Grant No. cstc2021jcyj-msxmX1010) and the Social Science Planning Project of Chongqing (Grant No. 2020QNGL25).
Institutional Review Board Statement
Not applicable.
Informed Consent Statement
Not applicable.
Data Availability Statement
Not applicable.
Conflicts of Interest
The authors declare no conflict of interest.
References
- Sun, D.J.; Zhao, Y.; Lu, Q.-C. Vulnerability Analysis of Urban Rail Transit Networks: A Case Study of Shanghai, China. Sustainability 2015, 7, 6919–6936. [Google Scholar] [CrossRef] [Green Version]
- Li, M.; Wang, H.; Wang, H. Resilience Assessment and Optimization for Urban Rail Transit Networks: A Case Study of Beijing Subway Network. IEEE Access 2019, 7, 71221–71234. [Google Scholar] [CrossRef]
- Zhu, Y.; Jiao, L.; Zhang, Y.; Wu, Y.; Huo, X. Sustainable Development of Urban Metro System: Perspective of Coordination between Supply and Demand. Int. J. Environ. Res. Public Health 2021, 18, 10349. [Google Scholar] [CrossRef] [PubMed]
- Wang, G.; Liu, Y.; Hu, Z.; Zhang, G.; Liu, J.; Lyu, Y.; Gu, Y.; Huang, X.; Zhang, Q.; Liu, L. Flood Risk Assessment of Subway Systems in Metropolitan Areas under Land Subsidence Scenario: A Case Study of Beijing. Remote Sens. 2021, 13, 637. [Google Scholar] [CrossRef]
- China Association of Metros. Statistics and Analysis Report of Urban Rail Transit in 2020. Available online: https://www.camet.org.cn/tjxx/7647 (accessed on 10 April 2021).
- Han, B.; Yang, Z.; Yu, Y.; Qian, L.; Chen, J.; Ran, J.; Sun, Y.; Xi, Z.; Lu, F. Statistical Analysis of Urban Rail Transit Operation in the World in 2020: A Review. Urban Rapid Rail Transit. 2021, 34, 5–11. [Google Scholar] [CrossRef]
- Li, C. Ecohydrology and good urban design for urban storm water-logging in Beijing, China. Ecohydrol. Hydrobiol. 2012, 12, 287–300. [Google Scholar] [CrossRef] [Green Version]
- Saylor, P.; Gregg, D.W. Back to nature: Urban structures embrace Philadelphia’s new stormwater management regulations. J. Green Build. 2012, 7, 3–15. [Google Scholar] [CrossRef]
- Lyu, H.-M.; Sun, W.; Shen, S.-L.; Arulrajah, A. Flood risk assessment in metro systems of mega-cities using a GIS-based modeling approach. Sci. Total Environ. 2018, 626, 1012–1025. [Google Scholar] [CrossRef]
- Yu, H.; Liang, C.; Li, P.; Niu, K.; Du, F.; Shao, J.; Liu, Y. Evaluation of Waterlogging Risk in an Urban Subway Station. Adv. Civ. Eng. 2019, 2019, 5393171. [Google Scholar] [CrossRef]
- Lyu, H.-M.; Zhou, W.-H.; Shen, S.-L.; Zhou, A.-N. Inundation risk assessment of metro system using AHP and TFN-AHP in Shenzhen. Sustain. Cities Soc. 2020, 56, 102103. [Google Scholar] [CrossRef]
- Lyu, H.-M.; Shen, S.-L.; Zhou, A.-N.; Zhou, W.-H. Flood risk assessment of metro systems in a subsiding environment using the interval FAHP-FCA approach. Sustain. Cities Soc. 2019, 50, 101682. [Google Scholar] [CrossRef]
- Quan, R.; Zhang, L.; Liu, M.; Lü, M.; Wang, J.; Niu, H. Risk assessment of rainstorm waterlogging on subway in central urban area of Shanghai, China based on scenario simulation. In Proceedings of the 2011 19th International Conference on Geoinformatics, Shanghai, China, 24–26 January 2011; pp. 1–6. [Google Scholar]
- Lyu, H.-M.; Shen, S.-L.; Yang, J.; Yin, Z.-Y. Inundation analysis of metro systems with the storm water management model incorporated into a geographical information system: A case study in Shanghai. Hydrol. Earth Syst. Sci. 2019, 23, 4293–4307. [Google Scholar] [CrossRef] [Green Version]
- Forero-Ortiz, E.; Martínez-Gomariz, E.; Porcuna, M.; Locatelli, L.; Russo, B. Flood Risk Assessment in an Underground Railway System under the Impact of Climate Change—A Case Study of the Barcelona Metro. Sustainability 2020, 12, 5291. [Google Scholar] [CrossRef]
- Aoki, Y.; Yoshizawa, A.; Taminato, T. Anti-inundation Measures for Underground Stations of Tokyo Metro. Procedia Eng. 2016, 165, 2–10. [Google Scholar] [CrossRef]
- Wu, H.; Wang, J. A Method for Prediction of Waterlogging Economic Losses in a Subway Station Project. Mathematics 2021, 9, 1421. [Google Scholar] [CrossRef]
- Turner, B.L.; Kasperson, R.E.; Matson, P.A.; McCarthy, J.J.; Corell, R.W.; Christensen, L.; Eckley, N.; Kasperson, J.X.; Luers, A.; Martello, M.L.; et al. A framework for vulnerability analysis in sustainability science. Proc. Natl. Acad. Sci. USA 2003, 100, 8074–8079. [Google Scholar] [CrossRef] [Green Version]
- Chen, Y.; Zhu, M.; Zhou, Q.; Qiao, Y. Research on Spatiotemporal Differentiation and Influence Mechanism of Urban Resilience in China Based on MGWR Model. Int. J. Environ. Res. Public Health 2021, 18, 1056. [Google Scholar] [CrossRef]
- Hoterová, K.; Chovančíková, N. Methodical Procedure for Creating a New Methodology for Assessing the Resilience of Transport Infrastructure. Transp. Res. Procedia 2021, 55, 1431–1435. [Google Scholar] [CrossRef]
- Chen, C.; Xu, L.; Zhao, D.; Xu, T.; Lei, P. A new model for describing the urban resilience considering adaptability, resistance and recovery. Saf. Sci. 2020, 128, 104756. [Google Scholar] [CrossRef]
- Liu, L.; Wu, H.; Wang, J.; Yang, T. Research on the evaluation of the resilience of subway station projects to waterlogging disasters based on the projection pursuit model. Math. Biosci. Eng. 2020, 17, 7302–7331. [Google Scholar] [CrossRef]
- Meerow, S.; Newell, J.P.; Stults, M. Defining urban resilience: A review. Landsc. Urban Plan. 2016, 147, 38–49. [Google Scholar] [CrossRef]
- Alexander, D.E. Resilience and disaster risk reduction: An etymological journey. Nat. Hazards Earth Syst. Sci. 2013, 13, 2707–2716. [Google Scholar] [CrossRef] [Green Version]
- Holling, C.S. Resilience and Stability of Ecological Systems. Annu. Rev. Ecol. Syst. 1973, 4, 1–23. [Google Scholar] [CrossRef] [Green Version]
- Collins, T.; Overbey, D. Leveraging the U.S. Department OF Energy Solar Decathlon Design Challenge as a Framework for Student-Led Adaptive Reuse Projects to Address Context-Specific Sustainable Design, Housing Affordability, and Community Resilience. J. Green Build. 2020, 15, 201–234. [Google Scholar] [CrossRef]
- Fezi, B.A. Health Engaged Architecture in the Context of COVID-19. J. Green Build. 2020, 15, 185–212. [Google Scholar] [CrossRef]
- Campbell, H.; Crippen, A.; Hawkey, C.; Dalrymple, M. A Roadmap for Building Climate Resilience at Higher Education Institutions: A Case Study of Arizona State University. J. Green Build. 2020, 15, 237–256. [Google Scholar] [CrossRef]
- Pimm, S.L. The complexity and stability of ecosystems. Nat. Cell Biol. 1984, 307, 321–326. [Google Scholar] [CrossRef]
- Klein, R.J.; Smit, M.J.; Goosen, H.; Hulsbergen, C.H. Resilience and Vulnerability: Coastal Dynamics or Dutch Dikes? Geogr. J. 1998, 164, 259. [Google Scholar] [CrossRef]
- Paton, D.; Johnston, D. Disasters and communities: Vulnerability, resilience and preparedness. Disaster Prev. Manag. Int. J. 2001, 10, 270–277. [Google Scholar] [CrossRef]
- Godschalk, D.R. Urban Hazard Mitigation: Creating Resilient Cities. Nat. Hazards Rev. 2003, 4, 136–143. [Google Scholar] [CrossRef]
- Pickett, S.T.A.; Cadenasso, M.L.; Grove, J.M. Resilient cities: Meaning, models, and metaphor for integrating the ecological, socio-economic, and planning realms. Landsc. Urban Plan. 2004, 69, 369–384. [Google Scholar] [CrossRef]
- Campanella, T.J. Urban Resilience and the Recovery of New Orleans. J. Am. Plan. Assoc. 2006, 72, 141–146. [Google Scholar] [CrossRef]
- Resilience Alliance. Urban Resilience Research Prospectus; CSIRO: Canberra, Australia; Phoenix, AZ, USA; Stockholm, Sweden, 2007.
- Cutter, S.L.; Barnes, L.; Berry, M.; Burton, C.; Evans, E.; Tate, E.; Webb, J. A place-based model for understanding community resilience to natural disasters. Glob. Environ. Chang. 2008, 18, 598–606. [Google Scholar] [CrossRef]
- IPCC. Managing the Risks of Extreme Events and Disasters to Advance Climate Change Adaptation: Special Report of the Intergovernmental Panel on Climate Change; Field, C.B., Barros, V., Stocker, T.F., Dahe, Q., Eds.; Cambridge University Press: Cambridge, UK, 2012. [Google Scholar]
- Brown, A.; Dayal, A.; Del Rio, C.R. From practice to theory: Emerging lessons from Asia for building urban climate change resilience. Environ. Urban. 2012, 24, 531–556. [Google Scholar] [CrossRef] [Green Version]
- Huang, G.; Li, D.; Zhu, X.; Zhu, J. Influencing factors and their influencing mechanisms on urban resilience in China. Sustain. Cities Soc. 2021, 74, 103210. [Google Scholar] [CrossRef]
- Feng, X.; Xiu, C.; Bai, L.; Zhong, Y.; Wei, Y. Comprehensive evaluation of urban resilience based on the perspective of landscape pattern: A case study of Shenyang city. Cities 2020, 104, 102722. [Google Scholar] [CrossRef]
- Testa, A.C.; Furtado, M.N.; Alipour, A. Resilience of Coastal Transportation Networks Faced with Extreme Climatic Events. Transp. Res. Rec. J. Transp. Res. Board 2015, 2532, 29–36. [Google Scholar] [CrossRef]
- Zhang, W.; Wang, N. Resilience-based risk mitigation for road networks. Struct. Saf. 2016, 62, 57–65. [Google Scholar] [CrossRef] [Green Version]
- Sohouenou, P.Y.; Neves, L.A. Assessing the effects of link-repair sequences on road network resilience. Int. J. Crit. Infrastruct. Prot. 2021, 34, 100448. [Google Scholar] [CrossRef]
- Leobons, C.M.; Campos, V.B.G.; Bandeira, R.A.D.M. Assessing Urban Transportation Systems Resilience: A Proposal of Indicators. Transp. Res. Procedia 2019, 37, 322–329. [Google Scholar] [CrossRef]
- Thieken, A.; Mariani, S.; Longfield, S.; Vanneuville, W. Preface: Flood resilient communities—Managing the consequences of flooding. Nat. Hazards Earth Syst. Sci. 2014, 14, 33–39. [Google Scholar] [CrossRef]
- Andresen, K.; Gronau, N. An approach to increase adaptability in ERP systems. In Proceedings of the 2005 Information Resources Management Association International Conference, San Diego, CA, USA, 15–18 May 2005; pp. 883–885. [Google Scholar]
- Park, I.; Seong, H.; Ryu, Y.; Rhee, D.S. Measuring Inundation Depth in a Subway Station Using the Laser Image Analysis Method. Water 2018, 10, 1558. [Google Scholar] [CrossRef] [Green Version]
- Yao, Y. Vulnerability Assessment of Rainstorm Waterlogging of Buildings along Underground Rail Transit in Zhengzhou City. Ph.D. Dissertation, North China University of Water Resources and Electric Power, Zhengzhou, China, 2019; pp. 21–28. [Google Scholar]
- Ishigaki, T.; Kawanaka, R.; Onishi, Y.; Shimada, H.; Toda, K.; Baba, Y. Assessment of Safety on Evacuating Route during Underground Flooding; Springer: Singapore, 2009; pp. 141–146. [Google Scholar]
- Wang, J.; Wu, H.; Yang, T. Vulnerability assessment of rainfall and waterlogging in subway stations based on projection pursuit model. China Saf. Sci. J. 2019, 29, 1–7. [Google Scholar] [CrossRef]
- Pei, Y. Study on the Vulnerability and Survivability of the Urban Rail Transit Network under the Rainstorm. Master’s Thesis, Chang’an University, Xi’an, China, 2019. [Google Scholar]
- Jevtić, R.B. Security in metro-an example for simulation of evacuation from subway. Facta Univ. Ser. Work. Living Environ. Protect. 2017, 13, 197–208. [Google Scholar] [CrossRef]
- Wang, Y.; Liang, Y.; Sun, H. A Regret Theory-Based Decision-Making Method for Urban Rail Transit in Emergency Response of Rainstorm Disaster. J. Adv. Transp. 2020, 2020, 3235429. [Google Scholar] [CrossRef]
- Zhuang, P.; Liu, S.; Hu, Y.; Zhao, D. Index Weight Calculation Weight Index in the Safety Assessment System of Multi-Disaster of Underground Multi-Story Traffic Hub. J. Beijing Univ. Civ. Eng. Architect. 2010, 26, 1–7. [Google Scholar]
- Warfield, J.N. On Arranging Elements of a Hierarchy in Graphic Form. IEEE Trans. Syst. Man Cybern. 1973, 3, 121–132. [Google Scholar] [CrossRef]
- Obi, L.; Awuzie, B.; Obi, C.; Omotayo, T.; Oke, A.; Osobajo, O. BIM for Deconstruction: An Interpretive Structural Model of Factors Influencing Implementation. Buildings 2021, 11, 227. [Google Scholar] [CrossRef]
- Kinker, P.; Swarnakar, V.; Singh, A.R.; Jain, R. Identifying and evaluating service quality barriers for polytechnic education: An ISM-MICMAC approach. Mater. Today Proc. 2020, 46, 9752–9757. [Google Scholar] [CrossRef]
- Ali, S.M.; Hossen, A.; Mahtab, Z.; Kabir, G.; Paul, S.K.; Adnan, Z.U.H. Barriers to lean six sigma implementation in the supply chain: An ISM model. Comput. Ind. Eng. 2020, 149, 106843. [Google Scholar] [CrossRef]
- Patel, M.N.; Pujara, A.A.; Kant, R.; Malviya, R.K. Assessment of circular economy enablers: Hybrid ISM and fuzzy MICMAC approach. J. Clean. Prod. 2021, 317, 128387. [Google Scholar] [CrossRef]
- Sushil Interpreting the Interpretive Structural Model. Glob. J. Flex. Syst. Manag. 2012, 13, 87–106. [CrossRef]
- Suresh, M.; Balajee, T.K. Modelling of factors influencing on informal learning among school teachers: An ISM-MICMAC approach. Mater. Today Proc. 2021, in press. [Google Scholar] [CrossRef]
- Mukeshimana, M.C.; Zhao, Z.-Y.; Nshimiyimana, J.P. Evaluating strategies for renewable energy development in Rwanda: An integrated SWOT—ISM analysis. Renew. Energy 2021, 176, 402–414. [Google Scholar] [CrossRef]
- Tan, T.; Chen, K.; Xue, F.; Lu, W. Barriers to Building Information Modeling (BIM) implementation in China’s prefabricated construction: An interpretive structural modeling (ISM) approach. J. Clean. Prod. 2019, 219, 949–959. [Google Scholar] [CrossRef]
- Malone, D.W. An introduction to the application of interpretive structural modeling. Proc. IEEE 1975, 63, 397–404. [Google Scholar] [CrossRef]
- Liu, J.; Li, Y.; Lu, Y.; Fu, X.; Yan, S. Research on the influence factors of ubiquitous power Internet of things for promoting consumption of wind power based on fuzzy G1-ISM in China. Int. J. Electr. Power Energy Syst. 2020, 121, 106124. [Google Scholar] [CrossRef]
- Bu, Y.; Wang, E.; Bai, J.; Shi, Q. Spatial pattern and driving factors for interprovincial natural gas consumption in China: Based on SNA and LMDI. J. Clean. Prod. 2020, 263, 121392. [Google Scholar] [CrossRef]
- Camarasa, C.; Heiberger, R.; Hennes, L.; Jakob, M.; Ostermeyer, Y.; Rosado, L. Key Decision-Makers and Persuaders in the Selection of Energy-Efficient Technologies in EU Residential Buildings. Buildings 2020, 10, 70. [Google Scholar] [CrossRef] [Green Version]
- Leng, Z.; Sun, H.; Cheng, J.; Wang, H.; Yao, Z. China’s rare earth industry technological innovation structure and driving factors: A social network analysis based on patents. Resour. Policy 2021, 73, 102233. [Google Scholar] [CrossRef]
- Yip, W.; To, S. A critical analysis of sustainable micro-manufacturing from the perspective of the triple bottom line: A social network analysis. Environ. Impact Assess. Rev. 2021, 90, 106628. [Google Scholar] [CrossRef]
- Prell, C.; Hubacek, K.; Reed, M. Stakeholder Analysis and Social Network Analysis in Natural Resource Management. Soc. Nat. Resour. 2009, 22, 501–518. [Google Scholar] [CrossRef]
- Marks, J.; Barnett, L.M.; Foulkes, C.; Hawe, P.; Allender, S. Using Social Network Analysis to Identify Key Child Care Center Staff for Obesity Prevention Interventions: A Pilot Study. J. Obes. 2013, 2013, 919287. [Google Scholar] [CrossRef] [PubMed]
- Hauck, J.; Schmidt, J.; Werner, A. Using social network analysis to identify key stakeholders in agricultural biodiversity governance and related land-use decisions at regional and local level. Ecol. Soc. 2016, 21, 249. [Google Scholar] [CrossRef]
- Mbaru, E.K.; Barnes, M. Key players in conservation diffusion: Using social network analysis to identify critical injection points. Biol. Conserv. 2017, 210, 222–232. [Google Scholar] [CrossRef]
- Tan, Y.; Xu, H.; Jiao, L.; Ochoa, J.J.; Shen, L. A study of best practices in promoting sustainable urbanization in China. J. Environ. Manag. 2017, 193, 8–18. [Google Scholar] [CrossRef]
- Freeman, L.C. Centrality in social networks conceptual clarification. Soc. Netw. 1978, 1, 215–239. [Google Scholar] [CrossRef] [Green Version]
- Shen, L.; Song, X.; Wu, Y.; Liao, S.; Zhang, X. Interpretive Structural Modeling based factor analysis on the implementation of Emission Trading System in the Chinese building sector. J. Clean. Prod. 2016, 127, 214–227. [Google Scholar] [CrossRef]
- Ma, S.; Lyu, S.; Zhang, Y. Weighted clustering-based risk assessment on urban rainstorm and flood disaster. Urban. Clim. 2021, 39, 100974. [Google Scholar] [CrossRef]
- Li, Y.; Gong, S.; Zhang, Z.; Liu, M.; Sun, C.; Zhao, Y. Vulnerability evaluation of rainstorm disaster based on ESA conceptual framework: A case study of Liaoning province, China. Sustain. Cities Soc. 2021, 64, 102540. [Google Scholar] [CrossRef]
- Wu, M.; Wu, Z.; Ge, W.; Wang, H.; Shen, Y.; Jiang, M. Identification of sensitivity indicators of urban rainstorm flood disasters: A case study in China. J. Hydrol. 2021, 599, 126393. [Google Scholar] [CrossRef]
- Li, W.; Zhou, J. The Optimize Management of Passenger Organization in Transfer Station based on Dynamic Passenger Flow Analysis. Procedia Soc. Behav. Sci. 2013, 96, 1322–1328. [Google Scholar] [CrossRef] [Green Version]
- Li, W.; Hu, K.; Hu, X.; He, B.; Tu, Y. Investments against flash floods and their effectiveness in China in 2000–2015. Int. J. Disaster Risk Reduct. 2019, 38, 101193. [Google Scholar] [CrossRef]
- Tsai, M.-H.; Chang, Y.-L.; Shiau, J.-S.; Wang, S.-M. Exploring the effects of a serious game-based learning package for disaster prevention education: The case of Battle of Flooding Protection. Int. J. Disaster Risk Reduct. 2020, 43, 101393. [Google Scholar] [CrossRef]
- Zhang, Y.; Mao, Y.; Jiao, L.; Shuai, C.; Zhang, H. Eco-efficiency, eco-technology innovation and eco-well-being performance to improve global sustainable development. Environ. Impact Assess. Rev. 2021, 89, 106580. [Google Scholar] [CrossRef]
Publisher’s Note: MDPI stays neutral with regard to jurisdictional claims in published maps and institutional affiliations. |
© 2021 by the authors. Licensee MDPI, Basel, Switzerland. This article is an open access article distributed under the terms and conditions of the Creative Commons Attribution (CC BY) license (https://creativecommons.org/licenses/by/4.0/).