Abstract
Online knowledge-sharing platforms could potentially contribute to an accelerated climate adaptation by promoting more green and blue spaces in urban areas. The implementation of small-scale nature-based solutions (NBS) such as bio(swales), green roofs, and green walls requires the involvement and enthusiasm of multiple stakeholders. This paper discusses how online citizen science platforms can stimulate stakeholder engagement and promote NBS, which is illustrated with the case of ClimateScan. Three main concerns related to online platforms are addressed: the period of relevance of the platform, the lack of knowledge about the inclusiveness and characteristics of the contributors, and the ability of sustaining a well-functioning community with limited resources. ClimateScan has adopted a “bottom–up” approach in which users have much freedom to create and update content. Within six years, this has resulted in an illustrated map with over 5000 NBS projects around the globe and an average of more than 100 visitors a day. However, points of concern are identified regarding the data quality and the aspect of community-building. Although the numbers of users are rising, only a few users have remained involved. Learning from these remaining top users and their motivations, we draw general lessons and make suggestions for stimulating long-term engagement on online knowledge-sharing platforms.
1. Introduction
Online knowledge-sharing platforms could potentially contribute to an accelerated uptake of nature-based solutions (NBS). NBS are considered to be a promising means to address climate change by promoting more green and blue spaces in urban areas. NBS usually have multiple benefits: they increase a city’s biodiversity, contribute to more healthy and resilient ecosystems, and provide benefits for health and human well-being [1,2,3]. However, while advocacy for NBS in the scientific literature is on the rise, implementation in practice is often hampered [4]. Common barriers to implementing NBS are the fear of unknowns (regarding implementation, maintenance, and performance of NBS) and a general lack of understanding the multiple benefits of NBS [4,5]. Moreover, many NBS require the involvement and enthusiasm of a multitude of stakeholders [6]. This is particularly true for small-scale NBS such as bio(swales), green roofs, and green walls, which can be implemented in urban neighbourhoods even if space in a city is scarce. Next to their aesthetical value, they simultaneously help to regulate water flow, prevent floods, and reduce heat stress. However, they often need to be implemented on private land, requiring non-governmental actors such as individual house owners, housing corporations, and property owners of business parks to take action.
To build momentum and foster implementation of NBS, Kabisch et al. (2016) [4] have pointed out that it is important to “learn from action that is already taking place” and share existing approaches and experiences among different countries. Everywhere in the world, stakeholders are experimenting with NBS and climate adaptation. However, many of these experiments are on such a small-scale that they do not reach beyond their regional boundaries.
An online platform could be an ideal tool to increase international knowledge exchange and raise awareness, with the ultimate goal that a good example of an affordable and well-functioning NBS can help actors in other places to move forward in the implementation process. Especially during the current Covid-19 pandemic, we have all come to realize the importance and the opportunities of being connected through the internet. The internet offers the advantage that it is accessible to anyone (with an internet connection) at any time [7,8]. This means that an online platform could potentially reach a multitude of stakeholders: those that already have a say in climate adaptation and water governance, and those who were not involved thus far. Many of these platforms exist, the majority of which have been established with the (financial) support of funding agencies and governments. Examples are Climate-ADAPT, OPPLA, NATURVATION Urban Nature Atlas, BISE, DRMKC, Natural Hazards NBS, NBS Initiative, NWRM, PANORAMA, ThinkNature and weADAPT. However, none of these platforms have a citizen science interactive mapping function.
ClimateScan (www.climatescan.org), the case in this paper, is built on such an interactive mapping function using citizen science. The platform has been set up without any external resources and using only voluntary efforts. It was originally developed by Hanze University of Applied Sciences (HUAS) in 2014 to show the locations of Sustainable Urban Drainage Systems (SUDS) in The Netherlands and publish the research results of functionality tests carried out on these locations. In 2016, the platform has been opened up to the public so that anyone could contribute existing best practices of nature-based solutions and climate adaptation on an interactive map.
This citizen science approach was chosen for two reasons. First, it increases the geographic range of the ClimateScan database. Second, mapping our own examples is in line with other web 2.0 ideas that makes users active knowledge producers instead of passive knowledge consumers [9]. This can increase the “fun factor” and the commitment of users and thereby help to build a more empowered and more sustainable community of practice. Today, the platform has over 800 registered users, which have uploaded more than 5000 projects assigned to seven main themes (Water, People, Nature, Heat, Energy, Urban Agriculture and Air Quality) all around the globe.
In this paper, we discuss how online citizen science platforms such as ClimateScan can stimulate stakeholder engagement and promote NBS. ClimateScan is a unique case because it has adopted an innovative bottom–up approach. This bottom–up approach entails that ClimateScan is independent from the (financial) support of funding agencies and governments, and that there has not been a top–down induced set of rules about what should be uploaded in what way from the start. Accordingly, the platform relies strongly on the self-organizing capacity of the actual users.
One of the authors has been involved with ClimateScan from the outset and throughout. As a result of this, we were able to acquire in-depth and inside knowledge around both the development of the content of the platform and the development of the community behind the platform. We have supplemented these participatory observations with a content analysis of the ClimateScan database and statistical analyses stemming from Google Analytics to analyze what has been uploaded, by whom, and how the content and the community has developed over time. While there have been evaluations of the actual usage and contribution of online decision support tools cf. [9,10,11], there has not been an evaluation of an online adaptation platform using citizen science. Thereby, we add novel insights regarding the potentials and pitfalls of online citizen science platforms and how they can contribute to climate adaptation and NBS implementation practice.
In the following, we will first present the current state of knowledge regarding the potentials and pitfalls of online adaptation platforms to identify research avenues in the current debate (Section 2). Based on these research avenues, we have designed our empirical strategy for evaluating the ClimateScan platform. We will explain this methodological approach in Section 3. Section 4 provides more background information regarding the history of ClimateScan, its key design parameters, and how it uses online and offline channels to acquire new users. Section 5 will present the results of our analysis regarding the content and the community of ClimateScan. In Section 6, we will provide concluding remarks on how ClimateScan and similar initiatives could be sustained, with an eye on improving its flaws, without doing harm to its strengths.
2. Online Adaptation Platforms—What We Know So Far
Climate adaptation is eminently a field where Fischer’s request to rethink expertise and his plea to build more cooperative relations between experts and lay citizens applies [12,13]. This is simply because climate adaptation requires a rather radical transformation of the built environment, for which agreement and action of many different actors, often non-experts, is needed [6]. With democratizing knowledge about climate adaptation, we mean that knowledge about climate adaptation is made accessible to all actors from the quadruple helix (academia, government, business, and civil society), enabling them to negotiate about goals and how to achieve them [14,15].
A key consideration must be that the adaptation process is often undertaken by people for whom climate change is not a primary concern [16]. Eventually, the success of the world’s adaptation efforts will depend on “ordinary” citizens, housing associations, business park owners, and (municipal) civil servants who integrate climate adaptation into the (re-)design of streets, buildings, gardens, parking lots, and other components of our built environment. For them, climate adaptation often has been and still is a voluntary add-on on top of their usual responsibilities. Palutikof et al. (2019) [7] (p. 461) have already pointed out that knowledge adaptation platforms can be a useful and time-saving tool to these typical adaptors, as they can serve as “a comprehensive resource equipping decision-makers with the data, tools, guidance and information needed to adapt to a changing climate”. Such platforms are usually online resources, making use of the several benefits the internet offers, which can help to democratize knowledge about climate adaptation.
The first advantage of online platforms is inclusivity: anyone with an internet access can participate, access is free of charge (except for the internet fee itself), and there is no need to be at a specific time at a specific place [8,9,10]. Second, the internet offers the opportunity to make use of strong visual powers. Videos and photos next to pure text can help in communication [9]. Such visual content is more universal than written text, which can be particularly useful in a field such as climate adaptation where terminology varies strongly between countries and also changes quickly over time (see [17] for an overview of changing terminology in the field of urban stormwater management). Third, web 2.0 developments have made it possible to create interactive platforms, where people can meet and exchange ideas. This increases opportunities to broaden participation and build communities of practice for active knowledge exchange and capacity-building [7,9,10].
However, there are also some common downsides to online adaptation platforms. The downsides of online adaptation platforms are often connected to diverting expectations of users, builders, and funders. A typical problem is that online platforms relate to a specific project and funding horizon; once the project is over and funding stops, information is not updated anymore, and information will ultimately be out of date. Moreover, many platforms need a long time to be designed and built (on average 3-4 years), especially if they aim to function as decision support tools [10]. This can be problematic because the institutional context may have changed by the time the website is up in the air [10]. Particularly in a field such as climate adaptation, regulatory and legislative frameworks are very fluid and can change easily [18]. Users’ needs are often not well-understood and hardly evaluated [10]. In one of the few studies focusing on the users’ perspective, Hewitson et al. (2017) [11] (p. 16) come to the conclusion that “all climate information websites ‘grossly overestimate the ease of use’”.
A second pitfall relates to the interactive element of online platforms and the strive to build an online community of practice. Building and maintaining such a community is very resource-intensive, as it requires getting to know the users, engaging with them directly, and regularly tracking how this use is evolving [9]. Commonly, online platforms aim at involving practitioners to make the platform’s content more relevant to a wide audience, thereby increasing the frequency of visits and active engagement of users. However, as pointed out above, practitioners often lack the time to actively engage on such a platform because of competing demands. Research has shown that offline interactions next to online activities help in advertising the platform, building user confidence and trust in its content, and facilitating the co-production of knowledge [9,10].
A third pitfall relates to the aspect of inclusivity. The inclusivity of online platforms is based on the idea that everyone has access to the internet. However, access to the internet varies in different geographical contexts. Broadly speaking, only one-third of the people in developing countries are online compared to two-thirds in the developed world, and even in developed countries, internet access is much better in urban areas than in rural areas [9,19,20,21]. The difference in internet access to climate adaptation platforms between developed and developing countries is particularly striking, bearing in mind that developing countries are likely to suffer more from climate change than developed countries [6,9,22]. Another important point relates to the actual usage and users of climate adaptation platforms. In one of the few studies carried out about the users of what they call “climate knowledge brokering platforms”, Hammill et al. (2013) [9] conclude that research-oriented users dominate on these platforms, and that policy-makers, media representatives, and local level actors are often not actively engaging with these platforms. Therefore, Hammill et al. (2013) [9] (p. 90) warn that online adaptation platforms should not become “essentially online spaces established and managed by researchers for researchers in relatively privileged settings”.
To conclude, online adaptation platforms are generally held to be a promising tool for knowledge exchange, raising awareness, and building capacity. However, the literature review above also shows that there are three main concerns, and hence research avenues, related to online platforms: (1) Many online platforms are often only “active” for a certain period (i.e., the timeframe of a certain project and related funding), thereby running the risk that the content becomes outdated. (2) Little is known about the actual contributors and users of online platforms and how inclusive these platforms actually are. (3) Creating and maintaining a well-functioning community of practice is a common goal, but it is difficult to achieve. In this paper, we will shed light on these points by turning to the special case of ClimateScan. The bottom–up approach that ClimateScan has adopted offers us the opportunity to analyze what happens if you enable users to create and update content. More specifically, we can analyze what is being uploaded, who contributes to the platform for what reason, and how this could shape an active community of practice.
3. Methodological Approach to Evaluate the ClimateScan Platform
The research avenues identified above have informed a two-fold evaluation of the ClimateScan platform, analyzing (1) the content of the platform and how it has evolved over time, and (2) the users and the community of practice and how this developed over time.
For this analysis, we have applied multiple qualitative methods. First and foremost, we draw on participatory observations from one of the authors, who has initially set up the platform and remained involved throughout. These participatory observations stem from the author’s function as a moderator of the website and direct interactions with ClimateScan users. The personal relations with the ClimateScan top users (those who have uploaded 10 or more projects) have helped us to classify which sector they come from (academia, government, business, civil society) and what drives these top users to contribute. That way, we could reflect on the inclusivity of the ClimateScan platform and users’ motivations to participate in the ClimateScan community. To ensure reflexivity, the other author, who has not been involved from the beginning, interviewed the participating author on several occasions.
To further substantiate the observations, we have used two additional types of data. The first one is the ClimateScan database itself, which provides information about what has been uploaded, by whom, and when. A content analysis of the database has enabled us to distill an overview of the types of NBS that are uploaded and their geographical distribution. Moreover, by creating user profiles analyzing who has uploaded how many projects over time, we could assess the level of involvement of participants. Assessing the level of involvement of participants was important to draw preliminary conclusions on the aspect of community-building, which were then supplemented by the participatory observations mentioned above.
Last but not least, we have used data from Google Analytics to better understand how many people visit ClimateScan and how this has developed over time. That way, we could assess the overall popularity of the website and which factors have increased its usage. Moreover, with the data from Google Analytics, we could generate an overview of the projects that are visited most on the ClimateScan platform. By analyzing what these projects have in common, we could better understand what makes a project appealing to a wider audience. As a corollary, we gained insights for the further development and improvement of ClimateScan.
4. An Introduction to ClimateScan
ClimateScan’s history can be described as an evolution from a research-driven website about Sustainable Urban Drainage Systems to a platform where anyone can register and contribute examples of nature-based solutions on an interactive map. ClimateScan was originally set up in 2014 in the context of a PhD thesis called “Stormwater characteristics and new testing methods for certain sustainable drainage systems in The Netherlands” [23]. In order to make the research transparent and publicly available, the website showed the locations of the NBS that have been studied alongside photos and video footage of a new testing method (“full-scale testing”, see [24]) which had been used to study the performance of these specific NBS after they have been in place for a few years. This information was shared with other international researchers as a means to achieve ‘international knowledge exchange’ (Boogaard, 2015: 119). When the website gradually received more attention and positive feedback from practitioners and other researchers, the recognition grew that ClimateScan could be a powerful tool to showcase also other best practices of climate adaptation and urban resilience. This has led to an opening of the website in 2016, so that anyone could register, download an app, and contribute examples of “blue-green” projects around the globe.
ClimateScan is not the only platform with such an interactive mapping function (other examples in the same field are ClimateADAPT, OPPLA, and NATURVATION). However, ClimateScan is unique in its organization and focus. Organizationally, ClimateScan has been developed in a “learning by doing way”. The platform started out without a clear set of rules about what should be uploaded and how it should be described. Instead, suggestions made by users have been used to improve the platform.
To give an example, in the beginning, the entry of a data point could only be assigned to one category (e.g., “Water”). Nowadays, a datapoint can be assigned to several categories (e.g., “Water” and “Heat”, which better shows the multiple benefits of NBS. Overall, the focus of ClimateScan is rather small-scale and design-oriented. Many examples on ClimateScan refer to a specific object, e.g., the design of a roundabout with a water storage function. The focus on design implies that ClimateScan does not provide detailed decision support but rather serves as a source of inspiration. ClimateScan showcases many design examples that lend themselves to be easily copied elsewhere. The addition of the function “show related projects” implies that a visitor interested in one example can immediately find similar examples. As such, ClimateScan attempts to be a “solutions broker” [25]. Moreover, because of its origin as a research-driven website, ClimateScan links to location-specific research outcomes wherever possible [26].
Since 2014, several channels—online and offline—have been used to promote and disseminate ClimateScan (see Table 1). ClimateScan makes use of social media, has been linked to other climate adaptation portals, and uses “offline” events called ClimateCafé’s to “recruit” new users. ClimateCafés can be characterized as pressure-cooker workshops in which young professionals and practitioners come together for a few days to gather factual data about the vulnerabilities and (potential) solutions of a defined urban or rural area. ClimateScan is a fixed element in each ClimateCafé to scan the study area for existing nature-based solutions. Every ClimateScan workshop results in more datapoints on the map and further stimulates discussions on the type of nature-based solution, its benefits and local characteristics, and governance aspects related to ownership, performance, and maintenance (for an example, see [27]).

Table 1.
Promotion and dissemination channels of ClimateScan.
5. Results from the ClimateScan Evaluation
5.1. Content of ClimateScan: From (Bio)swales to Tornado Trails
A general overview of the interactive map shows that datapoints have been submitted on every continent, which makes ClimateScan a global platform (see Figure 1). However, due to its origin in The Netherlands, most projects have been submitted in The Netherlands and Western Europe. Other hotspots are Australia, South Africa, and the Philippines. While the magnitude of datapoints in South Africa and the Philippines was actively stimulated through international projects and ClimateCafés taking place there, the Australian hotspot can be explained by a more coincidental meeting. Through presentations about ClimateScan on international conferences, contact was established with someone in Australia who has already had a personal database with Australian projects about rainwater harvesting and bioretention, which he then uploaded to ClimateScan. This coincidental meeting has actually resulted in mutual visits and fieldtrips to see Dutch and Australian nature-based solutions. Although anecdotal, it shows that the idea of mapping nature-based solutions can unite people and strengthen knowledge exchange.
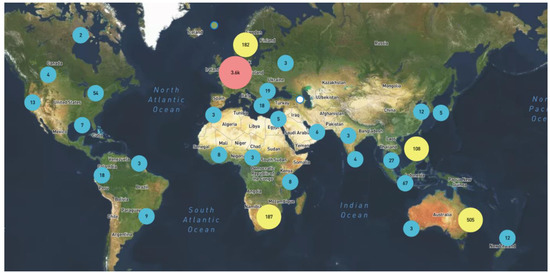
Figure 1.
Geographical distribution of ClimateScan datapoints (source: climatescan.org).
Analyzing the types of nature-based solutions that have been submitted (Figure 2) shows that the biggest categories are bioswales, green roofs and walls, and the Australian measures mentioned above. Bioswales are unsurprisingly the biggest category, as this is the type of measure ClimateScan started with (see history) and is a key interest of the founder of the website and his network. A key design principle of ClimateScan is to be as open as possible, which also means that users can create their own categories. The choice for openness over data accuracy has been made consciously, as ClimateScan is more about stimulating people to upload examples instead of creating a perfect database. As mentioned, ClimateScan has a bottom–up approach and offers the opportunity to analyze what happens if you enable users to create and update content, which is illustrated in the next paragraphs.
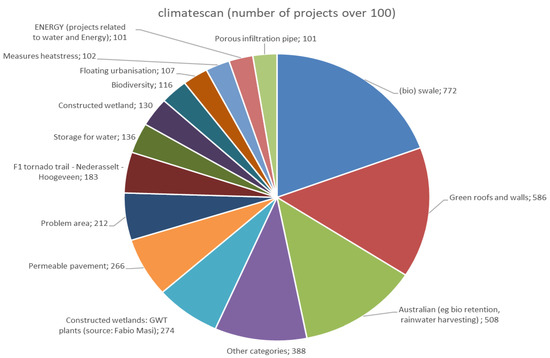
Figure 2.
Overview of nature-based solutions uploaded to ClimateScan, to keep the figure readable only categories with more than 100 projects are depicted (based on ClimateScan database).
Moreover, the openness also has the advantage that it leads to surprising content. For example, a more recent example is the category “tornado trails”, where users follow the traces of storms and the damage they leave in the landscape in The Netherlands. Looking at the Dutch content in particular also shows that the content uploaded on ClimateScan evolves with the climate adaptation debate. In the beginning, most measures uploaded were related to water storage, as flooding has always been a major concern in The Netherlands. Later, the positive impact of nature-based solutions such as green roofs and green walls on heat stress was emphasized more strongly, as The Netherlands suffered from several heatwaves in a row (visible in the naming and categorization of projects, the request by users to be able to assign more than one category to an example). The new category “tornado trails” shows that storms and wind have gained importance in the debate.
The list with the top 15 most visited projects on the ClimateScan platform (see Table 2) includes some very known examples (e.g., waterquares in Rotterdam), but also some rather unknown examples (e.g., swale in Dalfsen). Projects that are uploaded for a longer period have a higher change to be in the top 15 such as the Swale in Haren that was the second project uploaded to the database (last column of Table 2). Hence, ClimateScan also provides a platform for small-scale initiatives and municipalities that usually do not get so much attention. All the projects have in common that they have good visual content, mostly with photos and video footage. For example, the most visited project, the gully free road in the small town Nieuwleusen, includes a video about how the system functions during a heavy rain event (T100).
Table 2.
Top 15 most visited projects on the ClimateScan platform (based on project site visits retrieved from Google Analytics).
To sum up, over the years, ClimateScan had to find a balance between being open and low-threshold to stimulate the upload of examples on the one hand and data maturity on the other. Sometimes, datapoints only include a short text description or only a photo. There is a check on the data quality by the admins, scanning aerial photos and searching the web to validate the datapoint and accompanying information. If possible and in reach, the datapoint is also being visited. In recent years, only few datapoints had to be removed because they included false information or were not meant seriously.
5.2. Users of ClimateScan: Many Registered Users, But Only a Small, Yet Diverse Active Community
Over the years, the attention for ClimateScan has grown, as the timeline with the number of visitors per day shows (see Figure 3). The platform receives on average 100 visits per day, with the highest peak of 1326 (unique) visitors on one day in February 2019 (a day with a university workshop where students were giving an assignment to use ClimateScan as a source for NBS).
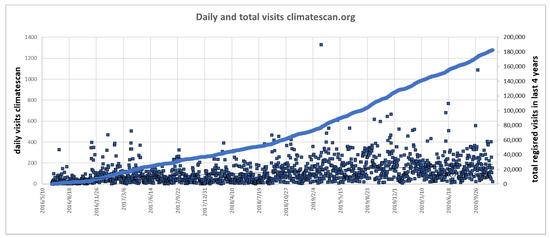
Figure 3.
Daily and total visits of ClimateScan (based on data from Google Analytics).
On 24 September 2020, Climate Scan had 806 registered users, and the numbers keep growing. Some of these users can be subtracted because their registration details show clear signs of bots. Of the remaining 766 registered users, only 233 have actively contributed content to the ClimateScan platform (see Table 3). The data show that people register after ClimateScan has been presented on a conference or a meeting. Hence, the story of the platform seems to spark people’s interest, but they feel not involved enough to actually contribute.
Table 3.
Level of involvement of registered users (based on data from ClimateScan database).
While many users can be linked back to a particular event or project, there are also several users that can be considered unexpected users: for example, a user uploading two green roofs in Moscow, although there have never been any links to Russia. Another unexpected user in The Netherlands contributes a rather unconventional solution from his own property: a trampoline with water storage, with a sketch explaining the technical details of how it works (see Figure 4). The Canadian citizen initiative “Depave Paradise” has reached out through social media and subsequently submitted several projects that they have worked on. These projects concerned a transformation of places dominated by asphalt and stones into green spaces, with a “before” and “after” illustration for each project. The online communication with this initiative revealed that they presented themselves on ClimateScan to get in touch with similar initiatives in Europe.
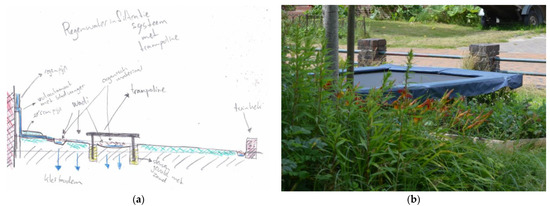
Figure 4.
(a)Trampoline with water storage, technical sketch (source: climatescan.org) and (b) photo of the actual implementation.
Depave Paradise belongs to the 25 top users that have uploaded 10 or more projects. For the majority of these top users, there has been offline contact first (e.g., through a conference, a project or a meeting), which has stimulated the person to register and contribute to the map. As a result of this offline contact, we could also classify from which sector these top users are coming (see Figure 5).
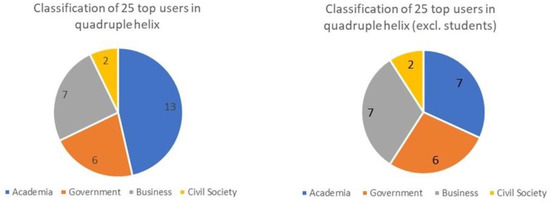
Figure 5.
Classification of 25 top users in quadruple helix, with two people having a double function “academia” and “business”, and one person having a double function “government” and “business”. Left chart including students, right chart excluding students.
Although most of the users can be related to academia, as Hammill et al. (2013) [9] found in their study, there are also quite a few top users that come from business parties or local governments. The distribution between academia, government and business parties is actually rather even, when students are excluded who usually contribute to ClimateScan as part of an assignment. Only civil society is still rather underrepresented. The low representation of civil society is not surprising, as they have not yet been targeted directly. For business parties, it is an opportunity to present the exact locations of their own innovations in the field (e.g., water harmonica or a particular permeable pavement). Interestingly, only two of the seven top users on ClimateScan coming from business parties use ClimateScan as such; the others also upload other examples simply because they are interested in the topic and experience it as fun to share these examples with a wider audience. The representatives from government mostly come from municipalities and like to share examples of nature-based solutions and climate adaptation from their own city (e.g., Nijmegen, Groningen, and Enschede). While motives such as pride and a certain element of competitiveness certainly play a role, we also know from personal conversations with representatives from municipalities in The Netherlands that ClimateScan gives them the opportunity to create an overview of the nature-based solutions in their municipality. Often, municipalities in The Netherlands do not have such an overview, because measures such as NBS cannot easily be included in the usual sewer asset management software, which is being used to calculate storage capacity and floodings in the urban areas. Therefore, local government officials also use ClimateScan as a free data repository for themselves and in order to draw more attention to these nature-based solutions.
The ClimateScan community that is active and shows a high level of commitment is small yet diverse in their backgrounds. ClimateScan has contributed to intensified contacts between some of the top users. For example, some of the top users have actually made appointments to go “treasure hunting” on the weekends, in which they try to find new and innovative examples of climate adaptation.
6. Discussions and Conclusions
This paper addresses how online knowledge-sharing platforms can stimulate stakeholder engagement and promote NBS by providing in depth insights into the case of ClimateScan—an innovative, bottom–up approach to map best practices of NBS around the world using citizen science.
Based on an analysis of the content, the actual users, and the community behind the ClimateScan platform, we have identified the following potentials and pitfalls of ClimateScan.
A typical concern related to online platforms is that many online platforms are only managed actively for a certain period of time and content becomes quickly outdated [10]. A strength of ClimateScan’s citizen science approach is that the database and user numbers only keep growing. Moreover, the content of the platform is “adaptive” and does not easily run the risk of being outdated, as users themselves create and update the content of the website with concrete examples of NBS. Since concrete examples are a manifest of their time, the website can also grow with changing terminology or new developments in the debate (see example “tornado trails”). However, the freedom that is given to users in the way they describe and illustrate examples also leads to varying data maturity and a rather heterogeneous database. Some data points are filled with much information and visual materials, whereas others only contain a dot on the map and a rough description. Although some variation in data maturity will always remain with a citizen science approach, better guidance on the website in the form of video tutorials as well as the training of volunteers would improve the overall data quality. To create a more homogeneous and neater dataset, this training could find inspiration in existing classifications of NBS [1,2,3]. As visual information seems to be most appealing, the addition of photos and video material could be made a requirement during the data submission process.
Another concern related to online adaptation platforms refers to the actual users and the inclusivity of online adaptation platforms. Online platforms often tend to have an overrepresentation of researchers and the Global North [9]. ClimateScan certainly shows similar characteristics, with a dominance of uploaded projects from The Netherlands and Western Europe due to its origin and active promotion in The Netherlands. However, looking at the top users and their background shows that ClimateScan is appealing not only to researchers but also representatives from business parties and local governments. ClimateScan has managed to give a platform to small-scale initiatives that are otherwise undocumented and receive hardly any attention. To further increase its usage, ClimateScan should maintain and further build on its “niche function”. The focus on small-scale measures such as (bio)swales, green roofs, and green walls and their design makes it low key and easy for registered users to upload examples, as the imagery can speak for itself, and no detailed knowledge of the example is necessary.
Last but not least, online adaptation platforms often struggle with creating and maintaining a well-functioning community of practice [9,10]. The openness of the website and active promotion in online and offline fora has resulted in quite a diverse and practice-oriented user group. However, although quite an amount of people have registered over the years, people seem to lose interest after a while. Engaging with the ClimateScan community with workshops and social media updates could stimulate long-term engagement and recruit new users. Here, we can learn from the motivations of top users, which show that mapping can unite people and that mapping together can be a fun activity. Workshops could address different actor groups. Creating teams and using the element of competitiveness (who finds most nature-based solutions in a short amount of time) could be an idea to grow and foster the ClimateScan community in the future.
Author Contributions
Conceptualization, B.R.; methodology, B.R. and F.C.B.; software, B.R. and F.C.B.; validation, B.R. and F.C.B.; formal analysis, B.R. and F.C.B.; investigation, B.R. and F.C.B.; resources, F.C.B.; data curation, F.C.B.; writing—original draft preparation, B.R.; writing—review and editing, B.R. and F.C.B.; visualization, B.R. and F.C.B.; funding acquisition, F.C.B. All authors have read and agreed to the published version of the manuscript.
Funding
ClimateScan was applied as a tool in the international project WaterCoG (WaterCo-Governance) co-funded by the North Sea Region Programme 2014–2021. Ref: http://waterjpi.eu/jointcalls/joint-call-2015/funded-projects-under-the-2015-water-jpi-joint-call and https://northsearegion.eu/watercog/.
Informed Consent Statement
Informed consent was obtained from all subjects involved in the study.
Data Availability Statement
Data available in a publicly accessible repository. The data presented in this study are openly available in climatescan.org.
Acknowledgments
We would like to thank everyone who has contributed to ClimateScan over the years. Without the effort of these volunteers, ClimateScan would not be such a lively platform. Moreover, we would like to thank Koen Salemink for his helpful suggestions during the writing process.
Conflicts of Interest
The authors declare no conflict of interest.
References
- Babí Almenar, J.; Elliot, T.; Rugani, B.; Philippe, B.; Navarrete Gutierrez, T.; Sonnemann, G.; Geneletti, D. Nexus between nature-based solutions, ecosystem services and urban challenges. Land Use Policy 2021, 100, 104898. [Google Scholar] [CrossRef]
- Raymond, C.M.; Frantzeskaki, N.; Kabisch, N.; Berry, P.; Breil, M.; Nita, M.R.; Geneletti, D.; Calfapietra, C. A framework for assessing and implementing the co-benefits of nature-based solutions in urban areas. Environ. Sci. Policy 2017, 77, 15–24. [Google Scholar] [CrossRef]
- Raymond, C.M.; Berry, P.; Breil, M.; Nita, M.R.; Kabisch, N.; de Bel, M.; Enzi, V.; Frantzeskaki, N.; Geneletti, D.; Cardinaletti, M.; et al. An Impact Evaluation Framework to Support Planning and Evaluation of Nature-Based Solutions Projects. Report Prepared by the EKLIPSE Expert Working Group on Nature-Based Solutions to Promote Climate Resilience in Urban Areas; Centre for Ecology & Hydrology: Wallingford, UK, 2017. [Google Scholar]
- Kabisch, N.; Frantzeskaki, N.; Pauleit, S.; Naumann, S.; Davis, M.; Artmann, M.; Haase, D.; Knapp, S.; Korn, H.; Bonn, A.; et al. Nature-based solutions to climate change mitigation and adaptation in urban areas: Perspectives on indicators, knowledge gaps, barriers, and opportunities for action. Ecol. Soc. 2016, 21, 39. [Google Scholar] [CrossRef]
- Nesshöver, C.; Assmuth, T.; Irvine, K.N.; Rusch, G.M.; Waylen, K.A.; Delbaere, B.; Haase, D.; Jones-Walters, L.; Keune, H.; Wittmer, H.; et al. The science, policy and practice of nature-based solutions: An interdisciplinary perspective. Sci. Total Environ. 2017, 579, 1215–1227. [Google Scholar] [CrossRef] [PubMed]
- Global Commission on Adaptation. Adapt Now: A Global Call for Leadership on Climate Resilience. 2019. Available online: https://cdn.gca.org/assets/2019-09/GlobalCommission_Report_FINAL.pdf (accessed on 14 December 2020).
- Palutikof, J.P.; Street, R.B.; Gardiner, E.P. Decision support platforms for climate change adaptation: An overview and introduction. Clim. Chang. 2019, 153, 459–476. [Google Scholar] [CrossRef]
- Uitermark, J. Longing for Wikitopia: The study and politics of self-organisation. Urban Stud. 2015, 52, 2301–2312. [Google Scholar] [CrossRef]
- Hammill, A.; Harvey, B.; Echeverria, D. Knowledge for action: An analysis of the use of online climate knowledge. Knowl. Manag. Dev. J. 2013, 9, 72–92. [Google Scholar]
- Palutikof, J.P.; Street, R.B.; Gardiner, E.P. Looking to the future: Guidelines for decision support as adaptation practice matures. Clim. Chang. 2019, 643–655. [Google Scholar] [CrossRef]
- Hewitson, B.; Waagsaether, K.; Wohland, J.; Kloppers, K.; Kara, T. Climate information websites: An evolving landscape. Wiley Interdiscip. Rev. Clim. Chang. 2017, 8, 1–22. [Google Scholar] [CrossRef]
- Fischer, F. Democracy and Expertise: Reorienting Policy Inquiry; Oxford University Press: Oxford, UK, 2009. [Google Scholar]
- Fischer, F. Technocracy and the Politics of Expertise, 1st ed.; SAGE Publications: London, UK, 1990. [Google Scholar]
- Carayannis, E.G.; Campbell, D.F.J. “Mode 3” and “Quadruple Helix”: Toward a 21st century fractal innovation ecosystem. Int. J. Technol. Manag. 2009, 46, 201–234. [Google Scholar] [CrossRef]
- Colloff, M.J.; Martín-López, B.; Lavorel, S.; Locatelli, B.; Gorddard, R.; Longaretti, P.Y.; Walters, G.; van Kerkhoff, L.; Wyborn, C.; Coreau, A.; et al. An integrative research framework for enabling transformative adaptation. Environ. Sci. Policy 2017, 68, 87–96. [Google Scholar] [CrossRef]
- Porter, J.J.; Dessai, S. Mini-me: Why do climate scientists’ misunderstand users and their needs? Environ. Sci. Policy 2017, 77, 9–14. [Google Scholar] [CrossRef]
- Fletcher, T.D.; Shuster, W.; Hunt, W.F.; Ashley, R.; Butler, D.; Arthur, S.; Trowsdale, S.; Barraud, S.; Semadeni-Davies, A.; Viklander, M.; et al. SUDS, LID, BMPs, WSUD and more—The evolution and application of terminology surrounding urban drainage. Urban Water J. 2015, 12, 525–542. [Google Scholar] [CrossRef]
- Tennekes, J.; Driessen, P.P.J.; van Rijswick, H.F.M.W.; van Bree, L. Out of the Comfort Zone: Institutional Context and the Scope for Legitimate Climate Adaptation Policy. J. Environ. Policy Plan. 2014, 16, 241–259. [Google Scholar] [CrossRef]
- West, S.; Pateman, R. How Could Citizen Science Support the Sustainable Development Goals? In Policy Brief; Stockholm Environment Institute: Stockholm, Sweden, 2017; p. 8. Available online: https://www.sei-international.org/mediamanager/documents/Publications/SEI-2017-PB-citizen-science-sdgs.pdf (accessed on 14 December 2020).
- Mariën, I.; Heyman, R.; Salemink, K.; Van Audenhove, L. Digital by Default: Consequences, Casualties and Coping Strategies. In Social Inequalities, Media and Communication: Theory and Roots; Servaes, J., Oyedemi, T., Eds.; Lexington Books: Lanham, MD, USA, 2016; pp. 167–188. [Google Scholar]
- Salemink, K.; Strijker, D.; Bosworth, G. Rural development in the digital age: A systematic literature review on unequal ICT availability, adoption, and use in rural areas. J. Rural Stud. 2017, 54, 360–371. [Google Scholar]
- IPCC. Global Warming of 1.5 °C. An IPCC Special Report on the Impacts of Global Warming of 1.5°C above Pre-Industrial Levels and Related Global Greenhouse Gas Emission Pathways, in the Context of Strengthening the Global Response to the Threat of Climate Change; IPCC: Geneva, Switzerland, 2018. [Google Scholar] [CrossRef]
- Boogaard, F. Stormwater Characteristics and New Testing Methods for Certain SUSTAINABLE urban Drainage Systems in The Netherlands. Ph.D. Thesis, Technische Universiteit Delft, Delft, The Netherlands, July 2015. [Google Scholar] [CrossRef]
- Boogaard, F.; Lucke, T. Long-term infiltration performance evaluation of Dutch permeable pavements using the full-scale infiltration method. Water 2019, 11, 320. [Google Scholar] [CrossRef]
- Kluck, J.; Boogaard, F. Climate Resilient Urban Retrofit at Street Level. In Climate Resilient Urban Areas; De Graaf, R., Ed.; Palgrave Macmillan: London, UK, 2021; pp. 45–66. [Google Scholar]
- Tipping, J.; Boogaard, F.; Jaeger, R.; Duffy, A.; Klomp, T.; Manenschijn, M. Climatescan.nl: The development of a web-based map application to encourage knowledge-sharing of climate-proofing and urban resilient projects. In Proceedings of the Amsterdam International Water Week, Amsterdam, The Netherlands, 2–6 November 2015. [Google Scholar]
- Boogaard, F.C.; Venvik, G.; de Lima, R.L.P.; Cassanti, A.C.; Roest, A.H.; Zuurman, A. ClimateCafe: An interdisciplinary educational tool for sustainable climate adaptation and lessons learned. Sustainability 2020, 12, 3694. [Google Scholar] [CrossRef]


Publisher’s Note: MDPI stays neutral with regard to jurisdictional claims in published maps and institutional affiliations. |
© 2020 by the authors. Licensee MDPI, Basel, Switzerland. This article is an open access article distributed under the terms and conditions of the Creative Commons Attribution (CC BY) license (http://creativecommons.org/licenses/by/4.0/).