Article

Decomposition Analysis of Water Treatment Technology Patents

1
Graduate School of Fisheries and Environmental Sciences, Nagasaki University, Nagasaki 852-8521, Japan
2
Urban Institute & Department of Urban and Environmental Engineering, Kyushu University, 744 Motooka, Nishi-ku, Fukuoka 819-0395, Japan
*
Author to whom correspondence should be addressed.
Water 2017, 9(11), 860; https://doi.org/10.3390/w9110860
Submission received: 25 August 2017 / Revised: 1 November 2017 / Accepted: 3 November 2017 / Published: 6 November 2017
(This article belongs to the Special Issue Recent Advances in Water Management: Saving, Treatment and Reuse)

Abstract

:
Water treatment technology development supports a steady, safe water supply. This study examines trends in water treatment technology innovations, using 227,365 patent granted data published from 1993 to 2016 as an indicator of changing research and development (R&D) priorities. To clarify changes in R&D priorities, we used a decomposition analysis framework that classified water treatment technologies into five types: conventional treatment (117,974 patents, 51.9%), biological treatment (40,300 patents, 17.7%), multistage treatment (45,732 patents, 20.1%), sludge treatment (15,237 patents, 6.7%), and other treatments (8122 patents, 3.6%). The results showed that the number of water treatment technology patents granted increased more than 700% from 1993 to 2016; in particular, the number of multistage water treatment patents granted rapidly grew. The main driver of this growth was expansion in the R&D activity scale and an increase in the priority of multistage water treatment technology in China. Additionally, the trends and priority changes in water treatment technology inventions varied by country and technology groups, which implied that an international policy framework for water treatment technology development should recognize that R&D priorities need to reflect the diverse characteristics of countries and technologies.

1. Introduction

Water treatment technology creates steady and safe water resources [1,2]. The global importance of water treatment technology has been increasing, especially in developing countries [3]. According to World Health Organization (WHO) and United Nations Children’s Fund (UNICEF) [4], in 2015, 844 million people still lacked basic drinking water services, and 892 million people still practiced open defecation. These low-quality water treatment activities increase the risk of disease through the use of polluted surface water for household activities [5]. To improve drinking water quality and sanitation services, the development and diffusion of efficient and affordable water treatment technologies have attracted attention.
Because of water resource problems, the water management issue was individually established as the goal 6, i.e., “Ensure availability and sustainable management of water and sanitation for all”, in the sustainable development goals (SDGs) adopted by the United Nations [6]. To achieve this goal, the development of water treatment technology is a key factor in accelerating improvements in water quality [2]. Additionally, the Chinese government released a water pollution prevention and control action plan (the Water Ten Plan) in 2015. In this plan, the Chinese government vowed to improve nationwide water quality by 2030, also pledging to spend billions of dollars [7].
Against the backdrop of the acceleration in water treatment technology development, the number of patents granted has rapidly increased. Figure 1 shows the number of water treatment patents granted by the patent office (Figure 1a) and technology type (Figure 1b). Figure 1 shows that the number of water treatment patents has increased more than threefold, i.e., from 8843 in 2009 to 28,181 in 2016. In particular, water treatment patents granted in China (SIPO) rapidly increased during this period (Figure 1a).
As shown in Figure 1b, the patent share of each water treatment technology type changed from 2009 to 2016. In 2009, conventional water treatment technology had the largest share of the patented water treatment technologies. However, from 2009 to 2016, the number of patents granted for multistage water treatment technology rapidly increased.
Additionally, water treatment technology demands are different in different regions because water is linked to the local lifestyles and weather conditions. According to UN-Water [8], the subjects that are the most challenging for coordination and agreements are the work areas related to integrated water resources management (IWRM), transboundary waters, capacity development, water and sanitation, and climate change. Furthermore, the appropriate water treatment technology differs based on the type of water pollution because contaminants and pollutant substances are diverse.
Thus, the incentives for water treatment technology inventions clearly vary among the regions and types of technology. Clarifying the characteristics of each water treatment technology type is important for formulating an effective policy that encourages water treatment technology research and development. Based on this background, the objective of this study is to clarify the strategy changes in the water treatment technology development using patent data that is categorized by country and technology type.
To consider the differences in the water treatment technology types, we classified the water treatment technology patents based on the World Intellectual Property Organization (WIPO) [9] classification using the International Patent Classification (IPC) code (see Table S1 in Supplementary Materials). In this study, we defined water treatment as the “treatment of water, wastewater, sewage, and sludge”, which is the IPC=C02F definition that was introduced by the WIPO [9]. Additionally, we divided the patent data into the following five water treatment technology groups: (1) conventional water treatment (Conventional), (2) biological water treatment (Biological), (3) multistage water treatment (Multistage), (4) sludge treatment (Sludge), and (5) other water treatment technology (Other) (see Table 1).
Previous literature has mostly focused on the development of water treatment technologies. Most literature is based on natural sciences, especially chemical and engineering research fields. Rodriguez-Narvaez et al. [10] surveyed approximately 200 reports on water treatment technology for emerging contaminants. They indicated that recent research tended to use phase-changing processes, including adsorption onto different solid matrices and in membrane processes, followed by advanced oxidation processes and biological treatment for water treatment. Subramani and Jacangelo [11] published a critical review on emerging desalination technologies for water treatment and focused on thermal-based, membrane-based, and alternative technologies.
Some literature has focused on specific water treatment technologies. Palma et al. [12] investigated the efficiency of membrane technology for water treatment processes. They used nanofiltration membranes and reverse osmosis membranes for three types of water, i.e., irrigation water, municipal supply water, and wastewater. Alzahrani and Mohammad [13] focused on membrane technology implementation for water treatment in the petroleum industry. In addition to these membrane studies, Temesgen et al. [14] reported the trends in micro- and nano-bubble technology for water treatment, which included more than 150 reports.
Limited literature reports are available on water treatment technologies using social science approaches. Fujii and Managi [15] evaluated wastewater treatment efficiencies using a production function approach, and set the water pollution data as the undesirable output factor. Another social science approach is patent data analysis. Hara et al. [16] analyzed the historical development of wastewater and sewage sludge treatment technologies in Japan using patent data. Another patent data analysis was introduced by Fujii and Managi [17], and the analysis clarified the main driver of environmentally related technology in Japan using a decomposition analysis.
While literature about water treatments exists, most studies focus on the efficiencies of the technologies, and studies on the priority changes in technology development are limited. Based on this background, we propose a research framework to investigate the priority changes in water treatment technology using patent data. This research is the first to use patent data that is related to water treatment technologies to clarify priority changes in research and development using a decomposition analysis framework.
Patent data analyses are widely applied to evaluate research and development activities in the fields of engineering, economics, and corporate management [18]. Popp [19] analyzed the effect of energy prices on research and development activities using patent data. He considered the share of energy-related patents granted to the total patents granted as the proxy variable of research and development priority for energy technology. Fujii [20] used this idea to develop the patent decomposition analysis framework.
According to Haščič and Migotto [21], there are several advantages and limitations of using patent data. The advantages of patent data are that the data are widely available from public databases and can be used for quantitative analyses. Additionally, patent data can be disaggregated into specific technological fields, such as water treatments, in this study.
The limitations of patent data include the following. First, “not all innovations are patentable”, and “not all patentable inventions are patented”. Therefore, patent data does not account for all of the innovations. According to Smith [22], many water treatment innovations have been produced in slum areas (e.g., the SONO water filter and Safe Agua Water System). These frugal technologies are community or need-based, and technology diffusion and adoption by many people is the priority target. The patent system is not useful for these technologies because patent protection affords exclusive rights to the patent holder to exploit the invention. Additionally, in a patent data analysis, identifying the type of water being treated is difficult because water treatment technologies are applied to many types of water, including wastewater, drinking water, and agricultural water. Patent data can distinguish the water treatment method but not the type of water that was treated. Therefore, this study analyzes water treatment technology development by focusing on the water treatment method.
Finally, the true value of patents and their perception in different countries is not the same. This is because guidelines and examination standards are not the same among different countries [23]. Therefore, a comparative analysis among countries should carefully consider this point.

2. Methods

This study uses a decomposition analysis framework to clarify the changing factors that are involved in granting water treatment technology patents. We use the following three indicators to decompose the water treatment technology patents granted: the priority of a specific water treatment technology (PRIORITY), the importance of the water treatment technology among all of the patents granted (WTT), and the research and development (R&D) activity scale (SCALE).
We define the PRIORITY indicator as the number of specific water treatment patents granted, divided by the total number of water treatment patents granted to provide the share of the specific water treatment patents granted among the total water treatment patents. As explained in Table 1, we set five specific water treatment technologies, i.e., conventional treatment, biological treatment, multistage treatment, sludge treatment, and other treatment. The PRIORITY indicator increases if the number of specific water treatment patents granted increases more quickly than the total number of water treatment patents granted, and indicates that inventors are concentrating research resources on specific types of water treatment technology inventions. Inventors are prioritizing specific water treatment technology types over other types when PRIORITY increases.
Similarly, the WTT indicator is defined as the total number of water treatment patents granted, divided by the total number of patents granted, which indicates the share of the total water treatment patents of the total patents. This indicator increases if the number of total water treatment patents granted increases more quickly than the number of total patents granted, indicating that inventors are concentrating research resources on water treatment technology inventions. Inventors are prioritizing the invention of water treatment technology over other types of technology when WTT increases.
The SCALE indicator is defined as the total number of patents granted and represents the scale of the R&D activities. Generally, active R&D efforts promote the invention of new technologies. Thus, the total number of patents granted reflects the active R&D effort level. Additionally, R&D activities in companies depend on corporate financial circumstances because the number of patents granted is associated with the cost of researcher salaries, experimental materials, and applying for and registering patents. SCALE increases as the total number of patents granted increases. If the SCALE score increases, then the number of patents granted for water treatment technology increases with the increase in the overall R&D activities.
Here, we introduce a decomposition approach using the conventional treatment technology patent group as a specific type of water treatment patent granted (Table 1). The number of conventional treatment technology patents granted (CONVENTIONAL) is decomposed using the total water treatment patents granted (ALLWATER) and total patents granted (TOTAL), as in Equation (1).
CONVENTIONAL = CONVENTIONAL ALLWATER × ALLWATER TOTAL × TOTAL = PRIORITY × WTT × SCALE
We consider the change in conventional treatment patents granted from year t − 1 (CONVENTIONALt−1) to year t (CONVENTIONALt). Using Equation (1), the growth ratio of the conventional treatment patents granted can be represented as follows:
CONVENTIONAL t CONVENTIONAL t 1 = PRIORITY t PRIORITY t 1 × WTT t WTT t 1 × SCALE t SCALE t 1
We transform Equation (2) into a natural logarithmic function to obtain Equation (3). Notably, zero values in the dataset cause problems in the decomposition formulation due to the properties of logarithmic functions. To solve this problem, Ang and Liu [24] suggested replacing zero values with a small positive number.
lnCONVENTIONAL t lnCONVENTIONAL t 1 = ln ( PRIORITY t PRIORITY t 1 ) + ln ( WTT t WTT t 1 ) + ln ( SCALE t SCALE t 1 )
Multiplying both sides of Equation (3) by ω i t = ( CONVENTIONAL t CONVENTIONAL t 1 ) / ( lnCONVENTIONAL t lnCONVENTIONAL t 1 ) yields Equation (4), as follows.
CONVENTIONAL t CONVENTIONAL t 1 = CONVENTIONAL t , t 1 = ω i t ln ( PRIORITY t PRIORITY t 1 ) + ω i t ln ( WTT t WTT t 1 ) + ω i t ln ( SCALE t SCALE t 1 ) .
Therefore, changes in the number of patents granted for conventional treatment technologies (⊿CONVENTIONAL) are decomposed by changes in the PRIORITY (first term), WTT (second term), and SCALE (third term). The term ω i t operates as an additive weight for the estimated number of patents granted for conventional treatment technologies.

3. Data and Results

3.1. Data

We use the patents granted data from PATENTSCOPE (http://www.wipo.int/patentscope/en/), which is provided by the World Intellectual Property Organization (WIPO). The PATENTSCOPE database covers more than 56 million patents granted from 1978 to 2016. The data coverage by country and period are shown in Table S2 in the Supplementary Materials.
Because the PATENTSCOPE data coverage for Japan, which is a major water treatment technology innovator, began after 1993, we use the patent dataset from 1993 to 2016 (see Table S2). Following Fujii [20], we only use the primary IPC code to categorize the technology group to avoid double counting patent data in each technology group.
The PATENTSCOPE database and search strategy with IPC in Table S1 determined that 227,365 water treatment technology patents were filed from 1993 to 2016. The composition of each technology group is as follows: conventional treatment (117,974 patents, 51.9%), biological treatment (40,300 patents, 17.7%), multistage treatment (45,732 patents, 20.1%), sludge treatment (15,237 patents, 6.7%), and other treatments (8122 patents, 3.6%).

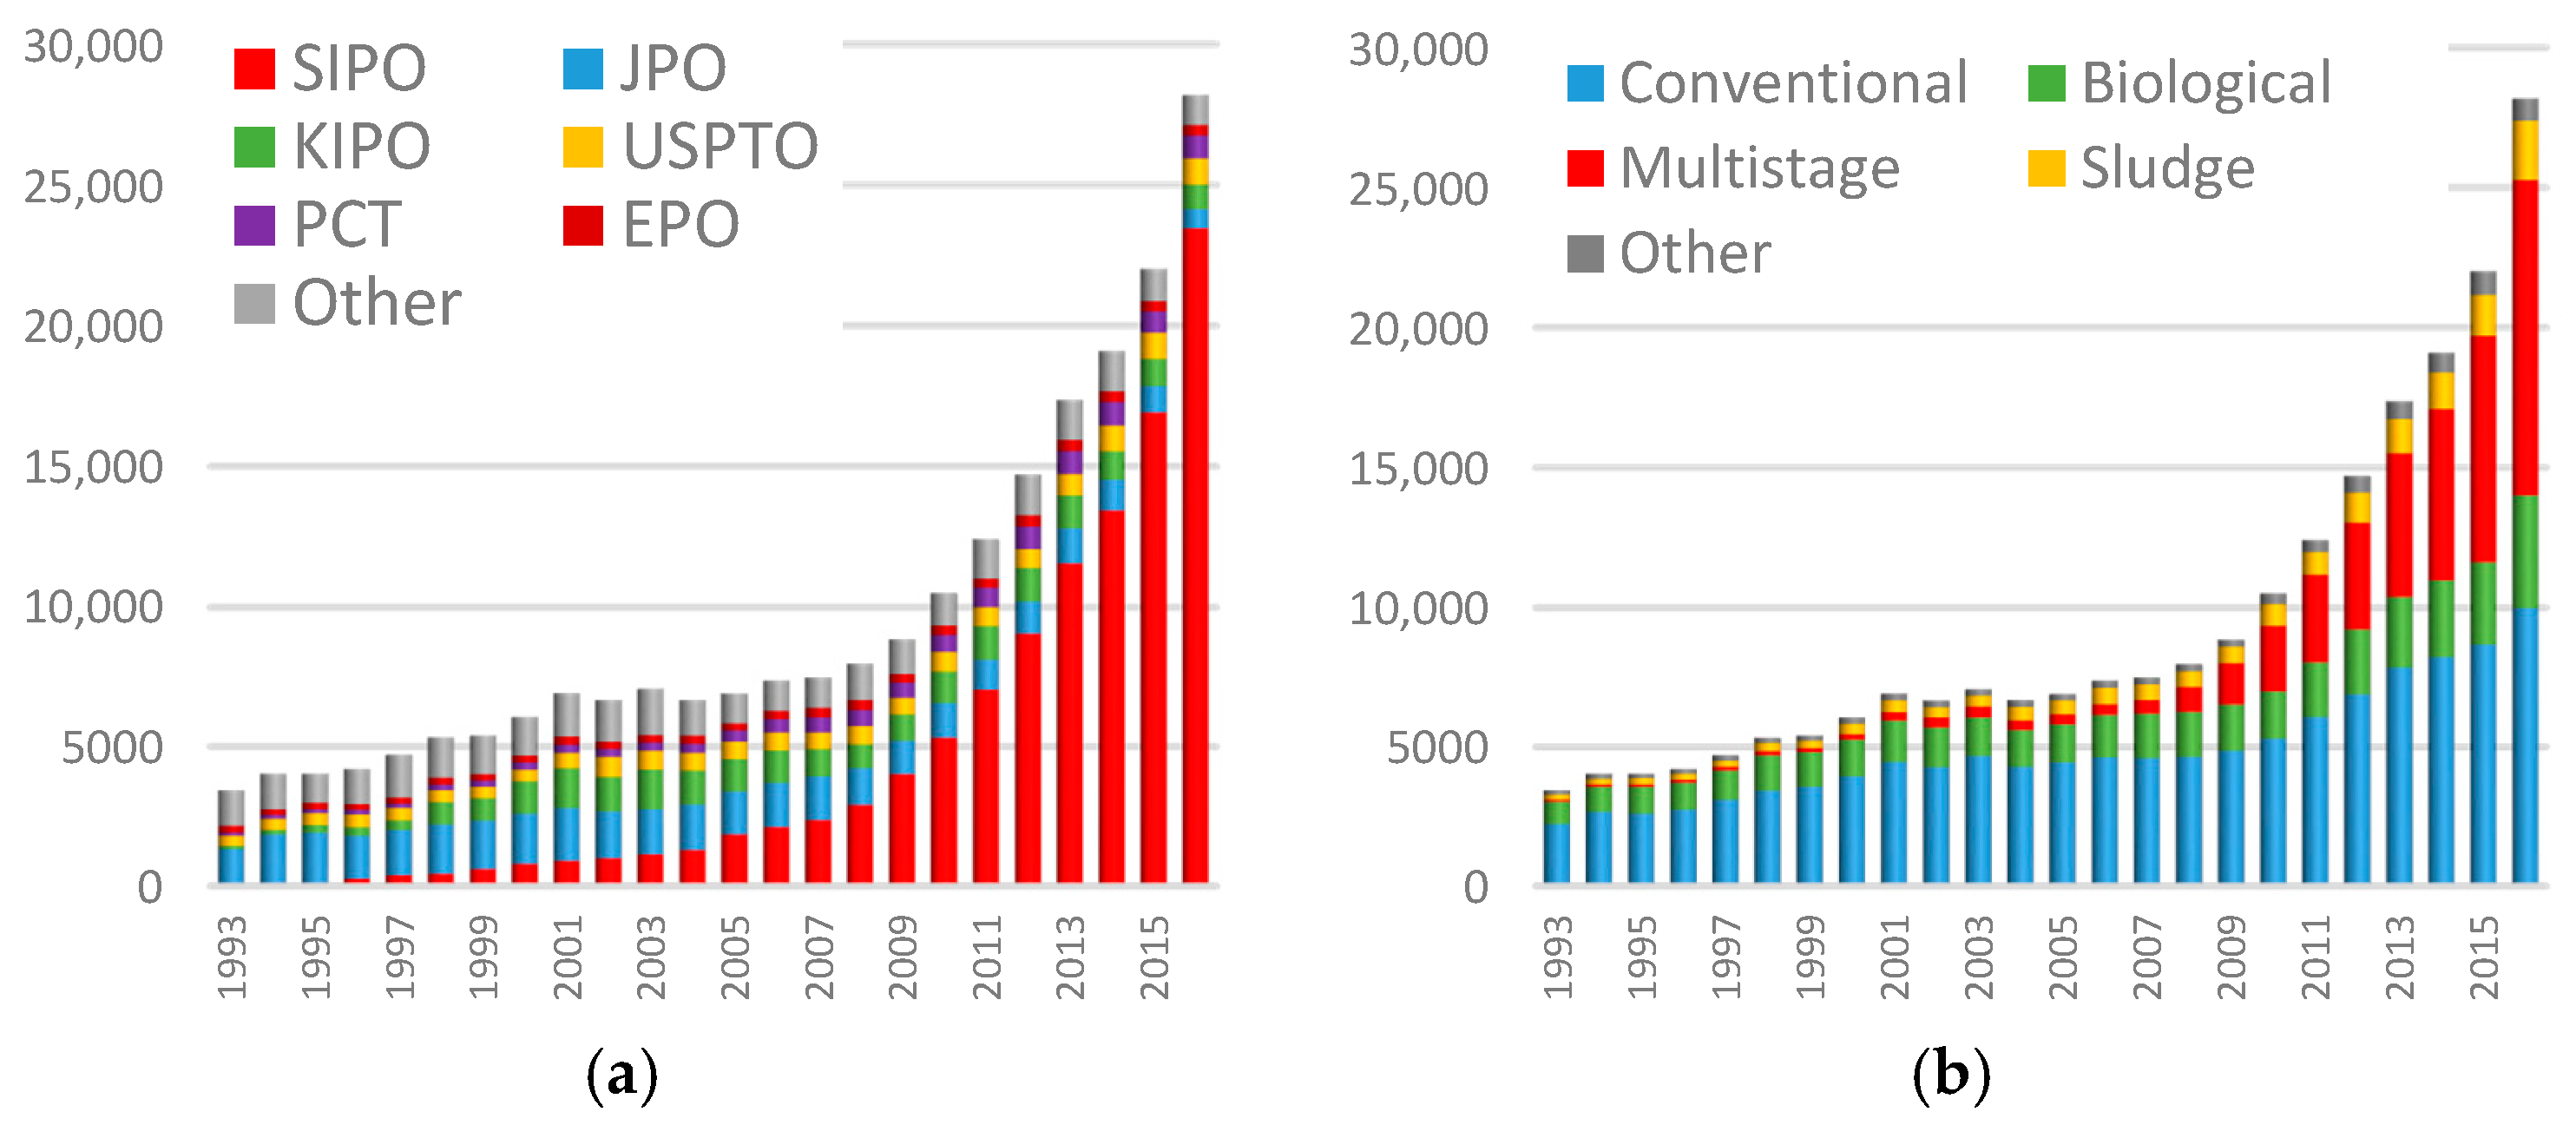
3.2. Trends in Water Treatment Technology Patent Inventions

Table 2 shows the changes in the water treatment technology patents granted by type of technology for each patent office. The composition of the patents granted shares differs among the countries.
Table 2 shows that conventional water treatment technology represents more than half of the total number of water treatment technology patents granted in most countries, whereas multistage water treatment technology is the major technology type granted by the SIPO. The share of the multistage water treatment technology is only 0.4% for the JPO, which is extremely low when compared with that for the other patent offices.
Next, we consider the numerical changes in the water treatment technology patents granted. As shown in Table 2, all of the patent offices, except for the JPO, had increased water treatment technology patent publications from the period of 1993–1998 to 2011–2016. However, the number of patents granted by the JPO was the largest from 1993 to 1998 for conventional, biological, and sludge treatment technologies. One interpretation of this result is that the water treatment technology demand increased in Japan after the basic environmental law was enforced in 1993 [16].
Notably, the number of patents granted by the SIPO increased more than four times, i.e., from 18,548 during 2005–2010 to 81,472 during 2011–2016. This patent publication growth was observed for all five water technology types in China. One major driver promoting water treatment technology development in China is “a water pollution prevention and control action pan (Water Ten Plan)”, which was released by the Chinese government in 2015 [25]. The Chinese government expects the Water Ten Plan to create 1.9 trillion RMB in new investments for water treatment [26]. According to Fujii and Managi [17], technology innovation is induced by future business market expansion. Therefore, innovators have a strong incentive for water treatment technology development because of future business opportunities supported by the Water Ten Plan.

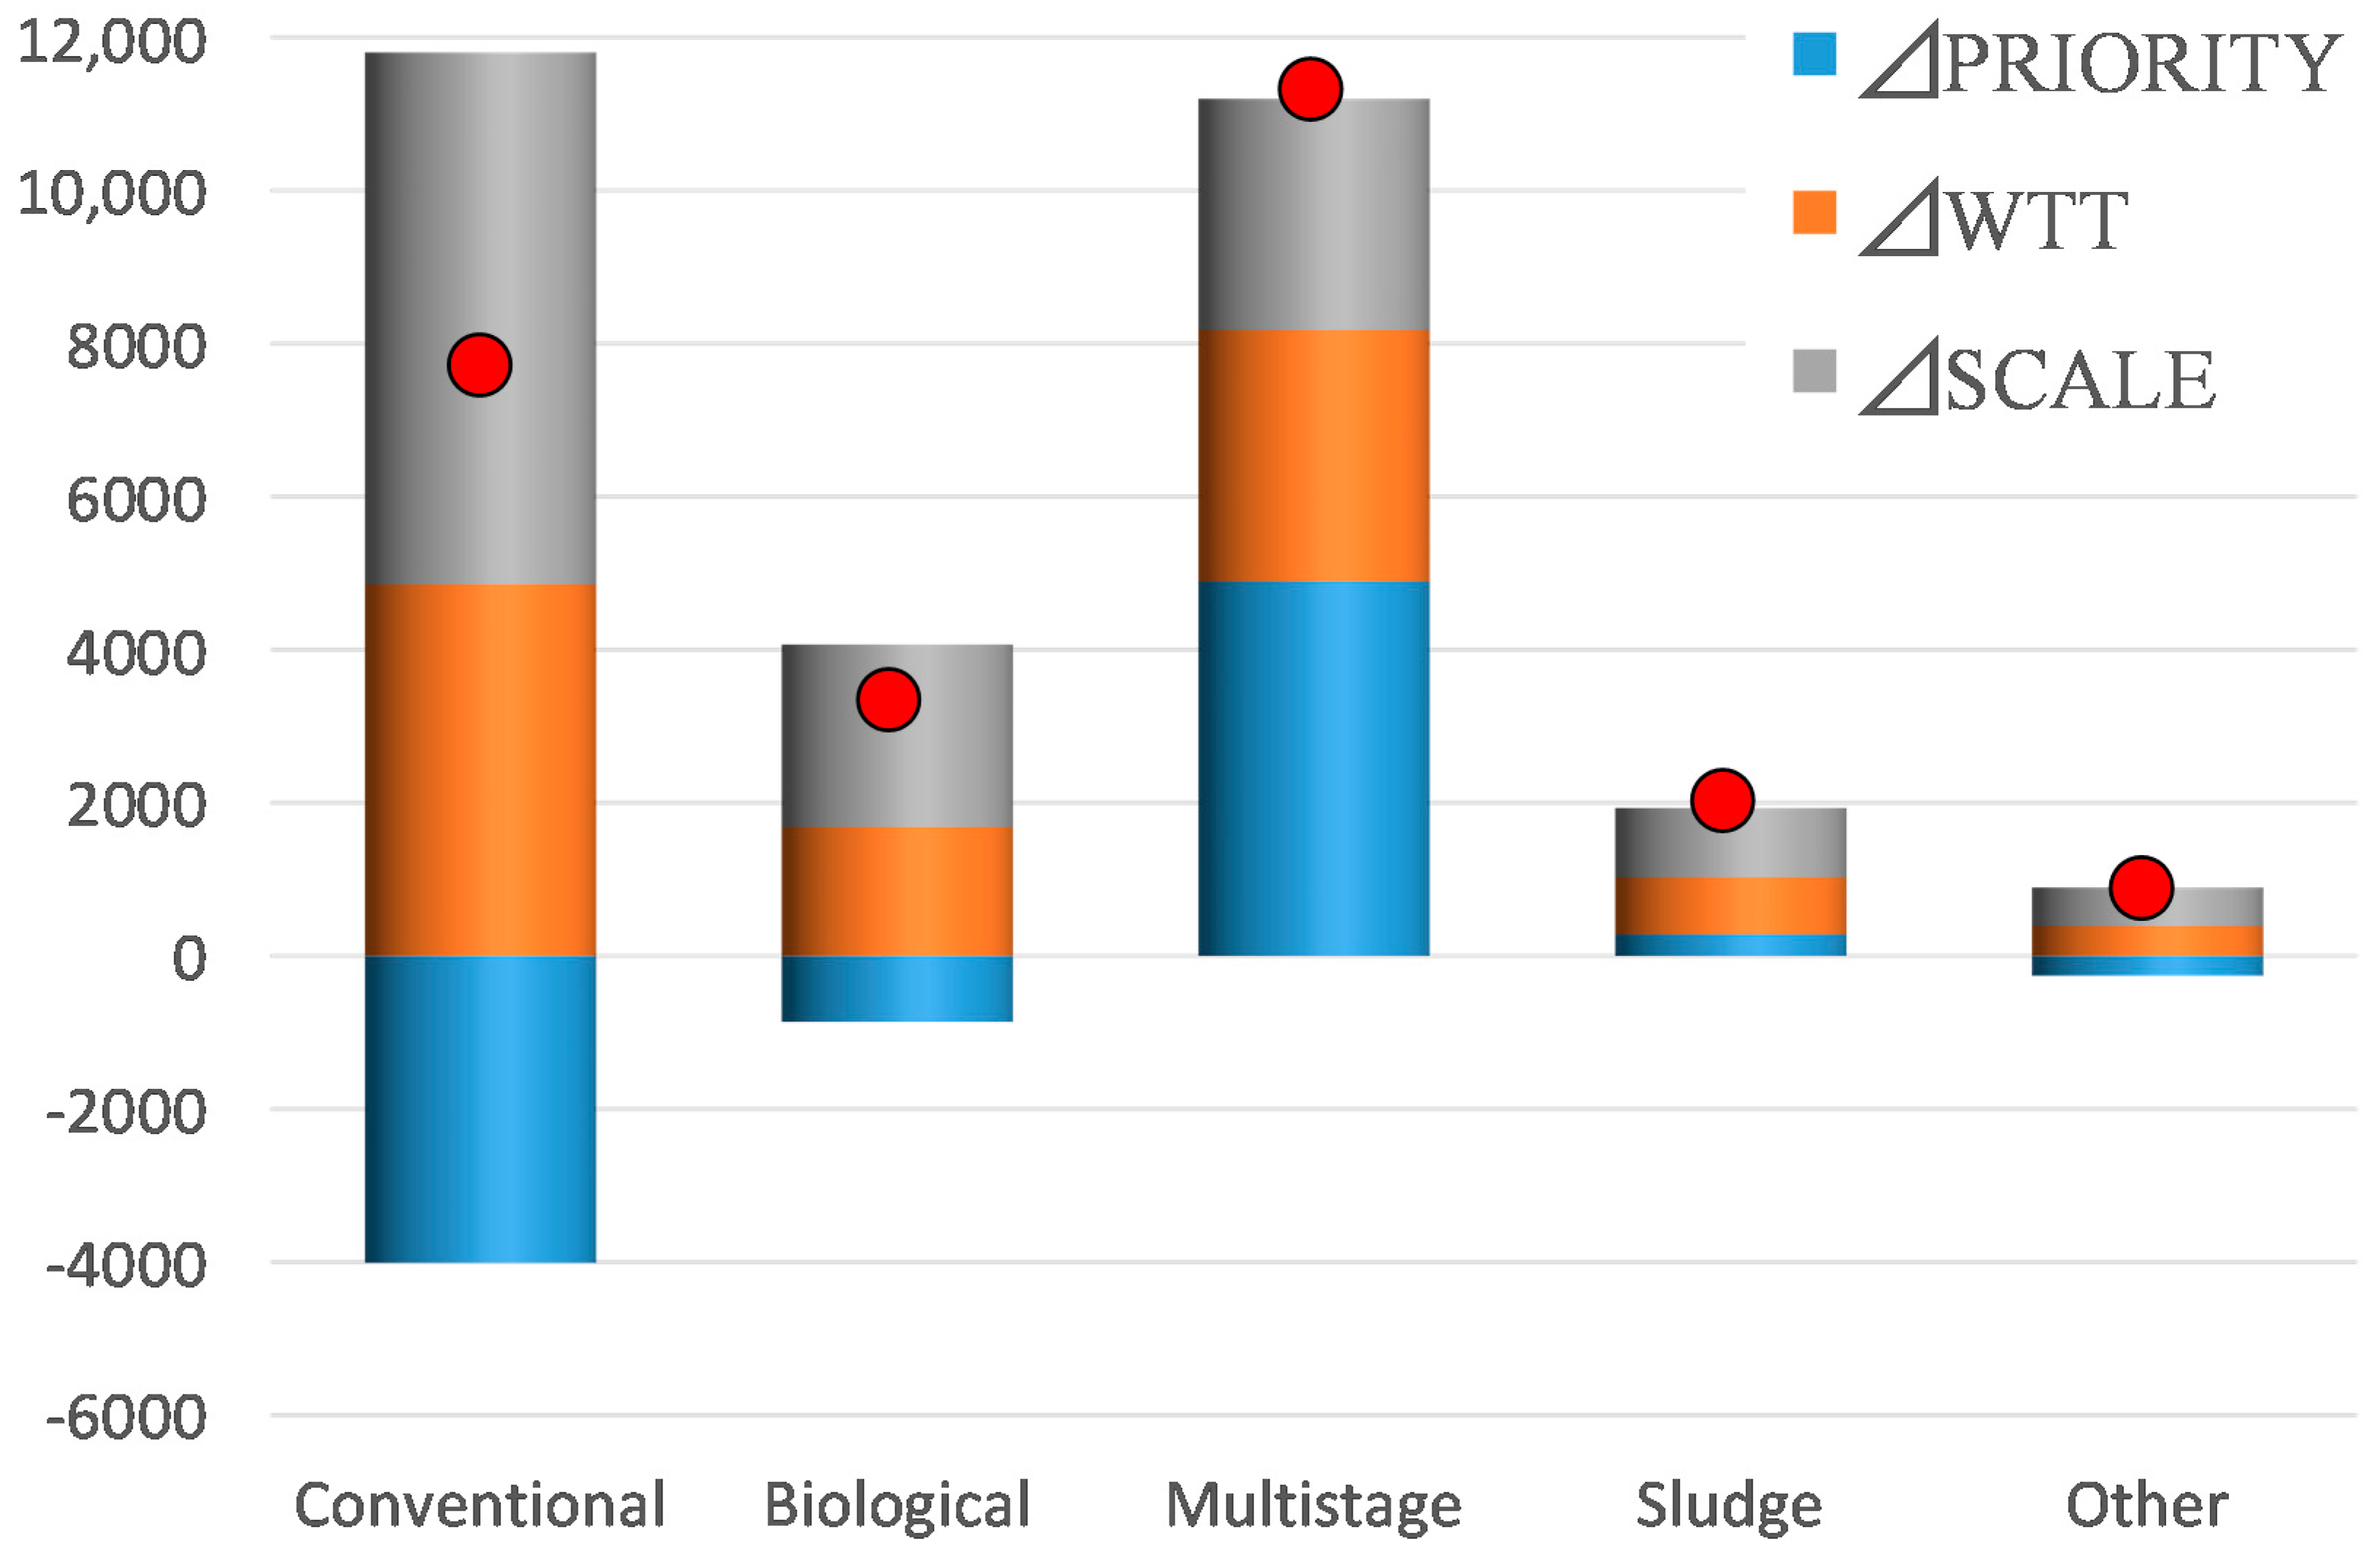
3.3. Results of the Patent Decomposition Analysis

Figure 2 shows the results of a patent decomposition analysis for the five water treatment technologies at all of the patent offices listed in Table S2. The plotted point in red indicates the change in the number of specific patents granted, and the bar chart shows the effects of each decomposed factor on the number of patents granted for specific water treatment technologies. The sum of the bars is equivalent to the value of the plotted point. The figure shows the differences in the driving factors for the patents granted based on the water treatment technology type.
Figure 2 shows that the number of patents granted for multistage and conventional water treatment technologies increased from 1993 to 2016. However, the specific water treatment technology priority differently affects these two technology types. As shown in Figure 2, the relative priority of the conventional water treatment technology was negative, whereas that of the multistage water treatment technology was positive. This result implies that the water treatment technology patent invention priority shifted from conventional water treatment to multistage water treatment. The relative priority of the other three technology types did not significantly change during this research period. The results suggest that the patents granted for those three technologies showed a similar trend to that of the total water treatment technology patents granted.
Table 3 shows the patent decomposition analysis results for each patent office. The table shows that the main contributor to the increase in patents granted is China. The scale change in the R&D activity at the SIPO contributes to all five of the water treatment technology types. One interpretation of this result is that the Chinese patent application law revisions in 2001 and 2009 simplified patent applications for domestic companies that use a subsidy program [27]. Hu et al. [28] noted a rapid patent application increase at the SIPO that was caused by external factors, such as the patent law revision and a new subsidy system. Thus, the Chinese patent application system revision contributed to expanded R&D activities (e.g., patent applications) at the SIPO, which increased the number of patents for water treatment technology.

4. Conclusions

This study examined the trend and priority changes in water treatment technologies using patents granted data from 1993 to 2016. We focused on the following five technologies: (1) conventional water treatment technology, (2) biological water treatment technology, (3) multistage water treatment technology, (4) sludge treatment technology, and (5) other water treatment technologies. We clarified the priority shifts that were reflected in the patents covering innovations in these five technologies by applying the decomposition analysis. We obtained the following results.
First, the number of water treatment technology patents granted increased from 1993 to 2016. In particular, rapid growth was observed in multistage water treatment technology. The main driver of this growth was the expansion in the R&D activity scale and an increase in the priority of multistage water treatment technology in China. The patent application law revision and subsidy system in China are noted as external factors that promoted R&D activity among Chinese innovators.
Second, the priority placed on multistage water treatment technology innovations decreased in Japan from 1993 to 2016. This result indicated that the R&D strategy for water treatment technology in Japan clearly differs from that in other countries and patent offices. This information indicates that the Japanese government should recognize the necessity of promoting aquaculture technology development in Japan.
Finally, we observed that the priority changes in water treatment technology innovations were diverse across countries and technology groups. The differences in water treatment technology characteristics are useful for clarifying technological advantages and high priority technology types in each country.

Supplementary Materials

The following materials are available online at www.mdpi.com/2073-4441/9/11/860/s1: Table S1. International patent clarification (IPC) related to water treatment technologies. Table S2. Patent data collection periods in the PATENTSCOPE database by country.

Acknowledgments

This research was funded by the Grant-in-Aid for Specially Promoted Research [26000001B] and Grant-in-Aid for Young Scientists (B) [17K12858] from the Ministry of Education, Culture, Sports, Science and Technology (MEXT), Japan. The results and conclusions of this article do not necessarily represent the views of the funding agencies.

Author Contributions

Hidemichi Fujii contributed to the construction of the dataset, the development of the methodology, and the drafting of the article. Shunsuke Managi assisted with the literature revision and conclusions.

Conflicts of Interest

The authors declare no conflicts of interest.

References

  1. Howe, K.J.; Hand, D.W.; Crittenden, J.C.; Trussell, R.R.; Tchobanoglous, G. Principles of Water Treatment; John Wiley & Sons: Hoboken, NJ, USA, 2012; p. 672. [Google Scholar]
  2. United Nations World Water Assessment Programme (WWAP). The United Nations World Water Development Report 2017, Wastewater: The Untapped Resource; United Nations World Water Assessment Programme: Paris, France, 2017; p. 198. [Google Scholar]
  3. Shannon, M.A.; Bohn, P.W.; Elimelech, M.; Georgiadis, J.G.; Mariñas, B.J.; Mayes, A.M. Science and technology for water purification in the coming decades. Nature 2008, 452, 301–310. [Google Scholar] [CrossRef] [PubMed]
  4. World Health Organization (WHO); United Nations Children’s Fund (UNICEF). Progress on Drinking Water, Sanitation and Hygiene: 2017 Update and SDG Baselines; WHO and UNICEF: Geneva, Switzerland, 2017; p. 110. [Google Scholar]
  5. United Nations Water (UN-Water). Towards a Worldwide Assessment of Freshwater Quality; A UN-Water Analytical Brief; UN-Water: Geneva, Switzerland, 2016. [Google Scholar]
  6. United Nations. Transforming Our World: The 2030 Agenda for Sustainable Development. Outcome Document for the United Nations Summit to Adopt the Post-2015 Development Agenda. Available online: https://sustainabledevelopment.un.org/post2015/transformingourworld (accessed on 25 September 2015).
  7. Stanway, D. In China’s Murky Waters, Global Sewage Firms Seek Rewards; Reuters: London, UK, 2017; Available online: https://www.reuters.com/article/us-China-sewage/in-Chinas-murky-waters-global-sewage-firms-seek-rewards-idUSKBN19U00Z (accessed on 17 October 2017).
  8. United Nations Water (UN-Water). Regional Coordination Mechanisms for Water: A Report of the UN-Water Task Force on Regional-Level Coordination; UN-Water: Geneva, Switzerland, 2014. [Google Scholar]
  9. World Intellectual Property Organization (WIPO). IPC Green Inventory. Available online: http://www.wipo.int/classifications/ipc/en/est/ (accessed on 18 August 2017).
  10. Rodriguez-Narvaez, O.M.; Peralta-Hernandez, J.M.; Goonetilleke, A.; Bandala, E.R. Treatment technologies for emerging contaminants in water: A review. Chem. Eng. J. 2017, 323, 361–380. [Google Scholar] [CrossRef]
  11. Subramani, A.; Jacangelo, J.G. Emerging desalination technologies for water treatment: A critical review. Water Res. 2015, 75, 164–187. [Google Scholar] [CrossRef] [PubMed]
  12. Palma, P.; Fialho, S.; Alvarenga, P.; Santos, C.; Brás, T.; Palma, G.; Cavaco, C.; Gomes, R.; Neves, L.A. Membranes technology used in water treatment: Chemical, microbiological and ecotoxicological analysis. Sci. Total Environ. 2016, 568, 998–1009. [Google Scholar] [CrossRef] [PubMed]
  13. Alzahrani, S.; Mohammad, A.W. Challenges and trends in membrane technology implementation for produced water treatment: A review. J. Water Process Eng. 2014, 4, 107–133. [Google Scholar] [CrossRef]
  14. Temesgen, T.; Bui, T.T.; Han, M.; Kim, T.I.; Park, H. Micro and nanobubble technologies as a new horizon for water-treatment techniques: A review. Adv. Colloid Interface Sci. 2017, 246, 40–51. [Google Scholar] [CrossRef] [PubMed]
  15. Fujii, H.; Managi, S. Wastewater management efficiency and determinant factors in the Chinese industrial sector from 2004 to 2014. Water 2017, 9, 586. [Google Scholar] [CrossRef]
  16. Hara, K.; Kuroda, M.; Yabar, H.; Kimura, M.; Uwasu, M. Historical development of wastewater and sewage sludge treatment technologies in Japan—An analysis of patent data from the past 50 years. Environ. Dev. 2016, 19, 59–69. [Google Scholar] [CrossRef]
  17. Fujii, H.; Managi, S. Research and development strategy for environmental technology in Japan: A comparative study of the private and public sectors. Technol. Forecast. Soc. Chang. 2016, 112, 293–302. [Google Scholar] [CrossRef]
  18. Candelin-Palmqvist, H.; Sandberg, B.; Mylly, U.M. Intellectual property rights in innovation management research: A review. Technovation 2012, 32, 502–512. [Google Scholar] [CrossRef]
  19. Popp, D. Inducing innovation and energy prices. Am. Econ. Rev. 2002, 92, 160–180. [Google Scholar] [CrossRef]
  20. Fujii, H. Decomposition analysis of green chemical technology inventions from 1971 to 2010 in Japan. J. Clean. Prod. 2016, 112, 4835–4843. [Google Scholar] [CrossRef]
  21. Haščič, I.; Migotto, M. Measuring Environmental Innovation Using Patent Data; OECD Environment Working Papers, No. 89; OECD Publishing: Paris, France, 2015. [Google Scholar]
  22. Smith, C.E. Design with the Other 90%: Cities; Cooper-Hewitt, National Design Museum, Smithsonian Institute: Washington, DC, USA, 2011. [Google Scholar]
  23. Japan Patent Office. Comparative Study on Examination Practices among JPO, KIPO and SIPO. 2017. Available online: https://www.jpo.go.jp/torikumi_e/kokusai_e/comparative_study.htm (accessed on 17 October 2017).
  24. Ang, B.W.; Liu, N. Handling zero values in the logarithmic mean Divisia index decomposition approach. Energy Policy 2007, 35, 238–246. [Google Scholar] [CrossRef]
  25. Han, D.; Currell, M.J.; Cao, G. Deep challenges for China’s war on water pollution. Environ. Pollut. 2016, 218, 1222–1233. [Google Scholar] [CrossRef] [PubMed]
  26. China Water Risk. New ‘Water Ten Plan’ to Safeguard China’s Waters. Available online: http://Chinawaterrisk.org/notices/new-water-ten-plan-to-safeguard-Chinas-waters/ (accessed on 18 August 2017).
  27. Dang, J.; Motohashi, K. Patent statistics: A good indicator for innovation in China? Patent subsidy program impacts on patent quality. China Econ. Rev. 2015, 35, 137–155. [Google Scholar] [CrossRef]
  28. Hu, A.G.Z.; Zhang, P.; Zhao, L. China as number one? Evidence from China’s most recent patenting surge. J. Dev. Econ. 2017, 124, 107–119. [Google Scholar] [CrossRef]
Figure 1. Trends in water treatment technology patents granted from 1993 to 2016 (number of patents). Source: Authors’ estimate using the IPC code in Table S1 and the PATENTSCOPE database; Note: SIPO: State Intellectual Property Office of The People’s Republic of China; JPO: Japan Patent Office; KIPO: Korean Intellectual Property Office; USPTO: United States Patent and Trademark Office; PCT: Patent Cooperation Treaty; EPO: European Patent Office. (a) Water treatment patents granted by country; (b) Water treatment patents granted by technology.
Water 09 00860 g001
Figure 2. Results of the patent decomposition analysis (number of patents). Note: The vertical axis is standardized by setting the number of changes in the patents granted in 1993 to zero. The sum of the bars is equivalent to the value of the plotted point.
Water 09 00860 g002
Table 1. Description of water treatment technology patents.
Technology CodeTechnology Group (IPC Code)Description of Technology Group
ConventionalConventional treatment (IPC=C02F1)Conventional water treatment technology includes heating (C02F1/02), degassing (C02F1/20), freezing (C02F1/22), flotation (C02F1/24), ion-exchange (C02F1/42), and oxidation (C02F1/72).
BiologicalBiological treatment (IPC=C02F3)Biological water treatment technology includes aerobic processes (C02F3/02), activated sludge processes (C02F3/12), and anaerobic digestion processes (C02F3/28).
MultistageMultistage treatment (IPC=C02F9)Multistage water treatment technology covers combined treating operations. This technology group includes electrochemical treatment (C02F9/06), thermal treatment (C02F9/10), and irradiation or treatment with electric or magnetic fields (C02F9/12).
SludgeSludge treatment (IPC=C02F11)This technology group includes sludge treatment by pyrolysis (C02F11/10), de-watering (C02F11/12), and thermal conditioning (C02F11/18).
OtherOther water treatment technology (IPC=C02F5, C02F7, C02F101, C02F103)Other water treatment technology includes softening water (C02F5), aeration of stretches (C02F7), nature of the contaminant (C02F101), and nature of the wastewater (C02F103).
Source: Author revised the definitions introduced by the World Intellectual Property Organization (WIPO) [9]; Note: The detail technology grouping is described in Table S1.
Table 2. Data description of the water treatment technology patents granted (number of patents).
Patent OfficeTechnology Type1993–2016Share1993–19981999–20042005–20102011–2016
SIPOConventional39,11636.6%9523699873025,735
Biological15,74414.7%157865334911,373
Multistage41,05538.4%34641474335,637
Sludge69506.5%252029695754
Other40843.8%702847572973
JPOConventional23,46167.3%6607695554944405
Biological780922.4%2634251416191042
Multistage1440.4%44172756
Sludge27257.8%3966491138542
Other7062.0%158236178134
KIPOConventional13,26360.0%1280415337134117
Biological468321.2%402179314511037
Multistage9744.4%81410236247
Sludge268912.2%245822779843
Other4852.2%43149101192
USPTOConventional987068.2%1630230825093423
Biological301320.8%506752973782
Multistage7275.0%73119147388
Sludge3112.1%737055113
Other5573.8%195128113121
PCTConventional726569.3%593125421803238
Biological183317.5%240304558731
Multistage5004.8%106140344
Sludge5084.8%2951168260
Other3763.6%5971100146
EPOConventional462065.0%80397112441602
Biological143120.1%314361390366
Multistage3074.3%445375135
Sludge3855.4%8480112109
Other3655.1%1061237363
Other patent officeConventional20,37964.9%4862580445615152
Biological578718.4%1726165211621247
Multistage20256.4%303445566711
Sludge16695.3%518442355354
Other15494.9%420405320404
Source: Authors’ estimate using the IPC code in Table S1 and the PATENTSCOPE database; Note: SIPO: State Intellectual Property Office of The People’s Republic of China; JPO: Japan Patent Office; KIPO: Korean Intellectual Property Office; USPTO: United States Patent and Trademark Office; PCT: Patent Cooperation Treaty; EPO: European Patent Office.
Table 3. Results of the patent decomposition analysis for water treatment technology from 1993 to 2016.
Specific TechnologyDECOMPOSED FactorSIPOJPOKIPOUSPTOPCTEPO
Conventional⊿Patent6816−38646041450599
⊿PRIORITY−1800948281319
⊿WTT223615−25−6929−99
⊿SCALE6380−410437456463179
Biological⊿Patent3260−22413263867
⊿PRIORITY−182−159−44−52−40−18
⊿WTT9752343−4215−22
⊿SCALE2467−8813315711147
Multistage⊿Patent10,905−337845821
⊿PRIORITY19781−4553417
⊿WTT2908117153−6
⊿SCALE6019−523142110
Sludge⊿Patent1779349313492
⊿PRIORITY289133−110148
⊿WTT456−2728−04−11
⊿SCALE1034−737513305
Other⊿Patent649−223−710−13
⊿PRIORITY−262156−19−18−14
⊿WTT250−87−13−0−10
⊿SCALE661−1011252812
Note 1: SIPO: State Intellectual Property Office of the People’s Republic of China; JPO: Japan Patent Office; KIPO: Korean Intellectual Property Office; USPTO: United States Patent and Trademark Office; PCT: Patent Cooperation Treaty; EPO: European Patent Office; Note 2: ⊿Patent = ⊿Priority + ⊿WTT + ⊿Scale.

