Abstract
This study demonstrates the spatial and temporal variations of streambed vertical hydraulic conductivity Kv from October 2011 to November 2014 along the Weihe River, the largest tributary of the Yellow River. The streambed Kv values of a total number of 385 locations from five test sites were estimated on the basis of in situ falling-head standpipe permeameter tests. The difference of Kv values for all test locations reaches five orders of magnitude with a range from 5.87E-04 to 61.3 m/d and a median value of 1.62E-01 m/d. The streambed Kv values are neither normally nor log-normally distributed, but display significant spatial variability among the five test sites. The highest Kv values occur at the site with mainly sandy sediment, while the Kv values at the other four sites with mainly silt-clay sediment are relatively close and have less variability than those at the sandy sediment site. The median Kv values from all of the sites exhibit no statistically significant temporal trends. However, the median Kv values indeed show temporal variations that might be influenced by changes in silt-clay content of the sediment, especially for the sandy sediment site and the combined data from all sites. Weak evidence demonstrates that streambed Kv values decrease with depth.
1. Introduction
The streambed vertical hydraulic conductivity (Kv) is a pivotal attribute directly influencing the strength of hydraulic exchange, nutrient delivery, and contaminant transfer between groundwater and surface water [1,2,3]. In recent decades, in situ standpipe permeameter tests have been widely applied to estimate statistical distributions and variations of streambed Kv [4,5,6,7]. These studies revealed different statistical distributions of streambed Kv values, such as bimodal distribution [8] and normal distribution [7,9] of Kv, normal distribution of ln(Kv) [10], and non-normal distribution of both Kv and ln(Kv) [5,6].
Heterogeneity of streambed Kv values is a universal phenomenon in both spatial and temporal scales [4,5,6,7,8,11,12]. The Kv values could vary over several orders of magnitude not only between different streambeds [1], but also on a scale of meters in the same streambed [3,5,6,13]. It has been shown that the streambed Kv can vary significantly (i) before or after floods [8,14,15]; and (ii) with depth of sediments [10,16,17,18,19]. For example, vertical hydraulic conductivity decreased with the depth of two connected layers of sediments [18], and the largest Kv generally appeared in the center of the stream channel [5].
Streambed Kv can be additionally affected by other factors, such as stream morphologies [4,11,20], the erosion and deposition process of sediments [5,12,21], transport of fine materials [22], as well as the sedimentary structure, and grain-size distribution of streambed sediments [17]. Generally, higher Kv values occurred on the erosional outer bend and near the middle of the channel compared to the depositional bank [11]. Evolution of hydraulic conductivity over one year in the floodplain of a meandering river mainly resulted from hyporheic transport of fine materials [22]. Moreover, streambed Kv values were often larger in the parts of the channels with deeper water [4,6,7].
Measurements of streambed hydraulic conductivity have been carried out in the Weihe River of China [9,20,23]. The anisotropy of hydraulic conductivity along multi-directions in well-sorted fluvial sediment of the Weihe River was investigated, which showed that hydraulic conductivity distribution of exposed sediments is strongly correlated to bedding orientation [23]. The heterogeneity of the horizontal hydraulic conductivity (Kh) among five layers with depth of a high floodplain profile of the Weihe River was demonstrated [9]. Spatial variability of Kv values also occurred under distinctive stream morphologies in the Beiluo River, one of the largest tributaries of the Weihe River [20]. However, these previous studies focused on the anisotropy and heterogeneity of streambed hydraulic conductivity over a relatively small scale, and large-scale and long-term serial survey of streambed vertical hydraulic conductivity in the Weihe River was not conducted. In particular, it is unclear if and how hydraulic conductivity in the Weihe River evolves with time. To address these possibilities, this study illustrates the statistical distribution of streambed Kv and its variations in spatial and temporal scales along the Weihe River in Shaanxi Province and further analyzes the effects of grain-size distribution or water depth on streambed Kv values.
2. Study Area
The Weihe River, originating from Niaoshu Mountain at Weiyuan County of Gansu, flows approximately across 818 km through Gansu, Ningxia, and Shaanxi provinces, and merges with the Yellow River at Tongguan County of Shaanxi province (Figure 1). As one of the largest tributaries of the Yellow River, the Weihe River covers a drainage area of 1.34 × 10⁵ km2. The channel width in the lower reaches of the Weihe River is about 300–600 m [24]. The Weihe River basin belongs to warm temperate, semi-humid continental monsoon climate. The annual mean temperature is 7.8–13.5 °C, which decreases from the main stem of the Weihe River toward the north and south tributaries, annual mean rainfall is 400–800 mm with a decreasing trend from the south to the north, and the mean runoff is 195 m3/s [25]. The annual mean precipitation in the catchment is 570 mm, and about 60% amount of precipitation concentrates from May to September [26]. The Weihe River basin is topographically higher in the west but lower in the east. Several larger northern tributaries drain through the Loess Plateau, known as one of the largest and thickest loess deposits in the world; as a consequence, the sediments from northern tributaries flowing into the Weihe River comprise predominantly loess and fine particles. The annual erosion rate in the Loess Plateau is up to 5997 ton/km2 [27]. A study from a site in the upstream area of the Weihe River demonstrated that the average grain size of loess varies from 6.8 to 11 μm [28]. The northern tributaries are generally long in channel length and shallow in stream gradients. The Jing River and Beiluo River, the largest tributaries of the Weihe River, account for about 54% of the total river discharge [9]. Numerous southern tributaries originate from the Qinling Mountain known as the natural boundary between the south and north of China, and drain directly into the Weihe River. These southern tributaries are characterized by short length, steep gradients, large flow velocity, and providing coarse materials into the Weihe River [9]. The sediments from southern tributaries are mainly sand and gravel or cobbles [9]. The median grain diameter (d50) for the channel sediments between Xianyang and Lingtong varies from 0.098 to 1.25 mm [29].
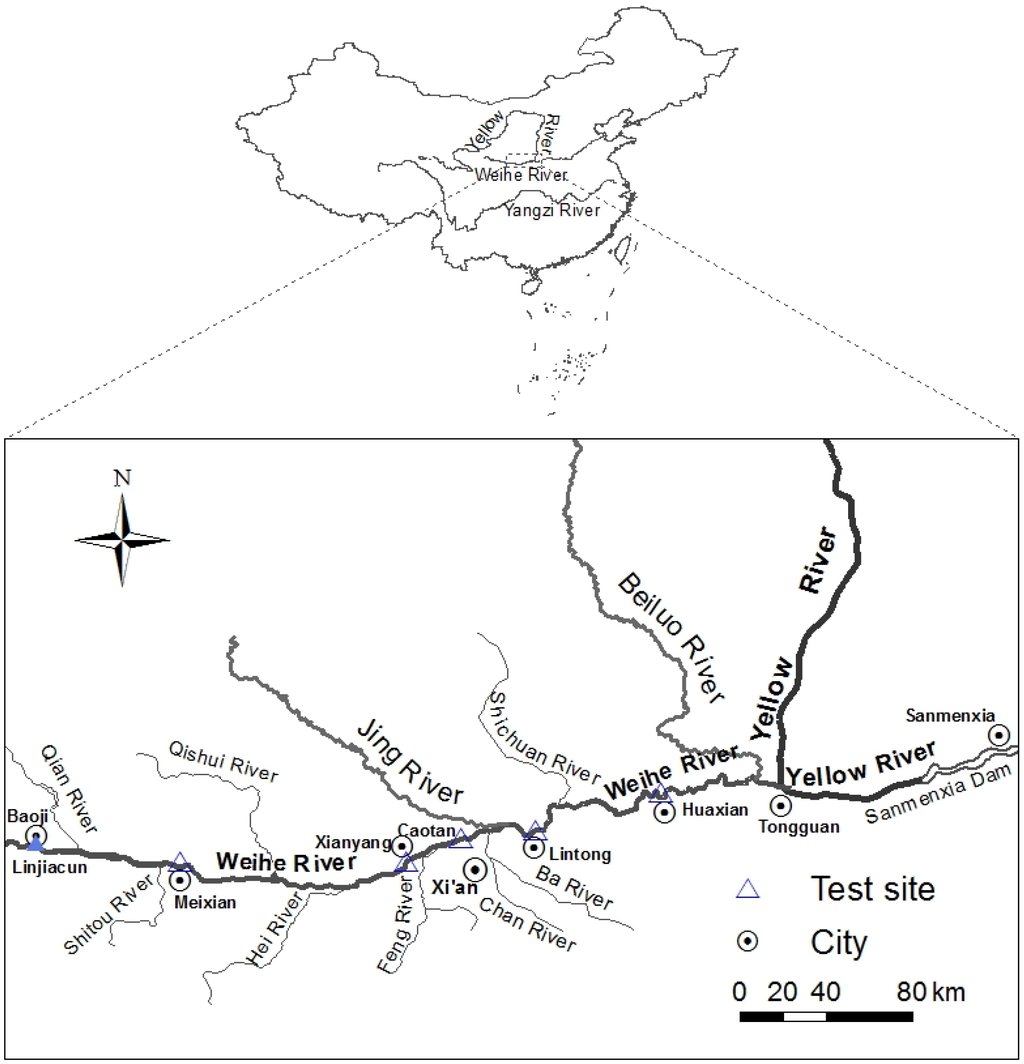
Figure 1.
Distribution of study sites along the Weihe River in Shaanxi Province, China.
The Weihe River basin is one of the most serious soil erosion areas in the Yellow River basin. The erosion area of the Weihe River basin is about 5.2 × 10⁴ km2 which accounts for 44.3% of the basin area [30]. Severe flood disaster often occurs in the lower Weihe River due to sediment siltation induced by Sanmenxia Reservoir operation [31,32,33]. The annual average sediment discharge from the Weihe River can reach up to 0.458 billion tons [30]. The average annual natural runoff in the Weihe River has decreased by 45% since the 1980s due to the complex impact of natural and human activities [34,35]. The annual runoff measured at the Huaxian gauging stations from 1991 to 2000 decreased by 50.3% compared with that from 1981 to 1990 [35]. The significant decrease of runoff has reduced the sediment scouring capacity of the river channel especially in the lower Weihe River [33]. What is worse is that the Weihe River discharges these sediments into the Yellow River, ultimately exacerbating water channel siltation and frequent floods in the Yellow River [31,33]. We believe that sediment siltation would have significant influence on the streambed hydraulic conductivity. Hence, determination of the streambed hydraulic conductivity in the Weihe River is crucial to estimate stream-aquifer interaction as well as being highly effective and beneficial for water resource management.
3. Methods
3.1. Measurement of Streambed Vertical Hydraulic Conductivity
The falling-head permeameter test was applied for streambed vertical hydraulic conductivity measurements by inserting transparent polyvinyl chloride (PVC) standpipes into streambed sediments. First, an open-ended pipe of 160 cm length and 5.4 cm interior diameter was staked vertically into the streambed sediments (Figure 2). The thickness of the pipe is very small (about 3 mm), and the test was controlled carefully to reduce disturbing original sedimentary structures and particle fabrication. When the pipe was pressed to a desired depth of about 30 cm, water was poured carefully from the open top of the pipe. Along with declining water level in the pipe, the hydraulic head was recorded at regular time intervals. After the permeameter testing at a depth of 0–30 cm was completed, the pipe was pressed to a deeper depth of around 50 cm. Again, a permeameter test at a depth of 0–50 cm was conducted. After the tests, the Kv value was calculated using the formula of Hvorslev [36]:
where h1 and h2 are hydraulic heads observed in the pipe corresponding to measurement times of t1 and t2, respectively, m is the square root of the ratio of the horizontal conductivity Kh to the vertical conductivity Kv (i.e., ), D is the interior diameter of the pipe (5.4 cm), Lv is the length of sediment column in the pipe. If the length of the sediment column (Lv) is five times larger than the diameter of the pipe (D) [13], then Equation (1) can be simplified to
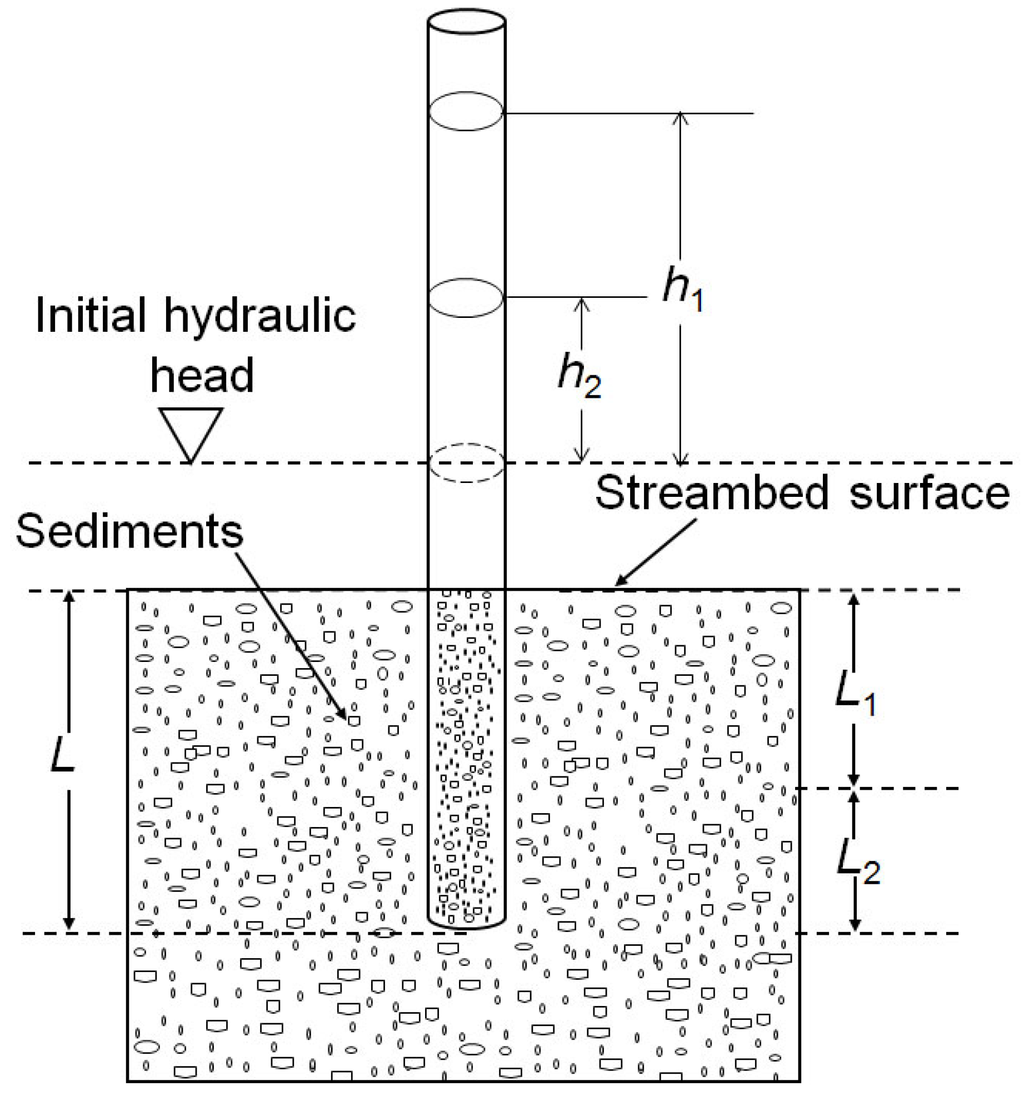
Figure 2.
Schematic diagram showing in-situ permeameter tests for measuring sediment hydraulic conductivity of the streambed in the Weihe River.
In this study, the average length of the measured sediment column (Lv) in the PVC pipes ranges from 30 cm to 50 cm; accordingly, the ratio of Lv/D is commonly greater than five, thus reducing measurement errors.
On the basis of estimated results of Kv values from sediment with depth of 0–30 cm and 0–50 cm, the Kv values of the lower sediment layer with depth of 30–50 cm can be calculated using the following equation [37]:
where , and represent vertical hydraulic conductivities for sediment column (0–30 cm) and (30–50 cm), (0–50 cm) (Figure 2).
Streambed Kv values were determined at five sites (Meixian, Xianyang, Caotan, Lintong, Huaxian) along the Weihe River (Figure 1). As it was not possible to reach the center of the river due to deeper water, 9–14 test locations at each site were carried out around 1.5–2 m from the river bank. The distance between the two closest locations was about 1.5 m before December 2013. Due to the relatively low variation in Kv values from repeated tests at five sites before December 2013, fewer repeated tests were conducted in 2014. A total number of 385 measurements was conducted at five test sites along the Weihe River from October 2011 to December 2014.
Among the five sites, at Meixian (four tests), Xianyang (one test), Caotan (two tests), Lintong (one test), permeameter tests were repeatedly conducted in October 2011 and November 2012 to calculate Kv values for the upper and lower layers of sediment. A total of 32 measurements were made to assess the variability of Kv with depth ranging from about 30–50 cm.
3.2. Sediment Sampling and Grain Size Analysis
At each test location, after the permeameter test, the way of collecting the sediment sample was by plugging the top of the pipe, such that a suction was formed as the pipe was removed from the riverbed, thus holding the sediment in place [18]. This procedure can prevent sediments from exiting at the bottom end of the pipe. However, for coarser sediment, a small amount of sediment may have been lost, thus potentially creating bias. This phenomenon only occurred at a few locations at the Caotan site. Finally, the sediment was packed into a sampling bag for grain size analysis.
In the laboratory, the samples were categorized into 17 grades using a sieving method, and then the cumulative percentage weight was calculated. The finest grain size was 0.075 mm and the coarsest grain size was 12 mm. The grain was assigned into three groups by size: silt or clay less than 0.075 mm, sand ranging from 0.075 mm to 2 mm, and gravel larger than 2 mm [38].
3.3. Statistical Analyses
All statistical analyses were performed using the statistical software program R 3.2.1 [39]. The Kruskal-Walls test [40] is a nonparametric test that is valid even for non-normal populations. In this paper, the Kruskal-Walls test was used to determine if streambed Kv values differ significantly between two test sites, between two sampling times or between two different layers at a 95% confidence level [7,13]. The null hypothesis (H0) is that all Kv values from two samples are drawn from the same population, and the alternative hypothesis (H1) is that the Kv values from two samples are significantly different. When the attained significance level (p value) is less than a predetermined value (α = 0.05), the test rejects the null hypothesis and suggests that the difference between Kv values from two samples is significant. When p > 0.05, it accepts the null hypothesis that the two samples of Kv values are drawn from the same population [40]. Furthermore, Bonferroni correction [41] was performed to adjust confidence intervals following the Kruskal-Walls tests.
The Shapiro-Wilk and Lilliefors (Kolmogorov-Smirnov) tests [42] were applied to verify whether the streambed Kv values of five individual test sites (October 2011–November 2014) and the combined Kv values for all sites (October 2011, November 2012, March 2013, June 2013, December 2013, June 2014, November 2014, respectively) were normally or log-normally distributed at a 95% confidence level [7,9]. Q-Q plots were also used to compare the probability distribution of Kv values to a normal model by plotting their quantiles [9]. If the Kv values are close to the normal distribution, the points on the Q-Q plot lie approximately on a straight line.
The non-parametric Cox-Stuart test [43] was applied to detect the trend of median Kv values with time at the 95% confidence level. The test null hypothesis is of no trend against the alternative hypothesis, indicating insignificantly increasing or decreasing trend of streambed Kv values with time.
Spearman Correlation is a non-parametric test [40], which was adopted to measure the strength of the relationship between Kv values and water depth [6,20], or between changes of streambed Kv values and changes of sediment silt-clay content at the p = 0.05 level.
4. Results
4.1. Spatial Variation of Streambed Kv
Table 1 summarizes the range of the Kv values, streamflow, and water depth at each site. The streambed Kv values at all five sites from October 2011 to November 2014 vary over a range of five orders of magnitude from 5.87E-04 to 61.3 m/d with a median value of 1.62E-01 m/d over all measurement locations (Figure 3 and Table 1). The arithmetic mean Kv value of all 385 tests is 2.06 m/d. The median and arithmetic mean values are thus not close to each other. Streambed Kv values from individual site from October 2011 to November 2014 or from combined data for all sites at seven different times, are neither normally, nor log-normally distributed (see Section 4.2 and Table 2), thus it is increasingly appropriate to use the median Kv value to represent the streambed Kv characteristics at all sites in the Weihe River.

Table 1.
River hydrologic conditions in the study area, and statistics of Kv values from tests.
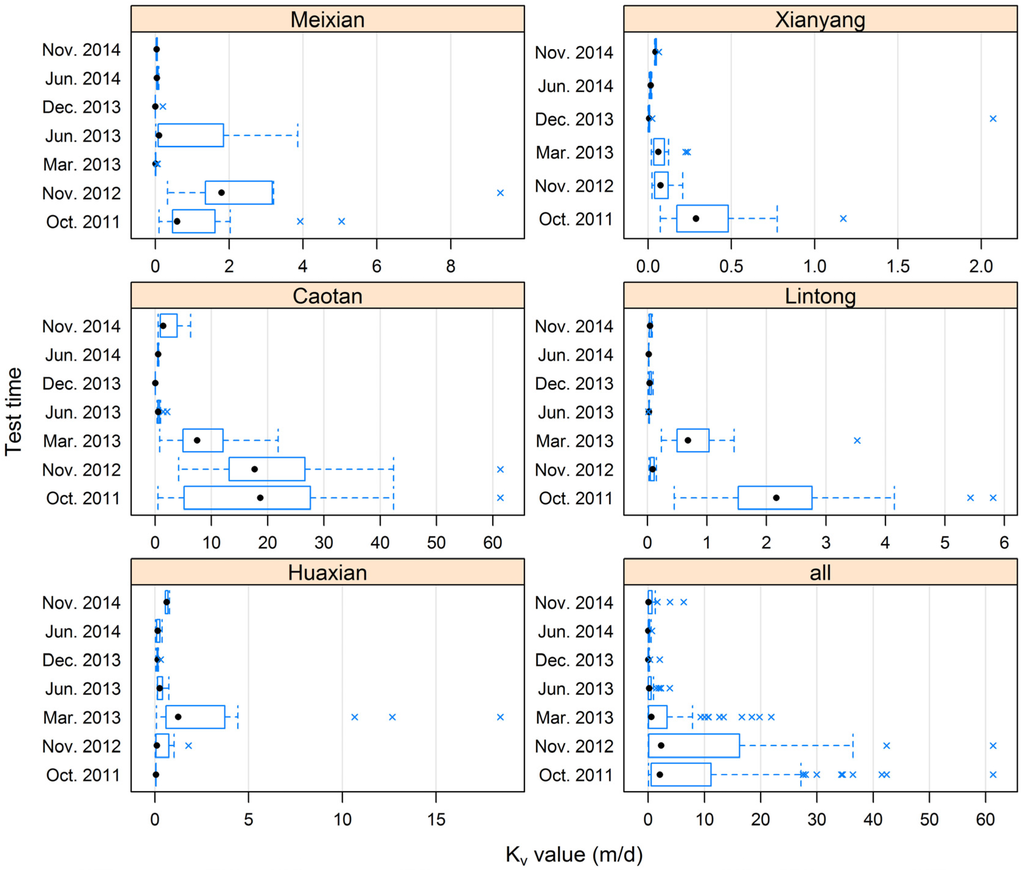
Figure 3.
Variations in vertical hydraulic conductivity with time at five individual sites (Box indicates upper and lower quartile, the dot indicates the median, and the multiple is an outlier).
Table 2.
Normality test of Kv values for individual site from October 2011 to November 2014 and that of combined Kv data for all five sites during different test times.
It is striking that streambed Kv values vary spatially to a different extent throughout the investigation period (Figure 3 and Table 1). Highest streambed Kv values occur at Caotan, varying from 3.52E-02 to 61.3 m/d (median = 10.2 m/d). For the other sites, the Kv values range from 5.87E-04 to 9.34 m/d (median = 9.05E-02 m/d) at Meixian, from 1.07E-03 to 2.07 m/d (median = 5.75E-02 m/d) at Xianyang, from 1.18E-02 to 5.81 m/d (median = 9.54E-02 m/d) at Lintong, and from 2.14E-02 to 18.4 m/d (median = 3.14E-01 m/d) at Huaxian. The median values of streambed Kv are about two orders of magnitude larger at Caotan than those at the other four sites except in December 2013. Most notably, the Kv values at other four sites are relatively close and have less variability, which corresponds well to silt and clay streambed. Chen et al. [44] reported that the Kv values for sand and gravel in the Platte River located in southeast Nebraska are usually greater than 1 m/d, whereas the Kv values for silt and clay are lower than 1.00E-01 m/d. A similar trend also occurs in the Weihe River.
The results of the Bonferroni correction following the Kruskal-Walls tests indicate that the Kv values between Caotan and other four sites have belonged to the same population since December 2013. Those p-values with the Bonferroni correction are close to 1, indicating that the pairs of Kv values are not significantly different. This could occur as one possible result of small and similar Kv values for silt-clay locations. Alternatively, these less reliable results may be also attributable to small sample numbers between the sites or between the sampling times. In order to avoid this error, Chen [13] excluded the Kv values from silt-clay layers using the Kruskal-Wallis tests.
4.2. Statistical Distribution of Kv
The histograms of the combined ln(Kv ) values from either each site of all test times or all sites within each test time indicate that streambed Kv is not log-normally distributed (Figure 4). The results were confirmed at the 0.05 significance level by application of the Shapiro-Wilk and Lilliefors normality tests. At seven different sampling times, both Shapiro-Wilk and Lilliefors tests indicate that the combined Kv values for all five sites are not normally distributed at the 0.05 significance level (Table 2). However, the Shapiro-Wilk test shows a normal distribution of ln(Kv) only in June 2014, while the Lilliefors test suggests normal distributions of ln(Kv) occur in October 2011, March 2013, December 2013, June 2014, and non-normal distributions of ln(Kv) occur in November 2012, June 2013, and November 2014, respectively.
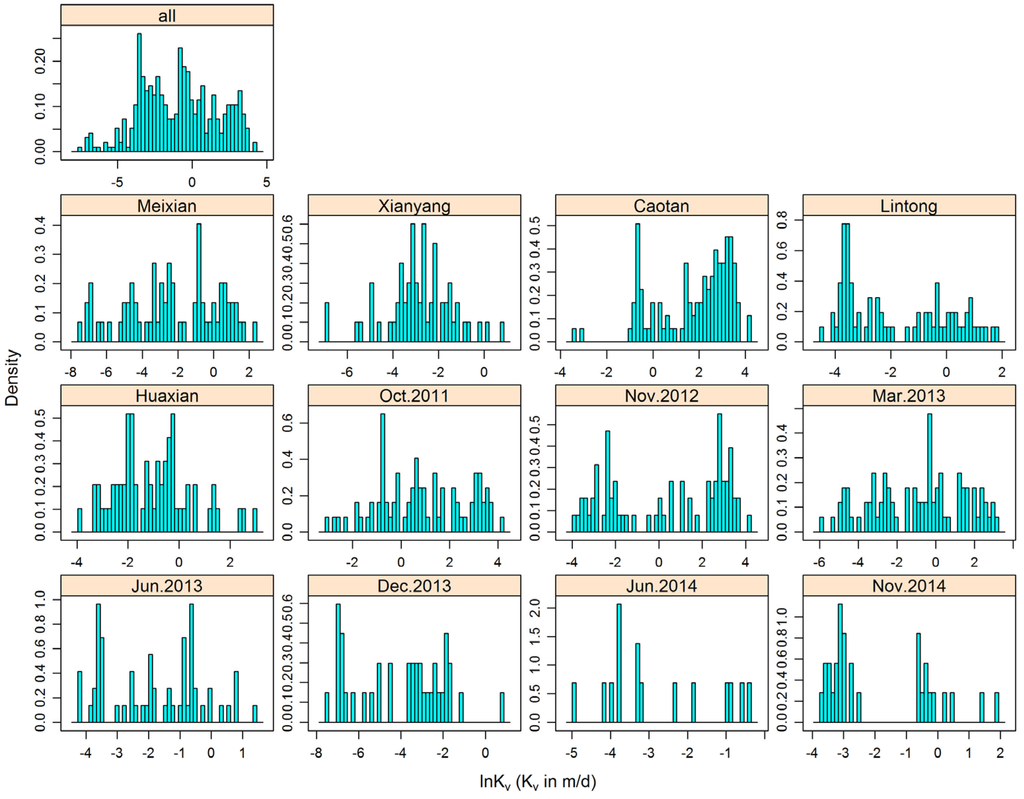
Figure 4.
Histograms of ln(Kv) value for individual sites from October 2011 to November 2014 and that of combined Kv data for all five sites during different test times.
At each site, both Shapiro-Wilk and Lilliefors tests indicate that streambed Kv values from October 2011 to November 2014 are not normally distributed, but both tests suggest a normal distribution of ln(Kv) occurring from October 2011 to November 2014 at Huaxian and Xianyang, and non-normal distribution of ln(Kv) occurring at Caotan, Lintong, and Meixian (Table 2). However, if streambed Kv values from all five sites from October 2011 to November 2014 are combined as a single dataset, it can be found that the 385 streambed Kv values are neither normally, nor log-normally distributed (Table 2), similar to streambed Kv values at the West Bear Creek, USA [5] and the Donghe River, China [6]. Q-Q plots further indicate that the combined Kv values are not close to the predicted lines and have non-normal distributions (Figure 5). However, these statistical test results may not be correct due to the fact that not enough tests were conducted after December 2013.
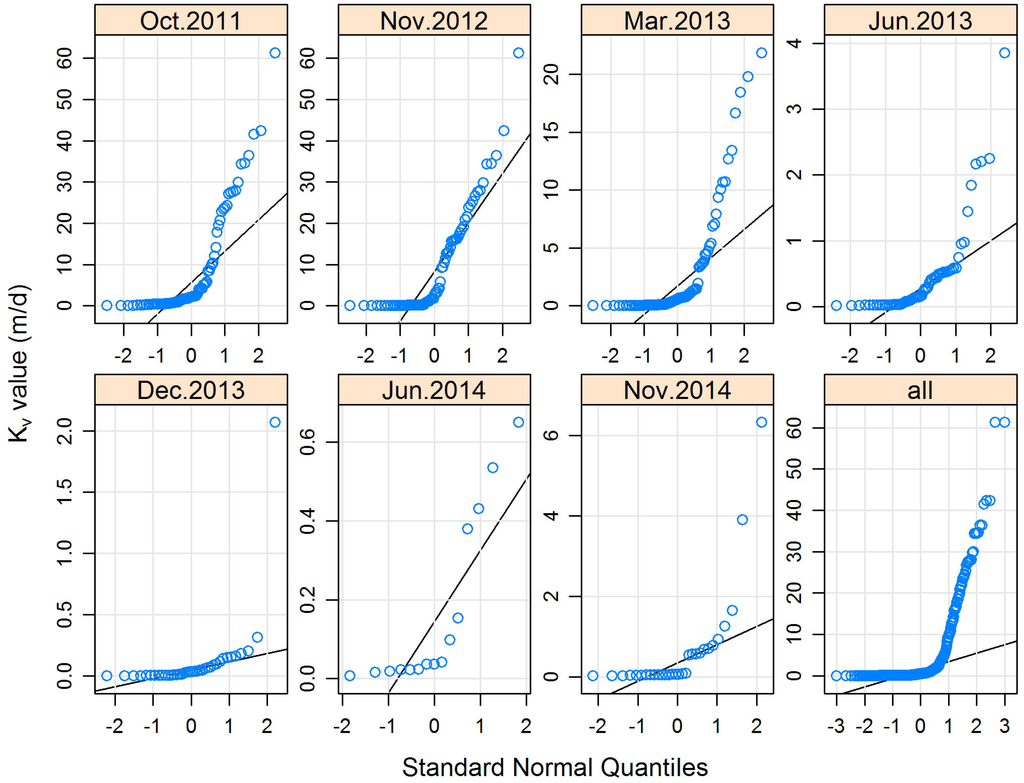
Figure 5.
Q-Q plots of combined Kv values for all study sites from October 2011 to November 2014.
4.3. Temporal Variation of Streambed Kv
The median Kv values for combined data from all five sites are 2.06 m/d, 2.30 m/d, 5.54E-01 m/d, 1.62E-01 m/d, 3.19E-02 m/d, 3.71E-02 m/d, and 5.84E-02 m/d successively from October 2011 to November 2014. The median Kv value at Caotan decreases from 18.7 m/d in October 2011 to 17.7 m/d in November 2012 and continues to decrease but more steeply to 7.47 m/d in March 2013. A second pronounced reduction occurs in June 2013 when the median Kv value at Caotan drops sharply to 5.36E-01 m/d, then continues to decline to 3.88E-02 m/d in December 2013 (Table 1). Although streambed Kv values at Caotan are not able to recover to their initial values and remain several orders of magnitude less, the median Kv value begins to increase to 5.35E-01 m/d, and still increases to 1.44 m/d in November 2014 (Table 1). Among the other four sites, there is a slight decrease of median Kv values with time at Lintong and Xianyang, whereas the median Kv values at Meixian and Huaxian firstly increase with respect to time, show a maximum of approximately 1.79 m/d in November 2012 and 1.24 m/d in March 2013, respectively, and then gradually decrease (Figure 3 and Table 1). The median Kv values for the four sites are mostly lower than 1 m/d, especially at Xianyang where they are almost lower than 2.00E-01 m/d (Table 1).
The Cox-Stuart test [43] was used to determine whether the observed temporal changes in median Kv values have statistically significant trends. The Cox-Stuart p-values for Meixian, Xianyang, Caotan, Lintong, and Huaxian were all greater than 0.05, indicating no evidence of significant trends with time. Since permeameter tests were repeatedly conducted, the Kruskal-Wallis test was further used to determine the differences of streambed Kv values for individual sites at different measurement times. The results of the Kruskal-Wallis tests with the Bonferroni correction indicate no significant differences in the Kv values at each site.
4.4. The Variation of Streambed Kv with Depth
Both in October 2011 and November 2012, with the exception of one location at Meixian, where Kv values are smaller in the upper sediment layer than that in the lower sediment layer, the Kv values in the upper sediment layer are consistently greater than those in the lower sediment layer at other test locations (Figure 6) This is consistent with previous studies [16,44]. The individual Kv values for the upper sediment layer from all test locations of the four sites range from 6.30E-01 to 24.3 m/d while those for the lower sediment layer range from 9.59E-02 to 23.4 m/d (Figure 6). The average and median values of streambed Kv in the upper layer are 5.11 m/d and 2.02 m/d while in the lower layer they are 4.39 m/d and 1.01 m/d, respectively. The ratios of the average value and median value of Kv in the upper sediment layer to those in the lower sediment layer from all test locations are 1.16 and 2.00, respectively. The statistical variation of 32 Kv values indicates a decreasing trend of streambed sediment Kv with the depth. Kv values between the two layers are comparatively analyzed using the Kruskal-Wallis test. The results show that the p-value for the two layers of Kv is 6.08E-02. The p value suggests that there is weak evidence that the two populations are different. Among the four sites, the average and median values of Kv for each layer of sediments at Caotan are the highest.
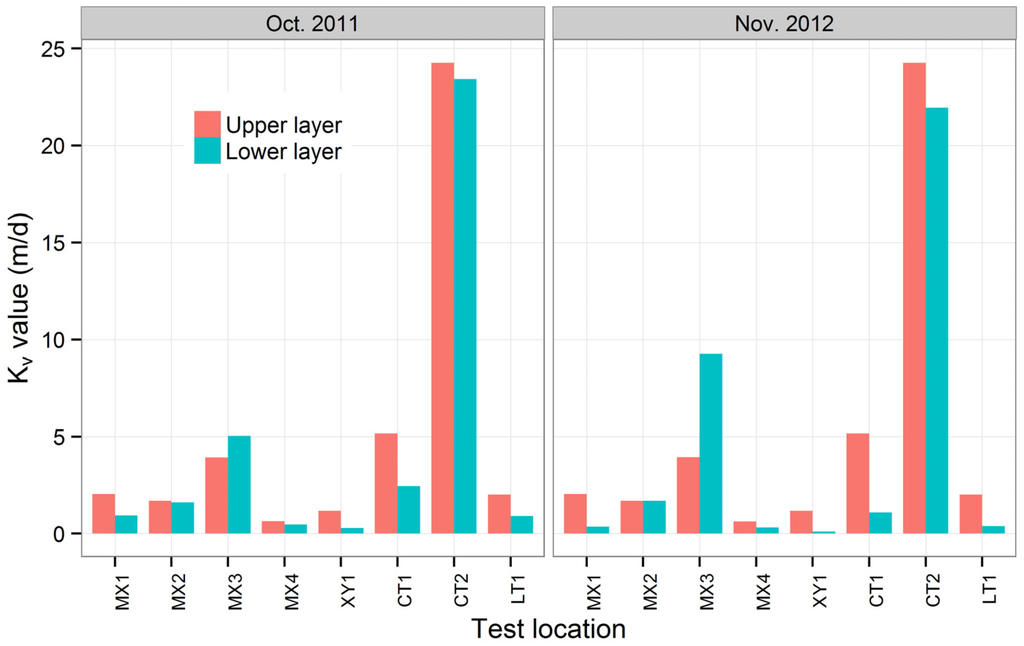
Figure 6.
Paired Kv values of streambed sediment in the upper layer and the lower layer for individual tests from 4 locations at Meixian (MX), one location at Xianyang (XY), two locations at Caotan (CT), and one location at Lintong (LT).
5. Discussion
5.1. Spatial Variation of Streambed Kv and Grain Size
Streambed hydraulic conductivity is mainly controlled by grain size [16,44]. The sediment at the Caotan site contains coarser materials while the other four sites mainly consist of silt-clay sediment. The large difference of Kv values at Caotan compared with the other four sites might result from coarser particles of its sediment. Grain size analysis results show that streambed sediment at Caotan consists of predominantly coarse sand and gravel with low content of silt-clay (from 5.44E-01 to 21.2% with an average of 6.13% and a median value of 2.74%), while sediments at the other four sites consist of predominantly silt-clay (Figure 7). The weight percentage of silt-clay to the whole particles accounts for 2.76%–50.5% (average value = 32.3%, median value = 35.0%) at Meixian, 23.5%–78.1% (average value = 46.9%, median value = 45.2%) at Xianyang, 16.1%–84.1% (average value = 56.3%, median value = 58.1%) at Lintong, and 9.30%–90.6% (average value = 44.2%, median value = 37.5%) at Huaxian. It further indicates that coarser materials in the streambed sediment were more common at Caotan than those at other four sites, especially before June 2013 (Figure 7).
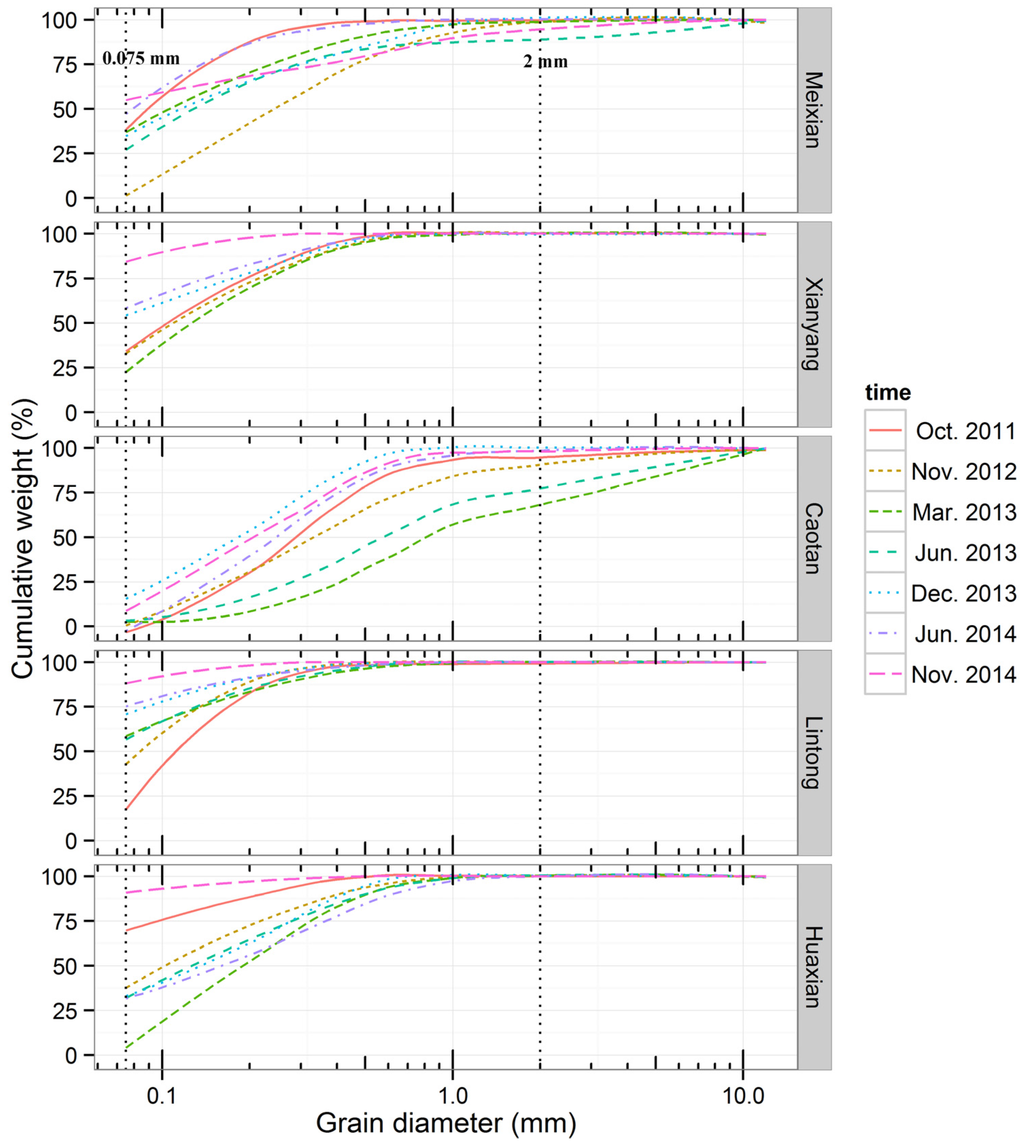
Figure 7.
Average grain size distributions of streambed sediments from each test site along the Weihe River at seven different times.
We explored some possible explanations for the difference of Kv values for sand and silt-clay streambed in the Weihe River. Larger particles of streambed sediments at Caotan are responsible for higher Kv values while the driving force for lower Kv values at the other four sites is potentially caused by the amount of fine-grained sediment. The valley is narrow and steep above Meixian, and then becomes relatively wide and shallow with low gradient from Meixian to the river-mouth. Average river gradients in the reaches of Linjiacun-Xianyang and below Xianyang are respectively 1.24 m/km and 0.28 m/km [45]. With river gradient declining, deposited sediment might increase along the river banks. At Meixian and Xianyang, lower streambed hydraulic conductivity is probably caused by the apparent large depositions of silty sand, clay, and sludge from upstream. Meanwhile, the Tongguan elevation which is defined as the stage of a flood discharge at 1000 m3/s at the Tongguan station and can reflect the level of channel deposition in the lower Weihe River (Figure 1), has been rising since construction of the Sanmenxia Reservoir, which prevents sediment transport from the lower Weihe River into the Yellow River, thus causing enormous sedimentation from the Weihe River and its tributaries in the lower Weihe River [32]. For example, the sediment deposition in the reach below Lintong accounted for 89.8% of the total amount since operation of the Sanmenxia Reservoir [33]. Sediments chiefly from the Jinghe River accounted for 52.6% of the total amount, and the sediment discharge mainly occurred in June-September, accounting for 92.4% of the whole year [30]. The amount of silt and clay from the Weihe River, Jing River, and Beiluo River settled at Lintong and Huaxian, resulting in lower streambed hydraulic conductivity at the two sites. Generally, the sediments are more compacted along the banks than in the center of the river, probably resulting in some of the streambed hydraulic conductivity heterogeneity at the five test sites.
5.2. Temporal Variation of Streambed Kv and Grain Size
The grain-size distribution varies significantly with time at different sites (Figure 7); the Spearman’s rank correlation test was used to examine whether these changes are significantly correlated to changes in vertical hydraulic conductivity. The correlations are generally not significant at the p = 0.05 level with the exception of Caotan where changes in silt-clay content of the sediment and Kv are significantly negatively correlated with a Spearman coefficient of −8.93E-01 (p = 1.23E-02). However, for the combined data from all test sites, significant negative correlation is also apparent (R = −6.16E-01, p = 1.04E-04), further indicating that streambed Kv values decrease with the increase of silt-clay content.
At Caotan, a decrease in Kv values may be explained by an increase in the silt and clay content of the sediment. The average weight percentage of silt and clay at Caotan are 5.44E-01% in October 2011, 1.24% in November 2012, 1.44% in March 2013, 2.74% in June 2013, 21.2% in December 2013, 3.81% in June 2014, and 11.9% in November 2014, respectively (Figure 7). The sediment samples in March 2013, June 2013, and June 2014 contain more silt and clay particles than those in October 2011 and November 2012. At the Caotan site with mainly sandy sediment, the slightly higher content of silt/clay may lead to the smaller Kv values in March 2013, June 2013, and June 2014 compared to those in October 2011 and November 2012. The significant increase in silt-clay in December 2013 and November 2014 may contribute to the sharp decrease of streambed vertical hydraulic conductivity. At the other four sites, the grain-size distribution experiences different temporal variations (Figure 7). Also, no significant correlations between changes of streambed Kv values and changes of sediment silt-clay content are found at the p = 0.05 level, however, streambed sediments do have exceedingly high content of silt and clay (Figure 7). For streambed sediments with high content of silt and clay, differences in silt-clay content do not generally cause significant changes in Kv values. This might be the main reason for consistently low streambed vertical hydraulic conductivity at the four sites. For example, an obvious difference of silt-clay content (45.5% in November 2012 and 29.1% in March 2013) exists at a test location of Xianyang; however, there are similar Kv values (2.40E-02 m/d in November 2012 and 2.60E-02 m/d in March 2013). Moreover, those low streambed Kv at the five test sites probably might also be influenced by small horizontal layers of finer sediment, as demonstrated by some researchers [3,6,16].
Temporal variations of streambed Kv may be affected by the method applied for measuring the streambed Kv. As the streambed Kv measurements are a point measurement in space, and the measurements during different sampling times were not carried out exactly at the same location, there is the risk that temporal variability of streambed Kv at the same location may not be entirely accurate and has some uncertainty, as small local heterogeneity may produce greater changes of streambed Kv. Nevertheless, many studies have also stated that temporal variability in Kv value should be predominantly associated with several factors, including erosion/deposition process, bioturbation, porosity, clogging, and changes in water viscosity [5,14,21]. These mechanisms can act together, therefore a better understanding of these hydrological environment still requires research.
5.3. The Variation of Streambed Kv with Depth
The Kruskal-Wallis test indicates weak evidence of differences of Kv between the upper layer and lower layer. The higher Kv of the upper layer could be explained by the fact that hyporeic water exchange with inflow and outflow in the upper layer might result in more unconsolidated and permeable sediment, and invertebrate bioturbation (such as burrowing, feeding) in the upper layer of sediments could create new pore spaces and therefore a larger streambed Kv. Moreover, gas bursts from redox processes can expand sediments and induce higher permeability [18].
5.4. Correlation between Water Depth and Streambed Kv
Generally, the flow velocity is larger in the channel when the water depth becomes deeper, thus implying that the sediments are finely winnowed, exactly as finer-grained particles are washed away and transferred to areas of lower flow velocities, and coarser sediments are left in situ, ultimately generating a larger Kv [7]. As Song et al. [16] illustrated, increasing stream flow can wash away the destroyed fine layer and sediment mounds, and submerge the original exposed streambed, enhancing the hyporheic flux and causing a higher Kv of channel sediments. Therefore, the water depth can reflect flow velocity and might further explain the variation in vertical hydraulic conductivity [6].
At each test site, water depth was measured. No significant correlations were found at any of the sites; correlation p-values range from 2.00E-01 to 9.64E-01. In some former studies [6,7,46] positive correlations were found; however, Jiang et al. [20] found that the correlation of the two variables is insignificant and the correlation coefficient is negative at individual sites. Chen [7] also reported that the correlation between the two variables may not be perfect, which is ascribed to the complicated flow condition, special geographical features or occurrence of outliers for the Kv values [46]. Water depth in river channels is the only representative factor of the flow conditions during permeameter tests, but the sediments may be deposited under different flow conditions, and might suffer some fluctuations with time thus generating a poor correlation [7,46].
6. Conclusions
In this paper, streambed vertical hydraulic conductivity was measured based on the in situ test method at five test sites along the Weihe River, at seven different times from October 2011 to November 2014. The Kv values cover a range of five orders of magnitude from 5.87E-04 to 61.3 m/d. Statistical distribution of the 385 streambed Kv values is neither normal nor log-normal at our test sites, unlike in other research areas.
Streambed Kv values represent a significant variation from site to site due to differences of grain size. Kv values at Caotan with dominance of coarse sand and gravel are noticeably greater than those at the other four sites with mainly silt-clay sediments. However, the Kv values at the other four sites are relatively close and have less variability than at Caotan. Cox-Stuart tests indicate that there are no significant temporal trends in the median Kv values from any of the sites. Despite the lack of definite trends, temporal variations do occur, probably resulting from changes in silt-clay content of the sediment, especially at Caotan. This similarly occurs for the combined data from all test sites, where there also exists significant negative correlation between changes of streambed Kv values with changes of sediment silt-clay content. There is weak evidence that streambed Kv values decrease with depth.
As the streambed Kv tests are point measurements in space, there are some limitations when extrapolating conclusions from these values to illustrate larger scale characteristics. The data shown here document only spatial and temporal variations of streambed Kv along the flow direction of the Weihe River. The Kv tests across the channels were not conducted in this study due to higher water depth. To more deeply understand the spatial and temporal variations of streambed Kv in the Weihe River, further Kv tests across the channels based on more advanced technologies are needed.
Acknowledgments
This study was jointly supported by the National Natural Science Foundation of China (Grant Nos. 51379175 and 51079123), Specialized Research Fund for the Doctoral Program of Higher Education (Grant No.20136101110001), Program for Key Science and Technology Innovation Team in Shaanxi Province (Grant No. 2014KCT-27), Postdoctoral Science Foundation of China (Grant No. 2015M572592), Program for Graduated Student Innovation Talents Training in Northwest University (Grant No. YZZ14011). We are very grateful to two anonymous reviewers for their helpful comments and suggestions, which helped to improve the quality of the manuscript.
Author Contributions
Jinxi Song conceived and designed the experiments; Liping Wang, Bo Zhang and Weiwei Jiang performed the experiments; Guotao Zhang and Ming Wen analyzed the data; Hongtao Guo contributed analysis tools; Liping Wang and Jinxi Song wrote the paper.
Conflicts of Interest
The authors declare no conflict of interest.
References
- Calver, A. Riverbed permeabilities: Information from pooled data. Groundwater 2001, 39, 546–553. [Google Scholar] [CrossRef]
- Cardenas, M.B.; Zlotnik, V.A. A simple constant-head injection test for streambed hydraulic conductivity estimation. Groundwater 2003, 41, 867–871. [Google Scholar] [CrossRef]
- Landon, M.K.; Rus, D.L.; Harvey, F.E. Comparison of instream methods for measuring hydraulic conductivity in sandy streambeds. Groundwater 2001, 39, 870–885. [Google Scholar] [CrossRef]
- Dong, W.H.; Chen, X.H.; Wang, Z.W.; Ou, G.X.; Liu, C. Comparison of vertical hydraulic conductivity in a streambed-point bar system of a gaining stream. J. Hydrol. 2012, 450–451, 9–16. [Google Scholar] [CrossRef]
- Genereux, D.P.; Leahy, S.; Mitasova, H.; Kennedy, C.D.; Corbett, D.R. Spatial and temporal variability of streambed hydraulic conductivity in West Bear Creek, North Carolina, USA. J. Hydrol. 2008, 358, 332–353. [Google Scholar] [CrossRef]
- Min, L.L.; Yu, J.J.; Liu, C.M.; Zhu, J.T.; Wang, P. The spatial variability of streambed vertical hydraulic conductivity in an intermittent river, northwestern China. Environ. Earth. Sci. 2013, 69, 873–883. [Google Scholar] [CrossRef]
- Chen, X.H. Statistical and geostatistical features of streambed hydraulic conductivities in the Platte River, Nebraska. Environ. Geol. 2005, 48, 693–701. [Google Scholar] [CrossRef]
- Springer, A.E.; Petroutson, W.D.; Semmens, B.A. Spatial and temporal variability of hydraulic conductivity in active reattachment bars of the Colorado River, Grand Canyon. Groundwater 1999, 37, 338–344. [Google Scholar] [CrossRef]
- Chen, X.H.; Mi, H.C.; He, H.M.; Liu, R.C.; Gao, M.; Huo, A.D.; Cheng, D.H. Hydraulic conductivity variation within and between layers of a high floodplain profile. J. Hydrol. 2014, 515, 147–155. [Google Scholar] [CrossRef]
- Ryan, R.J.; Boufadel, M.C. Evaluation of streambed hydraulic conductivity heterogeneity in an urban watershed. Stoch. Environ. Res. Risk A 2006, 21, 309–316. [Google Scholar] [CrossRef]
- Sebok, E.; Duque, C.; Engesgaard, P.; Boegh, E. Spatial variability in streambed hydraulic conductivity of contrasting stream morphologies: Channel bend and straight channel. Hydrol. Processes 2015, 29, 458–472. [Google Scholar] [CrossRef]
- Hatch, C.E.; Fisher, A.T.; Ruehl, C.R.; Stemler, G. Spatial and temporal variations in streambed hydraulic conductivity quantified with time-series thermal methods. J. Hydrol. 2010, 389, 276–288. [Google Scholar] [CrossRef]
- Chen, X.H. Streambed hydraulic conductivity for rivers in south-central Nebraska. J. Am. Water Resour. Assoc 2004, 40, 561–573. [Google Scholar] [CrossRef]
- Blaschke, A.P.; Steiner, K.H.; Schmalfuss, R.; Gutknecht, D.; Sengschmitt, D. Clogging processes in hyporheic interstices of an impounded river, the Danube at Vienna, Austria. Int. Rev. Hydrobiol. 2003, 88, 397–413. [Google Scholar] [CrossRef]
- Wu, G.; Shu, L.; Lu, C.; Chen, X.; Zhang, X.; Appiah-Adjei, E.K.; Zhu, J. Variations of streambed vertical hydraulic conductivity before and after a flood season. Hydrol. J. 2015, 23, 1603–1615. [Google Scholar] [CrossRef]
- Song, J.X.; Chen, X.H.; Cheng, C.; Wang, D.M.; Wang, W.K. Variability of streambed vertical hydraulic conductivity with depth along the Elkhorn River, Nebraska, USA. Chin. Sci. Bull. 2010, 55, 992–999. [Google Scholar] [CrossRef]
- Leek, R.; Wu, J.Q.; Wang, L.; Hanrahan, T.P.; Barber, M.E.; Qiu, H.X. Heterogeneous characteristics of streambed saturated hydraulic conductivity of the Touchet River, south eastern Washington, USA. Hydrol. Process. 2009, 23, 1236–1246. [Google Scholar] [CrossRef]
- Song, J.X.; Chen, X.H.; Cheng, C.; Summerside, S.; Wen, F.J. Effects of hyporheic processes on streambed vertical hydraulic conductivity in three rivers of Nebraska. Geophys. Res. Lett. 2007, 34, L07409. [Google Scholar] [CrossRef]
- Chen, X. Depth-dependent hydraulic conductivity distribution patterns of a streambed. Hydrol. Process. 2011, 25, 278–287. [Google Scholar] [CrossRef]
- Jiang, W.W.; Song, J.X.; Zhang, J.L.; Wang, Y.Y.; Zhang, N.; Zhang, X.H.; Long, Y.Q.; Li, J.X.; Yang, X.G. Spatial variability of streambed vertical hydraulic conductivity and its relation to distinctive stream morphologies in the Beiluo River, Shaanxi Province, China. Hydrol. J. 2015, 23, 1617–1626. [Google Scholar] [CrossRef]
- Levy, J.; Birck, M.D.; Mutiti, S.; Kilroy, K.C.; Windeler, B.; Idris, O.; Allen, L.N. The impact of storm events on a riverbed system and its hydraulic conductivity at a site of induced infiltration. J. Environ. Manag. 2011, 92, 1960–1971. [Google Scholar] [CrossRef] [PubMed]
- Nowinski, J.D.; Cardenas, M.B.; Lightbody, A.F. Evolution of hydraulic conductivity in the floodplain of a meandering river due to hyporheic transport of fine materials. Geophys. Res. Lett. 2011, 38. [Google Scholar] [CrossRef]
- Cheng, D.H.; Chen, X.H.; Huo, A.D.; Gao, M.; Wang, W.K. Influence of bedding orientation on the anisotropy of hydraulic conductivity in a well-sorted fluvial sediment. Int. J. Sediment Res. 2013, 28, 118–125. [Google Scholar] [CrossRef]
- Li, J.; Shi, C.; Xu, X.; Fu, Z. Mechanism and effect of channel evolution at estuary of Weihe River to Huanghe River. Chin. Geograph. Sci. 2006, 16, 122–126. [Google Scholar] [CrossRef]
- He, H.M.; Zhang, Q.F.; Zhou, J.; Fei, J.; Xie, X.P. Coupling climate change with hydrological dynamic in Qinling Mountains, China. Clim. Chang. 2009, 94, 409–427. [Google Scholar] [CrossRef]
- Zhao, G.; Mu, X.; Tian, P.; Wang, F.; Gao, P. Climate changes and their impacts on water resources in semiarid regions: A case study of the Wei River Basin, China. Hydrol. Process. 2013, 27, 3852–3863. [Google Scholar] [CrossRef]
- Jiao, J.; Ma, X.; Wang, F.; Wang, W. Regional variation features of sediment yields intensity in Wei River Basin. Res. Soil Water Conserv. 2004, 11, 60–63. [Google Scholar]
- Qiao, Y.S.; Guo, Z.T.; Hao, Q.Z.; Yin, Q.Z.; Yuan, B.Y.; Liu, D.S. Particle distribution characteristics and its depositional indication of a mid-miocene and paleosoil profile. Sci. China Ser. D Earth Sci. 2006, 36, 646–653. [Google Scholar]
- Feng, P.L.; Wang, L.L.; Ma, X.Y.; Chen, N.L. Sedimentology and siltation of the streambed for the lintong reach of the Weihe River. Yellow River 2012, 34, 22–25. [Google Scholar]
- Li, J.K.; Li, H.E.; Shen, B.; Li, Y.J. Effect of non-point source pollution on water quality of the Weihe River. Int. J. Sediment Res. 2011, 26, 50–61. [Google Scholar] [CrossRef]
- Wang, Z.; Wu, B.S.; Wang, G.Q. Fluvial processes and morphological response in the yellow and weihe rivers to closure and operation of sanmenxia dam. Geomorphology 2007, 91, 65–79. [Google Scholar] [CrossRef]
- Yazdandoost, F.; Attari, J. Hydraulics of Dams and River Structures; CRC Press: Tehran, Iran, 2004. [Google Scholar]
- Song, J.X.; Xu, Z.X.; Hui, Y.H.; Li, H.E.; Li, Q. Instream flow requirements for sediment transport in the lower weihe river. Hydrol. Process. 2010, 24, 3547–3557. [Google Scholar] [CrossRef]
- Du, J.; Shi, C.X. Effects of climatic factors and human activities on runoff of the weihe river in recent decades. Quat. Int. 2012, 282, 58–65. [Google Scholar] [CrossRef]
- Wang, W.K.; Kong, J.L.; Duan, L.; Wang, Y.L.; Ma, X.D. Research on the conversion relationships between the river and groundwater in the yellow river drainage area. Sci. China Ser. E Technol. Sci. 2004, 47, 25–41. [Google Scholar] [CrossRef]
- Hvorslev, M.J. Time Lag and Soil Permeability in Ground-Water Observations; U.S. Army Bulletin: Vicksburg, MS, USA, 1951. [Google Scholar]
- Freeze, R.; Cherry, J. Groundwater; Prentice-Hall: Englewood Cliffs, NJ, USA, 1979. [Google Scholar]
- Davis, R.A. Depositional Systems: A Genetic Approach to Sedimentary Geology; Prentice-Hall: Englewood Cliffs, NJ, USA, 1983. [Google Scholar]
- Team, R.C. R: A Language and Environment for Statistical Computing. Available online: https://www.r-project.org (accessed on 3 July 2015).
- Helsel, D.R.; Hirsch, R.M. Statistical Methods in Water Resources; Elsevier: Amsterdam, The Netherlands, 1992; Volume 49. [Google Scholar]
- Bonferroni Correction. From MathWorld—A Wolfram Web Resource. Available online: http://mathworld.wolfram.com/BonferroniCorrection.html (accessed on 9 November 2015).
- Sprent, P.; Smeeton, N.C. Applied Nonparametric Statistical Methods; CRC Press: Boca Raton, FL, USA, 2007. [Google Scholar]
- Cox, D.R.; Stuart, A. Some quick sign tests for trend in location and dispersion. Biometrika 1955, 42, 80–95. [Google Scholar] [CrossRef]
- Chen, X.H.; Burbach, M.; Cheng, C. Electrical and hydraulic vertical variability in channel sediments and its effects on streamflow depletion due to groundwater extraction. J. Hydrol. 2008, 352, 250–266. [Google Scholar] [CrossRef]
- Lin, X.Z.; Jiang, N.Q.; Liang, Z.Y.; Yue, D.J. Study on Instream Flow Requirement for Transportation of Sediment in the Lower Weihe River; The Yellow River Press: Zhengzhou, China, 2005. [Google Scholar]
- Wu, G.D.; Shu, L.C.; Lu, C.P.; Chen, X.H. The heterogeneity of 3-d vertical hydraulic conductivity in a streambed. Hydrol. Res. 2015. [Google Scholar] [CrossRef]
© 2016 by the authors; licensee MDPI, Basel, Switzerland. This article is an open access article distributed under the terms and conditions of the Creative Commons by Attribution (CC-BY) license (http://creativecommons.org/licenses/by/4.0/).