Abstract
Bacterial sourcing in urban watersheds is a critical water quality concern because elevated index bacteria concentrations routinely trigger beach advisories and closures in coastal Southern California and elsewhere. This study evaluates diurnal controls on dry-weather bacterial loading in a groundwater-fed storm drain within the Malibu Creek watershed using a 24 h monitoring campaign. Discharge, nutrients, major ions, stable water isotopes, and index bacteria (total coliforms and Escherichia coli) were measured at six time intervals. Storm drain discharge varied by more than an order of magnitude, with rapid nighttime increases of up to +91 L/min during irrigation periods. Total Dissolved Solids ranged from 1276 to 2175 mg/L, peaking during groundwater-dominated low-flow conditions. Nitrate–N ranged from 1.08 to 2.96 mg/L, and orthophosphate from 0.44 to 2.16 mg/L, with nutrient concentrations increasing as irrigation inputs increased. Total coliform concentrations ranged from 13,000 to 670,000 MPN/100 mL, and E. coli ranged from 300 to 120,000 MPN/100 mL, exceeding concentrations in tap water and recycled water runoff by up to two orders of magnitude. End member mixing analysis showed that storm drain flow consisted of approximately 45% groundwater, 23–26% tap water, and 30–33% recycled water during early morning peak flow, shifting to ~56% groundwater and <12% recycled water by mid-morning. The lowest bacterial concentrations occurred during groundwater-only flow, while the largest bacterial increases coincided with the greatest positive changes in discharge rather than with maximum absolute flow. These results support an irrigation-driven biofilm stripping mechanism as the dominant control on dry-weather bacterial loading, with groundwater seepage sustaining biofilm persistence but not peak bacterial release. The findings highlight the importance of internal storm drain processes for managing coastal bacterial exceedances and protecting beach health.
Keywords:
storm drain; biofilm; groundwater; total coliform; E. coli; nutrients; stable water isotopes 1. Introduction
Dry-weather flows in Southern California storm drains consist of a mixture of urban runoff, imported water, defined as water delivered from northern California or the Colorado River, recycled irrigation water, defined as treated recycled water used for irrigation of urban areas, and, in some locations, groundwater seepage [1,2,3,4]. These flows represent major sources of bacterial loading to coastal watersheds and have contributed to beach closures, ecological degradation, and economic losses in the Los Angeles region for decades [5,6,7,8,9].
These elevated bacterial loads drive recurrent beach advisories, and closures impair recreational use and impose substantial economic costs. Despite long-standing recognition of this problem, no study known to the authors has evaluated whether subsurface storm drains receiving groundwater seepage create internal ‘incubator’ conditions that promote bacterial growth, or whether bacterial loading is dominated by physical mobilization of bacteria-rich biofilms during nighttime irrigation pulses [9,10,11]. Groundwater seepage, which creates continual base-level wetting of the storm drain and supplies nitrogen and phosphorus, may therefore be a key but underexamined factor in urban bacterial loading [12,13].
This study examines diurnal bacterial and nutrient dynamics within subsurface storm drains in the Malibu Creek watershed that receive groundwater seepage during daylight hours and increased nighttime flows from residential irrigation and recycled water irrigation of medians, parks, and institutional properties [14,15,16] (Figure 1). Many storm drains in the Los Angeles region receive groundwater with elevated nitrate and phosphate concentrations due to legacy contamination, commonly ranging from 3 to 25 mg/L NO3–N [17,18,19], often associated with historical agricultural fertilizer application. Groundwater phosphate is typically attenuated by soils; however, where storm drains receive substantial runoff from recycled water applied to urban landscapes, PO4 concentrations commonly range from 2 to 6 mg/L [14,17]. Drains lacking groundwater influence are supplied primarily by nighttime nuisance flows such as lawn watering, washwater, and street runoff [1,2,4].
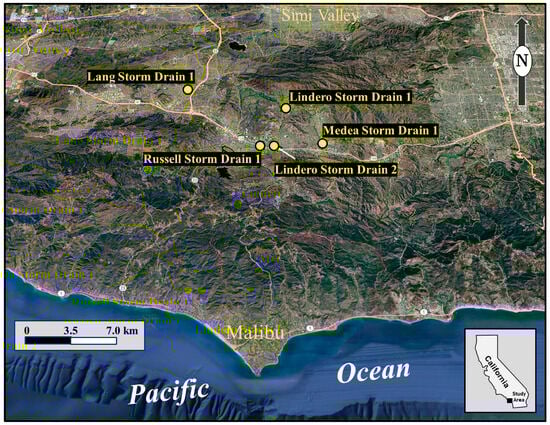
Figure 1.
Location of the study area in coastal Southern California, encompassing the cities of Thousand Oaks, Oak Park, and Agoura Hills. Yellow markers indicate subsurface storm drains monitored or referenced in this study, including the Lang, Russell, Lindero, and Medea storm drains, which receive varying contributions from groundwater seepage, imported water, and recycled irrigation flows. The map shows drainage to the Pacific Ocean via Malibu Creek at Malibu, with Lang Creek issuing into Conejo Creek and also discharging to the ocean, illustrating the potential role of these systems as direct conduits of dry-weather bacterial loading to inland recreational and coastal waters.
Under dry-weather conditions, lower bacterial concentrations in street gutter runoff compared to storm drain discharge suggest two primary loading mechanisms. The groundwater-fed incubator hypothesis proposes that continuous, nutrient-rich groundwater seepage supports internal bacterial proliferation by maintaining moisture and supplying nutrients and seed bacteria [20,21,22]. Under this model, storm drains function as protected environments where bacteria grow within pooled water, sediments, or biofilms [10,23]. The nighttime irrigation biofilm stripping hypothesis proposes that bacterial spikes result from the physical removal of established biofilms during higher flows.
Biofilm stripping occurs when increased nighttime discharge raises flow velocity, causing portions of biofilms attached to storm drain surfaces to shear off and become suspended [11,24,25]. Biofilms accumulate during low-flow daytime conditions, incorporating bacteria, organic material, and sediment [21,26,27]. Increased discharge mobilizes biofilm fragments, producing short-lived but pronounced bacterial spikes [10,28]. These mechanisms are not mutually exclusive, but one may dominate under different conditions.
To evaluate their relative importance, a diurnal field experiment measured nutrients, general anions, stable isotopes, flow, and indicator bacteria (total Coliforms and Escherichia coli). Results suggest that nutrient-rich groundwater seepage sustains baseline bacterial production, while nighttime irrigation pulses generate episodic velocity increases that may promote biofilm stripping. Together, these findings suggest that internal storm drain processes sustained by groundwater seepage may exert stronger control over bacterial loads than previously recognized and that classification of storm drains based on hydrochemical flow sources may improve management strategies.
Long-term monitoring has shown that underground storm drain flows frequently contain elevated index bacteria [1,4,8]. However, these programs historically did not account for groundwater contributions, despite continuous flow in many drains due to groundwater seepage. Field investigations demonstrate that groundwater can be a substantial component of dry-weather flow where rising water tables intersect storm drain infrastructure [15] (Figure 2). Isotopic and hydrochemical studies at California State University, Los Angeles, further corroborate that many storm drains are partially sustained by groundwater seepage, sometimes nutrient-poor but more commonly nutrient-rich [14,15,19].
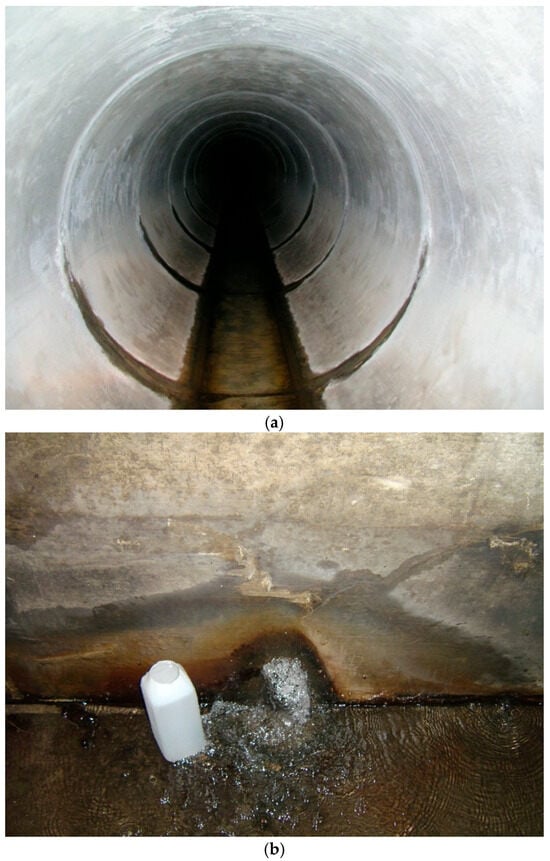
Figure 2.
Photographs illustrating groundwater seepage into underground storm drains. (a) Groundwater discharge along joints in a concrete storm drain pipe, producing localized inflow and persistent wetting of the channel invert. (b) Groundwater flow emerging from a collapse feature within the storm drain, forming a focused seepage zone and sustained dry weather baseflow. These conditions demonstrate a direct hydrologic connection between shallow groundwater and storm drain flows, creating persistently wetted surfaces and a continuous nutrient supply that may promote biofilm development and influence bacterial dynamics inside the storm drain during dry weather.
The study advances understanding of microbial dynamics in engineered subsurface environments by linking hydrologic regime, nutrient supply, and internal storm drain processes to bacterial loading. By distinguishing between groundwater-fed incubator conditions and hydraulically driven biofilm stripping, the results contribute to broader theories of microbial persistence in urban infrastructure systems and provide a framework applicable beyond Southern California, where groundwater infrastructure interactions remain poorly quantified.
2. Biofilm Role in Storm Drains
Biofilms are surface-associated communities that include bacteria, fungi, algae, archaea, and microeukaryotes embedded within a self-produced extracellular matrix that mediates attachment, protection, and metabolic interaction with the surrounding environment [23,24]. Biofilms play a central role in microbial persistence in both natural and engineered aquatic systems. Subsurface storm drain environments provide conditions conducive to biofilm development, as microbial communities colonize drain surfaces in response to persistent moisture, organic matter accumulation, and nutrient availability [10,15]. Biofilm structure and stability vary spatially with hydraulic shear, substrate roughness, and sediment or debris retention, with low-velocity zones favoring thicker, more cohesive biofilms that may be mobilized during episodic increases in flow [29,30]. This spatial heterogeneity likely contributes to short-term variability in bacterial concentrations under dry-weather conditions.
Unlike natural surface waters, underground storm drains lack sunlight-driven photosynthetic production; consequently, microbial activity depends on externally supplied organic carbon and nutrients [15]. Dissolved oxygen concentrations in flowing underground storm drains are commonly near oxygen saturation during dry weather due to shallow flow and atmospheric exchange, while groundwater inflow can provide a source of nutrients depending on groundwater chemistry [15]. During prolonged dry periods typical of coastal California, accumulated organic matter and sediments on concrete surfaces may develop localized anaerobic microenvironments that store reduced constituents such as ammonium, dissolved organic carbon, and sulfide. Disturbance of these materials by elevated flows can mobilize stored constituents, influencing bacterial and chemical dynamics within storm drain systems.
With expanding bacterial Total Maximum Daily Loads (TMDLs) across California and elsewhere, understanding microbial persistence in urban drainage systems has become increasingly important [4,8,29]. Most existing studies focus on storm drain outlets, urban surfaces, or receiving waters, and largely attribute elevated bacterial concentrations to urban street surface accumulation and wash-off processes [28,30,31]. In contrast, comparatively little attention has been given to internal storm drain environments, despite their capacity to support microbial growth and storage.
In underground storm drains, intermittent flows, steady nutrient inputs, limited sunlight, and physical protection from disturbance promote biofilm development on common infrastructure materials such as PVC and concrete [11,20]. These biofilms can form long-lasting microbial reservoirs that integrate chemical and microbial stressors over time [25,32,33]. Recent studies show that biofilms exposed to urban runoff mixtures retain metals, organic contaminants, and fecal indicators, functioning as sinks during low-flow periods and sources during subsequent hydraulic disturbances [34,35].
Once established, biofilms can retain index and pathogenic bacteria and release them during periods of elevated flow through sloughing and shear-induced detachment [11,27]. Similar processes have been observed in stormwater-fed distribution systems, where stormwater exposure increases biofilm density and alters microbial community composition relative to drinking water systems [36,37]. These dynamics can elevate downstream bacterial concentrations, suggesting that exceedances of bacterial objectives may reflect internal environmental growth as well as active external inputs from urban surfaces [21,38].
In this study, we hypothesize that groundwater seepage maintains moist conditions within underground storm drains during diurnal low-flow periods, allowing biofilms to remain hydrated and metabolically active [22]. This persistent moisture supports the hypothesis that groundwater-fed storm drains can function as microbial incubators [10]. At night, dry-weather irrigation flows increase velocities and shear stress, episodically mobilizing accumulated biofilm and releasing stored bacteria. Despite regular street sweeping and strict neighborhood controls on surface inputs in the affluent study area, internal biofilm processes within the storm drain may control key aspects of bacterial loading. If confirmed, these findings suggest that subsurface biofilm reservoirs should be considered alongside surface sources when evaluating bacterial inputs in urban watersheds.
3. Methods and Materials
3.1. Field Methods
Field methods included sampling and flow measurements at several storm drains (Figure 1). The primary drain monitored over a 24 h period was Lindero Storm Drain 1, which conveyed tap water and tap-water runoff as well as recycled water and recycled-water runoff (Figure 3). Grab samples were collected at a constricted section of the drain where flow was concentrated into a channel segment approximately 50 cm wide. Tap water and recycled water samples were collected directly at source locations in community parks and golf courses, and runoff from these sources was collected from street gutters during evening hours when surface runoff was observable. All sampling was conducted during dry-weather conditions in late summer 2019. Other storm drains were sampled twice over the course of a single day (Figure 1).
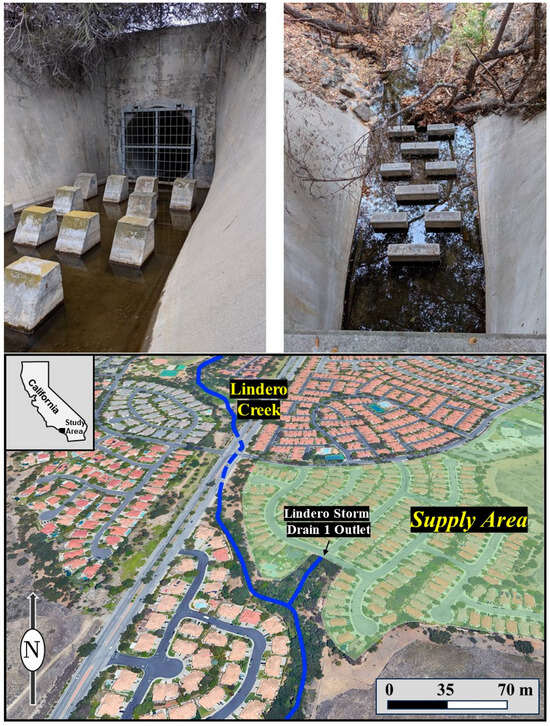
Figure 3.
Photographs of the Lindero Storm Drain 1 study area (bottom aerial photograph). Interior view of the storm drain showing persistent dry-weather flow within the concrete channel, with daylight flows dominated primarily by groundwater seepage. Sampling was performed directly below the metal grate and upstream of the concrete channel velocity disruptions (upper left). Photograph looking down into the storm drain from the street surface, illustrating the location of concentrated flow below the concrete-lined section of channel that allowed stream gaging for discharge (upper right).
All water samples except those for bacterial analysis were collected in clean high-density polyethylene (HDPE) containers. Containers were triple rinsed with deionized water and again with sample water prior to filling, then sealed with tight-fitting caps to prevent bubbles or headspace when required. Samples were labeled with sample identification, date, analytical parameters, and preservation method. Anion samples (chloride, sulfate, nitrate nitrogen, ammonia nitrogen, and orthophosphate) were stored refrigerated at <4 °C and analyzed within recommended holding times. Stable isotope samples were collected unpreserved in completely filled 250 mL HDPE bottles. Bacteria samples were collected in sterile, thiosulfate-treated polystyrene (PS) bottles using grab sampling.
At each sampling interval, bottles were rinsed with sample water three times before final collection. Storm drain samples were collected in situ, when accessible, or directly where water discharged from the system. Bacterial samples were stored on ice and delivered to a certified commercial laboratory within 6 h of collection. Each bottle was labeled on site with the sample name, time, and date of collection.
Electrical conductivity, temperature, and dissolved oxygen were measured in the field using handheld meters. Drainflow was measured using electromagnetic current meters. Drain water discharge measurements followed U.S. Geological Survey procedures [39,40] using a Marsh McBirney Model 2000 flowmeter and a top-setting wading rod (HACH Company, Loveland, CO, USA). Under these conditions, discharge measurements are usually estimated to be accurate within approximately 5%.
3.2. Laboratory Methods
Anions and nutrients were analyzed spectrophotometrically in the CSU Hydrogeology Laboratory using a HACH DR6000 UV–VIS spectrophotometer (HACH Company, Loveland, CO, USA). Sulfate was analyzed using EPA Method 375.4 [41], chloride using EPA Method 9251 [42], nitrate–nitrogen by EPA Method 353.2 [43], ammonia-nitrogen by EPA Method 350.1 [44], and orthophosphate by EPA Method 365.1 [45]. Sulfate is an especially valuable tracer for identifying groundwater contributions from the Monterey Formation, as groundwater derived from this unit typically exhibits SO4/Cl weight ratios on the order of approximately 3:1 to 7:1.
Because major ion data were incomplete for the Las Virgenes Creek data set, Total Dissolved Solids (TDS) were estimated from temperature-compensated specific conductance using the equation TDS = 0.68 × EC. The coefficient (0.68) was derived from a linear regression of groundwater general minerals data from the Santa Monica Mountains [46], and estimated TDS values are accurate to within approximately 6.6%.
Stable isotopes of water (δ18O and δ2H) were measured at the Environmental Isotope Laboratory, University of Arizona, using a Finnigan Delta S gas source IRMS. For δ2H, samples were reduced by chromium at 750 °C using a Finnigan H/Device; δ18O was measured following CO2–H2O equilibration at 15 °C. Results were normalized to VSMOW and SLAP reference standards [47]. Analytical precision was ±0.9‰ or better for δ2H and ±0.08‰ or better for δ18O [48].
For bacteriological analysis, samples were processed immediately upon arrival at the commercial analytical laboratory. The analytical laboratory is accredited by the California State Water Resources Control Board Environmental Laboratory Accreditation Program (ELAP), which certifies laboratories to perform bacteriological analyses for regulatory purposes in accordance with state requirements for technical competence and quality management. Total coliforms and Escherichia coli (E. coli) were quantified using the Most Probable Number (MPN) method following Standard Methods, specifically the IDEXX Colilert® reagent with the Quanti-Tray®/2000 system (IDEXX Laboratories, Inc., Westbrook, ME, USA). Samples were incubated in selective media, and bacterial presence was determined based on gas formation or fluorescence indicative of total coliforms and E. coli. [49]. Results were reported as MPN per 100 mL based on the number of positive wells across the dilution series [50].
The laboratories applicable QA/QC requirements for this method include a required method detection limit of no greater than 1 MPN/100 mL and precision criteria of ≤20% relative percent difference (RPD). Although field duplicates and field blanks were not collected for this sampling event, laboratory quality control measures were implemented for each analytical batch. These measures included laboratory duplicates and laboratory reagent blanks processed alongside environmental samples. Laboratory duplicate results were evaluated for precision, and data were accepted only when replicate analyses met the method performance criterion of ≤20% RPD. If this criterion was not met, associated data were discarded, and corrective actions were taken, including method evaluation and precision verification prior to continued analysis. Laboratory reagent blanks were required to be below the detection limit of 1 MPN/100 mL. All accepted data therefore meet the QA/QC performance standards specified in the IDEXX Colilert®/Quanti-Tray® method and the laboratory’s ELAP accreditation requirements.
3.3. Data Processing and Analysis
Data interpretation involved integrating stable water isotope signatures, conservative tracer chemistry, and three-component end member mixing models to identify and quantify the relative contributions of groundwater, recycled irrigation water, and municipal tap water to storm drain flows. Stable water isotopes (δ18O and δ2H) were first evaluated to differentiate groundwater-fed drain flow from inputs derived from municipal water systems. Samples were plotted against source water isotopic ranges to classify each drain sample as groundwater dominated, mixed, or enriched by imported water. Isotopic distinctness of the 17:00 sample allowed it to be designated as the groundwater end member. These data were plotted alongside the global meteoric water line of [51,52].
Chemical tracers, including nitrate, orthophosphate, and Total Dissolved Solids (TDS), were then used to refine source attribution. End member concentrations for tap water, recycled water, and Initial Drain water were compiled from multiple samples and used to establish linear mass balance systems. For each mixed sample, two independent tracer pairs (nitrate–TDS and orthophosphate–TDS) were solved simultaneously, with fractional contributions constrained to sum to unity. Concordance between solutions from multi-tracer systems served as a quantitative measure of model reliability. Temporal patterns in source water contributions were inferred by comparing mixing model outputs with concurrent field observations of flow magnitude, end member signatures of tap water, recycled water, and groundwater, and known irrigation schedules. These methods allowed source contributions to be interpreted in the context of diurnal hydrologic forcing and source water interactions within the storm drain.
For data interpretation and visualization of bacterial data, a precision of ±20% was assumed to represent the maximum analytical uncertainty for accepted bacterial results, consistent with the method performance criteria. Error bars and uncertainty limits shown in figures and tables were therefore based on this assumed ±20% precision.
4. Results of 24 h Analysis at Lindero Storm Drain 1
Runoff contributions to the storm drain system were characterized under field conditions that reflect the episodic and spatially variable nature of urban irrigation-driven runoff. Many irrigation systems in the study area operate for short durations and do not consistently generate surface runoff to streets or storm drains, resulting in extended periods with no observable flow despite repeated site visits. Sampling focused on periods when measurable dry weather runoff was present, including one event at Ochos Rios that contributed flow to Lindero Storm Drain 1. All sampling was conducted over approximately one month under relatively stable meteorological conditions, with no recorded rainfall and limited variability in air temperature across 30 days and limited changes in humidity. Under these conditions, dry weather runoff samples collected a few days apart are considered representative of typical urban runoff during the study period, in this particular study area.
Primary discussion parameters include Total Dissolved Solids (TDS), nitrate–N, ammonia–N, orthophosphate, and index bacteria. Storm drain samples from Lindero Storm Drain 1 (Lindero SD 1) had TDS concentrations ranging from 1276 to 2175 mg/L. Nitrate–N concentrations ranged from 1.08 to 2.96 mg/L, ammonia–N from 0.059 to 0.17 mg/L, and orthophosphate (PO4) from 0.44 to 2.16 mg/L. Total coliform counts ranged from 13,000 to 670,000 MPN/100 mL, and E. coli ranged from 300 to 120,000 MPN/100 mL (Table 1).

Table 1.
General hydrochemistry, stable water isotope, and microbial data for storm drain water collected at Lindero SD 1 over a 24 h period. Reported parameters include field measurements, major ions, nutrients, total coliform and E. coli concentrations, and stable water isotopes (δ18O and δD). S.C. is specific conductance, TDS is Total Dissolved Solids, and D.O. is dissolved oxygen.
Recycled water from the Lindero Creek Golf Course had a TDS concentration of 592 mg/L. Nitrate–N was 6.32 mg/L, ammonia–N was 0.058 mg/L, and orthophosphate was 4.48 mg/L (Table 2). Recycled water runoff sampled at Russell Ranch Road/Lindero Road had a TDS concentration of 846 mg/L. Nitrate–N was 9.08 mg/L, ammonia–N was 0.040 mg/L, and orthophosphate was 6.61 mg/L. Total coliform was 330 MPN/100 mL, and E. coli was 6.3 MPN/100 mL (Table 2).
Table 2.
General hydrochemistry, stable water isotope, and microbial data for individual samples of recycled water, recycled water runoff, raw tap water, and tap water runoff in the study watershed. Reported parameters include field measurements, major ions, nutrients, total coliform and E. coli concentrations, and stable water isotopes (δ18O and δD). Values below analytical detection limits are reported as indicated. S.C. is specific conductance, TDS is Total Dissolved Solids, and D.O. is dissolved oxygen.
Raw tap water had a TDS concentration of 342 mg/L. Nitrate–N was 0.74 mg/L, and ammonia–N was 0.30 mg/L; orthophosphate was below detection (<0.15 mg/L). Total coliform and E. coli were below detection (<10 MPN/100 mL). Tap water runoff samples had TDS values ranging from 342 to 359 mg/L. Nitrate–N ranged from 0.68 to 0.98 mg/L, ammonia–N from 0.30 to 0.37 mg/L, and orthophosphate from 0.71 to 0.82 mg/L. Total coliform ranged from 40,000 to 410,000 MPN/100 mL, and E. coli from 43 to 390 MPN/100 mL (Table 2). Stable water isotopes are presented graphically in the Discussion. Other parameters, including pH, conductivity, chloride, and sulfate, are provided for comparison in Table 1 and Table 2.
5. Data Interpretation and Discussion
The interpretation and discussion are organized to integrate hydrologic, chemical, isotopic, and biological evidence in a sequential manner. First, stable water isotopes are used to distinguish groundwater, municipal tap water, and recycled water endmembers and to establish qualitative mixing relationships among source waters. Second, a quantitative three-component end member mixing analysis is applied to determine the relative contributions of groundwater, tap water, and recycled water to storm drain flow at different times of day using paired chemical tracers. Third, temporal variations in index bacteria are evaluated in relation to changes in flow rate and source water contributions to assess the role of internal storm drain processes. Finally, these datasets are integrated using 24 h monitoring results and twice-daily monitoring results to evaluate competing conceptual models for bacterial loading and to place the findings within a broader framework of dry weather storm drain behavior, groundwater seepage, and urban water management. The 24 h detailed investigation at Lindero Storm Drain 1 is discussed first.
One distinctive aspect of this analysis at Lindero Storm Drain 1 is that the groundwater component of discharge, identified during the low-flow period at 17:06 h, contains markedly elevated salinity, with 2175 mg/L Total Dissolved Solids (TDS) and 1075 mg/L sulfate (SO4), whereas municipal tap water and recycled water contain less than 850 mg/L TDS and less than 205 mg/L SO4, respectively. The elevated salinity of groundwater in this area reflects interaction with the Monterey Formation, a geologic unit known to contain abundant gypsum and to generate sulfate-rich waters [53]. The Monterey Formation, which underlies much of the study area, represents a major geologic source of dissolved solutes contributing to groundwater discharge and surface runoff. Elevated sulfate concentrations, commonly accompanied by increased phosphorus, are characteristic of waters influenced by this formation [53]. The strong contrast between groundwater and municipal water sources in both salinity and sulfate chemistry (Table 1 and Table 2) provides well-defined endmembers and allows mixing models to be applied with high discriminatory power.
5.1. Stable Water Isotopes
Stable water isotopes collected from the storm drain, tap water (both at the source and in runoff), and recycled water (both at the source and in runoff) plot distinctly from the 5:06 PM drain sample, which represents entirely groundwater-fed flow (Figure 4). This interpretation is supported by the high TDS values characteristic of groundwater derived from the Monterey Formation, a geologic unit rich in gypsum that produces water with elevated dissolved solids and high orthophosphate concentrations [53,54,55].
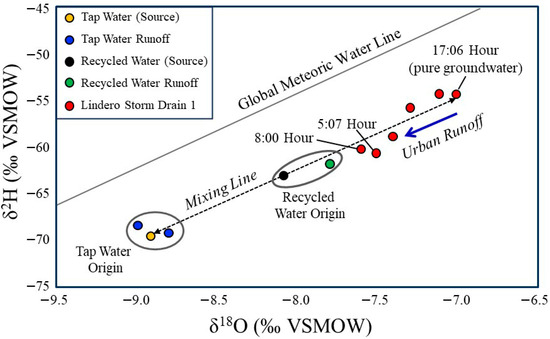
Figure 4.
Stable water isotope composition (δ18O vs. δ2H) of storm drain water, tap water (source and runoff), and recycled water (source and runoff) collected in the study watershed. The Global Meteoric Water Line [51,52] is shown for reference. The 17:06 h storm drain sample represents groundwater-dominated flow derived from the Monterey Formation. Tap water samples plot within the expected isotopic range of imported State Water Project supplies, with minimal difference between source water and runoff. Recycled water samples are isotopically heavier than tap water, and source and runoff samples plot closely together. Most storm drain samples fall along a mixing trajectory between the groundwater end member and municipal water sources (tap and recycled), indicating variable contributions of tap water, recycled water, or both during the monitoring period. Isotopic data alone do not permit quantitative separation of these municipal endmembers (tap and recycled).
Tap water, imported from the Northern California State Water Project and Colorado River sources, plots within the expected isotopic range for these imported waters. There is little isotopic difference between the source tap water and the tap water measured in runoff.
Recycled water at the source and in runoff is isotopically heavier than tap water, even though tap water is the only input to the municipal sewer system in the study area neighborhood. This offset is most likely explained by (1) leakage of shallow groundwater into sewer infrastructure situated below the channel grade, through the same mechanism that allows groundwater to enter the storm drain via cracks and breaks in subsurface pipes. The recycled water source and recycled water runoff are separated isotopically by only a small amount. However, the source sample was collected three years prior to this study, and the isotopic signature of recycled water can vary over time depending on imported water inputs during wet and dry years, as well as changes in treatment plant retention and loading. Slight evaporation during surface runoff could also contribute marginal enrichment, although this effect is likely minimal because runoff was collected within 100 m of the irrigation overspray that generated the flow.
When plotted along a mixing line between tap water and recycled water, most drain samples fall along a trajectory between groundwater (represented by the 17:00 sample) and the two municipal water end members. The 5:07 h and 8:00 h samples plot farthest from the groundwater endmember; these are also the samples with the highest flows and the most enriched isotopic signatures (Figure 4). Together, the drain flow and isotopic data clearly indicate that tap water, recycled water, or both, entered the storm drain during the monitoring period. However, the isotope data do not allow quantitative discrimination of the relative proportions of tap versus recycled water, because both endmembers plot along the same mixing line with groundwater. Additional methods are therefore used to estimate the percentages of input sources, using the 5:07 PM period as the baseline representing ~100% groundwater conditions.
5.2. Percentages of Tap Water, Recycled Water, and Groundwater in the Drain at Different Times
Determining the relative contributions of recycled water, municipal tap water, and groundwater to the storm drain is important because these source waters have distinctly different nutrient concentrations, and their relative proportions directly control the observed water quality signal in the drain (Table 1 and Table 2). Recycled water contains substantially higher concentrations of nitrate, ammonia, and orthophosphate than either municipal tap water or groundwater at this location; consequently, even small recycled water fractions can produce measurable increases in nutrient concentrations in mixed drain flow. Chloride and sulfate were evaluated as potential tracers for mixing computations, but are limited by the similar chloride-to-sulfate ratios of tap water and recycled water, which reduces their ability to distinguish between these sources, analogous to the limitations observed for stable water isotopes (Figure 4). In contrast, orthophosphate and nitrate provide more effective mixing tracers because of their large concentration differences among source waters and because groundwater concentrations (represented by the 17:06 drain sample) lie between those of recycled water and tap water, allowing a more robust mixing analysis.
Applying a three-component end member mixing model allows these source contributions to be quantified rather than inferred qualitatively, as shown by stable water isotopes. By explicitly solving for the fractions of recycled water, tap water, and groundwater at different times of day, the analysis distinguishes whether observed increases in nutrients reflect changes in source water mixing (for example, increased recycled water runoff during irrigation periods) or in stream processes. This distinction is critical for interpreting short-term temporal variability for the 5:07 h and 8:00 h samples and for identifying the dominant drivers of nutrient loading to the drain during these peak flows. Quantifying source contributions also has practical implications for water quality management. If elevated nutrient concentrations are shown to be primarily associated with recycled water inputs, management actions can focus on irrigation timing, application rates, or recycled-water quality. Conversely, if tap water or groundwater contributions dominate, different control strategies would be warranted. Thus, the mixing analysis provides a framework for linking measured nutrient concentrations in the drain to their upstream water sources.
The three-component end member mixing model is applied to evaluate how recycled irrigation water, municipal tap water, and groundwater-derived drain water contributed to the composition of mixed samples collected at 5:07 and 8:00 h. A linear, three-component mass-balance model is used:
where
Cm = fr Cr + ft Ct + fg Cg
Cm = concentration in the mixed sample;
Cr, Ct, Cg = source water concentrations;
fr, ft, fg = fractional contributions of recycled water, tap water, and groundwater (groundwater represented by low flow drain water at 17:06 h).
Fractions are constrained to sum to unity:
fr + ft + fg = 1
For each sampling time, two independent systems are solved: the nitrate/TDS couplet and orthophosphate/TDS couplet. Nitrate, orthophosphate, and Total Dissolved Solids (TDS) are assumed to be conservative tracers given their short residence times in the underground storm drain with limited photosynthesis. Independent tracer couplet pairs nitrate/TDS and orthophosphate/TDS are evaluated using Equations (1) and (2).
End member compositions used in calculations are summarized in Table 3. Recycled water and tap water values represent averages of multiple earlier samples, providing stable, representative chemical signatures for these sources. The groundwater end member was defined using the 17:06 h sample, collected under conditions in which the drain was fed entirely by groundwater seepage. This interpretation is supported independently by flow records, elevated and stable Total Dissolved Solids, and stable water isotope signatures, all of which indicate the absence of recycled or tap water influence during that period.
Table 3.
Source water average concentrations used as end members computed from Table 1.
These strong chemical contrasts shown in Table 3 provide excellent discriminatory power for resolving the relative contributions of each component in the mixed samples. Two mixed samples collected at 5:07 and 8:00 h exhibited intermediate concentrations between the end members (Table 1 and Table 2; Figure 4). The 5:07 h sample was collected following nighttime irrigation but before typically elevated morning tap water usage, while the 8:00 h sample captured conditions after recycled inputs diminish and tap water use increases. Table 4 shows the mixed water concentrations from the storm drain used for mixing model solutions (from Table 3). The intermediate TDS and nutrient concentrations are consistent with varying combinations of the three end member waters.
Table 4.
Water concentrations from the storm drain at 5:07 h and 8:00 h.
At 5:07 h, the drainage system exhibited a balanced mixture of all three source waters. Using data from Table 3 and Table 4 and solving Equations (1) and (2), the nitrate/TDS couplet solution indicated contributions of 44.8% groundwater, 25.7% tap water, and 29.5% recycled water (Figure 5). The orthophosphate/TDS couplet produced nearly identical results (44.0% groundwater, 22.7% tap water, and 33.3% recycled water). An agreement within approximately ±0.5 to 3.5 percentage points demonstrates conservative behavior of the tracer species and reinforces confidence in the model output. These results reflect the hydrologic transition occurring before sunrise, during which recycled irrigation water from nighttime applications remained present, early tap water input began to register in the system, and groundwater continued to provide steady background flow.
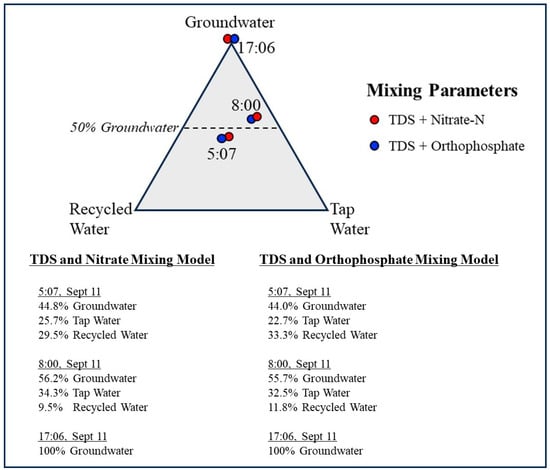
Figure 5.
Trilinear diagram showing the relative contributions of groundwater, municipal tap water, and recycled water to storm drain flow at 5:07, 8:00, and 17:06 h. Mixing fractions were calculated using three-component end member mass balance models based on paired nitrate–TDS and orthophosphate–TDS tracer systems (Table 3 and Table 4). At 5:07 h, results indicate a mixed contribution of all three sources, whereas the 8:00 h sample shows increased groundwater dominance. The 17:06 h sample represents the groundwater end member, with negligible imported water contribution (<3%), and is shown for reference.
By 8:00 h, the mixed sample reflected a strong shift toward groundwater dominance. The nitrate/TDS model calculated 56.2% groundwater, 34.3% tap water, and 9.5% recycled water, while the orthophosphate/TDS couplet yielded consistent results (55.7% groundwater, 32.5% tap water, and 11.8% recycled water). This shift aligns with expected diurnal patterns: as nighttime irrigation ceases, recycled water inputs decline sharply; groundwater discharge remains relatively constant; and tap water usage increases with morning activity. Groundwater at 17:06 h is plotted in the trilinear diagram for comparison. Any imported water contribution at 17:06 h is negligible (<3% of flow), based on the stable isotope signature and elevated salinity of this sample. Figure 5 presents the results in a trilinear diagram representing percentages of groundwater, tap water, and recycled water contributing flow to the drain at 5:07 h, 8:00 h, and 17:06 h. A worked example of the three-component end member mixing calculation, using the 05:07 h sample and the nitrate–TDS tracer couplet, is provided in the Supplementary Materials with all mathematical steps shown.
Across sampling times calculated, nitrate/TDS-based and orthophosphate/TDS-based mixing solutions were highly consistent, differing by only approximately 0.5 to 3.5 percentage points, indicating that both tracers behaved conservatively over the short residence time and limited biogeochemical processing within the engineered drainage system. Total Dissolved Solids (TDS) provided particularly strong resolving power because of the pronounced contrast between the groundwater-dominated end member and the two municipal water sources. The mixing results reveal a clear and systematic temporal structure. At 5:07 h, storm drain flow reflects a balanced mixture of recycled water, tap water, and groundwater. By 8:00 h, the groundwater-derived source dominates the mixture, recycled water contributions decline sharply, and tap water inputs increase but remain secondary. At 17:06 h, the drain is fed almost entirely by groundwater seepage, as irrigation inputs are negligible during this period, yielding a groundwater end member that defines the groundwater composition at this drain location. These patterns are consistent with predictable daily cycles in irrigation practices, groundwater discharge, and municipal water use. The close agreement among independent tracer pairs demonstrates the robustness of the dual tracer member mixing approach for resolving short-term variability in the storm drain.
5.3. Analysis of Bacteria Changes with Flow Rates and Time
Temporal patterns in bacterial concentrations in the storm drain, and their relationship to changes in flow rate, are evaluated over the monitoring period. The bacterial data shown in Figure 6 provide insight into the role of internal storm drain processes in controlling bacterial loading. Across the range of observed conditions, E. coli and total coliform concentrations measured in the storm drain are generally higher than those measured in tap water, tap water runoff, or recycled water runoff. This pattern suggests that the storm drain is not simply transmitting bacteria supplied directly by source waters, but instead functions as an internal reservoir where bacteria accumulate and are later mobilized. Error bars shown in Figure 6 represent ±20 percent analytical uncertainty and show negligible overlap among samples.
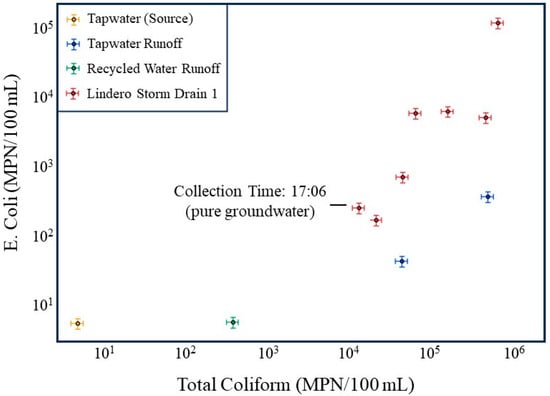
Figure 6.
Comparison of E. coli and total coliform concentrations for source waters (tap water and recycled water), dry weather runoff, and storm drain samples at the Lindero storm drain site. Storm drain samples usually plot above tap water, tap water runoff, and recycled water runoff, indicating elevated bacterial concentrations within the drain relative to source water inputs. The 17:06 sample, collected during a low flow period sustained entirely by groundwater, exhibits the lowest bacterial concentrations among storm drain samples and is identified as the groundwater-dominated condition, yet remains elevated relative to several source water measurements. Axes are logarithmic, and error bars at the 20% limit are shown.
The lowest bacterial concentrations in the storm drain occur during the 17:06 sampling interval, which corresponds to the lowest flow period, when discharge is sustained entirely by groundwater. At this time, E. coli and total coliform concentrations in the storm drain approach the lower bound of the observed storm drain dataset and are substantially lower than concentrations measured during nighttime higher-flow periods (Table 1 and Table 2; Figure 6). Bacterial concentrations in the storm drain remain elevated relative to some source water inputs even during this low-flow period. This observation is consistent with groundwater-fed low-flow conditions producing continuing bacterial transport from the storm drain.
In contrast, storm drain samples collected during periods influenced by tap water and recycled water runoff plot well above the corresponding source water samples, often by one to two orders of magnitude. This divergence demonstrates that elevated bacterial concentrations in the storm drain cannot be explained solely by mixing of incoming waters. Instead, it supports the interpretation that increased nighttime flows mobilize bacteria stored within the storm drain itself, likely through shear induced detachment of biofilm. The consistently higher bacterial concentrations in the storm drain relative to all source water inputs provide independent evidence that internal biofilm sloughing, rather than external bacterial loading, dominates bacterial transport during irrigation-driven high flow periods.
The time sequenced bacterial plots (Figure 7) further illustrate the dynamic relationship between storm drain hydraulics and bacterial loading over the 24 h monitoring period. When viewed in chronological order, the storm drain samples trace a coherent trajectory from lower bacterial concentrations during the late afternoon low flow period (17:06, 11 September) to progressively higher concentrations as evening and nighttime conditions develop. The 17:06 sample, collected during a period of groundwater-dominated flow, plots at the lowest combined total coliform and E. coli concentrations, reinforcing the interpretation that groundwater-fed low flow conditions are associated with lower levels of bacterial transport.
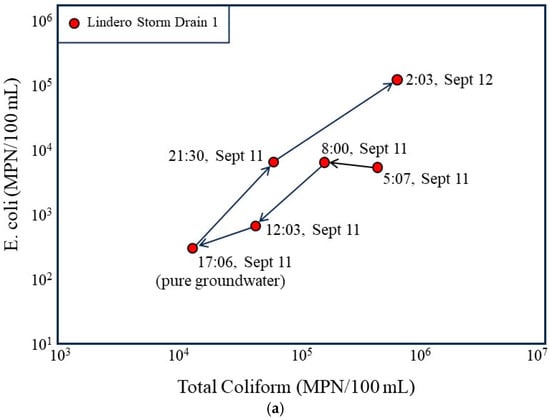
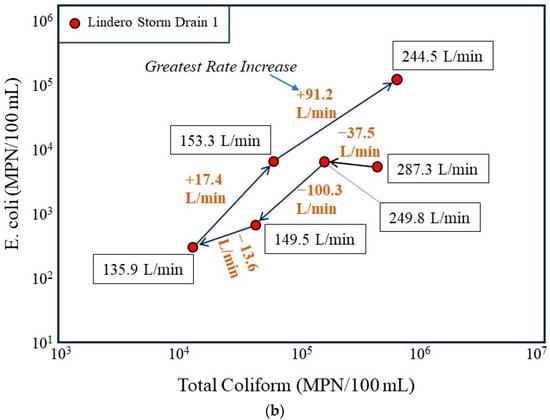
Figure 7.
Temporal evolution of bacterial concentrations in the Lindero Storm Drain 1 in relation to flow conditions. (a) Time sequenced plot of E. coli versus total coliform concentrations for storm drain samples collected over a 24 h period, with arrows indicating the chronological progression from the groundwater-dominated low-flow condition at 17:06 (11 September) to higher-flow nighttime conditions. (b) Time sequenced plot annotated with measured discharge at each sampling time and the change in discharge between successive intervals, emphasizing that the largest increase in bacterial concentrations coincides with the greatest positive rate of change in flow (+91.2 L/min) rather than with the highest absolute discharge.
As flow increases during the evening and nighttime hours, bacterial concentrations increase nonlinearly. The largest upward shifts in E. coli and total coliform concentrations coincide with periods of rapidly increasing discharge rather than steady state high flow conditions. This pattern is highlighted in the rate of change plot (Figure 7b), which shows that the greatest increase in flow between successive sampling intervals corresponds to the largest increase in bacterial concentrations. In particular, the interval associated with the greatest positive change in discharge (+91.2 L/min) also exhibits the largest increase in bacterial indicators, producing a pronounced shift toward higher bacterial concentrations.
Conversely, intervals characterized by decreasing or modestly changing flow show either smaller increases or declines in bacterial concentrations. This asymmetry indicates that bacterial response is more sensitive to rapid increases in flow velocity and associated shear stress than to absolute discharge alone. Such behavior is inconsistent with gradual in situ bacterial growth, which would be expected to respond more slowly and independently of short-term hydraulic changes.
These observations provide support for Hypothesis 2 (Biofilm Sloughing Hypothesis). The close temporal coupling between rapid increases in flow and sharp increases in bacterial concentrations is consistent with shear induced detachment of biofilm from storm drain surfaces. As irrigation-driven inflows increase velocity, accumulated biofilm and associated bacteria are mobilized into the water column, producing abrupt increases in measured bacterial concentrations. The observation that bacterial concentrations during the groundwater-dominated low-flow period remain higher than some runoff source concentrations suggests that Hypothesis 1 (groundwater incubator conditions) also operates at this site, albeit to a lesser extent than the sloughing mechanism described in Hypothesis 2. A conceptual model for these processes is shown in Figure 8.
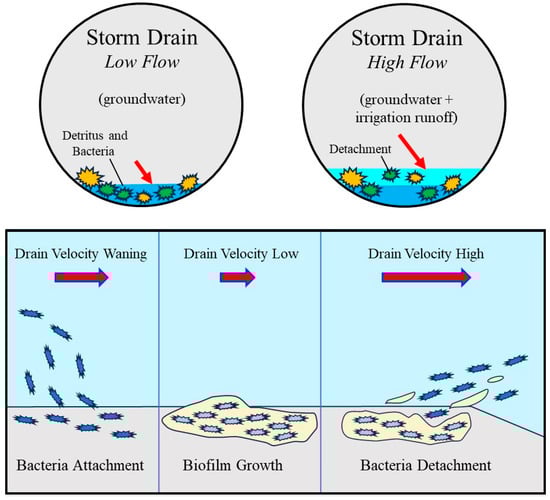
Figure 8.
Conceptual model illustrating bacterial accumulation and mobilization within the storm drain under contrasting hydraulic conditions. During low flow conditions dominated by groundwater input, low velocities promote the accumulation of detritus and bacteria and the development of attached biofilm on storm drain surfaces. As flow increases due to the addition of irrigation runoff, drain velocity and shear stress increase, resulting in partial detachment of biofilm and release of bacteria into the water column. The lower panels illustrate the progression from bacterial attachment and biofilm growth at low velocities to enhanced bacterial detachment under higher velocity conditions, providing a conceptual framework for interpreting observed increases in bacterial concentrations during nighttime high flow periods. The lower diagram is informed by an established biofilm life cycle model from the Center for Biofilm Engineering, Montana State University [56] but is significantly modified and adapted here to represent hydraulic controls specific to urban storm-drain systems.
5.4. Compilation and Integration of 24 h Monitoring Data
The integrated 24 h monitoring data provide a framework for evaluating the relative validity of the two proposed hypotheses describing bacterial dynamics within the storm drain. Diurnal patterns in flow, Total Dissolved Solids, nutrient concentrations, and index bacteria are internally consistent and collectively indicate that bacterial loading is controlled by nighttime irrigation-driven processes rather than by groundwater-fed incubation during low flow periods.
During daytime hours, discharge in the storm drain declines to a stable minimum that closely matches measured groundwater seepage rates (Figure 9a). Under these conditions, groundwater represents the dominant source of flow. Total Dissolved Solids are highest during this period (Figure 9b), consistent with the elevated dissolved solids content of local groundwater relative to municipal tap water and recycled water. At the same time, nutrient concentrations, particularly nitrate and phosphate, are at their lowest levels (Figure 9c), and index bacteria reach their minimum observed concentrations (Figure 9d). These observations indicate that groundwater contributes less nutrient or bacterial mass to the drain and that in the drain, bacterial concentrations remain low under stable, low-velocity conditions.
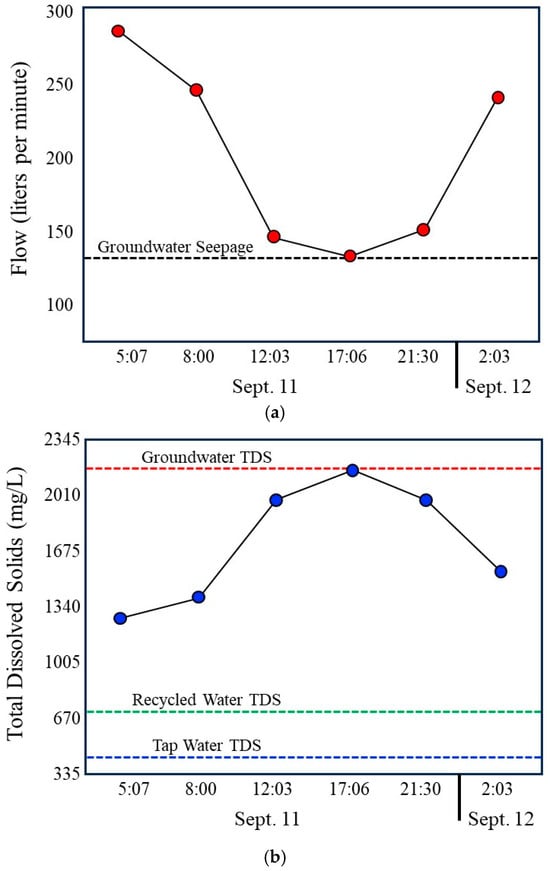
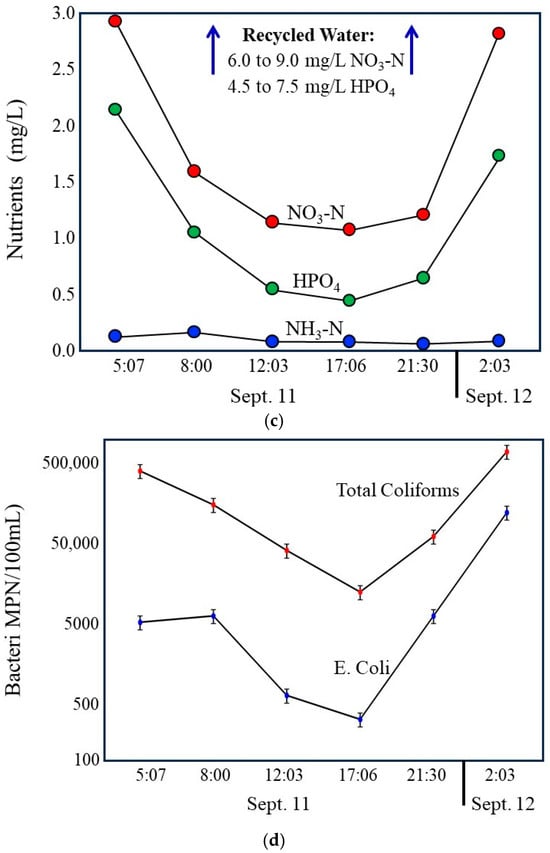
Figure 9.
Compilation of 24 h time series data illustrating coupled hydrologic, chemical, and bacterial dynamics in the Lindero Storm Drain 1. (a) Storm drain discharge, showing low, stable groundwater-dominated flow during daytime hours and increased flow during evening and nighttime irrigation periods. (b) Total Dissolved Solids, with the highest values during groundwater-dominated low flow conditions and marked decreases during nighttime irrigation due to dilution by imported municipal and recycled waters. Compilation of 24 h time series data. (c) Nutrient concentrations (nitrate and orthophosphate), exhibiting minimum values during daytime low flow conditions and increased concentrations during nighttime periods, as well as reflecting recycled water influence. (d) index bacteria (E. coli and total coliforms), showing lowest concentrations during groundwater-dominated low flow conditions and sharp increases during nighttime higher flow periods. Together, the panels demonstrate strong diurnal coherence among flow, water chemistry, and bacterial indicators, indicating that bacterial loading is controlled primarily by irrigation-driven increases in flow and associated internal storm drain processes rather than by groundwater-fed incubation during low-flow periods. Error bars in the graph (d) are shown at the 20% limits.
As evening and nighttime irrigation begins, discharge increases substantially due to the addition of municipal tap water and recycled water (Figure 9a). This transition is accompanied by a marked decrease in Total Dissolved Solids (Figure 9b), reflecting dilution of high dissolved solids groundwater by lower dissolved solids in imported waters. Concurrent increases in nitrate and phosphate (Figure 4) further confirm the growing influence of recycled water, which contains substantially higher nutrient concentrations than either tap water or groundwater. These chemical changes provide independent evidence of shifting source water contributions during nighttime periods.
The most pronounced response occurs in bacterial indicators. Total coliforms and E. coli concentrations increase sharply during nighttime higher flow periods, with peak values coinciding with increased discharge and reduced dissolved solids (Figure 9d). This pattern is inconsistent with Hypothesis 1 (Incubator Hypothesis), which predicts elevated bacterial concentrations during stable, groundwater-dominated low-flow conditions if biofilms primarily function as microbial growth incubators. Instead, bacterial concentrations are lowest during these periods, indicating limited net bacterial accumulation under groundwater-only flow conditions. Error bars shown in Figure 9d represent ±20 percent analytical uncertainty, with negligible overlap between samples.
The conceptual model shown in Figure 8 combines what was directly observed in the field with process interpretations inferred from those observations. Field data clearly show that groundwater-dominated low-flow conditions are associated with persistent wetting of the storm drain, elevated Total Dissolved Solids, and the lowest measured index bacteria concentrations. The data also document rapid nighttime increases in discharge linked to irrigation runoff and corresponding sharp increases in total coliform and E. coli that occur during periods of increasing flow velocity rather than during maximum discharge. Bacterial concentrations in the storm drain consistently exceeded those measured in tap water, recycled water runoff, and street runoff, indicating an internal storm drain source of bacteria rather than simple transport from incoming waters.
The representation of biofilm attachment, growth, and detachment in Figure 8 reflects hypothesized processes inferred from these observations and from established biofilm models. During low-flow, groundwater-fed conditions, low velocities favor bacterial attachment and persistence on storm drain surfaces, but limited release to the water column. Although biofilm growth is not directly measured, it is supported indirectly by sustained wet conditions, nutrient availability, and persistent background bacterial levels. When nighttime irrigation runoff increases discharge and velocity, shear stress increases and promotes detachment of biofilm and associated bacteria from the drain surfaces. This process provides a mechanistic explanation for the observed bacterial spikes under relatively low external bacterial inputs. Figure 8 should be interpreted as a conceptual model grounded in field observations but illustrating mechanisms that are inferred rather than directly observed.
6. Hypothesis Testing—Postulated Storm Drain Processes
The 24 h monitoring of Lindero Storm Drain 1 produced a high-resolution, internally consistent dataset that documents diurnal variations in flow, source = water composition, and bacterial indicator concentrations at a single location. The dataset is suitable for evaluating short-term temporal variability and relationships among groundwater seepage and bacterial response under specific conditions. A limitation of the dataset is that it represents one storm drain with a singular hydrologic and geologic setting; therefore, the broader applicability of the results requires evaluation using additional storm drains with differing flow regimes and source water contributions.
To evaluate the working hypothesis developed from the 24 h monitoring, a complementary twice-daily sampling program was conducted at multiple storm drains exhibiting a range of hydrologic conditions. Sampling was conducted during early morning periods associated with peak runoff from nighttime irrigation (approximately 5:00–6:30 h) and again later in the morning after most nighttime runoff had passed through the storm drain system. Storm drains were selected to represent conditions with low to moderate baseflow and minimal to substantial changes in discharge between sampling periods, allowing assessment of whether relationships observed in the 24 h dataset are present under differing hydraulic conditions. The twice-daily sampling, therefore, serves as hypothesis testing by evaluating the proposed biofilm mobilization mechanism across multiple sites rather than relying on observations from a single storm drain.
Results are presented first for each storm drain individually, including Lindero Storm Drain 2 (Lindero SD2), Lang Storm Drain 1 (Lang SD1), Medea Storm Drain 1 (Medea SD1), and Russell Storm Drain 1 (Russell SD1) (Figure 1, Figure 10, Figure 11, Figure 12 and Figure 13). Site-specific results document differences in flow magnitude, temporal variability, water chemistry, and bacterial concentrations among the storm drains. These results are then evaluated collectively and compared with patterns observed during the 24 h monitoring period to assess consistency across storm drains with differing hydrologic characteristics.
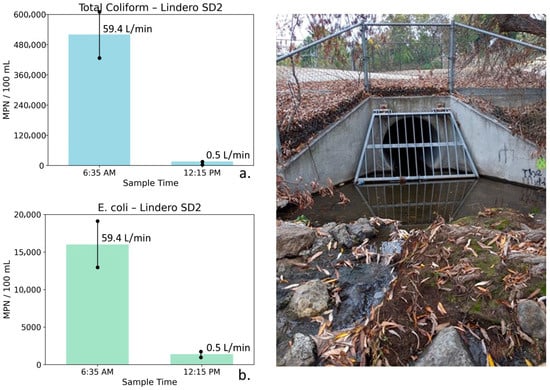
Figure 10.
Total coliform (a) and E. coli (b) concentrations at Lindero Storm Drain 2 measured during early morning peak flow (6:35 AM) and midday low-flow conditions (12:15 PM), with corresponding photographs of the outlet structure. Error bars represent analytical uncertainty of ±20%. Both bacterial indicators decrease by more than an order of magnitude as flow nearly ceases, with changes far exceeding uncertainty bounds, demonstrating a strong and robust flow-related response.
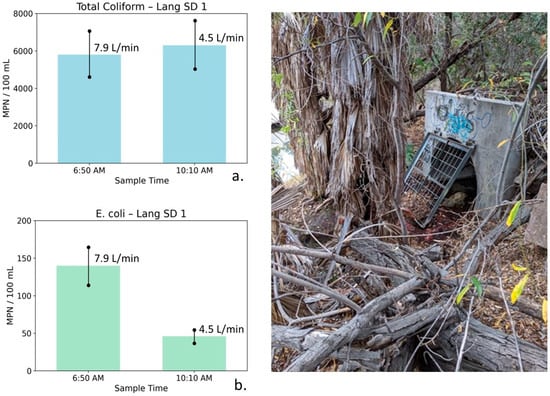
Figure 11.
Total coliform (a) and E. coli (b) concentrations at Lang Storm Drain 1 measured during early-morning low-flow conditions (6:50 AM) and later morning sampling (10:10 AM), with photographs illustrating site conditions. Error bars represent analytical uncertainty of ±20%. Bacterial concentrations are low at both times, and observed changes fall within or near uncertainty bounds, indicating minimal temporal variability under persistently low-flow, groundwater-dominated conditions.
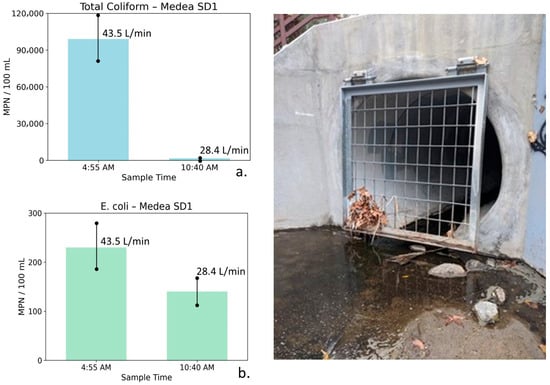
Figure 12.
Total coliform (a) and E. coli (b) concentrations measured at Medea Storm Drain 1 during early-morning peak irrigation runoff (4:55 AM) and later morning conditions (10:40 AM), shown alongside site photographs. Error bars represent analytical uncertainty of ±20%. Total coliform concentrations decline by more than an order of magnitude as flow decreases, exceeding uncertainty bounds, whereas the decrease in E. coli is smaller and partially overlaps uncertainty, indicating a directional but less definitive response.
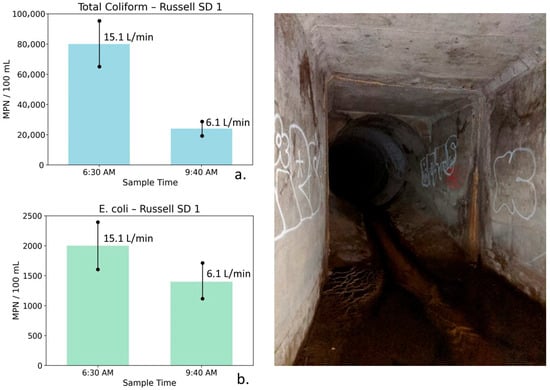
Figure 13.
Total coliform (a) and E. coli (b) concentrations at Russell Storm Drain 1 measured during early-morning irrigation runoff (6:30 AM) and later morning reduced-flow conditions (9:40 AM), shown with site photographs. Error bars represent analytical uncertainty of ±20%. Total coliform concentrations decline substantially beyond uncertainty limits, while E. coli exhibits a smaller decrease that partially overlaps uncertainty, indicating a weaker and less definitive response to declining flow.
6.1. Results of Twice-Daily-Tested Storm Drains
Lindero Storm Drain 2: Water quality, bacterial, and flow measurements for Lindero SD2 are shown in Table 5. These data were collected during early morning peak irrigation runoff and later in the day after runoff had largely subsided. At Lindero SD2, the 6:35 AM sample was characterized by moderately low TDS (683 mg/L) and relatively elevated nutrient concentrations (NO3–N = 3.72 mg/L, PO4 = 3.65 mg/L). Bacterial indicator concentrations at this time were high, with total coliform reaching 520,000 MPN/100 mL, and E. coli measured at 16,000 MPN/100 mL. These elevated bacterial concentrations coincided with a high flow rate of 59.4 L/min, consistent with active nighttime irrigation runoff.
Table 5.
Water quality, index bacteria, and flow measurements for Lindero Storm Drain 2 (Lindero SD2), collected during early-morning peak irrigation runoff and later in the day after runoff had largely subsided. The table summarizes conductivity, TDS, nutrients, total coliform, E. coli, and discharge under contrasting flow conditions. Results capture large changes in bacterial concentrations associated with substantial flow reduction later in the day on 8-13-2019.
By 12:15 PM, flow at Lindero SD2 had nearly ceased (0.5 L/min), indicating that most surface runoff had exited the storm drain system. TDS declined modestly to 562 mg/L while nutrient concentrations also decreased (NO3–N = 2.97 mg/L, PO4 = 2.66 mg/L). In contrast to these relatively small changes in conventional water quality parameters, bacterial indicator concentrations declined dramatically. Total coliform decreased by more than an order of magnitude to 16,000 MPN/100 mL, and E. coli declined to 1400 MPN/100 mL.
Figure 10 illustrates total coliform and E. coli concentrations at Lindero SD2 for the two sampling times. Error bars represent analytical uncertainty of ±20%. For both indicators, the observed decreases substantially exceed the range of uncertainty, indicating robust and meaningful reductions rather than analytical variability.
The lower-flow, background water at Lindero SD2 is characterized by relatively dilute conductivity and TDS values, consistent with groundwater contributions from the local volcanic rocks surrounding the storm drain, rather than saline groundwater associated with the Monterey Formation. The pronounced decline in bacterial indicators coincident with near-complete flow reduction supports the interpretation that elevated early morning flows enhance bacterial transport through hydrologic flushing and possible biofilm disturbance, followed by reduced bacterial export under low-flow conditions.
Lang Storm Drain 1: Table 6 summarizes water quality, bacterial, and flow measurements for Lang SD1 collected during early-morning conditions and later in the morning after a modest reduction in flow. At Lang SD1, the 6:50 AM sample exhibited high TDS (1773 mg/L), indicative of a strong saline groundwater influence. Nutrient concentrations were relatively low (NO3–N = 2.17 mg/L, PO4 = 0.17 mg/L). Bacterial indicator concentrations were low, with total coliform measured at 5800 MPN/100 mL and E. coli at 140 MPN/100 mL. Flow was low (7.9 L/min), indicating limited surface runoff and a dominant groundwater contribution.
Table 6.
Water quality, bacterial indicator, and flow measurements for Lang Storm Drain 1 (Lang SD1), collected during early-morning conditions and later in the morning following a modest reduction in flow. Parameters include conductivity, TDS, nutrients, total coliform, E. coli, and discharge. Results characterize a groundwater-dominated system with low flow variability and limited temporal change in bacterial indicators on 28 August 2019.
By 10:10 AM, flow decreased modestly to 4.5 L/min. TDS declined only slightly to 1740 mg/L, while nutrient concentrations decreased marginally (NO3–N = 1.89 mg/L, PO4 = 0.14 mg/L). Total coliform increased slightly to 6300 MPN/100 mL, while E. coli declined to 46 MPN/100 mL.
Figure 11 illustrates total coliform and E. coli concentrations at Lang SD1 for the two sampling times. Error bars represent analytical uncertainty of ±20%. For total coliform, the small increase falls within the range of uncertainty and does not represent a statistically meaningful change. E. coli concentrations are low at both sampling times, and although an apparent decrease is observed, the absolute concentrations are sufficiently small that changes should be interpreted cautiously and may reflect low-level variability rather than a distinct mobilization process.
The persistently high conductivity and TDS values are consistent with groundwater contributions from the Monterey Formation. The limited change in salinity indicates minimal dilution and suggests only a small contribution from lower-TDS potable water. Recycled water was not used in this portion of the watershed during 2019, and recycled irrigation runoff therefore does not contribute to observed conditions. The low absolute flow and limited change in flow indicate that hydraulic shear stresses were insufficient to cause possible biofilm stripping, resulting in minimal temporal variability in bacterial concentrations.
Medea Storm Drain 1: Table 7 summarizes the water quality, bacterial, and flow measurements for Medea SD1 collected during early morning peak irrigation runoff and later in the morning after runoff had diminished. At this storm drain, measurements collected at 4:55 AM show a TDS of 1507 mg/L with relatively elevated nutrient concentrations (NO3–N = 5.01 mg/L, PO4 = 3.09 mg/L). Bacterial indicator concentrations were also elevated at this time, with total coliform measured at 99,000 MPN/100 mL and E. coli at 230 MPN/100 mL, coincident with a relatively high flow rate of 43.5 L/min. These conditions are consistent with active nighttime irrigation runoff contributing to early-morning flow.
Table 7.
Water quality, bacterial indicator, and flow measurements for Medea Storm Drain 1 (Medea SD1), collected during early-morning peak irrigation runoff and later in the morning after the runoff diminished. Parameters include conductivity, Total Dissolved Solids (TDS), nutrients, total coliform, E. coli, and flow. Data document concurrent changes in source water chemistry, discharge, and bacterial indicators over the sampling interval on 9 September 2019.
By 10:40 AM, TDS increased to 2021 mg/L, while nutrient concentrations declined substantially (NO3–N = 2.91 mg/L, PO4 = 0.87 mg/L). Bacterial indicator concentrations decreased markedly, with total coliform declining to 1700 MPN/100 mL and E. coli to 140 MPN/100 mL, accompanied by a reduction in flow to 28.4 L/min.
The increase in conductivity and TDS, coupled with declining nutrient and bacterial concentrations, is consistent with a transition from recycled water irrigation runoff dominating early morning conditions to a greater influence of saline groundwater seepage from the Monterey Formation later in the morning as surface runoff diminished.
Figure 12 illustrates total coliform and E. coli concentrations at Medea SD1 for the two sampling times. Error bars represent analytical uncertainty of ±20%. For total coliform, the observed decline of more than an order of magnitude substantially exceeds the range of uncertainty, indicating a robust and meaningful decrease. In contrast, the decrease in E. coli concentrations is smaller and partially overlaps with uncertainty bounds and therefore should be interpreted as directional rather than statistically definitive.
Although the limited number of sampling events precludes formal statistical testing, the consistent decreases in bacterial indicators coincident with declining flow and increasing conductivity support the interpretation of changing water source dominance and transport processes over the monitoring period. These patterns are consistent with hydrologic flushing and dilution effects and may also reflect possible biofilm stripping during higher-flow conditions, followed by reduced bacterial transport as flows decreased.
Russell Storm Drain 1: Table 8 summarizes water quality, bacterial, and flow measurements for Russell SD1 collected during early morning peak irrigation runoff and later in the morning after runoff had partially diminished. The 6:30 AM sample at this drain exhibited relatively high TDS (1580 mg/L), along with elevated nutrient concentrations (NO3–N = 4.39 mg/L, PO4 = 2.91 mg/L). Bacterial indicator concentrations were also elevated, with total coliform measured at 80,000 MPN/100 mL and E. coli at 2000 MPN/100 mL. These conditions coincided with a moderate flow rate of 15.1 L/min, consistent with early-morning irrigation-driven runoff.
Table 8.
Water quality, bacterial indicator, and flow measurements for Russell Storm Drain 1 (Russell SD1), collected during early-morning irrigation-driven runoff and later in the morning after a partial reduction in flow. Reported parameters include conductivity, TDS, nutrients, bacterial indicators, and discharge. The data reflect modest changes in salinity with more pronounced reductions in nutrients and bacteria as flow decreases on 16 September 2019.
By 9:40 AM, flow had decreased to 6.1 L/min, indicating a partial reduction in surface runoff. TDS declined only slightly to 1559 mg/L. Nutrient concentrations declined more noticeably (NO3–N = 2.97 mg/L and PO4 = 2.66 mg/L), and bacterial indicator concentrations decreased substantially. Total coliform declined to 24,000 MPN/100 mL, while E. coli decreased to 1400 MPN/100 mL.
Figure 13 illustrates total coliform and E. coli concentrations at Russell SD1 for the two sampling times. Error bars represent analytical uncertainty of ±20%. For total coliform, the observed decrease exceeds the range of uncertainty, indicating a meaningful reduction. In contrast, the decline in E. coli concentrations partially overlaps with uncertainty bounds and should therefore be interpreted as directional rather than statistically definitive.
Russell SD1 drains a mixed geologic setting influenced by both volcanic units and portions of the Monterey Formation. The relatively small change in conductivity and TDS reflects mixing between multiple water sources rather than a simple transition from surface runoff to groundwater seepage. Recycled water contributing to early morning irrigation runoff has higher TDS than local potable water, and as irrigation-derived runoff diminishes, this higher TDS component exits the system. The concurrent reductions in flow, nutrients, and bacterial indicators are consistent with hydrologically driven changes in bacterial transport and possible biofilm disturbance.
6.2. Integrated Interpretation of Twice-Daily Sampling Results: New Process Understanding of Dry-Weather Bacterial Loading
The combined twice-daily sampling results (Figure 14) summarize bacterial concentrations and flow conditions across four storm drains representing a range of hydrologic settings, flow magnitudes, and source water compositions. When evaluated together, the data show that the highest bacterial concentrations and the largest changes in bacterial concentration generally occur at sites with the highest early morning flows and the greatest subsequent decreases in flow. This relation is most consistently observed for total coliform concentrations and is less consistently expressed for E. coli, reflecting both analytical uncertainty and lower measured concentrations of E. coli at several sites.
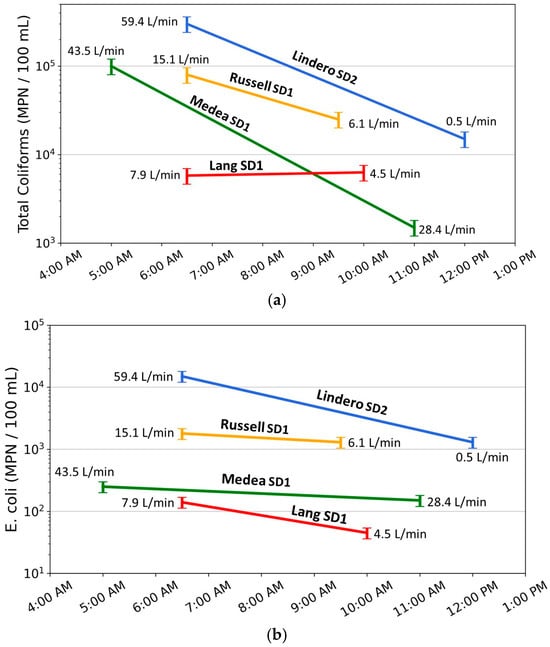
Figure 14.
(a) Total coliform and (b) E. coli concentrations measured during twice-daily dry-weather sampling at four storm drains (Lindero SD2, Russell SD1, Medea SD1, and Lang SD1), plotted against sampling time. Colored lines connect early-morning and late-morning samples for each site, with annotated values indicating measured flow rates (L/min) at the time of sampling. Error bars represent ±20% analytical uncertainty. The figure illustrates that the largest decreases in bacterial concentrations occur at sites with the highest early-morning flows and the greatest subsequent flow reductions, with responses more pronounced and consistent for total coliform than for E. coli.
At all four storm drains, total coliform concentrations are highest during early morning sampling, when flows reflect peak contributions from nighttime irrigation, and decrease later in the morning as flows decline. Lindero Storm Drain 2 (Lindero SD2) exhibits the clearest example of this pattern, with the highest early-morning flow (59.4 L/min) and the largest decrease in flow by late morning (to 0.5 L/min). Total coliform concentrations at this site decrease by more than one order of magnitude, substantially exceeding the ±20 percent analytical uncertainty. Medea Storm Drain 1 (Medea SD1) and Russell Storm Drain 1 (Russell SD1) show similar but intermediate responses, with decreases in total coliform concentration that exceed uncertainty limits and scale with the magnitude of flow reduction. In contrast, Lang Storm Drain 1 (Lang SD1) exhibits low flow at both sampling times and only a small change in discharge; total coliform concentrations at this site remain within analytical uncertainty, indicating limited hydraulic mobilization or sourcing.
Patterns in E. coli concentrations show a less consistent relation to flow change. At Lindero SD2, E. coli concentrations decrease between early and late morning samples by an amount that exceeds analytical uncertainty, indicating a flow-related response. At Medea SD1 and Russell SD1, E. coli concentrations also decrease; however, uncertainty ranges partially overlap between sampling times. As a result, these changes are considered directional but not statistically definitive. The overlapping uncertainty ranges indicate that, although E. coli concentrations generally decrease with declining flow, the magnitude of change is small relative to analytical uncertainty.
At Lang SD1, E. coli concentrations are low at both sampling times and near the lower end of the observed dataset. Although a decrease is observed, the uncertainty range spans a substantial proportion of the measured values. Under these conditions, changes in E. coli concentration are not interpreted as reflecting meaningful differences in transport or mobilization processes and may instead represent low-level variability or analytical uncertainty.
Error bars shown in Figure 14 represent ±20 percent analytical uncertainty consistent with method performance criteria. For total coliform, most observed changes at Lindero SD2, Medea SD1, and Russell SD1 exceed uncertainty limits, indicating that the observed decreases represent measurable system responses. For E. coli, overlap between uncertainty ranges is common except at Lindero SD2, indicating that E. coli is less sensitive to hydraulic changes under the range of conditions observed in this study.
When considered together, the twice-daily sampling results indicate that higher flow magnitude and larger decreases in flow are associated with higher early morning bacterial concentrations and greater reductions later in the morning. Total coliform concentrations show a consistent response to these hydraulic conditions, whereas E. coli responses are more variable and often fall within analytical uncertainty, particularly at lower concentrations. These observations are not consistent with a model in which bacterial concentrations are highest during low-flow conditions. Instead, the results are consistent with bacterial mobilization associated with increased flow and velocity following nighttime irrigation.
6.3. New Process Level Understanding of Dry-Weather Bacterial Loading in Urban Storm Drains
Previous studies of dry-weather bacterial loading in urban storm drains have documented elevated index bacteria concentrations but have generally interpreted these observations in terms of external source inputs, including surface runoff, wildlife, or municipal water discharges. The present study extends this work by evaluating the role of internal storm drain processes under groundwater-influenced conditions. Results indicate that bacterial concentrations within the monitored storm drain were lowest during periods when discharge was sustained entirely by groundwater seepage and highest during periods of increasing discharge associated with nighttime irrigation.
These observations suggest that sustained groundwater seepage alone does not produce maximum bacterial concentrations; instead, short-term increases in discharge and velocity are associated with elevated bacterial levels. Bacterial concentrations within the storm drain consistently exceeded those measured in source waters, indicating the presence of internal bacterial storage. Peak concentrations occurred during periods of increasing discharge rather than during maximum discharge or prolonged low-flow conditions, consistent with mobilization of bacteria from storm drain surfaces during periods of increasing hydraulic shear rather than gradual in situ growth.
These results support a conceptual model in which groundwater seepage maintains persistently wetted conditions that allow biofilms to remain viable within the storm drain, while episodic increases in discharge associated with irrigation mobilize a portion of this stored material (Figure 8). Groundwater, therefore, plays an indirect role in dry-weather bacterial loading by sustaining conditions favorable for bacterial persistence, whereas short-term hydraulic forcing exerts primary control on bacterial transport. This interpretation has implications for understanding dry-weather bacterial exceedances and suggests that internal storm drain conditions should be considered in management strategies for groundwater-influenced urban drainage systems.
Although direct measurements of biofilm granular morphology were not conducted, spatial variation in biofilm structure within storm drain networks can be inferred from hydraulic and physicochemical gradients inherent to these systems. Storm drains experience changes in slope and flow regime commonly as subdrains merge into larger conduits and as inflows from street gutters and irrigation enter the system, producing localized differences in velocity, shear stress, and wetted perimeter that influence biofilm architecture (Figure 13) [33].
Lower velocity sections are expected to support thicker, more cohesive biofilms capable of retaining bacteria and associated contaminants, whereas higher velocity zones likely host thinner, less stable biofilms that are more susceptible to erosion and sloughing. Such spatial variability in biofilm morphology provides a plausible mechanism for episodic bacterial mobilization independent of surface loading from dry- or wet-weather runoff.
Experimental and field studies show that biofilm structure responds non-linearly to combined hydraulic forcing and chemical stressors common in urban runoff, including metals, organic contaminants, and elevated dissolved organic carbon [35]. Short term physiological responses may reflect acute disturbances, whereas longer-term changes in biomass, granularity, and community composition indicate sustained local flow, hydrochemistry, and biological conditions [33].
These findings and analyses suggest storm drain networks are spatially heterogeneous, active biogeochemical systems. While this study demonstrates internally consistent links between bacterial dynamics and in-drain processes, future work incorporating direct characterization of biofilm morphology across slope transitions and water transfer zones would further refine understanding of bacterial development and mobilization in urban storm drains.
6.4. Ramifications of Findings to Wet Weather Conditions and Pollutant Mitigation
Storm drains are dynamic systems in which sediment inputs, organic accumulation, and hydraulic conditions vary over time, shaping microbial and biogeochemical processes. High flows during storm events can flush accumulated sediments, biofilms, and organic material from drain surfaces; however, in semi-arid regions such as southern California, effective cleansing typically requires large or sequential storms. Fresh sediment inputs from construction or brownfield areas may also accumulate within underground drains and evolve over time as organic matter degrades.
The findings of this study indicate that bacterial dynamics in storm drains are primarily governed by internal processes, including biofilm development, organic matter accumulation, and episodic mobilization under changing hydraulic conditions [15]. Consequently, mitigation strategies are most likely to be effective when focused on source control and physical management rather than in-pipe chemical treatment. The entry of leaf litter and other organic debris into storm drains provides substrates that promote microbial growth and biofilm formation and can be reduced through more frequent street sweeping, catch basin maintenance, and debris removal [4].
Chemical disinfectants or bactericides within storm drains are generally constrained by regulatory considerations, particularly where discharges reach coastal or otherwise sensitive receiving waters, and therefore represent a limited management option. Groundwater seepage into storm drains, which sustains baseflow and microbial habitat, is largely unavoidable due to leakage in aging infrastructure. Interception or dewatering systems pose additional challenges related to groundwater handling, treatment, and disposal.
Targeted physical treatment at storm drain outlets, such as ultraviolet disinfection, may represent a feasible end-of-pipe mitigation strategy where financial and operational frameworks allow [10,32,57], although such approaches were not evaluated in this study. Concrete surface characteristics, including surface roughness and the presence of steel fiber reinforcement, influence the composition and succession of marine biofilm communities and therefore may help manage biofilm development on concrete infrastructure in marine environments [58]. More broadly, stormwater infrastructure is increasingly being retrofitted with nature-based treatment systems at both storm drain inlets and outlets. Treatment wetlands and riparian zones at storm drain outlets are particularly effective, providing biological filtration and contaminant removal for both storm-event runoff and persistent dry-weather flows before discharge to downstream receiving waters.
7. Conclusions
This study examined controls on dry-weather bacterial loading in groundwater-fed storm drains in Southern California by integrating a 24 h intensive monitoring campaign with twice-daily sampling at multiple storm drains representing a range of hydrologic and geochemical conditions. Together, these datasets demonstrate that bacterial dynamics are governed primarily by internal storm drain processes interacting with short-term hydrologic forcing, rather than by direct transmission of bacteria from external source waters alone.
Results from the 24 h monitoring at Lindero Storm Drain 1 show that during daytime low-flow conditions sustained almost entirely by groundwater seepage, discharge was lowest, Total Dissolved Solids were highest, nutrient concentrations were minimal, and index bacteria reached their lowest observed levels. These conditions indicate that groundwater contributes little direct bacterial mass to the storm drain but plays an important indirect role by maintaining persistently wetted conditions that allow biofilms to develop and remain viable during extended dry-weather periods. Even under groundwater-dominated low flow, bacterial concentrations remained elevated relative to some source waters, indicating the presence of internal bacterial reservoirs.
In contrast, the largest increases in total coliform and E. coli concentrations coincided with nighttime irrigation periods and rapid increases in discharge. Bacterial concentrations increased most strongly during periods of accelerating flow rather than during maximum absolute discharge, indicating sensitivity to hydraulic acceleration and shear stress. Storm drain bacterial concentrations consistently exceeded those measured in tap water, recycled water runoff, and street runoff, demonstrating that elevated bacterial levels cannot be explained by source-water mixing alone.
The twice-daily sampling conducted at additional storm drains supports and extends these findings. Across multiple sites, the highest bacterial concentrations were observed during early-morning periods associated with peak irrigation-driven flow, followed by substantial reductions as flow declined later in the morning. Total coliform concentrations showed the most consistent response to changes in flow magnitude, whereas E. coli responses were more variable but generally followed the same flow-dependent pattern. Sites with low and relatively stable flow exhibited little change in bacterial concentrations, indicating limited hydraulic mobilization. The agreement between the 24 h time series and the multi-site, twice-daily results demonstrates that these relationships are reproducible across storm drains with differing hydrologic settings.
These observations are inconsistent with a purely groundwater-fed incubator model in which bacterial concentrations would peak during stable low-flow conditions. Instead, the results strongly support a biofilm stripping mechanism in which bacteria-rich biofilms that accumulate on persistently wetted storm drain surfaces are episodically mobilized during irrigation-driven flow pulses. While groundwater seepage sustains conditions favorable for biofilm persistence, short-term hydraulic forcing associated with nighttime irrigation emerges as the dominant control on dry-weather bacterial loading.
These findings have important implications for stormwater management and bacterial TMDL implementation in Southern California. Because dry-weather flows occur for much of the year and storm drains discharge directly to coastal receiving waters, irrigation-driven bacterial pulses represent a continuous pathway for bacteria to reach nearshore environments. Effective management strategies must therefore consider internal storm drain processes in addition to surface source controls, particularly in groundwater-influenced systems.
This study was confined to the late summer (mid-August to mid-September), corresponding to peak dry-weather conditions characterized by high temperatures and active irrigation. Additional studies spanning other seasons are needed to evaluate how cooler temperatures, altered irrigation practices, and antecedent wet weather conditions influence biofilm development, persistence, and mobilization. Seasonal and multi-year monitoring would improve understanding of the generality of the observed mechanisms and help determine whether the dominance of biofilm stripping persists outside peak summer conditions.
Supplementary Materials
The following supporting information can be downloaded at: https://www.mdpi.com/article/10.3390/w18030396/s1, File S1: Worked Example of Three-Component End Member Mixing Calculation. Table S1: Source water average concentrations used as end members.
Author Contributions
Conceptualization, B.J.H.; methodology, B.J.H. and C.P.; formal analysis, B.J.H. and C.P.; investigation, B.J.H. and C.P.; resources, B.J.H.; data curation, B.J.H. and C.P.; writing—original draft preparation, B.J.H. and C.P.; writing—review and editing, B.J.H. and C.P.; visualization, B.J.H. and C.P.; supervision, B.J.H.; project administration, B.J.H.; funding acquisition, B.J.H. All authors have read and agreed to the published version of the manuscript.
Funding
This research was supported by an internal seed research grant at California State University—Los Angeles. Any opinions, findings, conclusions, or recommendations expressed in this material are those of the author and do not necessarily reflect the views of California State University—Los Angeles.
Data Availability Statement
The original contributions presented in this study are included in the article and Supplementary Materials. Further inquiries can be directed to the corresponding author.
Acknowledgments
Authors gratefully acknowledge the suggestions by five anonymous reviewers and the academic editors, and MDPI staff.
Conflicts of Interest
The authors declare no conflicts of interest.
References
- U.S. Environmental Protection Agency (EPA). Urban Storm Runoff and Combined Sewer Overflow Pollution; Clean Water Pollution Control Research Series No. 11024 FKM 12/71; EPA: Washington, DC, USA, 1971. [Google Scholar]
- Stein, E.D.; Tiefenthaler, L.L.; Schiff, K.C. Sources, Patterns and Mechanisms of Storm Water Pollutant Loading from Watersheds and Land Uses of the Greater Los Angeles Area, California, USA; Technical Report No. 510; Southern California Coastal Water Research Project (SCCWRP): Costa Mesa, CA, USA, 2007. [Google Scholar]
- Hibbs, B.; Sharp, J. Hydrogeological impacts of urbanization. Environ. Eng. Geosci. 2012, 18, 3–24. [Google Scholar] [CrossRef]
- City of Los Angeles Bureau of Sanitation. Stormwater Program Annual Report, Fiscal Year 2020–2021; City of Los Angeles: Los Angeles, CA, USA, 2021. [Google Scholar]
- Shapiro, N.; Ackerman, R. Before It All Goes Down the Drain: Case Studies of Rain Harvesting Use and Dry Weather Runoff Reuse in Santa Monica, CA; City of Santa Monica, Office of Sustainability and the Environment: Santa Monica, CA, USA, 2013. [Google Scholar]
- Lee, C.M.; Lin, T.Y.; Lin, C.-C.; Kohbodi, G.A.; Bhatt, A.; Lee, R.; Jay, J.A. Persistence of fecal indicator bacteria in Santa Monica Bay beach sediments. Water Res. 2006, 40, 2593–2602. [Google Scholar] [CrossRef]
- Tiefenthaler, L.L.; Stein, E.D.; Lyon, G.S. Fecal indicator bacteria levels during dry weather from southern California reference streams. Environ. Monit. Assess. 2008, 155, 477–492. [Google Scholar] [CrossRef]
- Los Angeles Regional Water Quality Control Board. Bacteria Total Maximum Daily Loads for the Los Angeles River Watershed; Los Angeles Regional Water Quality Control Board: Los Angeles, CA, USA, 2010. [Google Scholar]
- Stoodley, P.; Lewandowski, Z.; Boyle, J.D.; Lappin-Scott, H.M. The formation of migratory ripples in a mixed species bacterial biofilm growing in turbulent flow. Environ. Microbiol. 2001, 3, 447–455. [Google Scholar] [CrossRef]
- Roberts, G.S. When Bacteria Call the Storm Drain “Home”. Stormwater Solutions 2012. Available online: https://www.stormwater.com/stormwater-bmps/article/13007108/when-bacteria-call-the-storm-drain-home (accessed on 17 January 2026).
- Balzer, M.; Witt, N.; Flemming, H.-C.; Wingender, J. Faecal indicator bacteria in river biofilms. Water Sci. Technol. 2010, 61, 1105–1111. [Google Scholar] [CrossRef]
- Ahmed, W.; Zhang, Q.; Lobos, A.; Senkbeil, J.; Sadowsky, M.J.; Harwood, V.J.; Saeidi, N.; Marinoni, O.; Ishii, S. Precipitation influences pathogenic bacteria and antibiotic resistance gene abundance in storm drain outfalls in coastal sub-tropical waters. Environ. Int. 2018, 116, 308–318. [Google Scholar] [CrossRef]
- Shanks, O.C.; Diedrich, A.; Sivaganesan, M.; Willis, J.R.; Sharifi, A. Quantitative fecal source characterization of urban municipal storm sewer system outfall ‘wet’ and ‘dry’ weather discharges. Water Res. 2024, 259, 121857. [Google Scholar] [CrossRef] [PubMed]
- Kuepper, K. Isotopic and Hydrochemical Identification of Source Waters and Effects of Seasonal Changes on Dry-Weather Stream Flows, Santa Monica Mountains, California. Master’s Thesis, California State University, Los Angeles, CA, USA, 2013. [Google Scholar]
- Hibbs, B.; Harrison, M.; Merino, M. Issues of stream–aquifer interactions in grout-lined channels in urban watersheds. J. Contemp. Water Res. Educ. 2016, 159, 127–143. [Google Scholar] [CrossRef]
- Peralta, C. Comparison of Bacteria and Nutrient Loading in Subsurface Storm Drains Receiving Flows from Groundwater Seepage and Dry-Weather Urban Runoff. Master’s Thesis, California State University, Los Angeles, CA, USA, 2024. [Google Scholar]
- Meixner, T.; Hibbs, B.; Sjolin, J.; Walker, J. Sources of Selenium, Arsenic, and Nutrients In the Newport Bay Watershed; Technical Report prepared for the California State Water Resources Control Board; University of California, Riverside and California State University: Los Angeles, CA, USA, 2004; 129p. [Google Scholar]
- Hibbs, B.; Merino, M.; Andrus, R. Sources and distribution of selenium and arsenic in shallow groundwater: San Diego Creek watershed. In Selenium, Nitrate, and Other Constituents in San Diego Creek and Newport Bay Watersheds, 2004–2008; California State University, Los Angeles: Los Angeles, CA, USA, 2008. [Google Scholar]
- Harrison, M. Isotopic and Hydrochemical Identification of Source Waters and Pollutants In the Malibu Creek Watershed, California. Master’s Thesis, California State University, Los Angeles, CA, USA, 2016. [Google Scholar]
- Korajkic, A.; Wanjugi, P.; Brooks, L.; Cao, Y.; Harwood, V.J. Persistence and decay of fecal microbiota in aquatic habitats. Microbiol. Mol. Biol. Rev. 2019, 83, e00005-19. [Google Scholar] [CrossRef] [PubMed]
- Badgley, B.D.; Nayak, B.S.; Harwood, V.J. The importance of sediment and submerged aquatic vegetation as potential habitats for persistent strains of enterococci in a subtropical watershed. Water Res. 2010, 44, 5857–5866. [Google Scholar] [CrossRef]
- Grinberg, M.; Orevi, T.; Steinberg, S.; Kashtan, N. Bacterial survival in microscopic surface wetness. eLife 2019, 8, e48508. [Google Scholar] [CrossRef]
- Characklis, W.G.; Marshall, K.C. (Eds.) Biofilms (Environmental and Applied Microbiology Series); John Wiley & Sons: New York, NY, USA, 1990. [Google Scholar]
- Battin, T.J.; Besemer, K.; Bengtsson, M.M.; Romani, A.M.; Packmann, A.I. The ecology and biogeochemistry of stream biofilms. Nat. Rev. Microbiol. 2016, 14, 251–263. [Google Scholar] [CrossRef]
- Yang, Z.; Gao, J.; Zheng, L.; Wang, Z.; Li, C.; Li, Q.; Tan, Q.; Hong, N. Probing the microbiome in stormwater pipeline sediments: Co-occurrence patterns and novel functionalities. Curr. Res. Biotechnol. 2024, 7, 100199. [Google Scholar] [CrossRef]
- Badgley, B.D.; Thomas, F.I.M.; Harwood, V.J. The effects of submerged aquatic vegetation on the persistence of environmental populations of Enterococcus spp. Environ. Microbiol. 2010, 12, 1271–1282. [Google Scholar] [CrossRef]
- Mills, M.; Davis, A.; Lancaster, E.; Choi, B.; Martin, J.; Winston, R.; Lee, J. Longitudinal analysis of urban stormwater microbiome and resistome. Water Res. 2024, 259, 121873. [Google Scholar] [CrossRef]
- Bay, S.; Jones, B.H.; Schiff, K.; Washburn, L. Water quality impacts of stormwater discharges to Santa Monica Bay. Mar. Environ. Res. 2003, 56, 205–223. [Google Scholar] [CrossRef] [PubMed]
- State Water Resources Control Board. California Ocean Plan: Water Quality Control Plan for Ocean Waters of California; State Water Resources Control Board: Sacramento, CA, USA, 2019. Available online: https://www.waterboards.ca.gov (accessed on 12 December 2025).
- Müller, A.; Österlund, H.; Marsalek, J.; Viklander, M. The pollution conveyed by urban runoff: A review of sources. Sci. Total Environ. 2020, 709, 136125. [Google Scholar] [CrossRef] [PubMed]
- Cojoc, L.; de Castro-Català, N.; de Guzmán, I.; González, J.; Arroita, M.; Besolí-Mestres, N.; Cadena, I.; Freixa, A.; Gutiérrez, O.; Larrañaga, A.; et al. Pollutants in urban runoff: Scientific evidence on toxicity and impacts on freshwater ecosystems. Chemosphere 2024, 369, 143806. [Google Scholar] [CrossRef]
- Långmark, J.; Storey, M.V.; Ashbolt, N.J.; Stenström, T.-A. The effects of UV disinfection on distribution pipe biofilm growth and pathogen incidence within the greater Stockholm area, Sweden. Water Res. 2007, 41, 3327–3336. [Google Scholar] [CrossRef] [PubMed]
- Sabater, S.; Guasch, H.; Ricart, M.; Romaní, A.; Vidal, G.; Klünder, C.; Schmitt-Jansen, M. Monitoring the effect of chemicals on biological communities: The biofilm as an interface. Anal. Bioanal. Chem. 2007, 387, 1425–1434. [Google Scholar] [CrossRef]
- Izma, G.; Raby, M.; Ijzerman, M.; Prosser, R.; Helm, P.; Renaud, J.; Sumarah, M.; McIsaac, D.; Rooney, R. An urban stormwater contaminant signature: Defining priority contaminants for urban stormwater research. Water Environ. Res. 2025, 97, e70150. [Google Scholar] [CrossRef]
- Besolí-Mestres, N.; Freixa, A.; Cojoc, L.; Cadena-Aizaga, M.I.; Petrovic, M.; Sabater, S. Impacts of urban runoff pollutants on biofilm communities. Environ. Chem. Ecotoxicol. 2026, 8, 720–728. [Google Scholar] [CrossRef]
- Kaksonen, A.H.; Wylie, J.; Morgan, M.J.; Walsh, T.; Tjandraatmadja, G.; Barry, K.; Gonzalez, D.; Goodman, N.; Vanderzalm, J.; Dillon, P.; et al. Impact of stormwater on biofilm density and microbial community composition in water distribution networks. Water Res. 2025, 272, 122989. [Google Scholar] [CrossRef]
- Burkhart, T.H. Biofilms as Sources of Fecal Bacteria Contamination in the Stormwater Drainage System in Singapore. Master’s Thesis, Massachusetts Institute of Technology, Cambridge, MA, USA, 2013. [Google Scholar]
- Goodwin, K.D.; Schriewer, A.; Jirik, A.; Curtis, K.; Crumpacker, A.L. Consideration of natural sources in a bacteria TMDL—Lines of evidence, including beach microbial source tracking. Environ. Sci. Technol. 2017, 51, 7775–7784. [Google Scholar] [CrossRef]
- Buchanan, T.J.; Somers, W.P. Discharge Measurements at Gaging Stations; Techniques of Water-Resources Investigations, Book 3, Chapter A8; U.S. Geological Survey (USGS): Reston, VA, USA, 1969; 65p. [Google Scholar]
- Turnipseed, D.P.; Sauer, V.B. Discharge Measurements at Gaging Stations; U.S. Geological Survey Techniques and Methods, Book 3, Chapter A8; U.S. Geological Survey: Reston, VA, USA, 2010; 87p. [Google Scholar]
- U.S. Environmental Protection Agency. Method 375.4: Sulfate, Turbidimetric. In Methods for Chemical Analysis of Water and Wastes; EPA-600/4-79-020; Environmental Monitoring and Support Laboratory: Cincinnati, OH, USA, 1979. [Google Scholar]
- U.S. Environmental Protection Agency. Method 9251: Chloride (Colorimetric, Automated Ferricyanide AAII). In Test Methods for Evaluating Solid Waste (SW-846); U.S. Environmental Protection Agency: Washington, DC, USA, 1986. [Google Scholar]
- U.S. Environmental Protection Agency. Method 353.2: Determination of Nitrate-Nitrogen by Automated Colorimetry. In Methods for Chemical Analysis of Water and Wastes; EPA-600/4-79-020; Environmental Monitoring and Support Laboratory: Cincinnati, OH, USA, 1993. [Google Scholar]
- U.S. Environmental Protection Agency. Method 350.1: Determination of Ammonia Nitrogen by Semi-Automated Colorimetry. In Methods for Chemical Analysis of Water and Wastes; EPA-600/4-79-020; Environmental Monitoring and Support Laboratory: Cincinnati, OH, USA, 1978. [Google Scholar]
- U.S. Environmental Protection Agency. Method 365.1: Determination of Phosphorus by Semi-Automated Colorimetry. In Methods for Chemical Analysis of Water and Wastes; EPA-600/4-79-020; Environmental Monitoring and Support Laboratory: Cincinnati, OH, USA, 1978. [Google Scholar]
- Demeter, G. Hydrogeochemistry of the Santa Monica Mountains Groundwater Basin. Master’s Thesis, California State University, Los Angeles, CA, USA, 2016. [Google Scholar]
- Coplen, T.B. Reporting of stable hydrogen, carbon, and oxygen isotopic abundances. Pure Appl. Chem. 1994, 66, 273–276. [Google Scholar] [CrossRef]
- Eastoe, C.J.; Dettman, D.L. Isotope amount effects in hydrologic and climate reconstructions of monsoon climates: Implications of some long-term data sets for precipitation. Chem. Geol. 2016, 430, 78–89. [Google Scholar] [CrossRef]
- American Public Health Association; American Water Works Association; Water Environment Federation. Standard Methods for the Examination of Water and Wastewater, 24th ed.; Includes Method 9223 B for Enzyme Substrate Coliform/E. coli Testing and Related Multi-Well Most Probable Number (MPN) Enumeration Procedures; APHA: Washington, DC, USA, 2023. [Google Scholar]
- Montana Department of Environmental Quality (DEQ). Standard Operating Procedure: Sample Collection, Handling, and Analysis of Escherichia coli; WQPBWQM-014, Version 2.0; Water Quality Planning Bureau: Helena, MT, USA, 2020. [Google Scholar]
- Craig, H. Isotopic variations in meteoric waters. Science 1961, 133, 1702–1703. [Google Scholar] [CrossRef]
- Craig, H. Standard for reporting concentrations of deuterium and oxygen-18 in natural waters. Science 1961, 133, 1833–1834. [Google Scholar] [CrossRef]
- Hibbs, B.; Demeter, G.; Ramirez, S. Geochemical drivers of elevated sulfate in California coastal basins: Evolution from marine sediments to watersheds and aquifers. J. Am. Water Resour. Assoc. 2025, 61, e70067. [Google Scholar] [CrossRef]
- Orton, R. Geology, water quality, and aquatic life in the Malibu Creek watershed, California. In Proceedings of the Pacific Section AAPG, SEG and SEPM Joint Technical Conference, Oxnard, CA, USA, 3–5 May 2015. [Google Scholar]
- Hibbs, B.; Merino, M.; Andrus, R.; Hu, W.; Doro-On, A. Groundwater baseflow sourced from Miocene rocks and residuals carries elevated selenium into southern California streams. In Great Rivers; Starrett, S., Ed.; American Society of Civil Engineers: Reston, VA, USA, 2009; pp. 1919–1928. [Google Scholar]
- Dirckx, P. Biofilm Life Cycle and Structure; Center for Biofilm Engineering, Montana State University: Bozeman, MT, USA, 2003. [Google Scholar]
- Schultz-Fademrecht, C.; Wichern, M.; Horn, H. The impact of sunlight on inactivation of indicator microorganisms both in river water and benthic biofilms. Water Res. 2008, 42, 4771–4779. [Google Scholar] [CrossRef] [PubMed]
- Karačić, S.; Modin, O.; Hagelia, P.; Persson, F.; Wilén, B.-M. The effect of time and surface type on the composition of biofilm communities on concrete exposed to seawater. Int. Biodeterior. Biodegrad. 2022, 173, 105458. [Google Scholar] [CrossRef]


Disclaimer/Publisher’s Note: The statements, opinions and data contained in all publications are solely those of the individual author(s) and contributor(s) and not of MDPI and/or the editor(s). MDPI and/or the editor(s) disclaim responsibility for any injury to people or property resulting from any ideas, methods, instructions or products referred to in the content. |
© 2026 by the authors. Licensee MDPI, Basel, Switzerland. This article is an open access article distributed under the terms and conditions of the Creative Commons Attribution (CC BY) license.